Embed Size (px)
Citation preview

The Microeconomic Strategy Project
A baseline assessment of the fishing and aquaculture industry
in the Western Cape
August 2004
Mohammed Karaan
Sanri Rossouw
Department of Agricultural Economics
Stellenbosch University

1
SUMMARY
The total value of the South African fishing industry amounted to R2.78 billion in 1999 and the
Western Cape accounted for about 90% of the industry. Demersal trawl contributes almost 50% to
the total value of the industry. The Western Cape exported fish with a total value of R2 418.4
million, representing 8.5% of total Western Cape exports and 73% of total South African fish
exports.
The South African fishing industry employs 38 311 people of which 90% are Black. The Western
Cape employs approximately 70% of the workers and about 71% of the gross remuneration is
earned in the Western Cape. The majority (90.6%) of workers in the fishing industry in the
commercial harbour towns of the Western Cape are Black. 76% of the Black workers are semi-
skilled.
Transformation in the fishing industry is primarily the result of a change in the number and size of
fishing rights allocated. Some 2 625 rights (or quotas) were allocated in 2001, of which at least 2
000 qualify as SMME’s. The Department of Environmental Affairs and Tourism estimates that an
average of 60% are majority PDI-owned (majority pdi-owned means 51% or more of the company
is owned by pdi’s). This large number of rights allocated to pdi’s or companies owned and
managed by pdi’s, resulted in a large increase in the flow of income to impoverished fishing
communities.
2
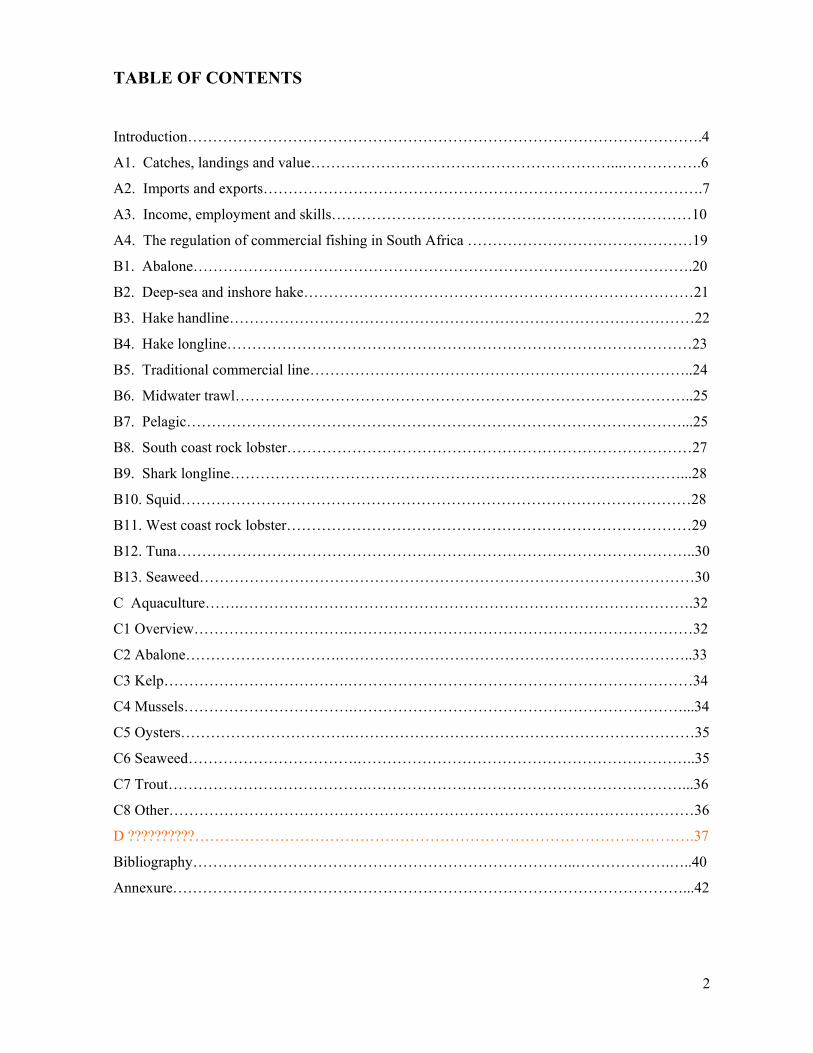
TABLE OF CONTENTS
Introduction………………………………………………………………………………………….4
A1. Catches, landings and value……………………………………………………...…………….6
A2. Imports and exports…………………………………………………………………………….7
A3. Income, employment and skills………………………………………………………………10
A4. The regulation of commercial fishing in South Africa ………………………………………19
B1. Abalone……………………………………………………………………………………….20
B2. Deep-sea and inshore hake……………………………………………………………………21
B3. Hake handline…………………………………………………………………………………22
B4. Hake longline…………………………………………………………………………………23
B5. Traditional commercial line…………………………………………………………………..24
B6. Midwater trawl………………………………………………………………………………..25
B7. Pelagic………………………………………………………………………………………...25
B8. South coast rock lobster………………………………………………………………………27
B9. Shark longline………………………………………………………………………………...28
B10. Squid…………………………………………………………………………………………28
B11. West coast rock lobster………………………………………………………………………29
B12. Tuna…………………………………………………………………………………………..30
B13. Seaweed………………………………………………………………………………………30
C Aquaculture…….……………………………………………………………………………….32
C1 Overview………………………….……………………………………………………………32
C2 Abalone………………………….……………………………………………………………..33
C3 Kelp……………………………….……………………………………………………………34
C4 Mussels…………………………….…………………………………………………………...34
C5 Oysters…………………………….……………………………………………………………35
C6 Seaweed…………………………….…………………………………………………………..35
C7 Trout………………………………….………………………………………………………...36
C8 Other……………………………………………………………………………………………36
D ??????????……………………………………………………………………………………….37
Bibliography…………………………………………………………………..……………….…..40
Annexure…………………………………………………………………………………………...42

3
LIST OF ABBREVIATIONS CAF Consultative Advisory Forum
ESS An Economic and Sectoral Study of the South Africa fishing industry
ICCAT International Commission for the Conservation of Atlantic Tunas
JSE Johannesburg Stock Exchange
MCM Marine and Coastal Management
MLRA Marine Living Resources Act
PDI Previously Disadvantaged Individuals
TAC Total Allowable Catch
TAE Total Applied Effort

4
INTRODUCTION
The value of the South African fishing industry was about R2.78 billion in 1999, and the Western
Cape accounts for some 90% of the industry. Fishing activity in the Western Cape is centered
predominantly along the West coast, that is from Simons Town to Saldanha. After fruit and wine,
beer and spirits, fish is the largest export product of the Western Cape with a total value of R2
418,4 million in 2002, representing 8.5% of total Western Cape exports. (Wesgro)
Besides the responsibility to ensure the sustainable utilisation of the living marine resources, the
government also needs to address the prevailing inequalities and dualism. The initial attempt of
intervention by allocating fishing rights to smaller, mostly black entrants at the cost of larger
historically white companies, resulted in many problems and legal challenges. Despite these
problems, the allocation of fishing rights are quite successful in empowering previously
disadvantaged individuals (pdi’s). Only 300 white-owned companies participated in the
commercial fishing industry during apartheid. Over the past three years rights were granted to 5
837 individuals and companies. Some 2 625 rights (or quotas) have been allocated in 2001, of
which at least 2 000 qualify as SMME’s. The Department of Environmental Affairs and Tourism
(hereafter referred to as the Department) estimates that an average of 60% are majority HDI owned
(majority hdi-owned means 51% or more of the company is owned by pdi’s). (Kleinschmidt,
2003). This large number of rights allocated to pdi’s or companies owned and managed by pdi’s,
resulted in a large increase in the flow of income to impoverished fishing communities. Also, the
allocation of rights to so many entities was achieved without compromising the long-term
sustainability of marine resources. (Transformation and the South African Fishing Industry, 2003)
Despite the significant progress made with transformation in the fishing industry, there is still
some way to go, especially considering the employment, income, skills distribution, and
livelihoods. This report describes the current status of the fishing industry, focusing on the
Western Cape, to provide a background for policy formulation.
No primary research was done for this report, but numerous secondary sources were consulted.
The most important source is a study by Rhodes University on behalf of MCM called “An
Economic and Sectoral Study of the South African Fishing Industry” (hereafter the ESS Report).

5
The report consist of three parts. Part A discusses general features of the fishing industry. Section
A2 provides statistics on catches, landings and values of the South African fishing industry and
section A3 discusses the trade statistics. Section A4 discusses employment and income statistics
for the country and the socio-economic contribution the fishing industry makes to commercial
harbour towns in the Western Cape. It also looks at different measures of transformation. Section
A5 briefly discusses the regulatory environment of the fishing industry. Part B provides a short
summary of the major fisheries active in the Western Cape. The fisheries discussed include
abalone, deep-sea and inshore hake trawl, hake handline, hake longline, traditional commercial
line fishery, midwater trawl fishery, pelagic, south coast rock lobster, shark longline, squid, west
coast rock lobster, tuna, seaweed and aquaculture. This section is largely a summary of the second
volume of the ESS Report. Section C provides and overview of the aquaculture industry in South
Africa with specific reference to abalone, kelp, mussels, oysters, seaweed, trout and eels.

6
PART A - INDUSTRY BACKGROUND
A1. Catches, landings and value1 Figures A1.1 and A1.2 show South African catches for the major fishery types: demersal, pelagic,
rock lobster, and line and small nets2. Total catch depends on the total allowable catch (TAC) or
total applied effort (TAE) determined for a specie or the abundance of the specie in the case where
no TAC/TAE is applicable. The TAC/TAE is determined after discussions between scientists who
conduct annual surveys to determine the stock levels, the government and various stakeholders in
the industry.
Figure A1.1: South Africa catches for the demersal and pelagic industries (tons nominal mass)
Source: Fishing Industry Handbook, 2003
Figure A1.2: South Africa catches for rock lobsters and line and small net industries (tons nominal mass)
Source: Fishing Industry Handbook, 2003 1 Source: Fishing Industry Handbook, 2003 2 Line and small net include species such as mullet, tuna, snoek, yellowtail and squid. See the annexure for a detailed table on South African catches.
0
100000
200000
300000
400000
500000
600000
700000
800000
1958
1968
1978
1988
1989
1990
1991
1992
1993
1994
1995
1996
1997
1998
1999
Mas
s (T
ons)
Demersal Pelagic
0
5000
10000
15000
20000
25000
30000
35000
1958
1968
1978
1988
1989
1990
1991
1992
1993
1994
1995
1996
1997
1998
1999
Mas
s (T
ons)
Rock Lobster* Line, small net

7
Table A1.1 provides information on South African catches, landings and value in 1999. The total
value of the South African fishing industry was R2.78 billion in 1999 and accounted for about
0.5% of total world production (Wesgro). Demersal trawl contributes almost 50% to the value of
the industry, followed by pelagic (19.5%) and line fish (11.4%). Oysters is the smallest industry
contributing less than 0.05% to the total value of the fishing industry.
In terms of mass almost 70% of landings is pelagic, but it contributes only 19.5% to the total value.
Demersal trawl contributes almost 50% to total value, but represents only 22.3% of total landings.
Fishery Catch Landings Value % of total
value (tons) (tons) (R'000)
Demersal: Offshore trawl 157 449 110 526 1 271 049 45.7 Demersal: Inshore trawl 15 150 10 492 86 873 3.1 Total demersal trawl 172 599 121 018 1 357 922 48.8 Purse Seine (Pelagic) 375 370 375 370 541 699 19.5 SC rock lobster 920 428 111 217 4 WC rock lobster 1 791 1 791 187 799 6.8 Crustacean Trawl 433 433 15 918 0.6 Line fish 24 094 24 094 316 701 11.4 Demersal longlining 7 273 6 611 85 659 3.1 Abalone 482 482 77 120 2.8 Miscellaneous 6 891 6 891 28 997 1 Oysters 55 55 1 342 0 Mariculture 2 631 2 631 47 134 1.7 Seaweed 2 202 2 202 10 425 0.4 Total 594 741 542 006 2 781 933 100 Table A1.1: South African catches, landings and values: 1999
Source: Fishing Industry Handbook, 2003
The Western Cape accounts for about 90% of the South African fishing industry (Wesgro).
A2. Imports and exports South Africa is a net-exporter of fish products and the main export destinations include European
countries like France, Germany and Belgium, African states like Angola, Zimbabwe and
Mozambique, and Canada, Australia, Hong Kong, Singapore and Taiwan (Wesgro).

8
Figure A2.1: South Africa fish trade in mass: 1999-2002
Source: Fishing Industry Handbook, 2003
Figure A2.2: South Africa fish trade in rands: 1999-2000
Source: Fishing Industry Handbook, 2003
South Africa imported fish with a total value of R496 million in 2002 and exported R3.3 billion.
Figure A2.2 indicates a clear upward trend in the value of exports, but this sharp increase may
largely be due to the weakening of the rand during that time. Figure A2.1 also shows an increasing
trend in the mass of fish exports, but not to the same extent as the growth in value (see figure
A2.2). Table A2.1 illustrates this point. The mass of fish exports increased with only 2% in 2001,
but the value increased with 30%. Also, the mass increased with only 8% in 2002, but the value
increased with 36%.
0
20
40
60
80
100
120
140
160
180
1999 2000 2001 2002
Mill
ions
Mas
s (k
g)
Import Export
0
500
1000
1500
2000
2500
3000
3500
1999 2000 2001 2002
Mill
ions
Ran
ds
Import Export
9
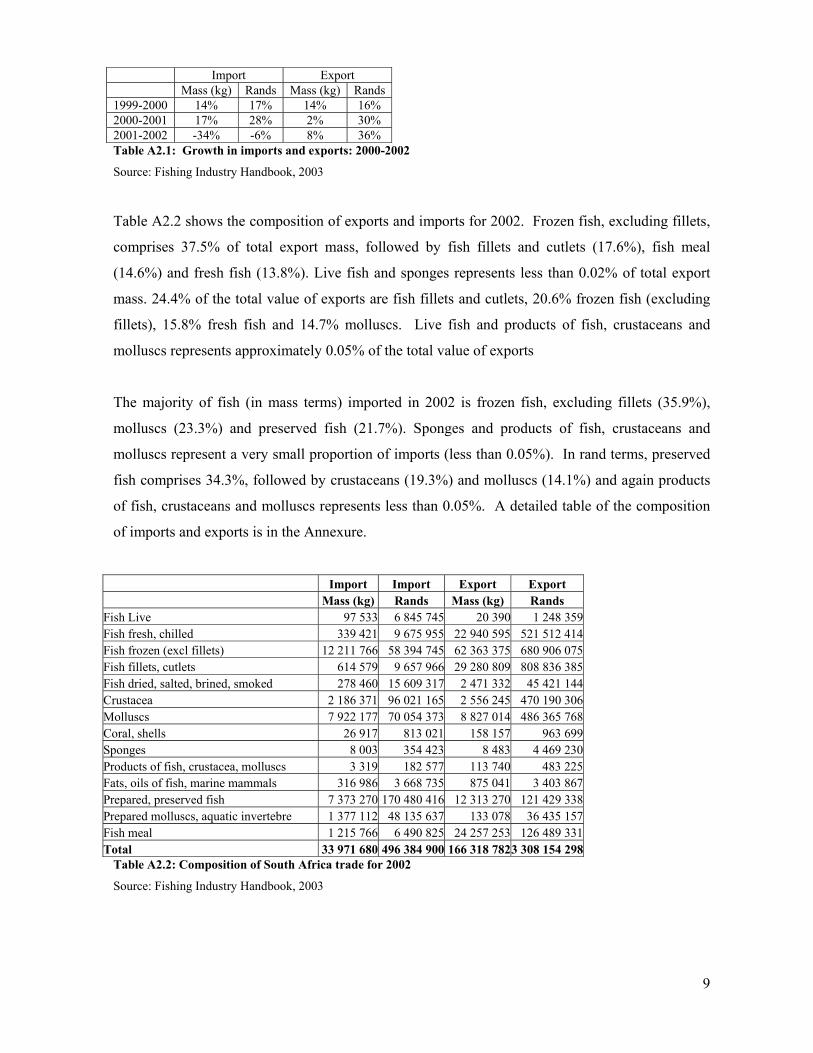
Import Export Mass (kg) Rands Mass (kg) Rands 1999-2000 14% 17% 14% 16% 2000-2001 17% 28% 2% 30% 2001-2002 -34% -6% 8% 36% Table A2.1: Growth in imports and exports: 2000-2002
Source: Fishing Industry Handbook, 2003
Table A2.2 shows the composition of exports and imports for 2002. Frozen fish, excluding fillets,
comprises 37.5% of total export mass, followed by fish fillets and cutlets (17.6%), fish meal
(14.6%) and fresh fish (13.8%). Live fish and sponges represents less than 0.02% of total export
mass. 24.4% of the total value of exports are fish fillets and cutlets, 20.6% frozen fish (excluding
fillets), 15.8% fresh fish and 14.7% molluscs. Live fish and products of fish, crustaceans and
molluscs represents approximately 0.05% of the total value of exports
The majority of fish (in mass terms) imported in 2002 is frozen fish, excluding fillets (35.9%),
molluscs (23.3%) and preserved fish (21.7%). Sponges and products of fish, crustaceans and
molluscs represent a very small proportion of imports (less than 0.05%). In rand terms, preserved
fish comprises 34.3%, followed by crustaceans (19.3%) and molluscs (14.1%) and again products
of fish, crustaceans and molluscs represents less than 0.05%. A detailed table of the composition
of imports and exports is in the Annexure.
Import Import Export Export Mass (kg) Rands Mass (kg) Rands Fish Live 97 533 6 845 745 20 390 1 248 359 Fish fresh, chilled 339 421 9 675 955 22 940 595 521 512 414 Fish frozen (excl fillets) 12 211 766 58 394 745 62 363 375 680 906 075 Fish fillets, cutlets 614 579 9 657 966 29 280 809 808 836 385 Fish dried, salted, brined, smoked 278 460 15 609 317 2 471 332 45 421 144 Crustacea 2 186 371 96 021 165 2 556 245 470 190 306 Molluscs 7 922 177 70 054 373 8 827 014 486 365 768 Coral, shells 26 917 813 021 158 157 963 699 Sponges 8 003 354 423 8 483 4 469 230 Products of fish, crustacea, molluscs 3 319 182 577 113 740 483 225 Fats, oils of fish, marine mammals 316 986 3 668 735 875 041 3 403 867 Prepared, preserved fish 7 373 270 170 480 416 12 313 270 121 429 338 Prepared molluscs, aquatic invertebre 1 377 112 48 135 637 133 078 36 435 157 Fish meal 1 215 766 6 490 825 24 257 253 126 489 331 Total 33 971 680 496 384 900 166 318 7823 308 154 298
Table A2.2: Composition of South Africa trade for 2002
Source: Fishing Industry Handbook, 2003

10
Fish products is the third largest export product of the Western Cape with a total value of R2 418,4
million, representing 8.5% of total Western Cape exports. (Wesgro)
A3. Income, employment and skills The Western Cape employs approximately 70% of the workers in the fishing industry and
approximately 71% of the employment income (gross remuneration) in the fishing industry is
earned in the Western Cape (see figures A3.1 and A3.2).
Figure A3.1: Total fishing industry employment Figure A3.2: Total fishing industry income
distribution between provinces distribution between provinces
Source: ESS Report (1), 2003 Source: ESS Report (1), 2003
The South African fishing industry employs 38 311 people, of which 90% are Black. Figure A3.3
shows the number of people for each race group, level of skills and sector within the fishing
industry. The majority of workers are semi-skilled and Black.
Figure A3.4 shows the percentage of black workers in each sector and the different levels of skills.
There is a clear relationship between the level of skills and the percentage of Black employees: the
higher the skill level the lower is the proportion of Black employees. For example, only 49.6% of
professionals or managers are Black whereas 98% of the unskilled workers are Black.
KZN2%
WC70%
NC1%
EC12%
Unspecified
15%KZN2%
WC71%
NC1%
EC11%
Unspecified
15%

11
Figure A3.3: The number of people employed in the South African fishing industry by race, by sector and by
skills level.
Source: ESS Report (1), 2003
Figure A3.4: The percentage black employment in the South African fishing industry by race, by sector and by
skills level
Source: ESS Report (1), 2003
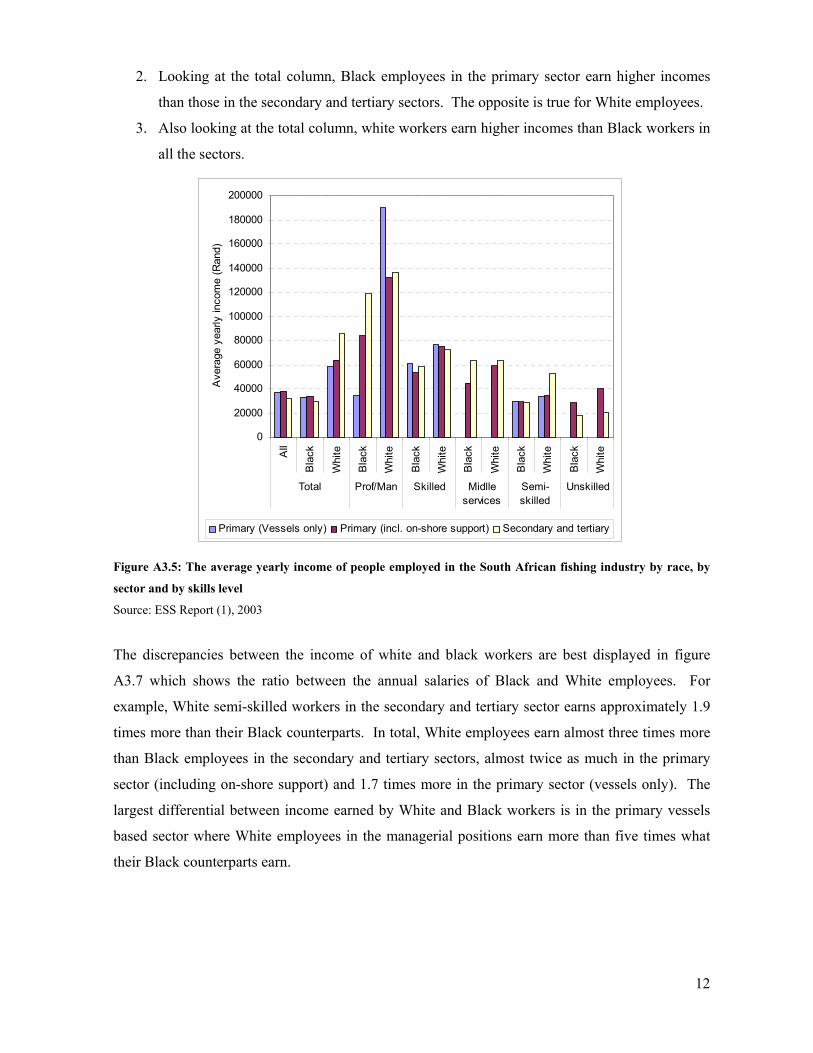
Figure A3.5 shows the average yearly income of people employed in the South African fishing
industry by race, by sector and by skills level. The following points are of importance:
1. Employees in the professional and managerial positions earn the highest average yearly
income, and as the skill level drops, the income earned also decline.
0
10
20
30
40
50
60
70
80
90
100
% Black employment
Primary 52.2 64.8 62.8 92.1 96
Secondary and tertiary 46.5 68 77.2 98.5 98.6
Fishing industry 49.6 65.1 71.9 94.5 98
Prof/Man Skilled Middle services
Semi-skilled
Unskilled
72 3
1377
1068
9769
828
218
200
2279
1237
155
92
1106
8
954
624
26160
184
193
91 328
97
7331
115
5343
34
0
2000
4000
6000
8000
10000
12000
Black White Black White Black White Black White Black White
Professional Skilled Middle services Semi-skilled Unskilled
Num
ber o
f peo
ple
empl
oyed
Primary (Vessels only) Primary (incl. on-shore support) Secondary and tertiary
12
2. Looking at the total column, Black employees in the primary sector earn higher incomes
than those in the secondary and tertiary sectors. The opposite is true for White employees.
3. Also looking at the total column, white workers earn higher incomes than Black workers in
all the sectors.
Figure A3.5: The average yearly income of people employed in the South African fishing industry by race, by
sector and by skills level
Source: ESS Report (1), 2003
The discrepancies between the income of white and black workers are best displayed in figure
A3.7 which shows the ratio between the annual salaries of Black and White employees. For
example, White semi-skilled workers in the secondary and tertiary sector earns approximately 1.9
times more than their Black counterparts. In total, White employees earn almost three times more
than Black employees in the secondary and tertiary sectors, almost twice as much in the primary
sector (including on-shore support) and 1.7 times more in the primary sector (vessels only). The
largest differential between income earned by White and Black workers is in the primary vessels
based sector where White employees in the managerial positions earn more than five times what
their Black counterparts earn.
0
20000
40000
60000
80000
100000
120000
140000
160000
180000
200000
All
Bla
ck
Whi
te
Bla
ck
Whi
te
Bla
ck
Whi
te
Bla
ck
Whi
te
Bla
ck
Whi
te
Bla
ck
Whi
te
Total Prof/Man Skilled Midlleservices
Semi-skilled
Unskilled
Ave
rage
yea
rly in
com
e (R
and)
Primary (Vessels only) Primary (incl. on-shore support) Secondary and tertiary

13
Figure A3.7: Ratio of White annual income to black annual income by sector and skills level.
Source: ESS Report (1), 2003
The discrepancy between the income earned by Black and White employees are true for all the
provinces as is indicated by figure A3.6. The Eastern Cape and Western Cape has the largest
differentials between Black and White earners. This does not necessarily imply greater
discrimination within these provinces, as the difference in income may be due to the skew skills
distribution. The figure also indicates that people in the Western Cape and KwaZulu-Natal earn
higher incomes than those in the Eastern Cape and Northern Cape.
0.0
1.0
2.0
3.0
4.0
5.0
6.0
Whi
te in
com
e : B
lack
inco
me
Primary (Vessels only) 1.7 5.5 1.3 1.2
Primary (incl. on-shoresupport)
1.9 1.6 1.4 1.3 1.2 1.4
Secondary and tertiary 2.9 1.2 1.2 1.0 1.9 1.1
Total Prof/Man Skilled Middle Services
Semi-skilled
Unskilled

14
Figure A3.6: Scatter plot of Black, White and aggregated yearly fishing industry incomes per province
Source: ESS Report (1), 2003
Socio-economic
The total population of the harbour towns in the Western Cape is 400 034 people of which 38.2%
are employed. (The extended labour force is 64.5% of the total population). The population
distribution in the harbour towns is 70.8% Black, 27.7% White and 1.5% unspecified. The
employment rates for Black and White people are 36% and 42.3% respectively.
Figure A3.7 shows the contribution the fishing industry makes to employment in the harbour
towns. The fishing industry employs 17.8% of all Black people employed and 2.2% of all White
people employed.
WC
NC
KZNEC
Unsp SAWC
NC
KZN ECUnsp SA
WC
NC
KZN
EC
Unsp
SA
0
10000
20000
30000
40000
50000
60000
70000
Ave
rage
Inco
me
All Black White

15
Figure A3.7: The number of people employed in the fishing industry and other industries in the commercial
harbour towns of the Western Cape
Source: ESS Report, 2003
Figure A3.8 shows the number of White and Black people for each level of skills employed in the
commercial harbour towns of the Western Cape. 14 414 of the 15 903 people (90.6%) employed
in the fishing industry in the harbour towns of the Western Cape are Black, and the remaining
9.4% are White. 10 935 (75.9%) of the Black people are semi-skilled and just over 1% are in
management positions. 630 (42.3%) of the White people are semi-skilled, 650 (43.7%) are skilled
and 9.4% are in management positions.
Figure A3.8: Number of people employed in the fishing industry in the commercial harbour towns in the
Western Cape by race and by skills level
Source: ESS Report (1), 2003
0
2000
4000
6000
8000
10000
12000
Num
ber o
f peo
ple
empl
oyed
Black 158 975 275 10935 2071
White 140 650 63 630 6
Professional Skilled Middle skilled Semi-skilled Unskilled
0
10000
20000
30000
40000
50000
60000
70000
80000
90000
Num
ber o
f peo
ple
empl
oyed
Fishing industry 14414 1489
Other 66771 65836 8066
Black White Unspecified
16
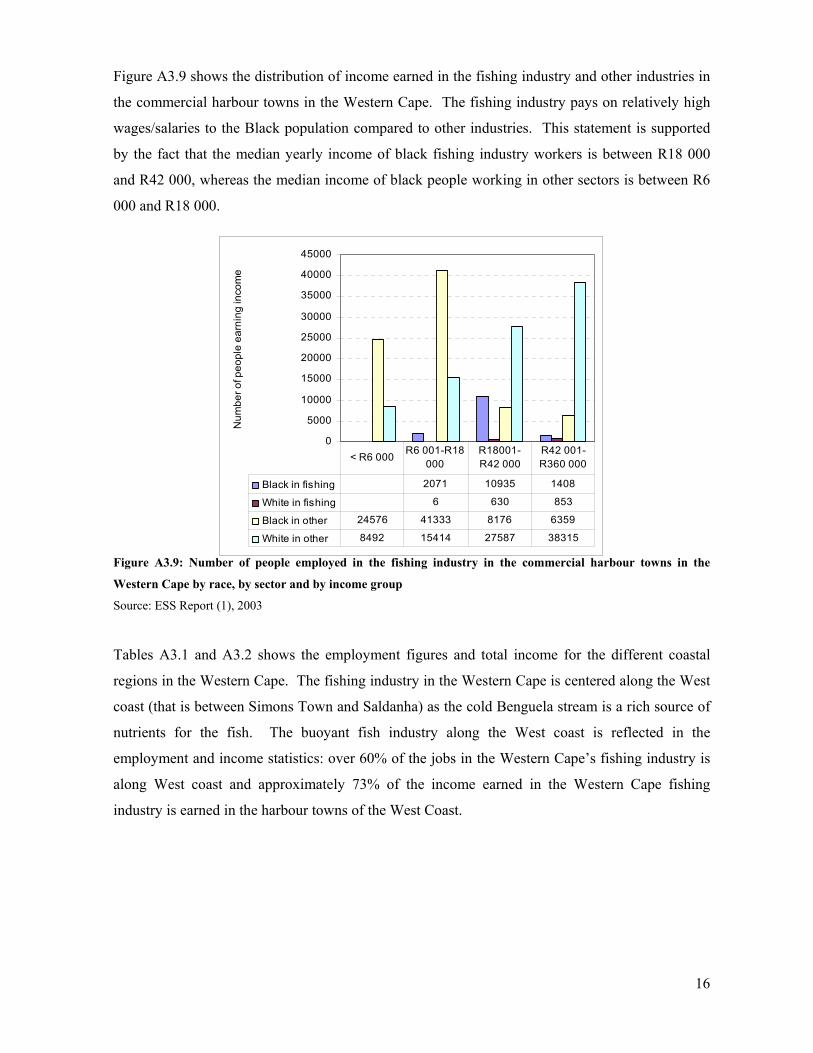
Figure A3.9 shows the distribution of income earned in the fishing industry and other industries in
the commercial harbour towns in the Western Cape. The fishing industry pays on relatively high
wages/salaries to the Black population compared to other industries. This statement is supported
by the fact that the median yearly income of black fishing industry workers is between R18 000
and R42 000, whereas the median income of black people working in other sectors is between R6
000 and R18 000.
Figure A3.9: Number of people employed in the fishing industry in the commercial harbour towns in the
Western Cape by race, by sector and by income group
Source: ESS Report (1), 2003
Tables A3.1 and A3.2 shows the employment figures and total income for the different coastal
regions in the Western Cape. The fishing industry in the Western Cape is centered along the West
coast (that is between Simons Town and Saldanha) as the cold Benguela stream is a rich source of
nutrients for the fish. The buoyant fish industry along the West coast is reflected in the
employment and income statistics: over 60% of the jobs in the Western Cape’s fishing industry is
along West coast and approximately 73% of the income earned in the Western Cape fishing
industry is earned in the harbour towns of the West Coast.
0
5000
10000
15000
20000
25000
30000
35000
40000
45000N
umbe
r of p
eopl
e ea
rnin
g in
com
e
Black in fishing 2071 10935 1408
White in fishing 6 630 853
Black in other 24576 41333 8176 6359
White in other 8492 15414 27587 38315
< R6 000R6 001-R18
000R18001-R42 000
R42 001-R360 000

17
Total Professional Skilled Middle skilled Semi-skilled Unskilled All Black White Full-time Part-timeFull-timePart-timeFull-timePart-timeFull-time Part-timeFull-timePart-time Bl Wh Bl Wh Bl Wh Bl Wh Bl Wh Bl Wh Bl Wh Bl Wh Bl Wh Bl WhWestern Cape 15 903 14 414 1 489 143 138 15 2 759 401 216 249 271 63 4 6 3512944 584336 989 21 082 4-North west coast 3 864 3 768 96 20 25 3 2 123 30 17 93 16 3 721 111 967 10 446 1 375 1-West coast 9 612 8 656 956 111 92 12 492 234 185 240 157 31 1 4 5611321 991223 449 1 697 3-South west coast 1 004 852 152 6 11 56 42 11 3 6 13 357 71 325 12 91 -South east coast 1 423 1 138 285 6 10 88 95 3 6 15 3 712 80 301 91 3 Table A3.1: The number of fishing industry employees by skills group, part-time or full-time employment and race by coastal regions in WC.
Source: ESS Report (1), 2003
Total Professional Skilled Middle skilled Semi-skilled Unskilled All Black White Full-time Part-time Full-time Part-time Full-time Part-time Full-time Part-time Full-time Part-time Bl Wh Bl Wh Bl Wh Bl Wh Bl Wh Bl Wh Bl Wh Bl Wh Bl WhBl WhWestern Cape564 132465 56498 568 17 130 20 388 252 45 97228 20611 38220 55617 7663 870 36 215 44810 740120 30614 70020 076 3617 196 72-North west 85 212 78 240 6 972 2 316 3 120 18 4 284 2 280 192 5 508 954 15 324 354 36 378 228 9 822 18 4 398 18-West coast 411 984366 47475 510 13 884 15 216 234 36 80418 87010 85420 19611 4481 962 36 176 112 7 290 66 19211 904 8 292 1812 618 54-South west 25 818 20 922 4 896 390 1 134 1 242 1 458 198 108 270 846 5 898 1 026 11 016 324 1 908 -South east 41 118 29 92811 190 540 918 3 642 5 598 138 252 540 108 18 114 2 070 6 720 2244 54 180
Table A3.2: Total income of fishing industry employees by skills group, part-time or full-time employment and race by coastal regions in WC
Source: ESS Report (1), 2003
North west coast West coast South west coast South east coast
Doringbaai Saldanha Kalk Bay Struisbaai
Lambert’s Bay Yzerfontein Strand Arniston
Elandsbaai Cape Town Gordon’s Bay Mossel Bay
Velddrif Hout Bay Kleinmond Knysna
St Helenabaai Kommetjie Hermanus Plettenberg Bay
Paternoster Simons Town Gansbaai
Table A3.3: Harbour towns for each coastal region in the Western Cape
Source: ESS Report (1), 2003
18
A large proportion of the workers are part-time employees (table A3.1). Many of the fisheries
have strong seasonal components resulting in 6 492 of the 15 903 employees (over 40% of total
employment) being part-time employed. The part-time workers earn 32.7% of total income (table
A3.2).
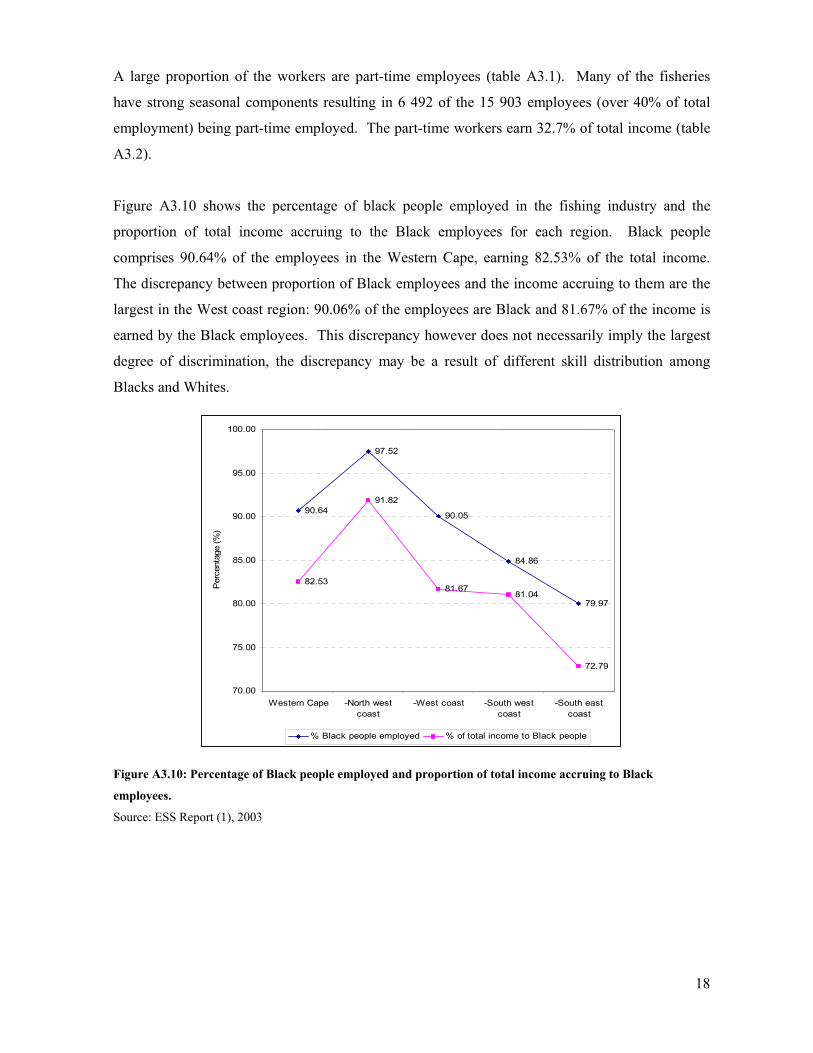
Figure A3.10 shows the percentage of black people employed in the fishing industry and the
proportion of total income accruing to the Black employees for each region. Black people
comprises 90.64% of the employees in the Western Cape, earning 82.53% of the total income.
The discrepancy between proportion of Black employees and the income accruing to them are the
largest in the West coast region: 90.06% of the employees are Black and 81.67% of the income is
earned by the Black employees. This discrepancy however does not necessarily imply the largest
degree of discrimination, the discrepancy may be a result of different skill distribution among
Blacks and Whites.
Figure A3.10: Percentage of Black people employed and proportion of total income accruing to Black
employees.
Source: ESS Report (1), 2003
90.64
97.52
90.05
84.86
79.97
82.53
91.82
81.6781.04
72.79
70.00
75.00
80.00
85.00
90.00
95.00
100.00
Western Cape -North westcoast
-West coast -South westcoast
-South eastcoast
Per
cent
age
(%)
% Black people employed % of total income to Black people
19
A4. The regulation of commercial fishing in South Africa The marine ecosystem is protected and governed by the Marine Living Resources Act (MLRA)
which was promulgated in 1998. The purpose of the Act is “To provide for the conservation of the
marine ecosystem, the long term sustainable utilisation of marine living resources and the orderly
access to exploitation, utilisation and protection of certain marine living resources; and for these
purposes to provide for the exercise of control over marine living resources in a fair and equitable
manner to the benefit of all the citizens of South Africa; and to provide for matters connected
therewith.” (ESS Report (1), 2003:76). Reaching these objectives is no easy task and the
Department experienced numerous problems ranging from administrative chaos resulting in long
delays in the allocation of fishing rights to repeated court appeals to the allocations made. Appeals
were made by those denying access to resources and by those who felt that too much had been
taken away from them. The Department lost a number of the appeals resulting in a loss of
confidence in the Department’s ability to implement the objectives of the MRLA.
A team, including contracted administrative and legal members, was put together to implement a
new plan for the 2001 application process. After wide spread consultation and communication
with companies, communities and other interested parties a new system of allocating fishing rights
in South Africa was put in place. With the new system medium-term rights (approximately for
four years) are allocated as opposed to one-year rights, application fees have increased, an
independent Rights Verification Unit check the details of the applicants, an advisory committee
(the Consultative Advisory Forum (CAF)) advises the Minister, and the process includes an
internal appeal period. The 2001 allocation process went fairly smoothly. Of the 3 574 potential
appellants, 1 501 lodged internal appeals and a few went directly to the court. The court ruled in
favour of the Department in all the appeals against the 2001 allocations. The greatest challenge
against the Department was that of Bato Star, a company owned by trade unions. They argued that
they should receive a greater share of the TAC since they are a wholly pdi-owned company. The
High Court in Cape Town ruled in favour of the applicant, but this judgement was overruled by the
South African Supreme Court. (Kleinschmidt, Sauer and Britz, 2003)
20
PART B – SECTORAL OVERVIEW
B1. Abalone Until 1968 there was no restrictions on the catches of abalone, but catches declined in the second
half of the 1960’s and government introduced the first quota’s in 1968 at 386 tons (meat mass).
These allocations were granted to six factories that were in production at the time. In 1983 they
made the quotas applicable to whole mass instead of meat mass and set the TAC at 660 tons. By
the early 1990’s the fishing industry consisted of two components, namely 50 licensed divers who
were each granted the right to harvest a small percentage of the TAC, and about six quota holders
who owned the receiving, processing and marketing rights to the bulk of the annual TAC. In the
1993/4 season a 10 ton community trust was introduced and allocated and in the 1995/6 season.
10% of the TAC was allocated to new entitlement holders. The TAC for the 1998/9 season was
820 tons of which 515 tons were allocated to the “traditional” commercial entities, 220 tons for
recreational take and 85 tons for subsistence allocation. (The recreational fishery no longer exists.)
The Department reduced the TAC from 430 tons to 282 tons in February 2004 and allocated the
following fishing rights, valid for ten years:
• Rights were allocated to 5 abalone fish processors.
• 200 divers received rights. An amount of 107 000kg was allocated to the divers. 74.5% of
the divers are pdi’s.
• 24 applicants for legal entity rights satisfied the criteria of the Department and received
quota’s. A total of 19 122 kg have been allocated to the 24 legal entities rights holders.
The 24 rights holders are highly transformed and are 66% or more pdi-owned and
managed.
• An amount of 58 374 kg has been set aside for appeals. (Department of Environmental
Affairs and Tourism, 2004)
The above allocation were made on the assumption that poaching will be reduced by 50% due to
increased compliance efforts. This assumption is however very optimistic and the CAF
recommended in September 2004 to reduce the TAC to 182 metric tonnes to ensure the sustainable
exploitation of abalone. The CAF also recommended that compliance issues should be given high
priority. Finally, the CAF recommended that the Department should consider completely closing
the abalone fishery. (CAF Meeting, 2004)
21
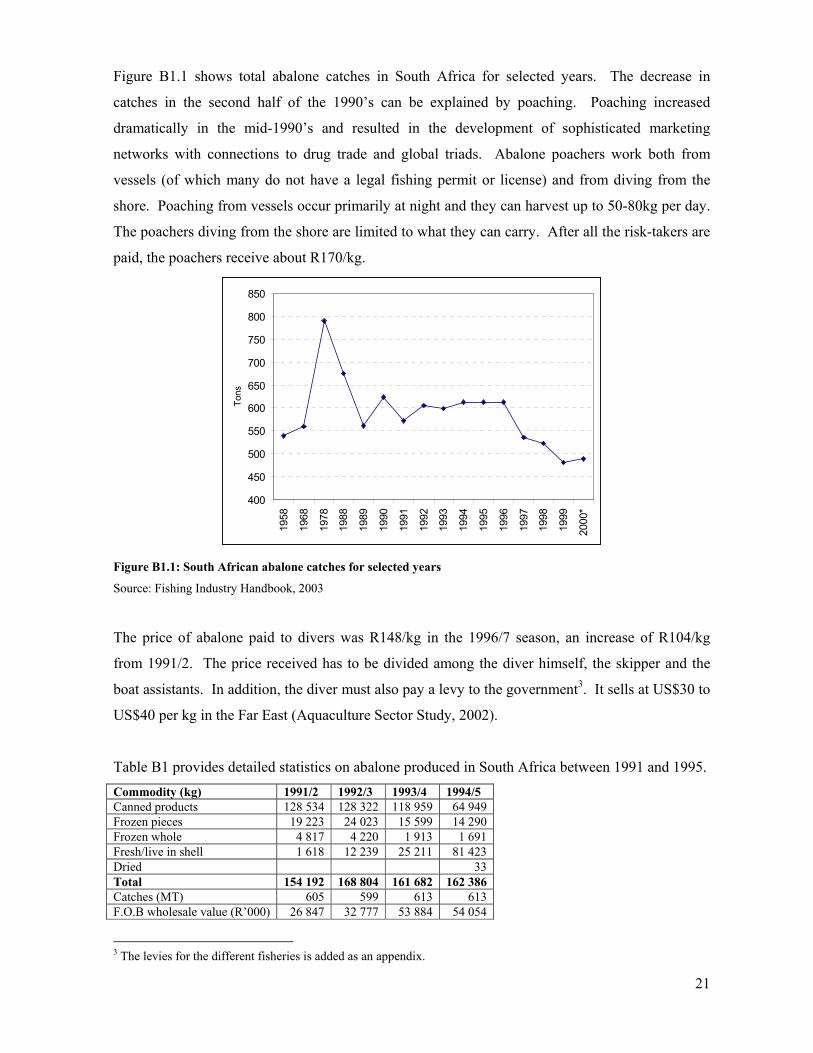
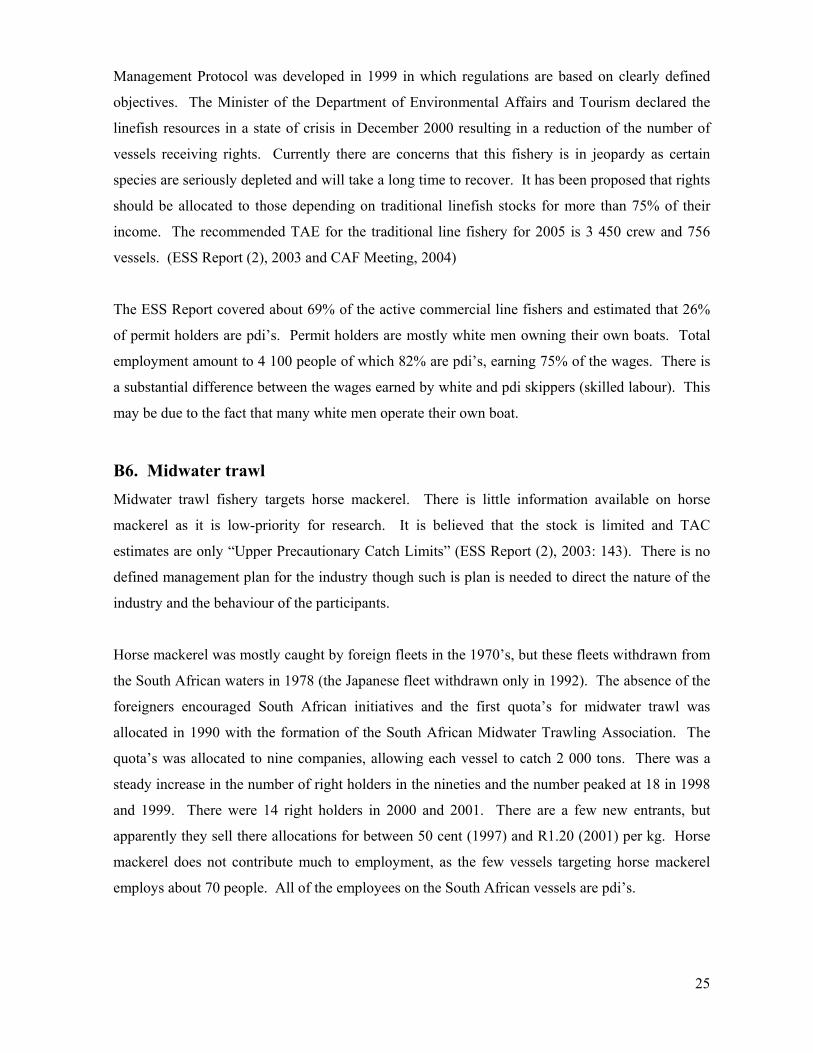
Figure B1.1 shows total abalone catches in South Africa for selected years. The decrease in
catches in the second half of the 1990’s can be explained by poaching. Poaching increased
dramatically in the mid-1990’s and resulted in the development of sophisticated marketing
networks with connections to drug trade and global triads. Abalone poachers work both from
vessels (of which many do not have a legal fishing permit or license) and from diving from the
shore. Poaching from vessels occur primarily at night and they can harvest up to 50-80kg per day.
The poachers diving from the shore are limited to what they can carry. After all the risk-takers are
paid, the poachers receive about R170/kg.
Figure B1.1: South African abalone catches for selected years
Source: Fishing Industry Handbook, 2003
The price of abalone paid to divers was R148/kg in the 1996/7 season, an increase of R104/kg
from 1991/2. The price received has to be divided among the diver himself, the skipper and the
boat assistants. In addition, the diver must also pay a levy to the government3. It sells at US$30 to
US$40 per kg in the Far East (Aquaculture Sector Study, 2002).
Table B1 provides detailed statistics on abalone produced in South Africa between 1991 and 1995. Commodity (kg) 1991/2 1992/3 1993/4 1994/5 Canned products 128 534 128 322 118 959 64 949 Frozen pieces 19 223 24 023 15 599 14 290 Frozen whole 4 817 4 220 1 913 1 691 Fresh/live in shell 1 618 12 239 25 211 81 423 Dried 33 Total 154 192 168 804 161 682 162 386 Catches (MT) 605 599 613 613 F.O.B wholesale value (R’000) 26 847 32 777 53 884 54 054
3 The levies for the different fisheries is added as an appendix.
400
450
500
550
600
650
700
750
800
85019
58
1968
1978
1988
1989
1990
1991
1992
1993
1994
1995
1996
1997
1998
1999
2000
*
Tons
22
Table B1: Statistics for abalone produced in South Africa: 1991-1995
Source: ESS Report (2), 2003
B2. Deep-sea and inshore hake The first individual quota’s was introduced in 1979. In 1986 there were 7 participants in the
industry and this increased to 21 in 1992 and 56 in 2000. The increase between 1992 and 2000 is
in large a result of the Marine Living Resources Act that was promulgated in 1998. However, the
number of participants in the inshore industry has decreased over the past ten years.
In 2000, 33% of the deep-sea TAC was in the hands of previously disadvantaged individuals or
companies. The figures for the inshore trawl industry are 32% and 34% respectively. The three
largest companies in the industry are subsidiaries of JSE listed companies and the percentage
Black ownership may therefore be greater than the estimated figures given above. Employment in
the industry is formal and the majority of jobs (96.4%) in the deep-sea industry are permanent. In
2000, 92% of the 8 838 employees in the trawling industries was pdi’s and 40% of those were
women. The employees in the industry collectively earn approximately R428 million and 86% of
the payroll are paid to pdi’s. Centralised bargaining structures were introduced and salaries
depend on rank and the years of employment, and employees also earn commission that depends
on quantity and quality.
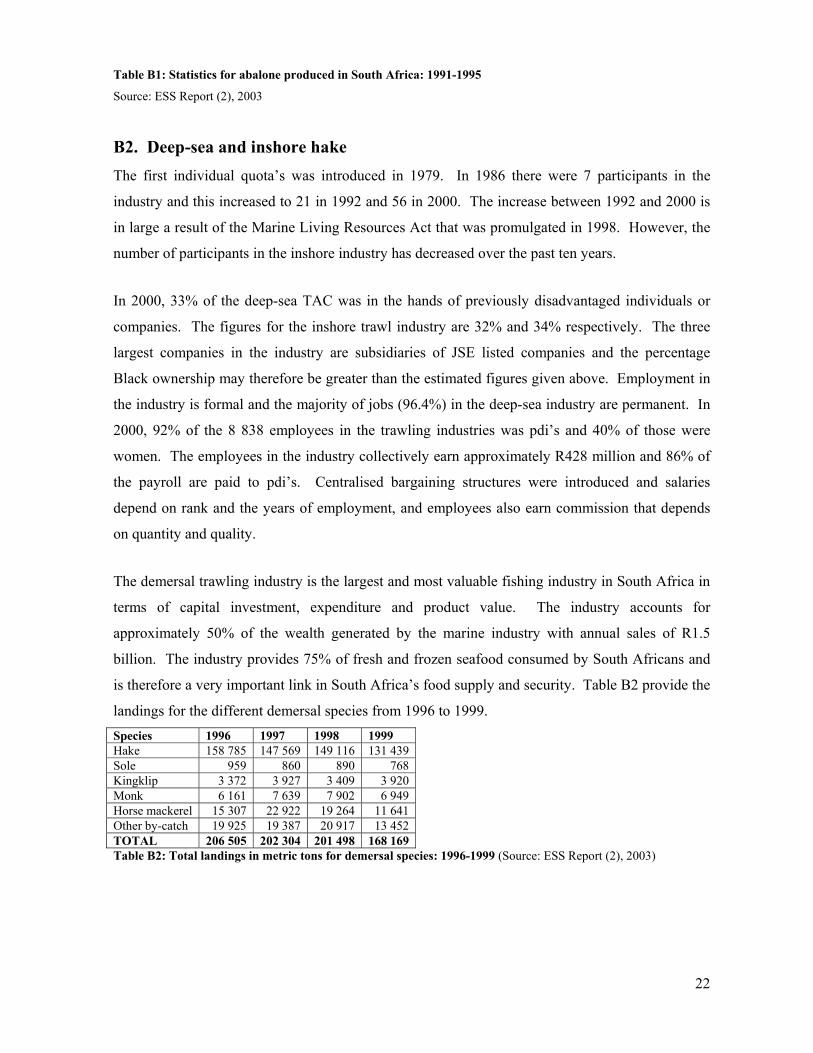
The demersal trawling industry is the largest and most valuable fishing industry in South Africa in
terms of capital investment, expenditure and product value. The industry accounts for
approximately 50% of the wealth generated by the marine industry with annual sales of R1.5
billion. The industry provides 75% of fresh and frozen seafood consumed by South Africans and
is therefore a very important link in South Africa’s food supply and security. Table B2 provide the
landings for the different demersal species from 1996 to 1999. Species 1996 1997 1998 1999 Hake 158 785 147 569 149 116 131 439 Sole 959 860 890 768 Kingklip 3 372 3 927 3 409 3 920 Monk 6 161 7 639 7 902 6 949 Horse mackerel 15 307 22 922 19 264 11 641 Other by-catch 19 925 19 387 20 917 13 452 TOTAL 206 505 202 304 201 498 168 169 Table B2: Total landings in metric tons for demersal species: 1996-1999 (Source: ESS Report (2), 2003)

23
B3. Hake handline 1998 handline catches is estimated at 2 500 to 3 000 tons and verifiable landings has increased to 4
500 tons. However, this figure is underreported and catches are probably around the TAC of 5 500
tons. A fisher needs a permit for handline hake. Under the old Act they could catch an unlimited
amount of fish per day, as long as they do not exceed the maximum of 10 hooks on a line. With
the promulgation of the MLRA in 1998, hake catches are restricted to a maximum of 5 hake per
day, but the ruling of the old Act remained in force. Currently there is uncertainty around the
status of the permits as the legislation in support of the MLRA is still in process.
About 2 400 fishers are directly or partly employed in the industry. Depending on the nature of the
vessel, fishers receive between R2.50 and R3.50 per kg. The handline industry is valued at
approximately R86 million (infrastructure mostly). Assuming a 5 550 ton catch, the total value of
the industry (catching, processing, freight, etc.) amounts to over R110 million.
Information on transformation in the hake handline industry is limited as the industry is not
formalised. Most operators are individual boat owners, many white people that are retrenched and
invested in their own boats. Few operators work through companies or closed corporations and
pdi’s involved in the industry are few. Black people are mostly employed on boats and their
income is irregular. Hake handline has a strong seasonality component (with catches peaking in
autumn and spring) and is dependant on weather conditions. Black workers move between boats
resulting in similar commission rates between boat owners and low social responsibility.
B4. Hake longline Longlining for dermersal species was only introduced in 1982 in South Africa and nine permits
were issued in 1983. Catches reached 5 000 tons kingklip and 1 500 tons hake during 1985 and
another six permits were issued. Kingklip catches increased to 11 370 tons in 1986, but decreased
sharply thereafter. Government introduced a 5 000 tons TAC in 1989, but stopped all demersal-
directed longlining by the end of 1990. It was only in 1994 that hake-directed longlining was
allowed again and the TAC was set at 4 000 tons for the 1994 and 1995 season and 4 400 tons for
the 1996 and 1997 seasons. After the experimental phase (1994 to 1998) the Minister allocated
permits for 6 400 tons to the experimental fisheries only, of which 6 192 tons of hake landed. In
2000, 5 250 tons was allocated initially and 4 750 tons was allocated later in the year as smaller
quota’s, mostly to new entrants. Of the initial 5 250 tons allocated, 5 256 landed and only 2 874

24
tons of the 4 750 tons later allocated was activated of which 1 774 tons landed. The allocations for
2000 were “rolled-over” to 2001. In 2000 there was 43 rights holders and 46 vessels.
Table B4 provides the number of longline landings by location for 1994 to 2001. The table shows
the geographical distribution of hake longline activity along the coast of the Western Cape. The
table also shows that hake longline landings occur predominantly in the Western Cape.
Port 1994 1995 1996 1997 1998 1999 2000 2001 Cape Town 135 71 252 401 75 178 186 70 Mossel Bay 58 28 129 60 46 261 84 28 Hout Bay 29 4 73 114 25 116 214 96 Plettenberg Bay 46 41 126 198 1 71 90 5 St Helena 16 8 22 26 2 51 156 42 Gansbaai 27 20 0 0 0 3 0 12 Kalk Baai 0 0 29 3 0 0 0 0 Knysna 0 0 0 15 1 7 0 0 Hermanus 0 10 9 0 0 1 0 0 Laaiplek 0 0 5 0 0 0 0 0 Lambert Bay 0 0 0 1 0 0 0 0 Saldanha 1 0 1 0 0 0 0 0 PE 9 0 65 73 105 179 117 39 Western Cape 321 182 711 891 255 867 847 292 Other 42 80 24 71 32 24 15 6 Total 363 262 735 962 287 891 862 298 Table B4: Number of hake longline landings by location since 1994
Source: ESS Report (2), 2003
According to the response received by the ESS report, pdi’s own 46% of the companies, 42% of
the rights are and 31% of the fishing fleet. Approximately 90% of people employed in small-scale
operations in the hake longline industry are Black and they earn 80% of total income.
B5. Traditional commercial line fisheries The Cape commercial line fishery is responsible for 95% of the South African linefish catch.
There are three sectors within the commercial line fishery namely the traditional commercial
sector, the tuna handline/pole sector and the hake handline sector. This section focuses on the
traditional species.
The levels of linefish (except snoek and yellow tail) deteriorated to dangerously low levels in the
1990’s due to poor management and enforcement and excess commercial effort in the 1980’s.
Commercial permits for line fishery was introduced in 1985. Despite heavily depleted stock at the
time, the industry survived by subsidising effort by external sources. In order to reduce cross-
subsidisation the MLRA does not allow part-time commercial activity and the Linefish
25
Management Protocol was developed in 1999 in which regulations are based on clearly defined
objectives. The Minister of the Department of Environmental Affairs and Tourism declared the
linefish resources in a state of crisis in December 2000 resulting in a reduction of the number of
vessels receiving rights. Currently there are concerns that this fishery is in jeopardy as certain
species are seriously depleted and will take a long time to recover. It has been proposed that rights
should be allocated to those depending on traditional linefish stocks for more than 75% of their
income. The recommended TAE for the traditional line fishery for 2005 is 3 450 crew and 756
vessels. (ESS Report (2), 2003 and CAF Meeting, 2004)
The ESS Report covered about 69% of the active commercial line fishers and estimated that 26%
of permit holders are pdi’s. Permit holders are mostly white men owning their own boats. Total
employment amount to 4 100 people of which 82% are pdi’s, earning 75% of the wages. There is
a substantial difference between the wages earned by white and pdi skippers (skilled labour). This
may be due to the fact that many white men operate their own boat.
B6. Midwater trawl Midwater trawl fishery targets horse mackerel. There is little information available on horse
mackerel as it is low-priority for research. It is believed that the stock is limited and TAC
estimates are only “Upper Precautionary Catch Limits” (ESS Report (2), 2003: 143). There is no
defined management plan for the industry though such is plan is needed to direct the nature of the
industry and the behaviour of the participants.
Horse mackerel was mostly caught by foreign fleets in the 1970’s, but these fleets withdrawn from
the South African waters in 1978 (the Japanese fleet withdrawn only in 1992). The absence of the
foreigners encouraged South African initiatives and the first quota’s for midwater trawl was
allocated in 1990 with the formation of the South African Midwater Trawling Association. The
quota’s was allocated to nine companies, allowing each vessel to catch 2 000 tons. There was a
steady increase in the number of right holders in the nineties and the number peaked at 18 in 1998
and 1999. There were 14 right holders in 2000 and 2001. There are a few new entrants, but
apparently they sell there allocations for between 50 cent (1997) and R1.20 (2001) per kg. Horse
mackerel does not contribute much to employment, as the few vessels targeting horse mackerel
employs about 70 people. All of the employees on the South African vessels are pdi’s.

26
Midwater trawling is capital intensive (as is suggested by the low employment figures) and have
low profit margins. Catching costs varies between R2.00 and R2.50 per kg and the landed price
varies between R2.50 and R3.20 per kg, leaving a profit of between R0 and 70 cents per kg. Horse
mackerel is directed at large volume low value African markets.
B7. Pelagic The pelagic industry started in South Africa in the Western Cape after the Second World War. 60
to 90 percent of the pelagic industry in South Africa consists of pilchard and anchovy. The ratio
between pilchard and anchovy landings, however fluctuated over the decades. Pilchard landings
averaged around 116 000 tons between 1951 and 1958 and peaked at 410 000 tons in 1962.
Thereafter catches dropped to below 100 000 tons until 1995 (except for 1968, 1972 and 1976).
The industry shifted its focus to anchovy in 1965 and anchovy landings reached almost 600 000
tons in 1988. At that time anchovy accounted for over 80% of total pelagic landings. Since then
anchovy landings reached a low of 40 000 tons in 1996. (ESS Report (2), 2003) However, 2001
and 2002 were booming years in the pelagic industry as total catch exceed half a million tons. In
2001 and 2002, 535 000 and 538 000 tons of small pelagic fish landed in South Africa
respectively. This increase is due to both an increase in pilchard and anchovy catches. The former
amounted to 261 000 tons in 2002, up from 192 000 tons in 2001. This increase reflect a shift
towards targeting pilchards, as well as the healthy state of the pilchard stock. Figure B7.1 shows
the total catches of pelagic fish for selected years. The fluctuations in total landings is due to the
large fluctuations in the abundance of the fish, which is a result of the short-livedness of pelagic
fish. (Kleinschmidt, 2003)
Figure B7.1: South African pelagic catches for selected years
Source: Fishing Industry Handbook, 2003
0
100000
200000
300000
400000
500000
600000
1958
1968
1978
1988
1989
1990
1991
1992
1993
1994
1995
1996
1997
1998
1999
2000
*
Tons
Pilchard Mackerel Anchovy Redeye/Round herring

27
Numerous management restriction were introduced since 1951 and include a closed season, a
global quota and other restrictions on fleet hold capacity. In 1990 the government allocated an
average catch right of 4 000 tons to each boat, based on a TAC of 300 000 tons. The pilchard
allocations were granted to 12 companies in 1990, but in 2000 the number of rights holders
increased to 107. 48% of the 107 right holders are new entrants from previously disadvantaged
communities. The number of right holders for anchovy was 10 in 1990, but increased to 51 in
2000. The majority of the 41 new entrants are from previously disadvantage communities. These
transformations resulted in the establishment of a number of small companies.
The pilchard and anchovy species are well researched and stock management surveys are carried
out twice a year. The TAC for the next year is then based on survey results. One of the
characteristics of the pelagic industry is the large fluctuations in the TAC and this make small
companies extremely vulnerable. Another distinct characteristic of the pelagic industry is that all
fish landed has to be processed into another form. Pilchard is canned for human consumption
while anchovy and round-herring are used for fishmeal. The pelagic industry supports 8 fishmeal
plants, 6 canning factories, more than 40 bait packing facilities and 65 to 68 purse-seine vessels.
The industry employs 5 300 people on a full-time basis, 2 500 people on a part-time basis, 700
fishermen and 2 400 indirect jobs via support services (ESS Report (2), 2003 and Kleinschmidt,
2003). According to the ESS Report 19% of companies are owned by Whites, 28% by Blacks and
53% are unknown. Similarly, Whites own 21% of the rights, Blacks 26% and the 53% is
unknown. The ESS Report received employment data from 84.5% of the active vessels and
concluded that 92% of the 5 275 employees are pdi’s, earning 76% of the annual wages. 78% are
employed in the Western Cape.
B8. South coast rock lobster The fishery commenced in 1974 and foreign fleets participated until 1976. Catches and catch rates
collapsed between 1979 and 1981 resulting in a reduction of effort and consequently catches. This
allowed the stock to recover during the eighties. TAC was introduced at 450 tons (tail mass) in
1984 and was increased to 477 tons from the 1990/1 to 1993/4 seasons. The annual TAC was
gradually reduced to 365 tons in the 2000/1 season due to declining biomass. Despite declining
TAC, fishing effort has increased in recent years. The industry is now controlled by both TAC and
total applied effort (TAE). The quota holder must stop its activities when either of the quota’s are
filled. The recommended TAC for the 2004/2005 season is 382 tons, a 9% increase from the

28
previous season. This increase is in line with the cpue increase. It is recommended that the TAE
should increase from 2 038 sea-days to 2 089 sea-days (subject to change if vessels are
substituted). (ESS Report (2), 2003 and CAF Meeting, 2004)
The majority of the lobster products are exported to the US, Europe and the Far East and the price
depends on demand and supply conditions in the foreign country as well as the exchange rate.
Fees and levies are payable in the industry.
There were 13 fishing boats in the industry in the 2000/1 season and 19 rights holders.
Transformation in the industry is difficult as new entrants are dependent on the existing fishing
boats to activate their rights. The South coast rock lobster industry is capital-intensive and
requires large rights to be economical viable. Another problem is the declining biomass of
resources which make it difficult to allocate large quota’s. The rights of pdi’s are often sold to the
established companies. However, a few small new entrants managed to put their rights together
and bought a fishing vessel which is active in the industry. The ESS Report covered about 65% of
the fishery and found that Blacks own 69% of the rights and 79% of the fleet. 94% of the people
employed are Black, earning 86% of total income.
B9. Shark longline Sharks are mainly caught as a by-catch in other industries such as the deep-sea trawl hake industry.
The only shark directed fishery is the shark longline sector. There were 31 permit holders between
1991 and 1994, 35 in 1995 and 23 in 2001 to 2004 of which only 8 are active in the 2004 season.
No effort or catch quota’s are enforced. (ESS Report (2), 2003) The price of shark fins is rising
dramatically internationally and South African catches reached 300 tonnes in June 2004 and is
expected to reach 600 tons in December. So as a precautionary measure against increased effort,
the CAF recommends that the number of rights holders should be reduced to 10 vessels for 2005
(CAF Meeting, 2004).
The history of shark catches date back to 1934, but the fishery never received much attention as
there are too many other competing marine resources. Exports of shark products increased from
141.52 metric tons in 1990 to 248.36 metric tons in 1995. The rand value of exports was R378
545 in 1990 and R1 081 434 in 1995 (the exchange rate depreciated from R3.65/$ to R4.50/$
during this period). The main destinations of shark exports are Australia, Greece and Italy.

29
Total shark catches in 1994 was 2 044 tons and 1 724 tons in 1995. Prices ranged between
R430/ton (shark caught bay trawl) to R2 500/ton (line and longline catches). The total value of
sales was R 1 509 000 for 1994 and R1 298 000 for 1995. Shark fisheries are profitable in the way
it is operated currently, that is catching sharks as a by-catch or targeting sharks in the off-season of
the main activity.
Since sharks are mainly caught as a by-catch in other industries, there are no clear management
objectives for the exploitation of sharks (except for the limited number of permit holders).
However, the integration of the tuna and shark longline sectors are considered, since the two
fisheries use identical gear and have similar by-catches (ESS Report (2), 2003). A policy has been
drafted to consolidate all commercial large pelagic longline fisheries, thus commercial harvesting
fo pelagic shark longline will not be allowed after 31 December 2005 (CAF Meeting, 2004).
B10. Squid Chokka squid used to be caught for bait for sport linefishers, but in 1984 it was realised that squid
exports may be a profitable business. Squid are either caught by jigging or as a by-catch. The
latter makes out a very small proportion of total catch. The highest catch was reported in 1989 at 9
800 tons. The industry is managed by a closed season in October/November (four weeks), a
limited number of right holders (160 in 2000) and a total applied effort limit. Stock assessment is
annually done in September and the TAE is determined according to the results.
The fishery provides employment to roughly 2 500 people and generates more than R180 million
per year. The ESS Report found that 14% of company ownership are in the hands of pdi’s, 38% in
the hands of White people and the remaining 48% could not be determined (100% coverage of
active participants in the chokka squid industry). These figure translate into 16% if rights in the
hands of pdi’s and 36% owned by Whites. 91% of the people employed are pdi’s and they earn
80% of the total income (feedback received from 87.5% of the vessels and 12 squid
processing/packing facilities). The majority of the workforce are semi-skilled pdi’s, earning less
than R30 000 per year. The Western Cape employs 11% of the workforce in the chokka squid
industry.
B11. West coast rock lobster West coast rock lobster stocks are heavily depleted because of large unsustainable catches in the
first half of the twentieth century, and because of a slow-down in the somatic growth rate of

30
individual lobsters over the past 10 years. The Sea Fisheries Advisory Committee adopted a
resource management strategy in 1997 with the aim of increasing biomass with 20% between 1997
and 2006. A TAC was introduced in the early 1980’s. At that time utilisation stabilised at 3 500
to 4 000 tons per annum. With the slow-down in growth rates the TAC was gradually reduced in
the nineties, reaching a low of 1 500 tons in 1995 and 1996. The TAC for 2000 and 2001 was 1
614 tons. Other control strategies include a minimum size, a closed winter season and a daily bag
limit for recreational fishermen. The global TAC was 2 018 tons for the 2000/1 season of which
230 tons were for subsistence fishing, 174 tons for recreational fishing and the remaining 1 614
tons for commercial fishing. After consulting with the scientists the CAF recommends a TAC of 3
527 tons (320 tons for recreational take and 3 207 tons commercial sector) for the 2005 season, an
increase of 321 tons from the previous season. (ESS Report (2), 2003 and CAF Meeting, 2004)
The commercial industry employs 1 300 seasonal and full-time workers in the catching
component. There are currently 226 quota holders as opposed to the 39 holders in the late 1980’s.
199 of 226 holders are small quota holders (less than 10 tons) receiving 40% of the 1 614 tons
allocated, 18 are medium quota holders (10 to 40 tons) receiving 25% of the TAC, and 9 are large
quota holders (>40 tons), receiving 35% of the TAC. 58% of the small holders are pdi’s, 41% of
the medium holders and 76% of the large holders.
The processing component employs 2 800 people, but the factories operate below the optimum
level as a result of the reduction in TAC. At full capacity the factories can process up to 4 000
tons of TAC without any further capital investment. A further reduction in the TAC or changes in
the allocation of the TAC may result in job losses.
The ESS Report estimates that the west coast rock lobster industry provides employment for
approximately 4 400 people of which 95% of the employees are pdi’s, earning 87% of total
income. (These latter two figures are based on a 50% sample of the vessels and a 90% sample of
processing companies.)
B12. Tuna Tuna was already discovered in 1860 in South African waters, but the commercial tuna industry
only started in 1960. Today there exists four distinct fisheries in the South African tuna fishery:
the tuna sport fishery, the baitboat fishery, the pelagic longline fishery and the foreign pelagic
longline fishery. The baitboat fishery targets albacore for canning and by-catch include species
31
such as yellowfin and bigeye tuna. The industry is characterised by a strong seasonal component
and low profit margin. Albacore catches is estimated at 150 tons in the second half of the 1970’s,
but has increased to 8 412 tons in 1998, where after it dropped to 3 610 tons in 2000.
The TAE for 2002 was 200 vessels and 3 600 crew, but only 163 rights (2 734 crew) were issued.
The CAF recommends that the 37 unallocated rights be exempted before 1 January 2005, but if
this is not possible the TAE for 2005 should remain at 163 rights (2 734 crew). The MCM cannot
easily issue fishing rights for species under the jurisdiction of International Commission for the
Conservation of Atlantic Tuna (ICCAT) since South Africa is a member of ICCAT. Therefore is
it necessary to maintain/improve South Africa’s catch performance in order to increase our chance
of a large country allocation from ICCAT. (ESS Report (2), 2003 and CAF Meeting, 2004)
The vessels used in the industry have an average market value of R4.8 million and a replacement
value of R11 million, making entry to the industry almost impossible for small new entrants.
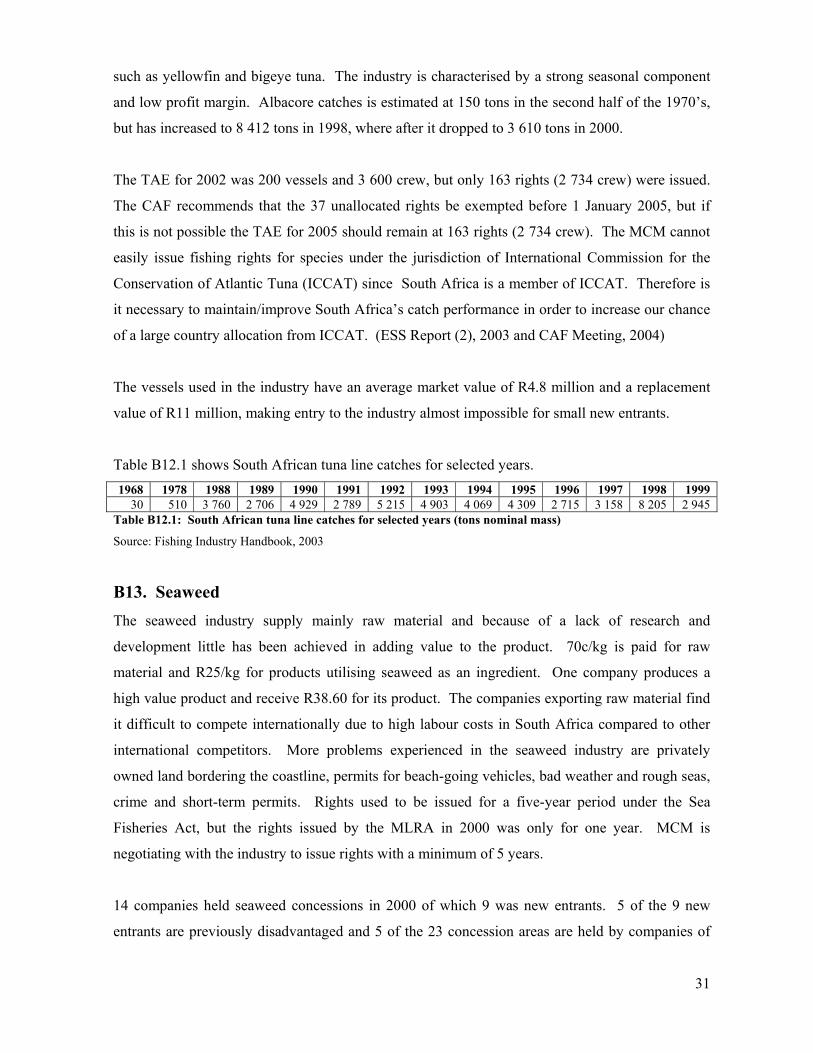
Table B12.1 shows South African tuna line catches for selected years. 1968 1978 1988 1989 1990 1991 1992 1993 1994 1995 1996 1997 1998 1999
30 510 3 760 2 706 4 929 2 789 5 215 4 903 4 069 4 309 2 715 3 158 8 205 2 945 Table B12.1: South African tuna line catches for selected years (tons nominal mass)
Source: Fishing Industry Handbook, 2003
B13. Seaweed The seaweed industry supply mainly raw material and because of a lack of research and
development little has been achieved in adding value to the product. 70c/kg is paid for raw
material and R25/kg for products utilising seaweed as an ingredient. One company produces a
high value product and receive R38.60 for its product. The companies exporting raw material find
it difficult to compete internationally due to high labour costs in South Africa compared to other
international competitors. More problems experienced in the seaweed industry are privately
owned land bordering the coastline, permits for beach-going vehicles, bad weather and rough seas,
crime and short-term permits. Rights used to be issued for a five-year period under the Sea
Fisheries Act, but the rights issued by the MLRA in 2000 was only for one year. MCM is
negotiating with the industry to issue rights with a minimum of 5 years.
14 companies held seaweed concessions in 2000 of which 9 was new entrants. 5 of the 9 new
entrants are previously disadvantaged and 5 of the 23 concession areas are held by companies of

32
pdi’s – this represent 30% of the resources on a biomass basis. Pickers of seaweed are usually
Black females, while white males dominate the professional and managerial positions. Employees
are mostly employed on a permanent part-time or casual basis. The majority of the companies
offer some skills development programme to their employees. The ESS Report received feedback
from 11 of the 14 companies (79% coverage) and found that 40% of the seaweed concessions were
owned by White people, 20% by Black people and the remaining 40% by joint ventures or other
shareholding structures. The 11 companies and subcontractors employ 313 workers, of which 92%
are pdi’s earning 77% of total income. Beside the 313 formal employees the companies employ 1
450 casual workers during certain times of the year. All of these are pdi’s. The majority of
workers are unskilled earning less than R20 000 a year.
33
PART C – Aquaculture C1 Overview Aquaculture is the cultivation of fish, shrimp, shellfish and seaweeds, in controlled conditions,
rather than catching the aquatic species in the wild. One can distinguish between freshwater
aquaculture (trout, crocodiles, ornamental fish, catfish and tilapia) and mariculture (abalone,
prawns, oysters, seaweed and mussels) where the latter is the cultivation of marine organisms in
their natural environment.
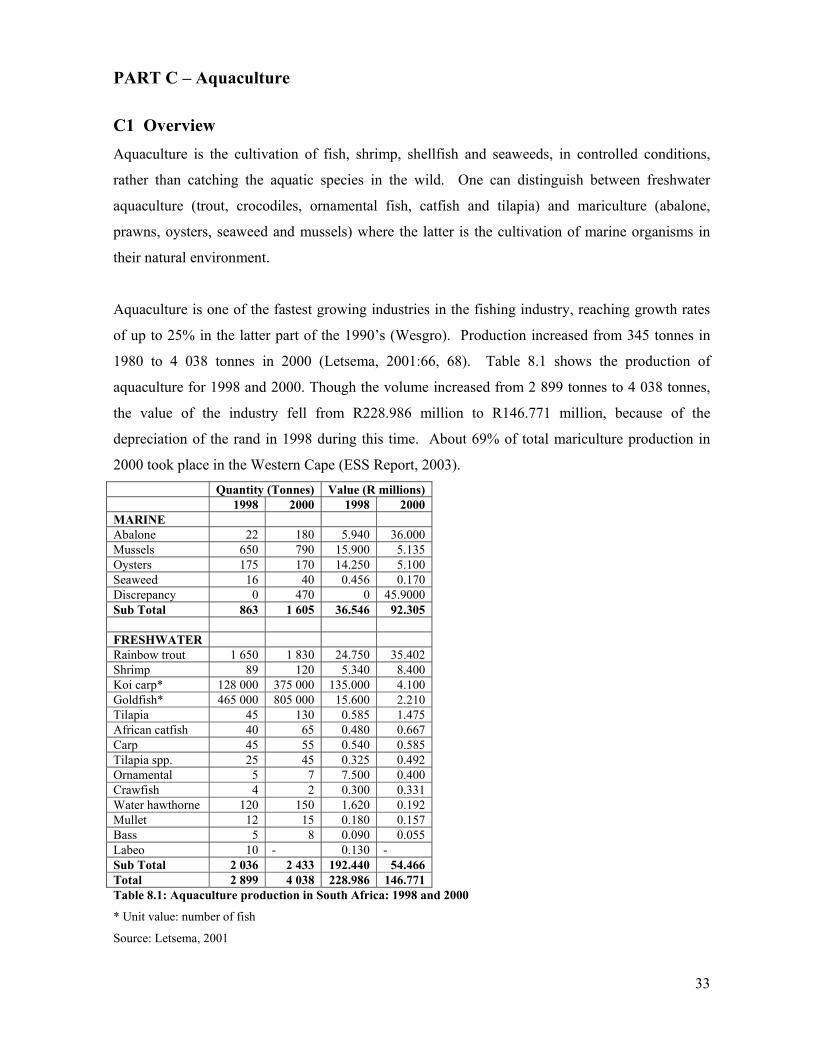
Aquaculture is one of the fastest growing industries in the fishing industry, reaching growth rates
of up to 25% in the latter part of the 1990’s (Wesgro). Production increased from 345 tonnes in
1980 to 4 038 tonnes in 2000 (Letsema, 2001:66, 68). Table 8.1 shows the production of
aquaculture for 1998 and 2000. Though the volume increased from 2 899 tonnes to 4 038 tonnes,
the value of the industry fell from R228.986 million to R146.771 million, because of the
depreciation of the rand in 1998 during this time. About 69% of total mariculture production in
2000 took place in the Western Cape (ESS Report, 2003). Quantity (Tonnes) Value (R millions)
1998 2000 1998 2000 MARINE Abalone 22 180 5.940 36.000 Mussels 650 790 15.900 5.135 Oysters 175 170 14.250 5.100 Seaweed 16 40 0.456 0.170 Discrepancy 0 470 0 45.9000 Sub Total 863 1 605 36.546 92.305 FRESHWATER Rainbow trout 1 650 1 830 24.750 35.402 Shrimp 89 120 5.340 8.400 Koi carp* 128 000 375 000 135.000 4.100 Goldfish* 465 000 805 000 15.600 2.210 Tilapia 45 130 0.585 1.475 African catfish 40 65 0.480 0.667 Carp 45 55 0.540 0.585 Tilapia spp. 25 45 0.325 0.492 Ornamental 5 7 7.500 0.400 Crawfish 4 2 0.300 0.331 Water hawthorne 120 150 1.620 0.192 Mullet 12 15 0.180 0.157 Bass 5 8 0.090 0.055 Labeo 10 - 0.130 - Sub Total 2 036 2 433 192.440 54.466 Total 2 899 4 038 228.986 146.771 Table 8.1: Aquaculture production in South Africa: 1998 and 2000
* Unit value: number of fish
Source: Letsema, 2001

34
The mariculture industry in South Africa employed 678 people in 2000 of which the majority are
unskilled Black workers. Table 8.2 shows the employment statistics for the South African
mariculture industry in 2000. It is clear that White people are employed in the higher skilled jobs,
but this is a result of the nature of the mariculture industry at present. Running a fish farm requires
a relatively high level of technical skills and these skills are resident in the higher educated white
population. (ESS Report (2), 2003)
Total income earned in the mariculture industry amounted to R22.35 million in 2000. The average
monthly salary for professional staff, skilled workers, middle services, semi-skilled and unskilled
labourers were approximately R8 825, R5 170, R3 950, R2 300 and R1 500 respectively. The
difference in income earned between white and other population groups was 22.5% in the middle
services and semi-skilled groups and 57% in the skilled group (ESS Report (2), 2003: 302).
Sub-total Professional Skilled Middle services Semi-skilled Unskilled Total
Black White Black White Black White Black White Black White Black White Abalone 418 344 74 0 32 2 10 24 24 62 4 256 4 Oyster 132 115 17 0 15 0 0 0 2 15 0 100 0 Mussel 17 15 2 0 1 0 0 0 1 2 0 13 0
Seaweed 11 8 3 0 1 0 0 0 2 0 0 8 0 Finfish 2 2 0 0 0 0 0 0 0 0 0 2 0 Prawns 98 N/a 10 23 3 23 39 Total 678 59 35 56 106 422
Table 8.2: The employment structure of the South African mariculture industry in 2000
Source: ESS Report (2), 2003
C2 Abalone There are 15 commercial abalone farms in South Africa and more sites are investigated (Brink,
2003). A medium size farm produce around 35 tons per annum. Total farm production for 2002
was 500 tons, giving a gross production of R150 million (Aquaculture Sector Study, 2002).
Approximately 80% of total abalone production occurs in the Western Cape (Wesgro, 2004).
South African abalone is very popular in the Far East and main export destinations include China,
Hong Kong, Taiwan and Japan. SA exported 70 tons as canned product in 2003, and the rest
mainly as live abalone (Brink, 2003 and Gerber, 2004). H.midae (the specie cultivated in South
Africa) were sold for US$56-52 per kg on the Tokyo Central wholesale market in December 2003.

35
Key risks in abalone farming include water quality, mortalities and infestations. These risks are
minimised by good farm management which requires expertise in abalone farming. Site selection
is another important success factor. (Aquaculture Sector Study, 2002)
C3 Kelp Kelp is harvested by picking it up from the beach or shallow waters or by divers operating from
small vessels. A team operating on the beach consists of 6 to 8 people. The kelp is removed to a
location inland where it is dried and milled. The milled product is transported to Cape Town from
where it is exported to alginate plants abroad. The price for dried kelp was US$300 per ton in
2000. Kelp has numerous uses including food, paper, textiles, welding rods, pharmaceuticals,
fertilizer, animal feed, and food for abalone.
The kelp industry is managed by a system of concessions. These concessions are issued for short
periods and do not necessarily flow into each other resulting in kelp rotting on the beach. Another
problem making development projects difficult is the expertise required to market the product.
The world markets are highly erratic and new entrants with a lack marketing expertise should link
or collaborate with established businesses. (Aquaculture Sector Study, 2002)
C4 Mussels There are two mussel producers in South Africa. They produced approximately 1000 tons in 2003
of which 39% go back into the see for the next production cycle and the remaining 61% is
marketed in South Africa. The 61% is distributed as follows: 25% is marketed as fresh mussels,
5% is marketed directly, and 70% is delivered for processing. South Africa is a net importer of
mussels as only 45% of consumption in South Africa is produced locally. (Diza and Karaan,
2004)
Saldanha is very suitable for mussel farming, because the good water quality and the nutrient rich
Benguella current result in high mussel growth rates and good mussel quality. Saldanha also has a
large sheltered bay and the risk of red tides are low and well monitored. Despite these many
advantages of Saldanha, site selection remains an important factor for success. (Aquaculture
Sector Study, 2002) The Western Cape accounts for 85% (2 000 tons) of cultivated black mussel
production in South Africa (Wesgro, 2004).

36
There are several factors making it difficult for small farmers to enter the mussel industry. These
factors include:
• High start-up costs and asset specificity;
• Information constraints about technology, production techniques, marketing channels and
processing services;
• Variable size and quality of mussels making it difficult to penetrate niche markets.
(Aquaculture Sector Study, 2002)
C5 Oysters The oyster industry has proven to be profitable and expanded over the last few years. Production
was 175 metric tons in 1998 and increased to 250 metric tons in 2003. The value of production in
2003 was R1.6 million (Brink, 2003). The Western Cape produce 86% of total production of
cultivated oysters with an ex-farm income of R7 million (Wesgro, 2004). Oyster production is
clustered in the Knysna lagoon, but production also occurs at Saldanha Bay, St Helena Bay, Port
Nolloth and St Francis Bay. There are nine producers of which South Cape Oysters in Knysna is
the most successful producer. The marketing of oysters is limited to the local market as South
Africa is a net importer of oysters. The oyster industry is conducive to economic development and
empowerment (Aquaculture Sector Study, 2002).
C6 Seaweed The total seaweed industry in South Africa is valued at about R18 million and employed around
400 people in 1995 (Aquaculture Sector Study, 2002). Commercial production of seaweed started
in 1998 with a production of 16 metric tons. 48 tons were produced in 2003 with a value of
R0.265 million (Brink, 2003). Seaweed are collected for export and processing and is used as
food, food supplements or fertilizer.
The seaweed industry has the potential to provide work for the impoverished coastal communities
at the West Coast and to boost the local economy. The first community project was started in 1996
at St Helena Bay by the University of the Western Cape. Funds were obtained from the West
Coast Investment Initiative to write a business plan and register a private company. (Aquaculture
Sector Study, 2002)
37
C7 Trout Commercial production of trout already started in the 1960’s and increased from 1 000 metric tons
to 1 750 metric tons per annum. The 1 750 metric tons produced in 2003 is worth R44 million.
The industry is expected to grow by 2 to 3 percent per annum. Smaller producers have fallen away
through the years, leaving only the larger producers that benefit from economies of scale. 14 of
the 35 farms are located in the Western Cape, producing 450 tons trout. The trout produced is
either used as live fish for sport fishery or for food.
The trout industry provides about 220 direct jobs on the level of production and 200 indirect jobs
involved in processing. There are 8 processors, marketing their products almost exclusively to the
South African market. The trout industry is stable, despite competition form substitute imported
products such as Pacific and Atlantic salmon. (Brink, 2003)
The Division of Aquaculture of Stellenbosch University has helped to establish about 5 small
aquaculture farmers in the Western Cape, and there is enormous potential to establish more farms
in the Western Cape. Small scale aquaculture is very risky and the farms are vulnerable to, among
others, fluctuations in the interest rate as capital are usually borrowed funds, inflation as fish food
is very expensive, losses of fingerlings during transport and theft. The lack of technical and
business experience is another problem for small farmers. (Aquaculture Sector Study, 2002)
C8 Other Other species cultivated in South Africa include marron (freshwater lobster), Atlantic salmon, eels,
crocodiles and ornamental fish. The cultivation of these species are however still in the initial
phase. For example, there is only one producer of Atlantic salmon and the development of a
sustainable eel aquaculture sector is still in the planning phase. SA Eels Pty (Ltd) is planning to
develop four eel farms over the next two years in the Western Cape, Eastern Cape and
Mpumulanga. The total value of this production is estimated at R42 million and the project is
expected to create 60 permanent jobs and 160 indirect jobs in the processing sector.

38
PART D
SUMMARY OF FISHING IMBIZO’s by Minister Marthinus van Schalkwyk
Saldanha Bay, Hermanus & Woodstock August 2004
Undertakings by the Minister:
1. Access to the sea for all
2. Simplified application forms
3. Departmental officials will be trustworthy, transparent and monitored
4. Provisional lists will be published to verify that applicants are fishers
5. Training will be offered so all applicants understand the process of submission and
adjudication
6. Extension granted to successful lobster appeals till end September to catch males only
7. Long term rights will be considered with the next round of quotas
8. Cost of quota applications will be taken under consideration
Issues raised by Fishers:
1. The plight of line fishers who are increasingly marginalized
2. The dilemma of line fishers versus recreational fishers
3. A need to consider all fisheries as commercial vis a vis limited commercial and subsistence
4. The problem of retired or handicapped fishers who loose rights as a result
5. Similarly, the problems of fishers with rights who cannot fish due to e.g. illness but are
unable to transfer their rights albeit temporarily to assistants
6. Identification of real fishers on whom to confer rights, as opposed to opportunists who
attain rights at their expense
7. The need to co-manage resources with communities
8. Incessant call for transparency in the allocation and adjudication process
9. The viability of recreational line fish (i.e. 10 fish per person) is questionable
10. Permits do not take the viability of boats into consideration and the multi-specie allocation
per boat must be encouraged
11. The lack of women participation must be addressed and promoted with hard targets
39
12. The Department should make careful assessments of the type of boats used as Rubber boats
are in some instances more appropriate
13. Seasons should be set more strictly according to the biological requirements of species, not
merely administratively
14. African participation in Fishing remains neglected and under-represented
15. The restrictions placed on sale of linefish (recreational) by especially subsistence fishers
constrain the viability
16. Rights are allocated to boat owners which marginalizes the crew who are the real fishers,
but retain little rights
17. Quotas are linked to individuals linked to specific boats, and hence boat owners are placed
in a monopolistic position
18. A need to look more seriously into the availability of suitable infrastructure e.g. fish
markets, slipways and small processing
19. Longer term quotas are preferred
20. The need decentralise administrative measures such as applications, licensing, etc.
21. A general call to hold large corporates more responsible for BEE, catches and social
responsibility
22. Consideration be given to return to lobster rings because traps cause much mortality and
losses of especially juveniles
23. Some unions support corporates where they have their members, and not fishers.
24. Policing measures are more focused on smmes and not equally applied to large companies
25. Community members were in instances promised rewards when collaborating with
government in policing efforts, but these were not honoured
26. Some officials in the department are not adept at handling requests or honouring responses
27. Not all bogus applications are detected in the verification process
28. There is an impression that negotiations with large companies occur behind closed doors
29. Communities or fishers are often prompted into joint ventures but lack the necessary
business skills to contend at this level, and remain marginalized in decision-making and
business processes
30. The distribution of benefit among all stakeholders on boat and on shore requires attention
in the interest of equity
31. Large companies are accused of over-representing the job creation potential in applications
and may later renege on this once rights are obtained

40
32. Assistance must be rendered to small scale fishers to obtain small craft and appropriate
technology
33. Scientist do not have perfect knowledge and have to combine their scientific methods and
knowledge with indigenous and experiencial knowledge acquired by fishers
34. Clear procedures and credible structures for handling queries must be introduced
Some flexibility be applied when quota due dates expire that allow catches elsewhere to complete
quotas

41
BIBLIOGRAPHY
Aquaculture Sector Study. 2002. Department of Economic Affairs and Tourism. Western
Cape
Brink, D. 2003. Overview of Aquaculture in South Africa: 2003. Division of Aquaculture,
University of Stellenbosch
Consultative Advisory Forum (CAF). 2004. Minutes, 4th Meeting, 02 September. Department of
Environmental Affairs and Tourism, Marine and Coastal Management.
Department of Environmental Affairs and Tourism. 2004. Summary of 2004 abalone
allocation. Unpublished.
Diza, S.J. and Karaan A.S.M. 2004. Establishing contract farming with small scale mussel
growers in Saldanha Bay: A case study approach. Paper will be presented at the Annual
Conference of the Agricultural Economics Association of South Africa. Somerset West,
September 21-23.
Gerber, W.H. 2004. Enhancing the competitive advantage of the South African cultivated abalone
industry. MSc. Agric thesis, Department of Agricultural Economics, Stellenbosch University.
Kleinschmidt, H.G.H 2003. Promoting BEE in the fishing industry. Deputy Directory General of
Department of Environmental Affairs and Tourism. Unpublished
Kleinschmidt, H.G.H 2003. Pelagic fishery management and conservation. Deputy Directory
General of Department of Environmental Affairs and Tourism. Unpublished.
Kleinschmidt, H., Sauer, W.H.H. and Britz, P. 2003. Commercial fishing rights allocation in
post-apartheid South Africa: Reconciling equity and stability. African Journal of Marine
Science 25: 25-35.
Letsema. 2001. A sector study on the South Africa Aquaculture Industry. Master document.
Domestic sector profile for Trade Investment South Africa

42
Mather, D., Britz, P.J., Hecht,T. and Sauer, W., (Eds.), 2003. An Economic and Sectoral Study of
the South African Fishing Industry. Volume 1. Economic and Regulatory Principles, Survey
Results, Transformation and Socio-economic impact. Report prepared for Marine and Coastal
Management, Department of Environment Affairs and Tourism, by Rhodes University. 300p.
Sauer, W, Hecht, T., Britz, P.J., and Mather, D., (Eds.), 2003. An Economic and Sectoral Study of
the South African Fishing Industry. Volume 2. Fishery Profiles. Report prepared for Marine and
Coastal Management, Department of Environment Affairs and Tourism, by Rhodes University.
308p.
Transformation and the South African Fishing Industry. The TAC- Controlled Fisheries. 2003.
Department of Environmental Affairs and Tourism.
Wesgro website. 2004. The Western Cape Fishing Industry. Cape sector fact sheet. Available:
http://www.wesgro.org.za
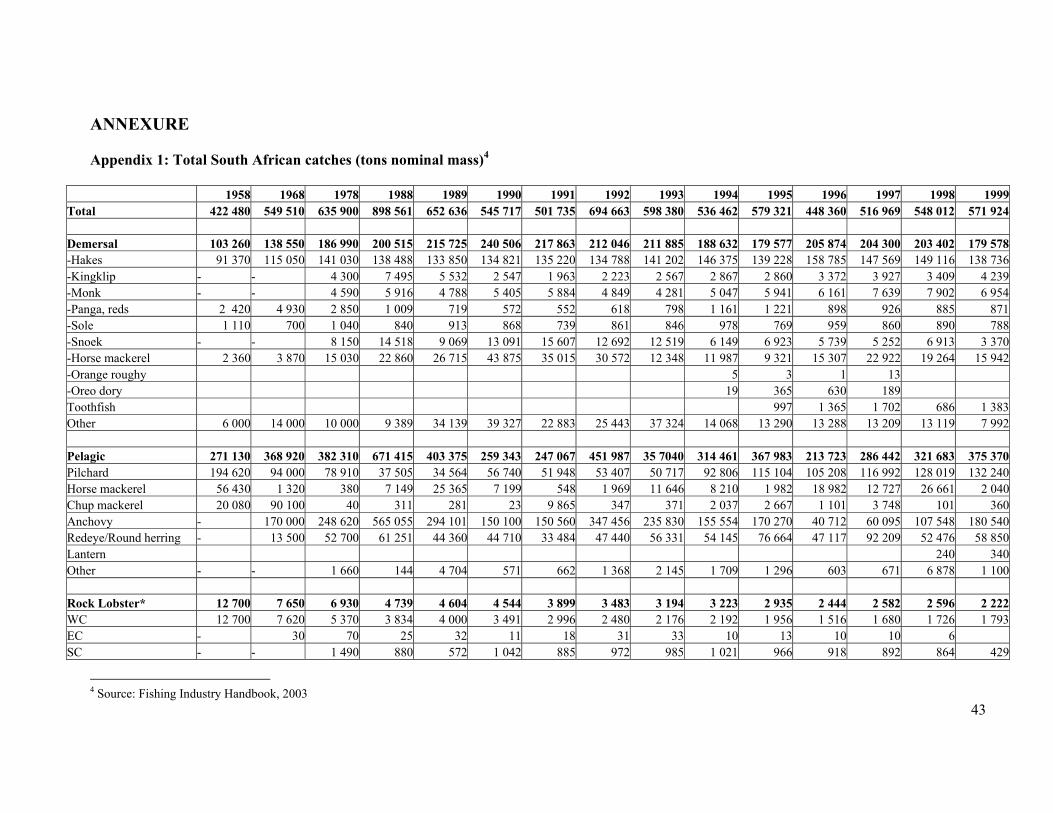
43
ANNEXURE Appendix 1: Total South African catches (tons nominal mass)4
1958 1968 1978 1988 1989 1990 1991 1992 1993 1994 1995 1996 1997 1998 1999 Total 422 480 549 510 635 900 898 561 652 636 545 717 501 735 694 663 598 380 536 462 579 321 448 360 516 969 548 012 571 924 Demersal 103 260 138 550 186 990 200 515 215 725 240 506 217 863 212 046 211 885 188 632 179 577 205 874 204 300 203 402 179 578 -Hakes 91 370 115 050 141 030 138 488 133 850 134 821 135 220 134 788 141 202 146 375 139 228 158 785 147 569 149 116 138 736 -Kingklip - - 4 300 7 495 5 532 2 547 1 963 2 223 2 567 2 867 2 860 3 372 3 927 3 409 4 239 -Monk - - 4 590 5 916 4 788 5 405 5 884 4 849 4 281 5 047 5 941 6 161 7 639 7 902 6 954 -Panga, reds 2 420 4 930 2 850 1 009 719 572 552 618 798 1 161 1 221 898 926 885 871 -Sole 1 110 700 1 040 840 913 868 739 861 846 978 769 959 860 890 788 -Snoek - - 8 150 14 518 9 069 13 091 15 607 12 692 12 519 6 149 6 923 5 739 5 252 6 913 3 370 -Horse mackerel 2 360 3 870 15 030 22 860 26 715 43 875 35 015 30 572 12 348 11 987 9 321 15 307 22 922 19 264 15 942 -Orange roughy 5 3 1 13 -Oreo dory 19 365 630 189 Toothfish 997 1 365 1 702 686 1 383 Other 6 000 14 000 10 000 9 389 34 139 39 327 22 883 25 443 37 324 14 068 13 290 13 288 13 209 13 119 7 992 Pelagic 271 130 368 920 382 310 671 415 403 375 259 343 247 067 451 987 35 7040 314 461 367 983 213 723 286 442 321 683 375 370 Pilchard 194 620 94 000 78 910 37 505 34 564 56 740 51 948 53 407 50 717 92 806 115 104 105 208 116 992 128 019 132 240 Horse mackerel 56 430 1 320 380 7 149 25 365 7 199 548 1 969 11 646 8 210 1 982 18 982 12 727 26 661 2 040 Chup mackerel 20 080 90 100 40 311 281 23 9 865 347 371 2 037 2 667 1 101 3 748 101 360 Anchovy - 170 000 248 620 565 055 294 101 150 100 150 560 347 456 235 830 155 554 170 270 40 712 60 095 107 548 180 540 Redeye/Round herring - 13 500 52 700 61 251 44 360 44 710 33 484 47 440 56 331 54 145 76 664 47 117 92 209 52 476 58 850 Lantern 240 340 Other - - 1 660 144 4 704 571 662 1 368 2 145 1 709 1 296 603 671 6 878 1 100 Rock Lobster* 12 700 7 650 6 930 4 739 4 604 4 544 3 899 3 483 3 194 3 223 2 935 2 444 2 582 2 596 2 222 WC 12 700 7 620 5 370 3 834 4 000 3 491 2 996 2 480 2 176 2 192 1 956 1 516 1 680 1 726 1 793 EC - 30 70 25 32 11 18 31 33 10 13 10 10 6 SC - - 1 490 880 572 1 042 885 972 985 1 021 966 918 892 864 429
4 Source: Fishing Industry Handbook, 2003

44
Line, small net 30 150 26 830 27 570 16 764 22 979 24 717 17 665 21 336 21 857 25 123 26 504 23 334 20 528 17 119 12 071 Snoek 13 150 8 800 6 700 4 892 5 639 7 753 6 339 5 618 2 757 7 754 9 174 6 725 6 479 7 770 8 304 Tunas - 30 510 3 760 2 706 4 929 2 789 5 215 4 903 4 069 4 309 2 715 3 158 8 205 2 945 Yellowtail - - 760 685 882 612 563 606 818 867 778 451 466 54 12 Mullet - - 1 600 1 562 1 625 1 380 1 027 928 1 310 1 153 1 061 1 086 982 1018 762 Squid - - - 4 824 9 792 3 281 6 572 2 489 6 308 6 441 6 850 7 111 3 538 Other 17 000 18 000 18 000 1 041 2 335 6 762 375 6 480 5 761 4 839 4 332 5 246 5 905 71 48.43 Other Activities 5 240 7 560 32 100 5 128 5 953 15 517 15 241 5 811 4 404 5 023 2 362 2 985 3 117 3 212 2 683 Prawn, langoustine - - 1 310 1 572 1 389 952 566 559 521 265 498 411 368 405 Abalone 540 560 790 676 562 624 573 605 599 613 614 613 536 524 481 Other, guano,seaweed 4 700 7 000 30 000 2 880 4 002 13 941 14 102 4 647 3 284 4 145 1 250 1 961 2 213 2 283 2 202
Notes: Seasonal data for each year in which season ended, ie 1994 is 1993/1994 season
Demersal data is for demersal longline catches only. Deepsea and inshore data was not available at time of going to press. Blank spaces indicate data was not available at time of going to press
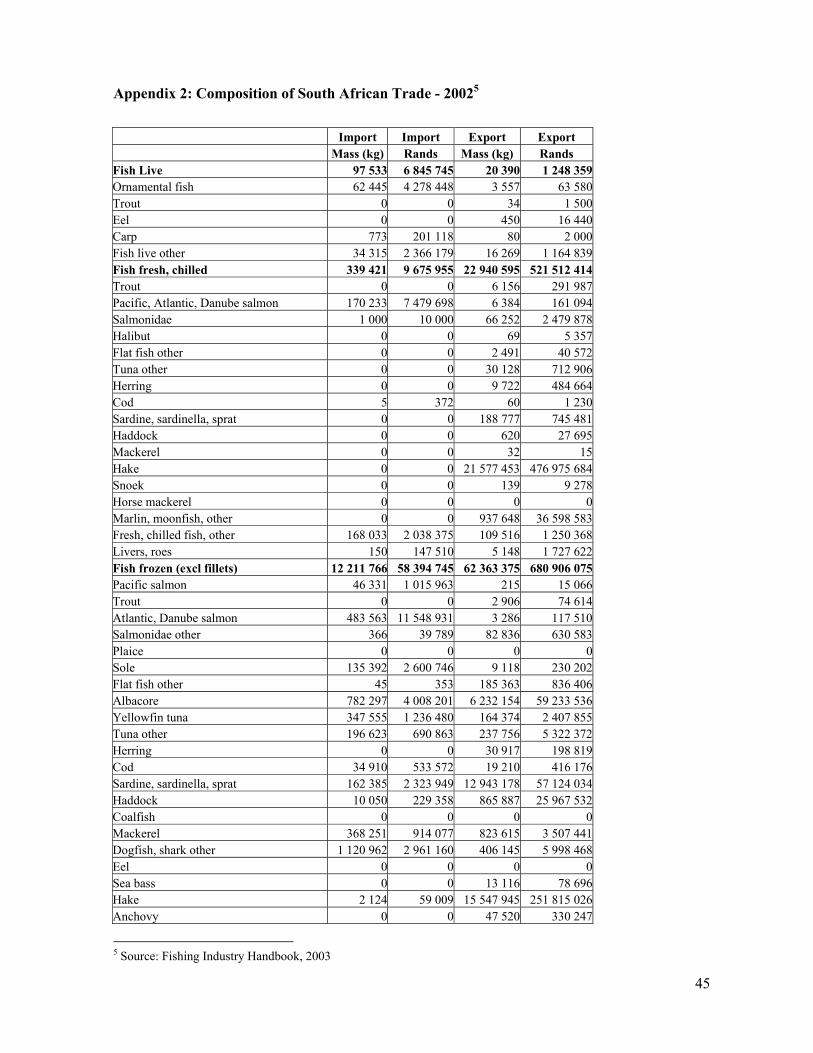
45
Appendix 2: Composition of South African Trade - 20025
Import Import Export Export Mass (kg) Rands Mass (kg) Rands Fish Live 97 533 6 845 745 20 390 1 248 359 Ornamental fish 62 445 4 278 448 3 557 63 580 Trout 0 0 34 1 500 Eel 0 0 450 16 440 Carp 773 201 118 80 2 000 Fish live other 34 315 2 366 179 16 269 1 164 839 Fish fresh, chilled 339 421 9 675 955 22 940 595 521 512 414 Trout 0 0 6 156 291 987 Pacific, Atlantic, Danube salmon 170 233 7 479 698 6 384 161 094 Salmonidae 1 000 10 000 66 252 2 479 878 Halibut 0 0 69 5 357 Flat fish other 0 0 2 491 40 572 Tuna other 0 0 30 128 712 906 Herring 0 0 9 722 484 664 Cod 5 372 60 1 230 Sardine, sardinella, sprat 0 0 188 777 745 481 Haddock 0 0 620 27 695 Mackerel 0 0 32 15 Hake 0 0 21 577 453 476 975 684 Snoek 0 0 139 9 278 Horse mackerel 0 0 0 0 Marlin, moonfish, other 0 0 937 648 36 598 583 Fresh, chilled fish, other 168 033 2 038 375 109 516 1 250 368 Livers, roes 150 147 510 5 148 1 727 622 Fish frozen (excl fillets) 12 211 766 58 394 745 62 363 375 680 906 075 Pacific salmon 46 331 1 015 963 215 15 066 Trout 0 0 2 906 74 614 Atlantic, Danube salmon 483 563 11 548 931 3 286 117 510 Salmonidae other 366 39 789 82 836 630 583 Plaice 0 0 0 0 Sole 135 392 2 600 746 9 118 230 202 Flat fish other 45 353 185 363 836 406 Albacore 782 297 4 008 201 6 232 154 59 233 536 Yellowfin tuna 347 555 1 236 480 164 374 2 407 855 Tuna other 196 623 690 863 237 756 5 322 372 Herring 0 0 30 917 198 819 Cod 34 910 533 572 19 210 416 176 Sardine, sardinella, sprat 162 385 2 323 949 12 943 178 57 124 034 Haddock 10 050 229 358 865 887 25 967 532 Coalfish 0 0 0 0 Mackerel 368 251 914 077 823 615 3 507 441 Dogfish, shark other 1 120 962 2 961 160 406 145 5 998 468 Eel 0 0 0 0 Sea bass 0 0 13 116 78 696 Hake 2 124 59 009 15 547 945 251 815 026 Anchovy 0 0 47 520 330 247
5 Source: Fishing Industry Handbook, 2003

46
Kingklip 0 0 965 836 13 801 291 Snoek 1 385 762 6 693 313 161 671 632 398 Horse mackerel 2 268 570 4 497 888 14 907 274 44 898 418 Marlin, moonfish, swordfish 4 179 349 15 955 862 833 622 10 396 805 Frozen fish other 687 145 3 041 421 7 845 393 196 494 201 Livers, roes 86 43810 34 038 378 379 Fish fillets, cutlets 614 579 9 657 966 29 280 809 808 836 385 Anchovy fresh, chilled 0 0 7 029 190 256 Fish fillets, cutlets 0 0 275 557 5 320 611 Anchovy 0 0 2 200 9 481 Herring frozen 392 791 4 871 662 779 14 303 Fish other frozen 206 275 3 952 439 27 776 486 785 581 210 Anchovy other 0 0 17 564 Herring 0 0 101 040 3 895 431 Fish fillets, cutlets, other 15 513 833 865 1 117 701 13 824 529 Fish dried, salted, brined, smoked 278 460 15 609 317 2 471 332 45 421 144 Fish meal edible 136 8 063 322 235 1 686 762 Livers, roes 2 233 480 838 360 1 368 Anchovy 15 12 1 497 118 485 Fillets other, not smoked 12 986 3 3160 39 672 1 445 122 Pacific, Atlantic, Danube salmon 33 573 1 823 077 1 440 93 619 Herring smoked 259 10 928 15 4 509 Anchovy 0 0 0 0 Fish other smoked 471 32 328 60 816 1 978 253 Cod 187 850 11 745 578 8 932 705 130 Anchovy other 2 001 9 372 3 150 63 787 Shark fins 14 739 996 015 49 339 10 785 662 Fish dried, other etc 4 109 112 490 1 890 335 27 552 976 Herring salted 890 21 819 0 0 Anchovy salted 13 023 161 503 201 7 803 Fish other salted 6 175 174 134 93 340 977 668 Crustacea 2 186 371 96 021 165 2 556 245 470 190 306 Rock lobster frozen 16 464 980 482 823 418 181 638 234 Lobster frozen 43 006 1 666 948 109 001 25 563 558 Shrimp, prawn frozen 1 897 206 83 551 130 225 735 18 112 978 Crab frozen 99 180 1 439 138 1 133 25 652 Crustacea other 49 741 6 683 614 164 149 11 482 619 Rock lobster not frozen 9 779 515 389 687 378 148 813 060 Lobster not frozen 130 3 900 523 726 74 537 848 Shrimp, prawn not frozen 5 179 432 979 7 283 862 295 Crab not frozen 65 641 747 393 323 13 548 Crustacea meal lobster cooked 0 0 2 60 Crustacea other 45 192 14 097 9 140 454 Molluscs 7 922 177 70 054 373 8 827 014 486 365 768 Oyster other 11 060 254 106 14 459 1 268 824 Scallop live, fresh, chilled 421 8 716 150 5 740 Scallop other 14 740 671 117 458 322 107 Mussel live, fresh, chilled 0 0 704 26 815 Mussel other 401 511 7 065 765 7 441 177 786 Cuttlefish, squid live, fresh, chilled 0 104 1370 134913 Cuttlefish, squid other 7 353 603 59 755 372 8 353 640 374 059 348 Octopus live, fresh, chilled 0 0 10 202 261 471 Octopus other 44 703 429 962 138 732 2 071 444 Snail 95 073 1 868 043 14 533 129 964

47
Molluscs other live, fresh, chilled 66 1 188 285 325 107 907 356 Molluscs other 0 0 0 0 Coral, shells 26 917 813 021 158 157 963 699 Shells unworked 23 556 482 620 138 203 780 430 Corals, shells, other 3 361 330 401 19 954 183 269 Sponges 8 003 354 423 8 483 4 469 230 Sponge of animal origin 8 003 354 423 8 483 4 469 230 Products of fish, crustacea, molluscs 3 319 182 577 113 740 483 225 Fish products excl ova 3 319 182 577 113 740 483 225 Fats, oils of fish, marine mammals 316 986 3 668 735 875 041 3 403 867 Fish liver oil 46 343 889 329 53 717 465 135 Fish body oil 270 108 2 608 690 801 634 2 825 033 Mammal oil 535 170 716 19 690 113 699 Prepared, preserved fish 7 373 270 170 480 416 12 313 270 121 429 338 Salmon 212 339 5 970 301 27 200 655 957 Herring frozen 548 34 274 390 12 348 Herring other 21 340 669 923 1 220 24 979 Sardine canned in oil 249 519 8 410 576 395 363 4 503 829 Sprat canned in oil 0 0 150 2 691 Sardinella canned 13 269 182 918 68 178 386 848 Pilchard canned 20 361 755 466 7 623 826 84 967 000 Other frozen 229 87 000 50 907 181 550 Sardine, sardinella, sprat frozen 39 754 1 368 249 2 354 390 10 711 808 Tuna frozen 0 0 18 907 618 806 Tuna other 6 072 543 141 281 044 63 296 1 876 010 Mackerel canned 160 401 1 832 312 2 043 25 845 Mackerel other 2 764 88 707 206 7 492 Anchovy 17 877 617 510 2 578 74 125 Horse mackerel frozen 15 369 595 653 30 276 746 582 Horse mackerel canned 114 1 059 0 0 Horse mackerel other 5 859 103 991 962 602 9 176 810 Fish paste 3 890 78 729 68 366 621 172 Anchovy other 363 5 543 11 347 744 955 Pilchard, mackerel canned 48 432 444 174 2 044 481 Prepared fish other frozen 451 100 6 215 928 139 718 3 559 926 Prepared fish other 84 440 1 982 157 42 993 400 344 Caviar 543 73 546 2 633 75 710 Caviar substitute 600 125 098 2 507 10 070 Prepared molluscs, aquatic invertebre 1 377 112 48 135 637 133 078 36 435 157 Crab homogenised 0 0 217 4 976 Crab canned 6 995 335 285 490 27 330 Crab other 0 0 44 4 531 Crustacea, molluscs homogenised 0 0 321 21 610 Shrimp, prawn canned 16 283 521 063 1 274 93 430 Shrimp, prawn other 757 925 24 969 292 6 236 1 542 546 Lobster 273 19 169 309 150 060 Crustacea homogenised 0 0 40 164 1 911 453 Crustacea canned 7 173 187 568 1 222 39 480 Crustacea other 12 600 331 042 98 3 384 Molluscs other homogenised 0 0 172 9 738 Molluscs other canned 472 804 19 434 179 45 601 32 545 046 Molluscs other 93 557 2 116 327 393 18 620 Invertebrates other canned 30 3 003 0 0 Invertebrates other 9 472 218 709 36 537 62 953
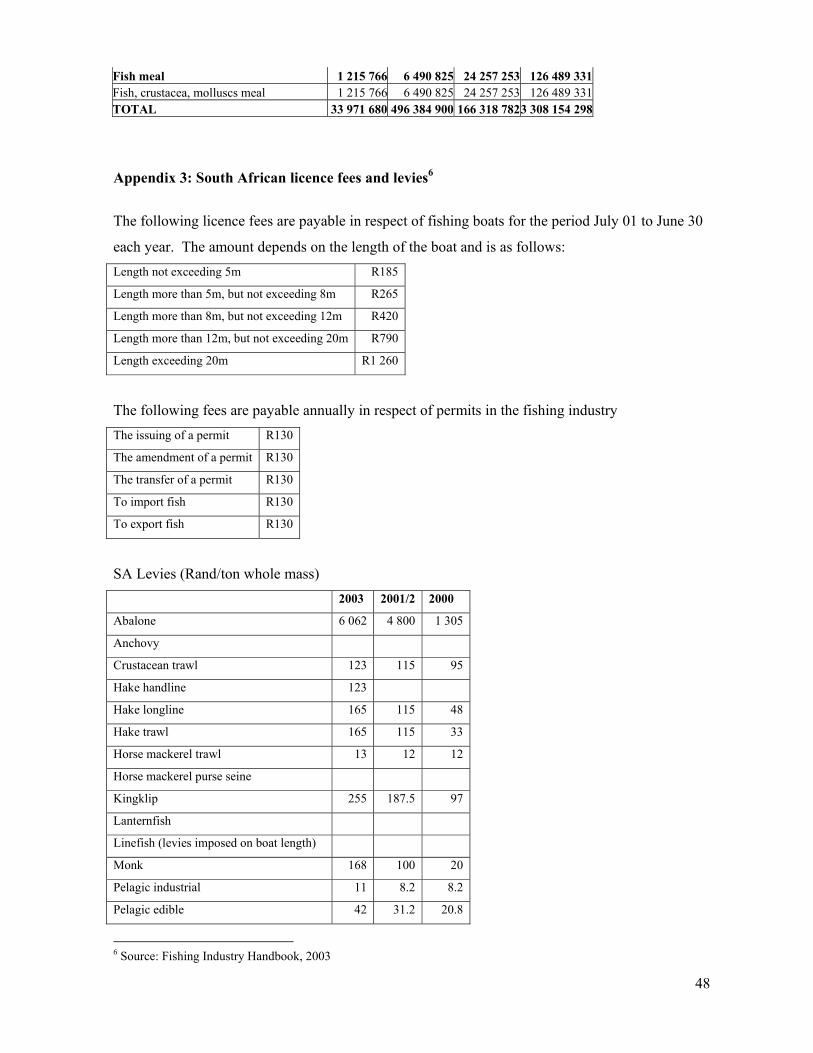
48
Fish meal 1 215 766 6 490 825 24 257 253 126 489 331 Fish, crustacea, molluscs meal 1 215 766 6 490 825 24 257 253 126 489 331 TOTAL 33 971 680 496 384 900 166 318 7823 308 154 298
Appendix 3: South African licence fees and levies6
The following licence fees are payable in respect of fishing boats for the period July 01 to June 30
each year. The amount depends on the length of the boat and is as follows: Length not exceeding 5m R185
Length more than 5m, but not exceeding 8m R265
Length more than 8m, but not exceeding 12m R420
Length more than 12m, but not exceeding 20m R790
Length exceeding 20m R1 260
The following fees are payable annually in respect of permits in the fishing industry The issuing of a permit R130
The amendment of a permit R130
The transfer of a permit R130
To import fish R130
To export fish R130
SA Levies (Rand/ton whole mass) 2003 2001/2 2000
Abalone 6 062 4 800 1 305
Anchovy
Crustacean trawl 123 115 95
Hake handline 123
Hake longline 165 115 48
Hake trawl 165 115 33
Horse mackerel trawl 13 12 12
Horse mackerel purse seine
Kingklip 255 187.5 97
Lanternfish
Linefish (levies imposed on boat length)
Monk 168 100 20
Pelagic industrial 11 8.2 8.2
Pelagic edible 42 31.2 20.8
6 Source: Fishing Industry Handbook, 2003

49
Pilchard
Redeye
Ribbonfish 16 12 10.5
WC rock lobster 3 409 3 000 711
SC rock lobster 2 846 2 250 454
SC rock lobster (tails) 6 325 5 000 979
Seaweed (annual fee) 12 032 10 938
Seaweed (dry)(Laminaria pallida/schinzii) 86 39 35
Seaweed (dry)(Ecklonia maxima) 189
Shark longline 107
Snoek trawl 19 14 14
Sole 251 185 100.5
Squid Jig 311 291 291
Squid trawl 311 291 291
Tuna (pole & line) 107
Levies are payable on the last day of the month following the month in which the fish were landed.
Appendix 4: Size of vessels7
This section focuses on vessels of the primary fishing sector only and is a summary of the survey
results of the ESS report. The table below is an enterprise classification system in terms of capital
value and size.
A micro of small enterprise (SME) is defined as a vessel with a market value of less than R1
million (or replacement value of R3.4 million) and is the only one owned by a single operator, or
group of operators. Also, if a single proprietor, or group of proprietors, own vessels with a market
value less than R1 million (or replacement value of less than R3.4 million), the enterprise is a
SME.
Similarly, a medium scale enterprise consists of one (or more) vessels owned by a single
proprietor, or group, that has a market value of less than R1.74 million (or a replacement value of
R5.8 million).
7 Source: ESS Report (1), 2003

50
Class group
or size
Seize-groups of
vessels
Number of
vessels surveyed
Size group:
Average market
value of vessels
(R million)
Enterprise size:
Average market
value of vessels
(R million)
Estimated
replacement value
(R million)
(factor 3.33)
3m- 5m 445 0.07 0.23
>3m-8m 299 0.17 0.57
>8m-12m 108 0.31 1.03 SME
>12m-14m 60 1.01
0.19
3.36
>14m-18m 173 1.22 4.06
>18m-20m 86 1.53 5.09 Medium
>20m-25m 79 1.74
1.42
5.79
>25m-30m 30 3.60 12.00
>30m035m 18 5.28 17.58 Large
>35m-40m 13 8.28
5.09
27.57
>40m-50m 37 11.67 38.86
>50m-60m 7 10.64 35.43
>60m-70m 9 14.00 46.62 Very Large
>70m 7 20.30
12.91
67.60
Enterprise classification system based on the capital value of vessels surveyed by the ESS.
Source: ESS Report (1), 2003
The table on the following page contains some information about the number of vessels, number of
people employed and average income for the different fishing industries. Looking at the survey
results, the ESS report came to the following conclusions:
1. “On balance, structural adjustment cannot be justified only on grounds that small fishing
companies provide more jobs. (Structural adjustment is the restructuring of the scale of
enterprise distribution usually from big to small.)
2. Black Economic Empowerment can be implemented at all levels and in all fisheries in the
South African fishing industry.
3. As a general rule, if an abuse of market power were suspected it would be better to use the
appropriate instruments created for that purpose by the Competition Act.
4. In all cases from big corporations to micro sized enterprises, the concept and applicability
of a minimum viable quota is important if a ‘paper’ transformation is to be avoided.” (ESS
Report (1), 2003: 112)


![[Varian] Microeconomic Analysis](https://img.pdfslide.net/doc/110x75/5695d4011a28ab9b029fee27/varian-microeconomic-analysis-56c73dc9c2d65.jpg)