Embed Size (px)
Citation preview

E U R O P E A N C E N T R A L B A N K
WO R K I N G PA P E R S E R I E S
EC
B
EZ
B
EK
T
BC
E
EK
P
WORKING PAPER NO. 80
THE MICROSTRUCTURE OFTHE EURO MONEY MARKET
BY PHILIPP HARTMANN,MICHELE MANNA ANDANDRÉS MANZANARES
October 2001

E U R O P E A N C E N T R A L B A N K
WO R K I N G PA P E R S E R I E S
* The authors are grateful to Bruno Biais, who co-authored an earlier version of this paper, for discussions and guidance, Jürgen von Hagen for his encouragement and twoanonymous referees for constructive criticism that helped to improve the paper.They would also like to thank e-MID S.p.A., in particular Francesco Cesarini and Mariella Ghinelli, forproviding the data on the Italian MID system,Vincent Brousseau for some programming tricks,Tom Kokkola, Rita Camporeale, Dieter Reichwein and Stefania Secola for some inputson payment systems and the participants of the ECB conference “The Operational Framework of the Eurosystem and Financial Markets” (May 2000) as well as of the CEIconference “Central Bank Operations:Theory and Evidence” at the Bundesbank in Frankfurt (September 2000) for their comments, particularly their discussants Javier Alonso andJuan Ayuso (both Banco de España), Elisabeth Pauly (Banque de France), Kostas Tsatsaronis (BIS) and Godfried de Vidts (European Repo Council).They also appreciated discussionswith Ulrich Bindseil, Michael Melvin, Cornelia Holthausen and several market participants, in particular Massimo Ciampolini, Andreas Hauschild, Jan Piet Kastelein, Javier Pazos,Bernd Rohde and Pablo Vergara, and the editorial help by Sabine Wiedemann.Any views expressed are only the authors’ own and do not necessarily reflect the views of the ECB orthe Eurosystem. Corresponding author: Philipp Hartmann, ECB, DG Research, Kaiserstraße 29, 60311 Frankfurt, Germany, fax: +49-69-1344 8553, [email protected];Michele Manna, [email protected];Andrés Manzanares, [email protected].
WORKING PAPER NO. 80
THE MICROSTRUCTURE OFTHE EURO MONEY MARKET
BY PHILIPP HARTMANN,MICHELE MANNA AND
ANDRÉS MANZANARES*
October 2001

© European Central Bank, 2001
Address Kaiserstrasse 29
D-60311 Frankfurt am Main
Germany
Postal address Postfach 16 03 19
D-60066 Frankfurt am Main
Germany
Telephone +49 69 1344 0
Internet http://www.ecb.int
Fax +49 69 1344 6000
Telex 411 144 ecb d
All rights reserved.
Reproduction for educational and non-commercial purposes is permitted provided that the source is acknowledged.
The views expressed in this paper are those of the authors and do not necessarily reflect those of the European Central Bank.
ISSN 1561-0810

3
Contents
Abstract 4
Non-technical summary 5
1 Introduction 6
2. The institutional context 92.1 The Eurosystem and monetary policy decisions for the euro area 92.2 The Eurosystem’s framework for monetary policy operations 11
2.2.1 Main refinancing operations 112.2.2 Standing facilities 152.2.3 Minimum reserve requirements 15
2.3 The private market trading environment 162.4 Payment and settlement infrastructure 19
3. Data 213.1 Overnight interest rate quotes 213.2 Eurosystem monetary policy decisions, operations and data releases 243.3 Payment system information 25
4. Empirical results 254.1 Regular intra-week and intraday patterns 264.2 Monetary policy news and events 29
4.2.1 Governing Council meetings and interest rate decisions 294.2.2 M3 releases 324.2.3 Publication of the ECB Monthly Bulletin 33
4.3 Monetary operations and liquidity management 344.3.1 Main refinancing operations 344.3.2 Release of liquidity information on Reuters ECB40 364.3.3 The end of the minimum-reserve maintenance period 364.3.4 Liquidity shocks from Treasury operations 37
4.4 Payment and settlement events 384.4.1 Intraday timing 394.4.2 Main refinancing operation settlement days 404.4.3 Payment system disturbances 40
4.5 The year 2000 changeover week 41
5. Conclusion 42
References 45
Figures 49
Tables 53
European Central Bank Working Paper Series 65
ECB • Work ing Pape r No 80 • Oc tobe r 2001

4 ECB • Work ing Pape r No 80 • Oc tobe r 2001
Abstract This paper provides the first empirical examination of the microstructure of the euro money market, using tick data from brokers located in 6 countries. Special emphasis is put on the institutional environment (monetary policy decisions and their implementation, payment systems and private market structures) and its implications for intraday volatility, quoting activity, trading volume and bid-ask spreads in the overnight deposit segment. Volatility and spreads increase right after ECB monetary policy decisions, but market expectations of the interest rate changes were relatively precise during the sample period. Main refinancing operations with the open market are associated with active liquidity re-allocation, little volatility and no signs of market power or adverse selection. Spreads and volatility were high at the end of the reserve maintenance periods and during the year 2000 changeover. Even intraday, overnight rate levels hardly differ across euro area countries, reflecting active arbitrage and a high degree of integration. JEL CODES: G14, E43, E52, D44 KEYWORDS: euro, financial market microstructure, high-frequency data, liquidity, money market, monetary policy instruments, overnight deposit rates, payment systems, reserve requirements, trading volume, transaction costs, volatility

This paper provides the first broad empirical examination of the microstructure of the euro money market, in
particular its overnight segment, the interbank market for short-term funds. Apart from generally presenting
a perspective on this new market, the main point of the paper is to show how the institutional environment of
it, which is described extensively in the paper, heavily influences its microstructure features. This
institutional environment is composed of 1) the central banks’ interest-setting bodies and their long-term
macro-monetary policy strategy, 2) the instruments for the implementation of monetary policy and for
liquidity management, 3) the private market instruments and trading mechanisms for funds, and 4) the
payment and settlement infrastructure for the transfer of those funds. All four elements can significantly
influence the intraday behaviour of money market rates, trading volumes and bid-ask spreads. Second, the
paper seeks to describe and explain the main features characterising euro overnight interbank deposit
trading. Finally, we deliberately take a euro-area wide, cross-country perspective instead of focusing only on
a single country’s money market and thereby provide information on the degree of integration in the
overnight segment.
Another novel feature is the data we collected for the 5 months between November 1999 and March 2000.
The “heart” of this data set is a continuous (tick-by-tick) record of the quotes for overnight deposits posted
on Reuters by 6 money market “voice” brokers from 4 euro area countries and the UK, plus a continuous
record of all the quotes posted in the Italian electronic brokerage market MID (Market for Interbank
Deposits). These market data are complemented by details about ECB Governing Council meetings, ECB
data releases, Eurosystem monetary policy operations and information about important payment system
events.
The general intraday microstructure analysis shows “two-hump” or “u”-shaped patterns for quoting
frequency and somewhat less pronounced for volatility (analogous, for example, to equity and bond
markets), but a flatter, sometimes rather weakly (single) “hump”-shaped intraday pattern for bid-ask spreads.
High spreads over midday may reflect the lower liquidity of the market around the lunch break (in particular
when coupled with low turnover) and on certain days the arrival of new information.
Moving to the first element of the institutional environment, euro overnight market quoting activity, rate
volatility and spreads are relatively high on days with ECB Governing Council meetings (usually
Thursdays), particularly during midday when the ECB’s interest rate decisions are released. These features
reflect the arrival of important new information for the market associated with monetary policy decisions.
5ECB • Work ing Pape r No 80 • Oc tobe r 2001
Non-technical summary

However, there is no evidence that trading volume dries up before the releases, which is consistent with the
absence of asymmetric information and adverse selection. In fact, rate expectations by the market were
relatively precise over our sample period, with the absolute expectation error in the overnight rate before
monetary policy decisions averaging only about 5 basis points (compared to the usual 25 and 50 basis point
step size in monetary policy decisions). We also found that releases of M3 figures, which relate to the first
pillar of the ECB’s monetary policy strategy, are preceded by a moderate increase in short-term volatility.
But a very short slump in quoting activity in the half-hour before is not accompanied by a similar slump in
trading volume, suggesting only a moderate degree of uncertainty.
Passing to the second component of the money market’s institutional environment, Tuesday’s Eurosystem
main refinancing operations are associated with high MID overnight trading volumes, particularly right after
the announcement of the allotment results. The latter reflects the post-operation liquidity re-allocation
process, which however seems to cause some moderate volatility only for a very short period after the
announcement. Since in addition bid-ask spreads were not particularly high, neither before nor after the
announcements of the tender results, one may conclude that the overnight market functioned fairly
efficiently (without signs of adverse selection or market power) around Eurosystem open market operations.
It is also shown that spreads and volatility tend to be very high at the end of the maintenance period for
Eurosystem minimum reserve requirements, reflecting the high risks involved for banks when staying too
long above or below their reserve targets.
Turning to payment systems, we found that settlement days of Eurosystem main refinancing operations are
characterised by very large market turnovers (at least for the Italian electronic trading system MID).
However, the market seems to transact them with ease and without any increases in trading costs or
volatility. We also argue that some institutional changes related to Economic and Monetary Union (EMU)
led to a balancing of activity between morning and afternoon trading in the Italian overnight segment.
Moreover, payment system disturbances seem to have been extremely rare and benign, so that we could not
detect any strong signs of difficulty in the overnight market related to special events identified for the two
largest euro area payment systems, TARGET and Euro1.
Finally, we also document in the paper that the Y2K changeover led temporarily to very high volatility and
very large bid-ask spreads in the euro overnight market, although the MID did not experience substantial
volume reductions during this relatively risky week.
Perhaps with the exception of some episodes at the time of the Y2K changeover and despite heterogeneities
in the private trading environment, overnight rate differentials between euro area countries seem extremely
small, even intraday, reflecting the very high degree of integration accomplished in this market only shortly
after the introduction of the euro and the unifying forces of the single monetary policy.
6 ECB • Work ing Pape r No 80 • Oc tobe r 2001

1. Introduction
This paper presents the first broad empirical examination of the euro money market’s microstructure,
especially its overnight deposit segment. The introduction of the euro in 1999 provides a unique experience:
the unification of 10 monetary policies into one results in the unification of 10 money markets into a single
one. More than two years after the introduction of the euro, it appears interesting to study the state of the
market, in particular its microeconomic functioning and integration.
In contrast to other financial markets, such as bond, equity or foreign exchange markets, there is only a small
literature touching upon microstructure issues of the money market. In particular papers addressing intraday
features of this market are extremely rare. To our knowledge only Angelini (2000; for the Italian electronic
deposit market before the introduction of the euro) and Furfine (1999, for the US fed funds market) have
presented empirical papers on the intraday behaviour of money markets. Angelini focuses on the
implications risk aversion has on Italian banks’ intraday timing of overnight transactions when periods of
uncertainty about liquidity needs are determined by institutional features of the payment system. Furfine
describes the size, concentration and intraday timing of the fed funds market and analyses bank relationship
patterns in it with special consideration of institutions’ sizes. Most other empirical papers on money markets
follow a traditional macroeconomic approach or look at the time series properties of short rates at a daily (or
longer) frequency (see e.g. Spindt and Hoffmeister, 1988; Griffiths and Winters, 1995, and Hamilton, 1996,
for the US fed funds market and Perez-Quiros and Rodriguez, 2000, as well as Bindseil and Seitz, 2001,
who recently started such work for the euro overnight market).
Some theoretical work by Bhattacharya and Gale (1987) and Bhattacharya and Fulghieri (1994) has
explained the existence of private interbank markets for short-term funds with the need by banks to “re-
insure” against idiosyncratic liquidity shocks coming from their retail depositors. More recent theoretical
work has addressed the issue whether this type of liquidity insurance causes systemic risk in the banking
system (see De Bandt and Hartmann, 2000, for a survey). Finally, Freixas and Holthausen (2001) started to
study the working of international money markets, when information about foreign banks is asymmetric.
This theoretical interbank market literature in general does not tackle the role of regular monetary policy,
central bank operations and regulations in money markets.
However, there is an earlier literature that relates the behaviour of overnight interbank market rates by a
representative bank to monetary policy operational procedures and money market accounting conventions,
notably Ho and Saunders (1985), Campbell (1987) and Spindt and Hoffmeister (1988). More recently,
Bartolini et al. (1998) introduce a role for central bank liquidity provision. Perez-Quiros and Rodriguez
(2000) analyse the behaviour of a representative bank during the minimum reserve maintenance period when
there is a symmetric pair of standing facilities.
7ECB • Work ing Pape r No 80 • Oc tobe r 2001

The present paper has several objectives that distinguish it from the few previous studies. First, it aims at
showing that the microstructure of the money market is heavily influenced by an institutional environment
that can be decomposed in the central banks’ monetary policy decision-making bodies and their policy
strategy; its operational procedures and instruments, such as the central bank open market operations serving
as the main bank refinancing mechanism; the private market trading structures and procedures, such as
“voice” brokers or electronic trading systems; and the payment (and settlement) infrastructure, particularly
the structure and timing of large-value payment systems. Second, it seeks to describe and explain the main
features characterising euro overnight interbank deposit trading, by studying the intra-week and intraday
behaviour of bid-ask spreads, volatility, quoting frequency and – to the extent that it is available – trading
volume observed in the market. Special emphasis is given to the intraday behaviour around key events, such
as monetary policy decisions, M3 releases by the European Central Bank (ECB) and main refinancing
operations (MROs) as well as large liquidity shocks, important settlement days and disturbances in euro area
large-value payment systems. Third, we deliberately take a euro-area wide, cross-country perspective instead
of focusing only on a single country’s money market. In order to enhance our understanding about market
integration and market heterogeneity, we report the results for brokers located in different countries
separately.
To achieve these objectives we have collected two sets of data for the period of November 1999 to March
2000. The first set comprises information about the character and timing of ECB monetary policy decisions
and operations, data releases and payment system events. The second set comprises real-time, tick-by-tick
Reuters price data from 6 “voice” brokers in four euro area countries and one non-euro area country as well
as from the Italian electronic brokering system MID.
The remainder of the paper is organised as follows. The next section gives a broad description of the
institutional environment of the money market, covering the four aspects enumerated above. Section 3
presents the data set collected for the purposes of this study. Section 4 describes and discusses the behaviour
of quoting (tick) frequency, trading volume (where available), mid-rate volatility and bid-ask spreads, both
across the trading week and the trading day, as well as around key money market events. The type of events
considered include ECB interest rate decisions, releases of data on monetary aggregates, ECB Monthly
Bulletin releases, Eurosystem open market operations, ECB releases of market liquidity information, the end
of the maintenance period for the calculation of banks’ minimum reserve requirements, especially large
liquidity shocks from Treasury operations, payment system closing times, regular settlement dates of open
market operations, special events and disturbances in payment systems and the year 2000 (Y2K)
changeover. Section 5 concludes.
8 ECB • Work ing Pape r No 80 • Oc tobe r 2001

2. The institutional context
The institutional environment of the money market can be decomposed in four elements: 1) the central bank
bodies deciding on macro monetary policy and their general policy strategy; 2) the operational framework
for the implementation of the monetary policy and liquidity management by the central bank (monetary
policy instruments, such as open market operations, standing facilities, reserve requirements, etc.); 3) the
private trading environment, including the different financial instruments traded (deposits, repos,
derivatives, etc.), the trading facilities (electronic brokering, electronic information systems, etc.) and the
market organisation (organised exchange vs. over-the-counter market); 4) the payment and settlement
infrastructure (large-value payment systems, securities settlement systems, clearing and netting facilities,
etc.).
The money market is special insofar as the central bank sets the short-term interest rate and acts as the only
ultimate provider of liquidity in a given currency, thereby dominating the supply side. The former is done
through its policy strategy and the latter through its operational framework, which can be used to either
inject or withdraw liquidity from the banking sector. Apart from directly refinancing from the central bank,
money market participants trade with each other to take positions in relation to their short-term interest rate
expectations, to finance their securities trading portfolios (bonds, shares, etc.), to hedge their more long-term
positions with more short-term contracts and to square individual liquidity imbalances resulting from
customer transactions or unsuccessful efforts in central bank refinancing operations. Funds (or securities in
the case of secured markets) are ultimately transferred between the central bank and money market
participants and among the participants themselves through payment (or settlement) systems. Depending on
the financial instrument traded and the respective payment (or settlement) system used, the payment flows
are not generally instantaneous, potentially happening on a day after the related trades, and have certain
patterns during the day. In fact, all the four elements of the institutional environment of the money market
can and do influence the evolution of prices and quantities in the money market. Therefore, the present
section describes these four institutional elements for the euro money market, starting with a short
introduction on the institutional framework for macroeconomic monetary policy decisions.
2.1 The Eurosystem and monetary policy decisions for the euro area
The Eurosystem, composed of the ECB and the 12 central banks of the countries that joined the third stage
of Economic and Monetary Union (EMU), conducts the monetary policy of the euro area.1 Its goal is to
maintain price stability in the euro area, defined as an annual increase of the harmonised consumer price
index (HICP) of the euro area by less than 2%. The monetary policy strategy of the Eurosystem has two
9ECB • Work ing Pape r No 80 • Oc tobe r 2001

pillars: the first pillar assigns a prominent role to money, as reflected by the announcement of a quantitative
reference value for the growth of the M3 monetary aggregate (at the time of writing and during the sample
period considered below a 4.5% growth rate). The second pillar is a broadly based assessment of the outlook
for future price developments, considering a large list of economic indicators.2 The Governing Council of
the ECB is the main policy making entity of the system. It is composed of the 6 ECB Executive Board
members and the 12 governors of the national central banks (NCBs). Council meetings are held every two
weeks (usually) on Thursdays. Whereas the main decisions – in particular on interest rates – are taken by the
Council, monetary policy is implemented by the Board in a decentralised fashion via the NCBs.
Interest rate decisions by the Council are first communicated to the market by a communiqué released at
1.45pm (unless noted otherwise, all times referred to in this paper are Central European Times) on a day of
the Council meetings on the ECB website and to all the major newswire services. Every other Council
meeting is followed by a press conference at 2.30pm, in which the ECB President makes an introductory
statement summarising the meeting and answers questions by the press. The introductory statement by the
President and a transcript of the questions and answers is made available to the public shortly after the press
conference. Table 1 summarises the three ECB interest rate changes during the sample period we are using
below. In two out of three cases rate changes have been decided during Council meetings followed by a
press conference. However, on 16 March 2000 rates were changed for the first time at a Council meeting
without press conference.
Table 1: ECB interest rate changes between November 1999 and March 2000
New MRO
rate effective
on
Previous ECB policy rates New ECB policy rates Decision
on
Deposit
rate (%)
MRO rate
(%)
Marg.lend.
rate (%)
Deposit
rate (%)
MRO rate
(%)
Marg.lend.
rate (%)
4 Nov 99 12 Nov 99 1.50 2.50 3.50 2.00 3.00 4.00
3 Feb 00 8 Feb 00 2.00 3.00 4.00 2.25 3.25 4.25
16 Mar 00 21 Mar 00 2.25 3.25 4.25 2.50 3.50 4.50
Note: MRO=main refinancing operation Source: ECB
The ECB publishes data related to its monetary policy strategy. Towards the end of each month new figures
on M3 (referring to the preceding month) are released at a given day around 10am, which the market can
1 Greece joined the euro area on 1 January 2001. However, the empirical analysis below relates to data when the EMU was still composed by 11 countries. 2 See Angeloni, Gaspar and Tristani (1999) and ECB (1999a) for in-depth discussions of the ECB monetary policy strategy.
10 ECB • Work ing Pape r No 80 • Oc tobe r 2001

then put in relation to the monetary reference value.3 Moreover, the ECB publishes a Monthly Bulletin with
a host of macroeconomic data and monetary analysis, including information on the second pillar of its
monetary policy strategy. During the sample period considered in this paper, the Bulletin was usually
released on the ECB website on the Thursday of the second week of each month at 7pm.4
2.2 The Eurosystem’s framework for monetary policy operations
The operational framework for monetary policy can be defined as the set of instruments and procedures that
a central bank uses to implement its monetary policy by managing the liquidity situation in the money
market and steering money market interest rates. Following a fairly standard taxonomy, we will classify the
instruments used by the Eurosystem as open market operations (addressed in 2.2.1 below), standing facilities
(2.2.2) and reserve requirements (2.2.3).5 Open market operations are the general instruments used to
manage the liquidity situation and to steer interest rates. Among them, and as suggested by their name, the
main refinancing operations (MROs) are entrusted with the task of providing the bulk of liquidity to the
banking system, raising their role to the key operational monetary policy instrument. (During our sample
period the amounts allotted in MROs varied between EUR 50 and 100 billion; see also Figure 3 below.)
Additional liquidity is placed through the longer-term refinancing operations. These are operations
conducted regularly by means of monthly tenders for reverse transactions with a maturity of three months.
However, as a rule the Eurosystem will not use this instrument to signal monetary policy intentions to the
market and conducts them as variable rate tenders (with a multiple rate procedure and pre-announced
intended allotment volumes). The Eurosystem may also carry out fine-tuning operations on an ad hoc basis
to smooth interest rate movements. During our sample period only one fine-tuning operation in the form of a
collection of fixed-term deposits was conducted on 5 January 2000, with the aim to absorb some excess
liquidity in the aftermath of the millennium date change. Finally, the Eurosystem may conduct also
structural operations to modify its net liquidity position vis-à-vis the banking system over a longer period.
So far, the Eurosystem has not conducted any structural operations. In this paper we will focus on the main
refinancing open market operations.
2.2.1 Main refinancing operations
In the light of their prominent role, it may be useful to examine in some greater detail the MROs. These
operations are conducted in the form of weekly tenders for repurchase agreements (repos) with a maturity of
3 During the sample period used in the empirical analysis the ECB did not formally pre-announce the release dates of new M3 data, although it was known in the market that they would occur around the 20th of a month. It follows that the market was somewhat uncertain about the exact day of the release. As of July 2001, the ECB announces M3 publication dates in advance. 4 The Monthly Bulletin is now normally released on Thursday morning at 10am. 5 A comprehensive description of the Eurosystem’s operational framework is given in ECB (2000c). The following contains an extensively abridged overview over ECB operations. An analysis of the operational framework of the Eurosystem in the context of the ECB’s monetary policy strategy is presented in Manna, Pill and Quirós (2001). Escrivá and Fagan (1996), Borio (1997) and
11ECB • Work ing Pape r No 80 • Oc tobe r 2001

two weeks.6 For reasons of effective policy signalling to the market, the auction has been conducted as a
fixed (single) rate tender during our sample period.7 In this tender procedure the ECB determined the overall
quantity to be allotted on the basis of its own assessment of the liquidity needed by the banking system,
including an internal liquidity forecast.8 This quantity was divided pro rata among all bidders against eligible
collateral through credits on their reserve accounts.9 If it perceives that there are inflationary pressures the
ECB can, in theory, choose to allocate less liquidity to the open market, either by reducing the total amount
allocated or by raising the MRO rate. However, the main policy tool used by the Governing Council is the
MRO rate. Allotment decisions are taken by the Executive Board of the ECB on an operational level.
Figure 1: ECB information about the money market liquidity situation on Reuters page “ECB40” – the example of 8 February 2000 detailing the situation on 7 February 08:09 08FEB00 EUROPEAN CENTRAL BANK, FRANKFURT a.M. GE66608 ECB40 Current account holdings of counterparties with the Eurosystem Including holdings to fulfil reserve requirements. In million of euro. As at 07/02/2000 (Maintenance period: 24/01/2000 to 23/02/2000) Current account holdings (*) 109,057 Estimated reserve requirements (**) 107,500 Average current account holdings in current maintenance period (*) 108,689 Use of the standing facilities of the Eurosystem: Use of marginal lending facility 11 Use of deposit facility 61 (*) Including minimum reserve holdings. For historical data see ECB41. (**) Preliminary estimate of reserve requirements for the current MP Note: The time stamp at the upper left-hand corner of each page reprinted here refers to Greenwich Mean Time, so that one hour needs to be added for Central European Time. Source: ECB, Reuters
Blenck (2000) offer broad descriptions and comparisons of major central banks’ operational frameworks for monetary policy and liquidity management. 6 Repos are financial instruments for the temporary exchange of cash against securities with a transfer of ownership. The operations can also be conducted in the form of collateralised loans in which the ownership of securities is not transferred. The specific form used should not have any impact on the economic results of the operation. 7 On 8 June 2000 the Governing Council of the ECB decided to switch from the fixed-rate tender regime to a variable-rate tender regime for MROs (ECB, 2000b). Since then MROs have been conducted as multiple-rate (“American”) auction, i.e. bidders are served going down from the highest rates bid to the lowest onesat the rates they effectively bid in the auction until the quantity to be allotted is exhausted. The timetable, the allotment decision and the announcement of the results are the same as in the fixed-rate tender procedure. The main policy rate is now a pre-announced minimum bid rate. The main reason for the change in tender procedure by the Eurosystem was the worsening over-bidding occurring in the fixed-rate tenders. In this paper we will restrict ourselves to the functioning of the market under the fixed-rate regime that characterised the first one and a half years of stage 3 of EMU. 8 Whereas the internal forecast was not published under the fixed-rate regime for MROs, the Eurosystem is now indicating the expected liquidity needs of the banking system in the announcements of the variable-rate auctions. 9 There are two tiers of eligible collateral. Tier 1 consists of marketable debt instruments, which are relevant for the entire euro zone. Tier 2 includes both marketable and non-marketable assets (including equities), which are of particular importance for the respective national financial markets and banking systems. No distinction is made between the two tiers with regard to their eligibility for the various types of Eurosystem monetary policy operations.
12 ECB • Work ing Pape r No 80 • Oc tobe r 2001

Whereas under the fixed rate tender regime the ECB did not publish its liquidity forecast, every day - at
9.15am at the latest - it publishedon Reuters page ECB40 the aggregate reserve account holdings of the
banking sector with the Eurosystem on the previous day, its average reserve account holdings since the start
of the minimum reserve maintenance period and its aggregate recourse to the standing facilities. As pointed
out by Vergara (2000), ECB40 is an important daily input for money market traders in general, and many
market participants use the information on the liquidity situation of the overnight market for the
determination of their bids before the 9.30am main-refinancing auction cut-off time. Figure 1 gives an
example of this page. In addition, once a week – (usually) on Tuesday at 3pm – the ECB releases the weekly
balance sheet of the Eurosystem, referring to the stock figures of the preceding Friday.
The weekly MROs are usually (but not always) held on Tuesdays. The rate applied in the MROs is
determined by the latest Governing Council decision on the MRO rate, i.e. at the latest at the last Thursday
before the next auction. The timing of the auction itself is the following:
(i) On Monday around 3.30pm, the day before, the ECB announces the operation and its conditions on
Reuters and other wire services. The announcement contains a reconfirmation of the rate and some standard
MRO properties, such as the type of operation, the maturity, the timing for bids and the minimum bid size
(see the top of Figure 2 for an example of the relevant Reuters page ECB16). Normally, these MRO
announcements do not contain news for the market;
(ii) Banks can submit bids to their respective NCB until 9:30am on Tuesday, the day of the auction, which
are then transferred to the ECB for the derivation of allotments. So, the information provided on page
ECB40 at 9:15am at the latest can be used to fine-tune the bids;
(iii) At around 11:15am on Tuesday the result of the auction is announced again on Reuters (page ECB17 or
ECB18). As shown at the bottom of Figure 2, the allotment announcement includes, inter alia, the total
number of bidders (equivalent to the number of bids in fixed rate tenders), the total amount bid, the total
amount allotted and the so-called allotment ratio (the ratio between the amount allotted and the amount bid).
In contrast to the auction announcement described under (i) above, the allotment announcement does contain
information for the market, particularly the overall quantities bid and allotted.
Figure 3 plots the total amounts allotted against the total amounts bid for the 20 MROs between 1 November
1999 and 23 March 2000. The figure indicates that the amounts bid were weakly increasing in the total
amount allotted and, in any case, much larger than the allotments. This is a reflection of the so-called
overbidding behaviour. As the auctions were carried out in the form of fixed rate tenders during the sample
period and since the four months coincided with expectations of rising interest rates, demand usually
exceeded supply and liquidity was allocated according to the pro-rata rule. Anticipating such rationing,
13ECB • Work ing Pape r No 80 • Oc tobe r 2001

banks tended to “overbid”, i.e. to demand more than they actually needed. The overbidding behaviour is thus
at least partly the realisation of self-fulfilling expectations, whereas for each bank - to the extent that the
amount bid by the others and the total amount allotted are uncertain - the rationing rate is random ex ante.10
Figure 2: ECB auction information on Reuters pages “ECB16” and “ECB17” – the example of the main refinancing operation on 8 February 2000 14:43 07FEB00 EUROPEAN CENTRAL BANK, FRANKFURT a.M. GE66608 ECB16 Main Refinancing Operation – Announcement Reference number: 20000009 Min Allotment: Transaction Type: Reverse Transactions Fixed Rate: 3.25 % Operation Type: Liquidity Providing Min Bid Amount: 1.00 mn Procedure: Standard Tender Max Bid Limit: Start Date: 09/02/2000 Maturity Date: 23/02/2000 Duration (days): 14 Auction Type: Fixed Rate Tender Allotment Method: Single Rate 10:18 08FEB00 EUROPEAN CENTRAL BANK, FRANKFURT a.M. GE66608 ECB17 Main Refinancing Operation – Allotment Reference Number: 20000009 Min Allotment: Transaction Type: Reverse Transactions Fixed Rate: 3.25 % Operation Type: Liquidity Providing Max Bid Limit: Procedure: Standard Tender Tender Date: 08/02/2000 % of Allot.: 6.37 Start Date: 09/02/2000 Tot Amount Allotted: 66000.00 mn Maturity Date: 32/02/2000 Duration (days): 14 Tot Bid Amount: 1036647.80 mn Tot Number of Bidders: 686 Auction Type: Fixed Rate Tender Allotment Method: Single Rate Note: The time stamp at the upper left-hand corner of each page reprinted here refers to Greenwich Mean Time, so that one hour needs to be added for Central European Time. Source: ECB, Reuters
[FIGURE 3 ABOUT HERE]
Figure 3 also shows (with dates) the last MROs before ECB rate increases. It appears that before these
policy moves bids tended to be high, but not necessarily the quantities allotted. This observation is
consistent with the market having correctly anticipated the rate increases and attempted to get as much
“cheap” refinancing as possible before the rate rises (see also sub-section 4.2.1 below). The “smallest” bid
amount was received on the 11th of January, the first refinancing operation after the century date change
(also indicated with a date in Figure 3).
10 See Bindseil and Mercier (1999) for a general discussion of the bidding behaviour in Eurosystem fixed rate auctions and Nautz and Oechsler (1999), Ayuso and Repullo (2000), Breitung and Nautz (2000) and Ehrhart (2000) for critical analyses of the over-
14 ECB • Work ing Pape r No 80 • Oc tobe r 2001

2.2.2 Standing facilities
One function of the standing facilities is to provide or absorb liquidity with an overnight maturity when
unforeseen liquidity shocks occur. Therefore they provide a type of insurance mechanism for banks, but at
penalty interest rates. The initiative in these transactions is on the side of the counterparty. Notably, a
Eurosystem counterparty may use the marginal lending facility to obtain (against eligible collateral)
overnight liquidity in case of an individual shortage, whereas it may use the deposit facility to make deposits
in case of individual excess liquidity. If a counterparty ends the day with an overdraft position on its
TARGET account with a NCB (see 2.4 below), then the intra-day credit is automatically transformed into an
overnight loan via a recourse to the marginal lending facility. The fact that the access to the standing
facilities on a given day is not subject to rationing (provided adequate collateral is posted in the case of
recourse to the marginal lending facility) makes the corresponding interest rates effectively bound the
overnight market interest rate, creating a “corridor”. Therefore another function of the two standing facilities
is to contribute steering interbank market rates in case of larger aggregate liquidity imbalances. For example,
towards the end of the reserve maintenance period (see 2.2.3 below) or in extreme market situations like the
Y2K changeover week (see 4.5 below) such imbalances may temporarily occur.
2.2.3 Minimum reserve requirements
The third component of the operational framework of the Eurosystem that influences the market
microstructure are the reserve requirements. They aim at (i) stabilising money market interest rates without
recourse to frequent central bank open market operations, and (ii) creating or enlarging the structural
liquidity shortage of the banking sector to increase the effectiveness of monetary policy actions (ECB,
2000c). According to the current regime, all credit institutions established in the euro area have to keep 2%
of the total amount of overnight deposits, other deposits with maturity below 2 years, debt securities with
maturity below 2 years and money market paper held by institutions and individuals not subject to the
Eurosystem reserve requirement system (i.e. excluding interbank liabilities) at reserve accounts with
national central banks. These reserves are remunerated at the daily average of MRO rates (over the
respective reserve maintenance period). Reserve requirements have to be fulfilled on average over a one-
month maintenance period (“averaging”) that runs from the 24th of a month to the 23rd of the following
month.
The amount of reserves required and held is significant, in the order of EUR 100-110 billion during the
period considered. So they provide a buffer against unexpected liquidity shocks, mitigating the related
fluctuations of market rates. However, the stabilising effect of the averagingprovision, which requires banks
to anticipate potential liquidity shocks and plan the holding of liquid funds carefully, becomes weaker and
eventually vanishes towards the end of the reserve maintenance period, when banks are no longer in a
bidding phenomenon.
15ECB • Work ing Pape r No 80 • Oc tobe r 2001

position to transfer reserve surpluses or deficits to the future. This is well illustrated by the plot of broker
overnight rates in the euro area between November 1999 and March 2000 displayed in Figure 4 further
below. At or shortly before the 23rd of each month euro overnight rates either exhibit a short trough (excess
liquidity compared to the required reserves) or a short peak (shortage of liquidity). On the basis of daily
data, Perez-Quiros and Rodriguez (2000) argue that the introduction of a “symmetric” pair of standing
facilities by the Eurosystem (see 2.2.2 above) has effectively led to a reduction of this volatility and also to a
more symmetric distribution of it. (Figure 4 below illustrates the relatively balanced occurrence of troughs
and peaks around the five end-of-maintenance period episodes during our sample period.)
2.3 The private market trading environment
In a broad sense, the money market is delimited as the market for short-term funds, usually with maturity up
to one year. In this paper we focus on the overnight interbank deposit market, which is of particular interest
to the liquidity management of the central bank. With an estimated (minimum) daily turnover of EUR 61
billion in the second quarter of 1999 it is by far the largest spot segment of the money market in the euro
area. (This figure is taken from an ECB Market Operations Committee Survey covering Belgium, Finland,
France, Germany, Ireland, Italy, Portugal and Spain, which is summarised in Santillán et al., 2000, annex 2,
table 1.) Other segments of the money market include (i) unsecured deposit contracts “tomorrow next”
(overnight contracts for the following day until the next day), and with 1-week, 2-week, 1-month, 3-month,
6-month and 1-year maturity, (ii) repurchase agreements (“repos”, reverse transactions secured by securities)
also ranging from overnight to 1 year, (iii) short-term forward (up to 1 year) interest rate agreements and
(exchange-traded) futures, (iv) foreign currency swaps at the same maturities as for unsecured deposits and
repos, and (v) interest rate swaps ranging from 1 week to 1-year maturity, (vi) bank certificates of deposits,
(vii) commercial paper and (viii) Treasury bills (short-term government debt securities and options).
According to the 1999 ECB survey, unsecured overnight deposit trading exceeded trading in any of the other
segments by a factor of at least 4 and for most of the segments by much more (Santillán et al., 2000, annex
2, table 1). A more recent ECB survey detailing data for the second quarter of 2000 shows that deposit
trading up to 1 week maturity has partly caught up in size (ECB, 2001, pp. 9f.).
The relative importance of the different contracts can vary substantially between countries in the euro area.
For example, whereas during our sample period there were active repo markets in Belgium, Finland, France,
Germany, Italy and Spain, they were hardly developed in other euro area countries. The leading euro futures
contract, the 3-month EURIBOR, is mainly traded on the London International Financial Futures and
Options Exchange (LIFFE), even outside the euro area. However, the strong growth of the overnight
segment since the start of stage 3 of EMU, particularly for cross-border transactions, seems to have been
relatively uniform across countries in the euro area. This reflects in part the interbank market’s role in
reallocating liquidity after Eurosystem MROs in the case that some banks received a larger allotment than
16 ECB • Work ing Pape r No 80 • Oc tobe r 2001

needed and other banks received a lower allotment than needed. (As described in 2.2.1, these imbalances
could occur under the fixed-rate tender regime because of individual banks’ uncertainty about the ECB’s
total allotments and other banks’ bid sizes.) It also reflects the effective functioning of short-term interest
rate arbitrage and liquidity equalisation across the euro area (also in the case of asymmetric liquidity
shocks). Regarding trading hours, which seem to be rather homogenous since the introduction of the euro
across the area, the overnight deposit market opens at around 8 in the morning and closes at around 17.45 in
the afternoon. (This schedule is closely related to that of TARGET explained below.)
Most of the contracts enumerated above are traded over-the-counter, in contrast to the futures for example,
that are traded on the derivative exchanges in various European financial centres. As for other financial
markets, such as foreign exchange markets or bond markets, trading can be bilateral over the phone or
through electronic market communication facilities (such as Reuters) or through “voice” brokers matching
counterparties or even through electronic brokering systems. Again the relative importance of the different
market trading facilities can be very different from country to country, from trader to trader and even for a
given trader over time. Also, government securities and commercial paper tend to be traded separately from
interbank deposits.
Focusing again on the unsecured euro deposit market, at one extreme of the trading infrastructure is certainly
the Italian electronic broker market MID (Market for Interbank Deposits, run by e-MID S.p.A., Milan). In
February 2000 MID had 182 Italian member banks and 7 foreign member banks, participating in trading
with very different degrees of involvement. In this system, which covers virtually the entire existing
domestic overnight deposit market in Italy, transactions between members are clinched automatically, when
the respective rates (offered or bid) and quantities match, provided that credit limits are not exhausted. (The
repo market happens outside this system though.) However, as in the case of other euro area countries,
cross-border trades by Italian banks are still mostly executed via “voice” brokers in the target countries or
through direct bilateral transactions. In Spain, most of overnight deposit (and short-term repo) trading is
executed via 4 main “voice” brokers. By definition, brokers generally do not trade on their own account, but
collect desired trading prices and quantities from some customers to match them with other customers
against a fee. Many money market brokers (in Spain or elsewhere) also post indicative bid and ask prices on
electronic market information systems, such as Reuters, Bloomberg or Telerate. Most of the remaining
transactions in Spain (in particular for maturities beyond 1 month) are undertaken bilaterally through
electronic market dealing systems. After some consolidation in the last years, there remain less than a dozen
of main dealers driving money market trading in Spain.
In France brokers are also used, but the bulk of the transactions takes place over the phone. France is known
to have a very active overnight market and the most developed repo market with relatively narrow traded
bid-ask spreads. In fact, the Banque de France (1999, p. 54f.) underlines the role of the French euro money
17ECB • Work ing Pape r No 80 • Oc tobe r 2001

market as a hub in distributing liquidity within the euro area. It reports figures showing that 40% of the
turnover by the large players asked for their rates to calculate EONIA (the standardised daily euro overnight
reference rate) had at least one French bank on one side of the transaction.11 In Germany interbank deposit
trading is dominated by the 4 large German commercial banks and the semi-public Landesbanken. However,
most of these main players tend to have a euro-area wide approach rather than focusing on domestic trading.
The larger part of transactions tends to be undertaken directly between traders (over the phone) and only a
smaller part through “voice” brokers. The Deutsche Bundesbank (2000, p. 23f.) also observes that Germany
plays a key role in the distribution of liquidity between the euro area and the EU countries that did not join
EMU in the first wave, notably the UK with its large international financial markets in London. (These
countries have (limited) access to euro intraday liquidity through the Eurosystem’s TARGET payment
system.12) Finally, in the Netherlands the upper tier of players driving the deposit market is again composed
of the 4 large Dutch commercial banks. The bulk of the trading is undertaken via bilateral communication,
particularly through Reuters Dealing, and the rest through “voice” brokers, not only located in the
Netherlands. The 4 large Dutch banks tend to do more than half of their business with counterparties located
in another euro area country, whereas 2nd tier institutions are much less active in this regard. Overnight
deposit trading strategies between the main Dutch players tend to be fairly diverse.
In sum, in spite of the important cross-border activity in the unsecured euro interbank deposit market, there
remain heterogeneities in the private trading environment. However, these remaining heterogeneities, which
mainly result from different traditions and market structures that prevailed before the introduction of the
common currency, do not necessarily imply inefficiency or non-integration. On the contrary, Figure 4 below
illustrates how close overnight rates of brokers located in different countries tend to be, except in extreme
circumstances like the year 2000 (Y2K) changeover week. Some of the heterogeneities, such as electronic
trading versus “voice” broker or telephone trading, do compete with each other, and only the future will
show whether this competition will lead to more uniform trading structures in the euro money market or
11 EONIA stands for “euro overnight index average”, an index sponsored by a number of European banking and financial associations to measure the effective cost of unsecured overnight money for the euro area. It is calculated daily as a volume-weighted average of unsecured euro overnight deposit contract rates, as reported by a representative panel of 49 large banks from euro area countries (41), other EU countries (4) and overseas (4 with important operations in the euro area), including the main market makers. The index is calculated each business day from all overnight transactions carried out by panel banks between the opening of trading in the euro interbank market and the closing of the respective RTGS system. It is published no later than the opening of the following business day. EURIBORs (Euro Interbank Offered Rates), various reference rates for term deposits (1 week to 1 year) also sponsored by those associations, are published at 11am each business day on the basis of panel banks’ contributions shortly before that time. They are based on simple averages of quoted offer rates only (corrected for the extremes). More information on EONIA and the EURIBORs is available from http://www.euribor.org. 12 The current non-euro area EU countries (“pre-ins”) have a full connection to TARGET. According to the conditions for such a connection, the pre-in NCBs can acquire funds up to a certain aggregate limit on the basis of arrangements with private banks located in the euro area to offer intraday liquidity in euro to their domestic credit institutions (up to another maximum amount per bank). The collateral required to secure such external intraday overdrafts in euro has the same quality standards as the assets eligible in the euro area, but it can also be denominated in the respective home currency. The provision of intraday credit in domestic currency to a foreign country is by international standards a very special arrangement, as it is the first time a major central bank has allowed central banks belonging to other currency areas to provide settlement facilities in its own currency. See ECB (1998a) for further details. However, large internationally active banks from non-euro area EU countries that have branches or subsidiaries in the
18 ECB • Work ing Pape r No 80 • Oc tobe r 2001

whether important differences continue to exist. For example, one important issue is whether truly euro-area
wide electronic trading systems will emerge that attract the bulk of the transactions.13
2.4 Payment and settlement infrastructure
Payment and settlement refer to the effective transfer of funds and securities in relation to all types of
monetary and financial transactions to achieve “finality”. In particular, without efficient and safe large-value
payment and securities settlement systems monetary and financial integration is virtually impossible to
achieve, since interest rate or price differentials would occur, because of the impossibility or cost of
transferring funds for arbitrage purposes. In particular, important short-term interest rate differentials in the
euro money market would endanger the singleness of monetary policy, which is implemented through a
single short-term interest rate for the entirety of the euro area. For this reason, among others, the Eurosystem
has introduced TARGET at the start of stage 3 of EMU, the Trans-European Automated Real-time Gross
settlement Express Transfer system, which is composed of the 15 domestic RTGS (real-time gross
settlement) systems in the EU, a network of bilateral links (interlinking mechanism) between them and the
ECB payment mechanism.
Table 2: Main large-value payment systems in the euro area in 1999
(daily averages, value of payments in EUR bn. / number of payments in ‘000)
System 1st quarter 2nd quarter 3rd quarter 4th quarter
TARGET Total 964 / 155 906 / 158 884 / 163 947 / 176
Domestic 615 / 130 554 / 130 530 / 133 562 / 144
Cross-border 349 / 25 351 / 28 354 / 30 386 / 32
Euro1 175 / 52 166 / 65 168 / 72 175 / 83
EAF 172 / 48 147 / 45 141 / 46 143 / 48
PNS 92 / 22 94 / 20 89 / 19 97 / 19
Source: ECB (2000a)
The private sector, more precisely the Euro Banking Association (EBA), has introduced a parallel area-wide
net settlement system, Euro1 (a successor of the previous ECU clearing and settlement system). In addition,
there exist two relatively important national hybrid systems (combining features of net and gross settlement),
namely EAF (Euro Access Frankfurt) in Germany and PNS (Paris Net Settlement) in France.14 Table 2
exhibits the relative use of these systems during the first year of EMU. It turns out that TARGET and Euro1
euro area would not need to go through their respective NCBs to receive intraday liquidity for euro payments. They could also benefit directly from their branches’ or subsidiaries’ access to TARGET intraday overdrafts. 13 For an elaborate pre-EMU perspective on money market integration in Europe, also based on interest rate differentials, see Eijffinger and Lemmen (1995). 14 Other purely national systems are of rather minor importance compared to the overall payment traffic in the euro area.
19ECB • Work ing Pape r No 80 • Oc tobe r 2001

are the two dominant large-value payment systems for euro-area cross-border transactions. TARGET leads
in terms of the value of transactions and Euro1 in terms of the number of transactions executed. This reflects
the behaviour by market participants to use the “safer” RTGS system TARGET for larger cross-border
transactions and the “cheaper” net settlement system Euro1 for smaller cross-border transactions. (The
average transaction size in each system and period can be easily derived by dividing the average value of
transactions (left figures) by the average number of transactions (right figures).)
The functioning of this payments infrastructure can influence euro overnight deposit trading in various ways.
First, trading in the money market can be adversely affected in case of technical problems in any of the
major systems or by any of the participants in these systems. For example, if information about a computer
problem in a large bank becomes known to the market, preventing it from making payments, trading might
halt and bid-ask spreads increase.15 We will therefore examine below whether the euro overnight market
exhibited any special features on days when particular events or problems in either Euro1 or TARGET
occurred. Second, current payment systems have procedures in place to close the system at the end of the
day without any participant remaining with unsettled payment obligations. As well described by Angelini
(2000) for the Italian net settlement system, the timing of these end-of-day procedures can generate certain
intraday trading patterns. For example, only at the time of closing of the net settlement system (defined as
the “cut-off time” for new payments) banks will know with certainty their final net balance to be settled.
This can lead to increased and more aggressive trading behaviour, as reflected for example by intraday
overnight rate volatility, immediately after the net system’s closing. Similarly, in an RTGS banks can have
incentives to delay payments during the day in order to economise on liquidity and gain flexibility for
securities trading. This can lead to enhanced trading before the closing of the RTGS system (see e.g.
Deutsche Bundesbank, 2000, p. 23).16
In the euro area Euro1 is scheduled to close at 4pm (and similarly the two domestic systems EAF and PNS).
This means that no new payments can be entered in the system. Any remaining open settlement obligations
at this “cut-off time” have to be settled afterwards through TARGET, following a standard end-of-day
settlement procedure that can sometimes take more than an hour. The real-time gross system TARGET
closes at 6pm. In the empirical section we will examine whether enhanced money market activity or
volatility can be identified during the European afternoon. Finally, we will also look for special effects on
the settlement days of the Eurosystem’s large MROs, usually on Wednesdays.
15 See De Bandt and Hartmann (2000, sections 3.3 and 4.3) for a discussion of “systemic risk” in payment systems and a survey of the literature. 16 At present none of the euro area large-value payment systems provides intraday information on balances of participating banks or information on queued payments.
20 ECB • Work ing Pape r No 80 • Oc tobe r 2001

3. Data
In order to study in greater depth the microstructure features of the euro money market and their links to the
institutional environment described above, we have collected for the months of November 1999 through
March 2000 an intraday data set of overnight deposit rate quotes, details about ECB Governing Council
meetings, ECB data releases, Eurosystem monetary policy operations and information about important
payment system events. The present section briefly describes this dataset.
3.1 Overnight interest rate quotes
The “heart” of the data set is a continuous (tick-by-tick) record of the quotes for overnight deposits posted
on Reuters by 6 money market “voice” brokers from 4 euro area countries and the UK, plus a continuous
record of all the quotes posted in the Italian electronic brokerage market MID. The recording started with the
beginning of trading on 3 November 1999 in the morning and it finished with the stop of trading in the early
evening of 23 March 2000, altogether including 101 trading days. The “voice” brokers covered are C.
Kliemm Gmbh (Frankfurt/Germany, denoted KLIEMMM), Geldhandels Gmbh (Frankfurt/Germany,
denoted GEHA), Liberty Grel (Paris/France, denoted GREL), Prebon Yamane (Amsterdam/Netherlands,
denoted PYWMEURO), Prebon Yamane (London/England, denoted PYEC), Corretaje e Información
Monetaria y de Divisas (Madrid/Spain, denoted CIMV). All the 6 brokers are major players, at least within
their own domestic market.17
For reasons of homogeneity with these “regular” broker data, we use mainly the quoted rates (“proposte”) in
the Italian electronic broker system MID described in 2.3 above, occasionally extended by transactions
volumes (from the “contratti” file). However, the MID quotes are still different from the quotes of the six
“regular” brokers. In particular, since it registers all quotes by members on its screen, including many that
are dominated by other quotes at a given point in time, whereas the “regular” brokers only post indicative
pairs of bid and ask quotes from time to time on Reuters, the available MID quote data are much more
frequent than the other available data. As a first step, we therefore eliminated all dominated quotes at any
given point in time, thereby deriving the best bid and best ask rate prevailing at any point in time. This
procedure also eliminates all domestic arbitrage possibilities for Italy and defines a “market spread” for the
MID. We call the new series emerging from this procedure “MID-best”. Although regular “voice” brokers’
bid-ask quotes might also be regarded as approximations of market spreads, we will treat them separately
from the MID-best data below, where necessary, since their still much lower frequency might imply more
structural differences for which one might not be able to control.
17 The selection of brokers was determined by the accessibility of their pages through a general Reuters subscription.
21ECB • Work ing Pape r No 80 • Oc tobe r 2001

Table 3 shows some summary statistics for all the 7 brokers. It appears that most of the “voice” brokers are
comparable in terms of the frequency with which they post quotes on Reuters, except for the French GREL,
which seems to be less active in updating its Reuters page, and the London-based PYEC, which seems to be
more active. As indicated to us by market participants, the latter may be related to the very active use of the
euro overnight market in London for the financing of trading portfolios. The former may be either related to
this broker’s especially slow way to update its page or to a generally higher share of direct interbank money
market trading compared to brokered trading in France.
The MID-best ticks series shows how much larger quoting frequency is, when all rates in the market can be
considered. In other words, the money market is not as “sleepy” as it looks from the Reuters broker pages.
Average quoted bid-ask spreads seem to be of a similar order of magnitude across brokers (roughly 4 to 5
basis points), except – again – for GREL (7 basis points) and the Spanish CIMV (10 basis points). The two
“outliers” illustrate that there can be different conventions for quoted spreads between brokers or countries.
Of course, when there is competition and arbitrage activity the implied overnight rate differences cannot be
present in the traded rates. It is also instructive to observe that the MID spreads, derived from “best” quotes,
are only slightly narrower than the spreads by GEHA, KLIEMMM, PYEC and PYWMEURO. In other
words, although only indicative the rates by these four brokers must still be relatively close to competitively
traded rates and they must also be relatively close to the actual market spread.
Table 3: Summary statistics of broker overnight rate data, whole sample
Broker Total ticks Average bid-ask spread Mid-rate volatility
GREL (FR) 144 7.0 2.8
KLIEMMM (DE) 712 4.5 1.8
GEHA (DE) 704 4.4 1.8
CIMV (ES) 648 10.2 2.0
PYWMEURO (NL) 530 4.9 2.4
PYEC (UK) 1144 5.3 1.9
MID-best (IT) 8510 3.7 2.3
Note: The average bid-ask spread is the ask rate minus the bid rate for each quote, averaged over the whole sample. The mid-rate volatility is the standard deviation over all intraday period mid rates. Source: Reuters, e-MID, authors’ calculations
Finally, intraday overnight rate volatility is of similar order of magnitude across countries/brokers but not
entirely uniform. For example, the French data from GREL show the largest deviation from other brokers.
Interestingly, the two German brokers (KLIEMMM and GEHA) quote identically volatile overnight rates,
whereas the two Prebon Yamane brokers – located in two different countries, the Netherlands
(PYWMEURO) and the UK (PYEC) – quote rates that show some differences in volatility. This observation
indicates that some of the volatility differences between brokers might have a country component. For
22 ECB • Work ing Pape r No 80 • Oc tobe r 2001

example, the positive difference between PYWMEURO and PYEC could indicate that, despite the generally
high cross-country arbitrage in the euro overnight market, intraday liquidity in London can sometimes be
higher than in one of the smaller euro area countries.18 However, a word of caution regarding broker-to-
broker comparisons is also in order. As the case of bid-ask spreads illustrates, some of the differences might
be related to broker-specific quoting conventions and traditions or technical reasons that are unlikely to be
present in traded rates. Hence, particularly regarding CIMV, GREL and MID, one has to be somewhat
cautious in making cross-country comparisons.
From the raw series, which are irregularly spaced in time, we then derived regularly spaced intraday time
series. Due to the relatively low tick frequency of the “voice” broker quotes, the intraday time period was
chosen to be 3 hours. Hence, the day is decomposed in a “morning” interval (8am to 11am), a “midday” or
“lunchtime” interval (11am to 2pm) and an “afternoon” interval (2pm to 5pm).19 As already mentioned in
2.2.3, Figure 4 shows a plot of the resulting 7 overnight mid-rate series during the sample period, where
middle rate is defined as the average of the arithmetic means of bids and asks through the interval.
[FIGURE 4 ABOUT HERE]
A problem with the broker data (except the much cleaner MID data) is that, as mentioned above, these
quotes are only indicative. Actual rate negotiations and transactions are more frequent than the ticks on
Reuters.20 This is particularly visible for the French broker, since in France the bulk of the negotiations are
conducted directly over the phone. Yet we will operate under the assumption that this (imperfect) data, to the
best of our knowledge the only intraday data publicly available, is informative. More precisely we will
assume that (i) the more “active” the market is (in terms of turnover or price updating), the larger the
number of quotes posted by the brokers, (ii) the more volatile the market is, the more volatile is the mid-rate
derived from the bids and asks posted by the brokers, (iii) the larger the (potentially unobserved) effective
spread, the larger the spread quoted by brokers.21
In order to test whether these assumptions make sense, we have examined some of them with the help of the
more complete data from MID. For example, Figure 5 plots the intraday distribution of trading volume
18 However, we should also note that the volatility difference between the two Prebon Yamane brokers, while being large in November, December and January, became small in February and vanished in March, the end of our sample period. Therefore, the phenomenon might have been only temporary. 19 For a higher intraday frequency, such as hourly or half-hourly, there would have been too many empty intervals for several brokers. 20 This statement does not apply directly to the electronic MID system. Interestingly, the number of ticks according to the MID-best series is roughly similar to the number of transactions actually clinched in our sample. This can be explained by the fact that a transaction usually changes the best bid or ask rate, thereby creating a tick (by construction of the MID-best series). However, total MID quotes are again more frequent than MID-best quotes. 21 Owing to the institutional aspects described in the first part of the paper, turnover in the overnight market is not generally subject to extreme events, such as days when it completely dries up. In market segments characterised by less smooth patterns, the
23ECB • Work ing Pape r No 80 • Oc tobe r 2001

(from the “contratti” series) and quoting frequency (from the “proposte” series) in that system during our
sample period (excluding the special last two business days of the maintenance period and the
Christmas/New-Year week). The proportionality between the two variables is evident, except maybe for the
first trading hour when, apparently, quotes change frequently without transactions. The correlation between
the two series across a representative day is actually 73%.22 So this little test supports the assumption that
intraday periods with high quoting frequency will normally also have high market activity in terms of
turnover.
[FIGURE 5 ABOUT HERE]
However, in addition to the special first hour of trading we discovered another case for which the link
between turnovers and ticks was weakened. During the afternoon of end-of-maintenance period days there is
a significant increase in the number of ticks with only a small increase in trading volume, so that for these
days the correlation between the two decreases to 55% (Figure 6). In other words, enhanced quoting
frequency in the euro overnight market may at certain special times measure higher market activity in terms
of price updating without much increase in trading volume. One explanation for this phenomenon may be
special times of high uncertainty or high rates of information arrival, when quoted rates may be updated
frequently but traders may be very cautious in acquiring inventories (see also 4.4.1 below). Alternatively, as
some market participants pointed out to us, in certain times of stress in the market – when all staff is
focusing on the trading – the Reuters “voice” broker pages may not be regularly updated any more.23
[FIGURE 6 ABOUT HERE]
3.2 Eurosystem monetary policy decisions, operations and data releases
From internal ECB sources we established a “calendar” of monetary policy decisions, operations and data
releases. The “calendar” describes the 11 Governing Council meetings during our sample period, including
the 3 ECB interest rate changes displayed in Table 1, the 5 meetings with a subsequent press conference and
the timing of the regular post-Council press communiqué. It also details the timing of 5 M3 and Monthly
Bulletin releases. For the 19 MROs covered it contains the information provided on ECB Reuters pages (see
functional link between tick frequency and volume may however be more complicated and the corresponding correlation may even change sign on occasions. We are grateful to an anonymous referees to bringing this point to our attention. 22 To gather additional evidence, we calculated also the correlation between the hourly MID volumes and the voice brokers quoting frequency. The correlation turned out to be equal to 84% on “normal days” and 61% on EOM days. 23 Quoting (tick) frequency as a proxy for trading activity has also been used in other financial markets. See for example Hartmann (1998, 1999), who found strong relationships between daily and monthly spot foreign exchange market trading volumes by dealers or “voice” brokers and tick frequency on Reuters. We also tested how closely volatility in quoted overnight rates (“ordini” file) is aligned with volatility in traded rates (“contratti” file) in the MID. We found a similarly close relationship as for ticks and volumes. However, the intraday period with the weakest link between the two was not the opening hour but the closing hour between 5pm and 6pm.
24 ECB • Work ing Pape r No 80 • Oc tobe r 2001
Figure 2). Furthermore, it includes the daily liquidity releases on Reuters (see Figure 1). Finally, it details
the last and penultimate day of each of the 5 reserve maintenance periods covered as well as the occurrence
of large liquidity shocks from Treasury operations.
3.3 Payment system information
As described in 2.4 above, the two most important large-value payment systems in the euro area, TARGET
and Euro1, are scheduled to close at 6pm and 4pm respectively, i.e. during or after our 3-hour “afternoon”
period of each trading day. For Euro1 we have collected the effective completion times of the end-of-day
settlement procedure. Since it is the EBA Clearing Company’s policy to encourage early completion about
half an hour after closing time, much later completion could indicate an unforeseen event or sometimes even
a financial disruption. (If a net system participant faces difficulties to settle, this tends to show up ultimately
at closing/settlement time.). The median time for completing the Euro1 settlement procedure during the
sample period was 4.36pm (average effective completion time 4.39pm). On 19 days (out of 101) Euro 1
settlement was completed after 4.45pm. Although on none of these 19 days completion seems to have been
as late as causing an emergency in the system, it is still interesting to examine our data with a view on
whether any of these late completions coincided with any signs of disruption in the interbank market.
TARGET opening (7am) and closing times (6pm) seem to be very regular. During November and March
only one noticeable incident occurred in TARGET, caused by the breakdown of a major euro area bank’s
system connecting it with its national RTGS system. At this occasion TARGET stayed open until 6.30pm
and the related national RTGS even remained open until 7.30pm, to give the bank’s counterparties the
occasion to resolve their liquidity problems induced by the incident. (Euro 1 also stayed open until 5.02pm
on that day.) We therefore had a separate look at money market trading on this day.
As pointed out to us by various commentators, settlement days of Eurosystem main refinancing operations
may also be special, due to the large liquidity and collateral needs for settling the repos. We therefore also
collected the dates of the 20 settlement days during our sample period.
4. Empirical results
We can now turn to the main empirical analysis of the euro overnight markets’ functioning. We do this by
studying the quoting frequency (and to the extent that it is available also the trading volume), overnight rate
volatility and bid-ask spreads from our broker data. We first draw a general picture of the market across the
week and across the days of the week (sub-section 4.1). We then relate in greater detail specific intraday
patterns to the institutional framework of the money market. We chronologically discuss the effects of
25ECB • Work ing Pape r No 80 • Oc tobe r 2001

monetary policy events and monetary news releases (sub-section 4.2), of operational features of monetary
policy implementation (sub-section 4.3) and of payment system events (sub-section 4.4). Finally, we also
study the behaviour of ticks (MID volumes), volatility and spreads during the critical week of the Y2K
changeover (sub-section 4.5).
4.1 Regular intra-week and intraday patterns
In this sub-section we discuss the intra-week and intraday patterns of our data set and make a first brief
attempt to relate any regularities discovered to the institutional environment of the money market
microstructure, as described in section 2. We focus here on “normal” days, which from now on we define as
all business days in our sample excluding the two last business days of each reserve maintenance period and
the days of the Y2K changeover week (25 December 1999 until 3 January 2000). What usually happens at
the end of the reserve maintenance period and what happened during the Y2K changeover is addressed in
greater depth in sub-sections 4.3.3 and 4.5. Tables 4, 5 and 6 show for each weekday and for each of our
three intraday intervals the average quoting frequency (plus the average trading volume for the Italian MID),
the average volatility and the average bid-ask spreads between November 1999 and March 2000.
Quoting frequency is measured as the number of ticks per period averaged over the relevant sub-periods of
the entire sample (Table 4). Volatility is measured as the average absolute overnight rate change during an
intraday period, calculated from middle rates (Table 5).24 Occasionally, we will also look at the intra-period
tick-to-tick standard deviation, a more high-frequency volatility measure, which we add to the tables in
square brackets. Finally, spreads are measured as arithmetic averages of the differences between ask and bid
overnight rates per relevant sub-period (Table 6).
Starting with the day-of-the-week patterns, quoting activity is the highest on Tuesdays and Thursdays for all
brokers and countries except the MID in Italy in which quoting is also intense on Fridays (Table 4).25 The
lowest tick frequency occurs after the weekend on Monday (except in the MID). However, daily trading
volumes in the MID are not always proportional to daily ticks. Surprisingly, the highest trading volumes
occur on Wednesdays in this trading system (about EUR 25 billion), in particular during the afternoon
before the closing of payment systems, and the lowest volumes on Thursdays. Less surprising are perhaps
the high MID volumes on Tuesdays (about EUR 21 billion).
[TABLE 4 ABOUT HERE]
24 For the purpose of calculating this volatility measure, synthetic mid rates have been derived by linear interpolation between the latest quote before the respective interval threshold and the next quote after the interval threshold. Since this procedure ensures uniform time intervals, distortions of volatility measures resulting from differences in quoting frequencies between brokers should be minimised. 25 The German broker KLIEMMM is also an exception regarding Thursdays, but not Tuesdays.
26 ECB • Work ing Pape r No 80 • Oc tobe r 2001

The most volatile day (for “voice” brokers) is Thursday, with an average 3-hourly absolute overnight rate
change of 4 to 7 basis points (Table 5). Monday tends to be the least volatile, although not for all “voice”
brokers and although the differences to other days can be relatively small. If one looks at the mean 3-hourly
rate changes of about 3 to 4 basis points for all our “normal” days, then it appears also that the euro
overnight market is in general not a very volatile market. Differences between bid-ask spreads across the
trading week are not particularly pronounced (Table 6). Having said that, the largest spreads are observed on
the very active and volatile Thursdays (probably related to inventory risk) and the lowest on the inactive and
stable Mondays (potentially related to low activity).
Overall, different days of the week stand out for different microstructure features. Mondays stand out with
low post-weekend trading and volatility, Tuesdays with high market activity potentially related to MROs
(see 4.3.1 below), Wednesdays with very large MID trading volumes potentially related to MRO settlement
obligations (see 4.4.2), Thursdays with high volatility (and higher spreads) potentially related to ECB
Governing Council Meetings (see 4.2.1). Other features seem more blurred and it appears worthwhile to
rather turn the attention to intraday variations.
Looking at Table 4, we find evidence of the “two-hump” (or “u”) shaped intraday activity pattern.26 In our
sample, the ”u”-shaped pattern holds for ticks for all weekdays except Thursday, the special Council day,
and for all brokers.27 The exception of high midday activity on Thursdays will be explained below by the
timing of the release of ECB interest rate decisions on that day. The pattern also holds for MID trading
volumes, except in the case of the special Tuesday midday period during which MRO allotment results are
released. The general “u”-shape is a pattern that is already well established in the literature on intraday
market behaviour in stock, foreign exchange and bond markets (see e.g. Wood, McInish and Ord, 1985;
Dacorogna et al., 1993; Fleming, 1997). Market activity tends to be more intense early in the morning and
towards the end of the business day, while it is relatively slow at midday. The standard argument is that
early in the morning the market reacts to news accumulated overnight.28 As will be discussed in greater
depth in 4.4, the closing of payment systems late afternoon/early evening and related liquidity needs
stimulate trading in the afternoon (see e.g. Angelini, 2000). Finally, in countries where traders have lunch
breaks activityslows down over midday.
26 We do not make the distinction between “two-hump” and “u”-shaped intraday patterns in this paper. However, a closer examination of our MID data seems to indicate that ticks and volumes are rather “two-hump” shaped (Figure 5) and volatility and spreads rather “u”-shaped. 27 In the Spanish case (CIMV) several exceptions occurred, potentially related to later lunch time in this country. 28 The observation for the MID in Figure 5 that during the first hour of the day quotes change frequently without too much transaction volume, which picks up strongly only in the second hour, suggests that traders test the market first with unacceptable quotes, often implying large spreads, or with very small quantities associated to quotes.
27ECB • Work ing Pape r No 80 • Oc tobe r 2001

Volatility also tends to exhibit (weakly) the typical ”u”-shaped pattern during the day, although clearly less
regular and pronounced than for quoting frequency (Table 5).29 Moreover, intraday volatility seems also to
be high on Tuesday mornings and sometimes on Monday and Friday evenings. These volatility patterns are
consistent with the MRO auctions early on Tuesday and with interest rate decisions on Thursday around
lunchtime, which regularly transmit important information to the market, resulting in larger movements in
the quotes.30 Both phenomena are addressed in greater detail below. Friday evening volatility might be the
consequence of liquidity managers’ attempts to square undesired positions before the weekend. As discussed
for example by Hong and Wang (2000), market participants are reluctant to hold open positions during long
no-trading intervals, such as weekends. Consequently, traders will tend to square their positions when the
weekend approaches.
[TABLE 5 ABOUT HERE]
Unlike overnight market activity and volatility and unlike the experience of bond or equity markets, quoted
overnight rate spreads in the euro money market do not seem to exhibit a clear “u”-shaped intraday pattern
(Table 6). First, differences across the trading day appear often rather small. Second, for the “voice” brokers
often even a (weakly) reversed, single “hump” shaped intraday pattern emerges. This is consistent with an
order processing cost/liquidity component in spreads, since when the market is more (less) active and liquid
spreads should be lower (higher).31 However, there are also other intraday spread patterns in our sample. It
is, for example, noteworthy that in the MID spreads are systematically higher during the morning compared
to the other two periods of the day, which are more or less flat. Given that market activity was not found to
be particularly low during the morning period, this might have to do with the arrival of new information, but
it is not so clear why this new information does not affect spreads in other countries.32 An alternative
explanation is that MID quotes can be directly “attacked” by money market traders, so that – compared to
often more indicative “voice” broker quotes – there are stronger incentives for banks to protect themselves
against becoming a counterparty in a trade early in the morning when uncertainty is still high and liquidity
still low. In any case, a more detailed analysis (not reported in the table) showed that this phenomenon
resulted entirely from extremely high spreads during the market opening hour between 8am and 9am, i.e.
before the ECB release of information on the market’s liquidity situation on Reuters ECB40.
29 The most visible exceptions are the Dutch broker, the special Thursday midday period and for several “voice” brokers the Monday. However, as we will see in 4.2.1 below, if we distinguish Governing Council Thursdays from non-Governing Council Thursdays, then the “u” volatility shape will re-emerge for the latter. 30 We found the enhanced Thursday midday volatility to be robust to the elimination of the three pure policy rate changes by the ECB (see Table 1). 31 Since the euro money market trivially is larger than the money market of any single member country before EMU, one may have expected it to exhibit higher liquidity and narrower spreads. Some early evidence provided by Detken and Hartmann (2000, Table 2) and by spread estimations undertaken by the Banca d’Italia and reported in Santillán et al. (2000, Annex 3) are consistent with the fulfilment of this expectation.
28 ECB • Work ing Pape r No 80 • Oc tobe r 2001
[TABLE 6 ABOUT HERE]
However, in contrast to some signs of pre-closing volatility, as discussed above, in our data overnight
spreads are not systematically higher during the last trading interval on Friday. In other words, somewhat
surprisingly our quoted spreads do not indicate a reluctance of liquidity managers to incur new positions
before the weekend.
4.2 Monetary policy news and events
In order to furtherrefine the picture of the euro overnight market’s microstructure, we now turn the attention
in greater detail to a selection of major monetary policy news and events. We first examine the intraday
patterns of Governing Council Thursdays, as compared to non-Governing Council Thursdays. Second, we
study the market patterns of morning periods with the release of new M3 data (referring to the first pillar of
the ECB’s monetary policy strategy) and compare them to non-M3 release mornings. Finally, we briefly
comment on ECB Monthly Bulletin releases.
4.2.1 Governing Council meetings and interest rate decisions
Normally, Thursday is the day of Governing Council meetings and therefore of interest rate announcements.
However, the preceding analysis still ignored the fact that only every other week there is a Council meeting
and a few of them were actually held on a Wednesday. Therefore, we report in Table 7 ticks (and MID
volumes), volatility and spreads for Council days and non-Council Thursdays separately.33 For all except 1
of our 7 brokers and virtually all of our 3 standardised intraday periods quoting activity is higher on Council
days (and usually largely so) than on non-Council Thursdays, which turn out to be relatively inactive days,
roughly comparable to Mondays (see Table 4). Whereas for the MID the “classical” “u”-shaped quoting
pattern re-emerges for non-Council days, the picture for the “voice” brokers is less clear on these days
(potentially related to their inactive nature). For Council days a typical “u” intraday quoting pattern does not
emerge, because of the 13.45 ECB communiqué about interest rate decisions. The midday period, during
which the press release on monetary policy decisions is issued, is also very active compared to other midday
periods more generally, but Council mornings are not necessarily special in this regard (see Table 4). MID
trading volumes, also reported in Table 7, show “u”-shaped transaction patterns for both Council days and
non-Council Thursdays. Finally, the indication from Table 4 that Council days are not characterised by
particularly high MID trading volumes, in spite of interest rate decisions, is confirmed. MID volumes are
only moderately higher on Council days, mainly due to slightly enhanced post-decision afternoon trading.
32 The high morning spreads are unlikely to be a consequence of uncertainties related to the settlement of foreign exchange contracts. As pointed out by Angelini (2000), the settlement of these spot FX contracts in the morning is known to banks two days in advance. 33 In our sample, 4 and 18 November, 2 and 15 December 1999, 5 and 20 January, 3 and 17 February, and, finally, 2 and 16 March 2000 were Council days. We eliminated the 20 January meeting from our comparison, since it coincided with the end of the reserve maintenance period. The 15 December and 5 January Council meetings were held on Wednesdays.
29ECB • Work ing Pape r No 80 • Oc tobe r 2001

[TABLE 7 ABOUT HERE]
In order to get an even clearer picture of the market across the Council days, we provide a further refinement
of Council and non-Council Thursdays, using 45 minute time intervals for the MID (Table 8). These figures
show how trading activity (volume and quoting) exhibits a noticeable increase right after the 13.45
communiqué, as the market “digests” the news from Council decisions and agents re-balance positions. On
non-Council Thursdays (and most other normal days) volumes decrease by almost half and quoting stays
constant between the same two intraday periods, because of the lunch break. The average volume during the
post-announcement period on Council days is 2.5 times larger than on non-Council Thursdays and tick
frequency 4.5 times larger. (Nevertheless, this interval is not the period with the largest MID volume on
Governing Council days, which occurs during the subsequent 45 minutes.) Large trading volumes after
announcements are also observed in equity markets, as illustrated for example in the case of the Paris Bourse
by Gajewski (1999). MID turnover stays somewhat higher across most of the afternoon when compared with
non-Council Thursdays, but not when compared with other weekdays.
However, in the intervals directly before the 13.45 interest rate announcement, turnover is not particularly
low. It is at about the same level as (or slightly higher than) average volume for non-Council Thursdays.
This provides relatively solid first evidence that during our sample period upcoming interest rate decisions
by the ECB Governing Council were not preceded by substantial asymmetric information, which would
have led to adverse selection and hence ceasing volumes. The relationship between asymmetric information,
adverse selection and reduced trading volume has been illustrated forcefully by Milgrom and Stokey (1982).
This observation seems also consistent with the hypothesis that market participants were relatively confident
in having anticipated the interest rate decisions correctly. However, the fact that our sample period falls into
a cycle of rising policy rates may also help explain part of the robust trading volumes before the
announcements. In such a situation it may pay for traders that give a non-zero probability to an interest rate
increase by the central bank to “frontload” and borrow liquidity before the announcement.
[TABLE 8 ABOUT HERE]
Turning to volatility, non-Council Thursdays show a “clean” “u”-shaped intraday pattern, which is reversed
on Council days, when the 13.45 monetary policy release causes high volatility during the midday period
(Table 7). (GREL and MID show a declining volatility pattern due to high pre-announcement volatility and
generally high early morning volatility for the MID.) The finer MID data in Table 8 show that most of the
45-minute volatility is concentrated in the interval right after the press release. For our standard volatility
measure we found an average 4.6 basis point absolute change in overnight rates, which is about 3 times
larger than the mean 45-minute rate change over a Council day and 10 times larger than the average change
30 ECB • Work ing Pape r No 80 • Oc tobe r 2001

on a non-Council Thursday during the same interval. For the tick-to-tick standard deviation the results
(reported in square brackets) are qualitatively similar although somewhat more moderate. For most of the
other intraday periods average volatility on Council days is only very moderately above the volatility on
non-Council Thursdays but not above the corresponding volatility for an average of all normal non-Council
weekdays. This suggests that the market absorbs the new information from interest rate announcements
relatively fast and efficiently.
A closer examination of the pre- and post-announcement market rates in the MID led us to the conclusion
that the volatility right after the press release was not a mechanical effect of the three rate changes during
our sample period.34 It rather seems to come from the interplay between pre-announcement overnight market
expectations and the information conveyed by the announcement. Interestingly, an inspection of overnight
rate levels quoted in the MID during the hours before and after the announcements led us to the observation
that the market was better in anticipating unchanged policy rates than in anticipating changes in policy rates
during our sample period. In other words, when the ECB left rates unchanged overnight market rates were
not much different or only slightly above the current policy rate right before the announcement. However,
on the days of the three interest rate increases overnight rates – despite having increased by more than half
of the subsequent policy change well before the announcement – were only in the case of the 16 March 2000
consistently very close to the future rate. These effects of expectations on the overnight rate can also be seen
well from the behaviour of the broker rates before changes in the MRO rate in Figure 4 above. Therefore,
the relatively large volatility (compared to other intraday intervals) measured during the 13.45 to 14.30
period reflected the adjustments resulting from the remaining differences between expectations and actual
decisions. However, a 4.6 basis points amplitude of 45-minute post-announcement variations, although large
for the standards of the overnight market, is not very large economically, in particular when one compares it
to the size of policy rate changes in Table 1 (25 to 50 basis points). One way to read this result is that on
average the absolute difference between market expectations and actual interest rate decisions has been
relatively small during our sample period.
As regards the evidence for bid-ask spreads, Council Thursdays seem to be characterised by slightly wider
spreads than non-Council Thursdays, in particular over the midday interval when the expected arrival of new
information in the form of the interest rate decision release gives incentives for dealers to avoid getting into
transactions and volatility increases inventory holding costs (Table 7). Neglecting the last 15 minutes of the
midday period, the “voice” broker data could suggest that quoted spreads may be high before ECB Council
interest rate decision releases, potentially providing evidence in favour of some asymmetric information
before ECB monetary policy announcements. However, this observation is not consistent with the evidence
in Tables 7 and 8, showing relatively high market activity and trading volume during the Thursday midday
31ECB • Work ing Pape r No 80 • Oc tobe r 2001

period. These observations somewhat contrast with those obtained for equity markets. For example, Lee,
Mucklow and Ready (1993) find a significant increase in the bid-ask spread and decrease in depth before
announcements.
The higher frequency MID data in Table 8 show particularly large average spreads (about 5 basis points)
during the very active 45-minute interval following the interest rate press releases and, compared to non-
Council days, also somewhat enhanced spreads during the interval thereafter. In all likelihood they reflect
the high inventory costs associated with the high volatility during the same periods reported above, since
volume seems abundant and the uncertainty has already been resolved. Whereas the MID spreads before the
announcement seem also somewhat higher than those on the inactive non-Council Thursdays, the same does
not hold true for a comparison with other non-Council (non-MRO) weekdays (and similarly so for the late
Council afternoon). Hence, overall we feel that the evidence on volumes, volatility and spreads considered
here is not suggestive of strong asymmetric information and adverse selection directly before ECB interest
rate decisions. This observation would be consistent with the conclusion that overnight market participants
were not subject to very large uncertainty in relation to ECB interest rate decisions, for example since they
could by and large anticipate the outcome of Council meetings, as already concluded from the discussion on
volumes and volatility above (and also indicated by the MRO bidding behaviour described in sub-section
2.2.1, Figure 3). It is also in line with the recent results by Gaspar et al. (2001), who do not find evidence of
important market misperceptions or large and significant volatility increases on Council days for daily data.
4.2.2 M3 releases
Another major news release in relation to the monetary policy stance of the ECB is the publication of euro
area M3 data once a month around 10 in the morning. Table 9 compares ticks, volatility and spreads for M3
release mornings with the same variables for non-release mornings of all other “normal” days (i.e. excluding
end-of-maintenance period days and Y2K changeover days).35 It indicates increased quoting activity and
perhaps slightly increased spreads, but volume is rather low (or comparable to normal days, as displayed in
Table 4 for example). Our standard measure of volatility (mean absolute rate change) also looks rather low
compared to non-M3 release days. However, when using the more short-term volatility measure (the mean
tick-to-tick standard deviation over the morning interval, indicated in square brackets in Table 9), then this
reverses and it turns out that on M3 release mornings high-frequency volatility is slightly above the one on
other days (excluding special event days).
[TABLE 9 ABOUT HERE]
34 We did this by comparing the volatility of the market rate in Table 7 with the volatility of the difference between the market rate and the MRO rate. We also undertook a visual inspection of all the rates quoted around any single interest rate announcement. 35 There were four M3 data releases during our sample: 29 November and 28 December 1999, 28 January and 25 February 2000. Because of the special factors playing a role on Y2K changeover days, we eliminated the December release from our comparison.
32 ECB • Work ing Pape r No 80 • Oc tobe r 2001

Table 10 further refines the picture for the Italian MID data, using 30-minute intervals during mornings. The
first notable feature is that quoting almost ceased during the half-hour before the 3 releases, dragging also
volatility and spreads on low levels during that time, although in line with the “voice” broker data it is rather
high before and after this special interval. Perhaps somewhat surprisingly, due to a limited number of large
transactions during this interval, MID trading volume is not particularly low during this half-hour compared
to before and after. Generally, volume is lower than on other days though, but this phenomenon seems to be
spread out over the whole M3 release morning. This analysis also confirms that high-frequency volatility is
somewhat higher than on non-release days, particularly early in the morning before the release and
somewhat less after the release. Accordingly, spreads also go up during certain intervals before and after the
releases.
[TABLE 10 ABOUT HERE]
Because of the low number of M3 releases that all happened on either a Monday or a Friday these patterns
have to be interpreted with an extra dose of caution. With this caveat in mind the results at hand suggest that
the market is paying attention to M3 releases (special behaviour of ticks and volatility), contradicting some
ECB “watchers” who believe that the first pillar of the monetary policy strategy of the ECB is of little
practical relevance for actual policy-making and the market, and that there may be a modest degree of
uncertainty about the effective M3 figures to be released before the announcement. However, trading
volumes before the announcement are not consistent with the notion of a slowing market due to asymmetric
information about the M3 numbers and related adverse selection. Finally, in contrast to interest rate
decisions no post-announcement increase of volume can be detected in our sample, although for certain
post-announcement intervals volatility and bid-ask spreads appear slightly higher than for the same time
intervals on non-announcement days.
4.2.3 Publication of the ECB Monthly Bulletin
Another important publication of the ECB is its Monthly Bulletin, which usually comes out in the second
week of the month.36 Although many of the data displayed in it have already been released before, so that
they can be known by market participants in advance, the Editorial of it regularly highlights some policy
messages and the possibility cannot be excluded ex ante that the interpretation of the data is occasionally
different from that by market participants. Since the Bulletin usually comes out on a Thursday between two
Council meetings, these messages could be news to the overnight market. However, when comparing pre-
Monthly Bulletin release Thursday afternoons with non-Monthly Bulletin release afternoons post-Monthly
Bulletin Friday mornings with non-release Friday mornings we could not identify any special patterns in the
33ECB • Work ing Pape r No 80 • Oc tobe r 2001

data that could be related to news arrival. One reason for this result may be that during our sample period the
Bulletin was only published at 7pm, i.e. outside regular money market trading hours. Another could be that
the market takes a longer period of time to digest the large amount of information contained in the Bulletin.
Alternatively, it could mean that the Monthly Bulletin does usually not convey important new information to
money market liquidity managers, indeed. We decided to save space and not display the related tables here.
4.3 Monetary operations and liquidity management
We now extend the analysis of the euro overnight market microstructure to the effects of the operational
implementation of monetary policy and the related money market liquidity management by the ECB. We
first consider the weekly main refinancing operations (MROs) by the Eurosystem, we then briefly study the
daily release of money market liquidity information by the ECB, subsequently we look at the special days at
the end of the reserve maintenance period and finally we examine the effects of special liquidity shocks
resulting from operations related to national Treasuries, when the respective NCBs act as a banker for the
government.
4.3.1 Main refinancing operations
The weekly MRO (usually) takes place on Tuesdays.37 Let us first look at our three standard intraday
intervals, as displayed in Tables 4, 5 and 6 again. On Tuesday midday (the period from 11am to 2pm), right
after the announcement of the auction results at 11.15am, the market is very active compared to other
midday intervals during the week (Table 4). For example, Tuesday lunchtime MID turnover is the highest
for all midday periods during the week (on average 6.2 bn euro). Tuesday lunchtime tick frequency is the
second highest, only after the special (Council) Thursdays discussed above. This reflects banks’ activities to
reallocate liquidity according to their effective needs, since first smaller banks that have not bid in the
auction themselves may borrow overnight money from larger banks and second even some of the bidding
banks may sometimes receive more or less than the quantities optimal for them (because the total amounts
bid by other banks is uncertain for each bidding bank under the fixed-rate tender regime).
However, high Tuesday market activity is not only limited to the post-auction midday period. “Voice”
broker quoting frequency and MID trading volume tend also to be high during the on-going auction process
on Tuesday morning (8am to 11am period). This is consistent with the hypotheses that at least some banks
“speculate” or hedge on the basis of their expectations what the auction outcome is going to be and that the
36 Monthly Bulletin release days during our sample were 11 November and 9 December 1999, 13 January, 10 February and 9 March 2000. 37 Almost every Tuesday during our sample period there was an MRO. The exceptions were 9 November 1999 and 7 March 2000, when the MRO was held a day earlier (on Mondays), as well as 28 December 1999, when it was held two days later (on a Thursday). We eliminated the operations of 30 December 1999 (Y2K changeover day) and of 23 November and 21 December 1999, 22 February and 22 March 2000 (end of reserve maintenance period) from the general analysis of MROs.
34 ECB • Work ing Pape r No 80 • Oc tobe r 2001
9.15am release of reserve account balances and use of standing facilities on Reuters page ECB40 (see Figure
3 above) contains new information for the market. The later afternoon period (from 2pm to 5pm) is also
relatively active in terms of MID turnover compared to other afternoons during the week. This could
indicate that the post-auction reallocation process is carrying on for most of the afternoon.
Is this high market activity around Eurosystem main refinancing open market operations associated with less
desirable features, such as high volatility or wide bid-ask spreads? As can be seen from Table 5 auction
Tuesdays are not particularly volatile days in general, even for the post-auction liquidity re-allocation
period. Similarly, bid-ask spreads seem to be relatively close to those of non-MRO auction days during the
week (Table 6). All this evidence would suggest that the overnight market functions relatively normally and
efficiently before, during and after the MROs, irrespective of the high volumes that have to be moved.
In order to further clarify the picture, we look again at the MID data alone for a higher frequency (45 minute
intervals), comparing MRO days with (“normal”) non-MRO days (an average of “normal” Mondays,
Wednesdays, non-Council Thursdays and Fridays; Table 11). Perhaps the most visible information from this
additional comparison is the almost doubling of MID turnover and tick frequency in the interval right after
the announcement of the auction results of 11.15am compared to the 45 minutes before. Volume and ticks
are also 2 to 3 times larger than on non-MRO days at the same time, further substantiating the post-auction
liquidity re-allocation hypothesis mentioned above. Actually, MID volume is also somewhat higher than on
non-MRO auction days for most of the other intraday periods (but not MID best ticks). For example trading
volume is also particularly high (but not ticks) during the interval around the 9.15am ECB release of
liquidity information from the previous day. In other words, as already conjectured above from the “voice”
broker results the market seems to trade already early in the morning, based on the information this release
provides in relation to the likely auction outcome two hours later. However, despite the generally enhanced
trading activity on MRO days, volatility is only somewhat higher for the two 45-minute intervals
immediately following the auction announcements and bid-ask spreads even not for those, confirming the
qualitative results from the “voice” brokers.
[TABLE 11 ABOUT HERE]
As indicated before, the financial market literature has identified patterns of quasi-market breakdowns
before important uncertainty-loaded events, such as auctions or news announcements, and a picking up of
activity afterwards. These patterns could be related to several market imperfections: (i) they could reflect
large information asymmetries before the auctions or news announcements; (ii) they could also arise if the
liquidity allocation in an auction was inefficient and resulted in giving market power to the banks which
were successful in the auction. The evidence about high tick frequencies and volumes before MROs clearly
argue against (i). In relation to bid-ask spreads one would expect under the first scenario (i) that they would
35ECB • Work ing Pape r No 80 • Oc tobe r 2001

be large before the auctions, while under the second scenario (ii) one would expect them to be large after the
auctions. Since MID or “voice” broker bid-ask spreads are neither particularly high before the auctions nor
after the auctions, the available evidence seems to suggest that despite substantial overbidding in the fixed
rate tenders no important market imperfections occurred around Eurosystem main refinancing operations
executed from November 1999 to March 2000.
4.3.2 Release of liquidity information on Reuters ECB40
As pointed out most forcefully by Vergara (2000) and as described above in 2.2.1, an important event for
money market traders under the fixed tender regime was the daily 9.15am ECB release of information on the
money market liquidity situation for the previous day (aggregate reserve account holdings and recourse to
standing facilities).38 For both active and more passive money market traders this release provides a signal
about the likely liquidity situation in the overnight market on the present day (particularly for the start of
trading) and more generally in the remainder of the maintenance period. From this consideration one would
expect the market to be relatively active around that particular time of the day, potentially with some
volatility related to the time it takes that the new information is incorporated in market rates.
This expectation seems to be borne out by our more frequent data from the MID. First, when looking at the
intraday activity patterns, as displayed in Figure 5, the interval around 9.15am is on average the most active
of the day in terms of trading volume and also very active in terms of quote revision frequency. When we
look at the volatility measures in Tables 8, 10, 11 and 14, we also observe regularly some evidence of
relatively large rate fluctuations either directly before or directly after the standard release time. The
enhanced tick frequency or rate fluctuations seem to be somewhat further reinforced on days with special
events (compared to “normal” days without special events), such as ECB Governing Council days (Table 8
above), M3 release days (Table 10 above) and perhaps also MRO settlement days (Table 14 to come below)
but not really on MRO auction days where only MID turnover tends to spike up (Table 11). Although the
volatility and tick frequency reactions are not necessarily very large, we take these observation as a
confirmation of the special importance of the 9.15 liquidity release for overnight market participants.
4.3.3 The end of the minimum-reserve maintenance period
Another feature of monetary operations and liquidity management is the minimum reserve regime for banks
operating in the euro area. As described in 2.2.3 above, the requirement to hold on average a certain amount
of reserves in Eurosystem accounts can mean that if there are unexpected liquidity shocks or banks’
planning was imperfect, then shortages or excesses of liquidity at the end of the maintenance period can lead
to special behaviour of overnight rates during those days.
36 ECB • Work ing Pape r No 80 • Oc tobe r 2001

By comparing the distribution of quotes across the week on normal days in Table 4 with those on end-of-
maintenance-period (EOM) days in Table 12, one observes immediately that on EOM days new quotes are
posted much more frequently (about twice as often). However, MID trading volume remains on a rather
“normal” level or somewhat below. Volatility of overnight rates appears clearly much larger on end-of-
maintenance period days than on “normal” days (usually even more than double), particularly in the
afternoon (Table 12).39 This reflects the “last-minute” attempts of banks to hit their target given by the
reserve requirement. As can be seen from the troughs and peaks around the 23rd of a month in Figure 4
above, the volatility is either caused by an aggregate shortage of liquidity in the market at that time
(overnight rate jumps up) or by an aggregate excess of liquidity (overnight rate slumps). It underlines the
extreme trading needs by banks with reserve imbalances at this time and the high risks for liquidity
managers already referred to before.
[TABLE 12 ABOUT HERE]
In line with the high uncertainty and inventory risk created by the overnight rate volatility described above,
quoted spreads tend to widen systematically on EOM days (Table 12). Considering all “voice” brokers the
market’s average spread reaches 7.7 basis points, compared to 5.6 basis points on “normal” days. For the
MID the difference between the two is even larger (EOM days 7.5 basis points, normal days 2.7 basis
points). Looking at intraday spreads for EOM days, for all brokers (except GREL, who appears to stop
quoting) they are highest in the afternoon, pointing to the special uncertainties towards the end of trading
during these days. For most brokers these higher spreads seem to be at least partly related to the higher
volatility of interest rates at that time. Otherwise, the high afternoon spreads may simply reflect the fact that
most market participants reached their reserve target and are therefore unwilling to trade, since a newly
acquired imbalance would in all likelihood force them to borrow from the marginal lending facility (in the
case of a liquidity shortfall) or to put excess balances in the deposit facility, both at penalty rates.
4.3.4 Liquidity shocks from Treasury operations
It is by now well known that operations by some euro area Treasuries with their national central banks can
significantly change the liquidity situation in the money market and are therefore of special concern to
central bank liquidity management (see e.g. Escrivá and Fagan, 1996; ECB, 1999b). Actually, they have
been identified as the largest irregular “autonomous” liquidity shocks since the start of stage 3 of EMU
38 ECB40 may have even become more important under the new variable rate tender regime, under which it also contains the ECB liquidity forecast and under which precision in the amounts bid is more important for banks. 39 The 11 basis points average rate change in the MID during EOM mornings seems to be an exception. However, when we look at the higher frequency tick-to-tick standard deviation for the MID (and the “voice” brokers; reported in square brackets), then afternoon volatility is also highest in this system. We verified that the same results hold for the volatility of transaction prices.
37ECB • Work ing Pape r No 80 • Oc tobe r 2001

(Bindseil and Seitz, 2001).40 Often they are triggered by tax payments in countries in which the central bank
acts as the bank for the government.
The first remark in relation to these shocks is a caveat for the analysis of EOM days undertaken above.
Rather by coincidence a special large liquidity shock through tax payments and related Treasury operations
occurs in Italy on the 23rd of each month, exactly on the day at which the Eurosystem reserve maintenance
period is ending. Behind this shock are tax payments to the Treasury, which deposits the money with the
Banca d’Italia. During our sample period the size of these shocks varied, withdrawing each time between 12
and 25 billion euro of liquidity – a considerable amount even for the large euro money market. This causes
an identification problem, in so far as part of the enhanced quoting, volatility and transaction costs observed
above may be a result of these shocks, hitting at the same time as banks have to meet their minimum reserve
targets. For example, this feature may explain why the increase in bid-ask spreads is way more dramatic in
the Italian MID system than suggested by the “voice” broker data for other countries. However, with the
small number of Italian tax days in our sample there is no easy solution how to disentangle the relative
importance of the end of the reserve maintenance period and the Italian tax day liquidity shocks, and we
therefore leave it for future research.
Instead we identified the remaining “normal” days in which aggregate government deposits with Eurosystem
member central banks varied by more than two standard deviations from their mean absolute change over
our sample period in order to compare overnight market behaviour on those days with non-Treasury
operation days (excluding special days, such as Council or MRO days). Since only 4 such days could be
identified, 3 of them exhibiting a withdrawal of liquidity from Treasury operations and 1 showing an
increase in liquidity, we do not report the full results.41 Keeping in mind the low number of observations, we
note that the only special feature characterising those days was an increase in volatility for overnight rate
quotes from all brokers, including the MID system. This is the result one would expect, if rates vary as a
consequence of the change in liquidity demand or supply, until the imbalance is removed.
4.4 Payment and settlement events
The close link between payment and settlement system obligations and certain trading patterns is often
overlooked in the financial market literature. In this sub-section we are going to address three issues
regarding the link between euro overnight market trading and payment system events. First, we are studying
40 “Autonomous” shocks in the language of central bank liquidity management refer to shocks caused by factors that cannot be influenced directly by the central bank. Hamilton (1996) describes similarly important effects caused by Treasury operations in the US money market. Bindseil and Seitz (2001) show that changes in banknote demand can also cause sizeable “autonomous” shocks, but that they are much more regular, following a seasonal pattern that is relatively easy to predict.
38 ECB • Work ing Pape r No 80 • Oc tobe r 2001

the distribution of money market activity between morning and afternoon periods. Then we are asking the
question whether settlement transactions in relation to large expiring open market operations are causing
repercussions in the overnight market. Finally, we identify the days of our sample in which some
disturbance in TARGET or Euro1, the two main large-value payment systems in the euro area, occurred and
study whether those caused significant repercussions in euro overnight market trading.
4.4.1 Intraday timing
As argued by Angelini (2000), in the case of the money market the second trading peak towards the close of
the business day may reflect news about payment system obligations, arriving late in the afternoon, such as
unforeseen out-payments. Angelini points out that for a risk-averse bank its specific intraday timing of
trading should reflect the relative magnitude of the risks to be expected. Hence, a bank will trade relatively
early to hedge against high interest rate risk expected in the afternoon. Conversely, it will preferably trade
late in the day, if payment system shocks during the afternoon are expected to be more important.
In this regard we find some signs of change in the functioning of Italian interbank deposit trading after the
euro was introduced. As described by Angelini (2000, Figure 2), in the mid-1990s on normal days trading
volume in the MID was highest in the afternoon, before the closing of the domestic net settlement system.
However, due to the substantially higher interest rate risk on EOM days, the largest part of the trading
shifted to the morning on those days. Our data show that between November 1999 and March 2000 MID
market activity on normal days (as measured by quoting intensity and trading volume) was fairly balanced
between the first and the second half of the trading day (Figure 5 and Table 4). For EOM days we find only
a very moderate shift of trading volume from the afternoon to the morning, if any at all (Figure 6 and Table
12). Notice that quoting frequency gives the opposite picture in this particular case, namely more numerous
price updating in the afternoon than in the morning of EOM days. This is the source of the weakened link
between quoting intensity and trading volume on those special days described above in 3.1. As this high
quoting activity goes hand in hand with enhanced volatility (Table 12), a plausible explanation for this
phenomenon is that the banks that still have reserve holdings above target try to keep the funds away from
the market, testing whether they can “squeeze” the potentially few banks that still need liquidity to reach
their target with high overnight rates.42 Alternatively, in case of an aggregate excess of liquidity, the few
banks that still want to buy liquidity may test actively very low rates.
The changes in intraday timing for Italy have two possible explanations. First, as observed by Perez-Quiros
and Rodriguez (2000), for example, EOM volatility is lower in the euro area than before. This reduces the
41 Large negative liquidity shocks occurred on 5 November and 7 December 1999 and 24 January 2000 (the latter an Italian tax operation that did not fall on the 23rd because of a weekend, whereas the maintenance period finished the Friday before the weekend), a large positive shock happened on 1 December 1999. 42 See Nyborg and Strebulaev (2000) for an analysis of market squeezes in relation to auctions.
39ECB • Work ing Pape r No 80 • Oc tobe r 2001

incentive for risk-averse banks to trade early in the day in order to hedge against interest rate risk. Second,
since EOM days fall now together with the Italian tax day on the 23rd of each month (before EMU the end of
the reserve maintenance period in Italy was on the 14th of a month), the much enhanced liquidity risk when
payment system balances become known in the afternoon provides an incentive for risk-averse banks to wait
with their transactions until later in the day. Both arguments point in the direction of a more even
distribution of trading between morning and afternoon on EOM days after the start of Monetary Union,
which is what our data suggest.
4.4.2 Main refinancing operation settlement days
The weekly MROs lead to very large exchanges of liquidity against eligible assets between the central bank
and the market. As described in 3.3, each transaction is normally settled on the Wednesday when the two-
week repo contract comes due. Table 13 compare ticks, volatility and spreads for these MRO settlement
days with other “normal” days (excluding Council and MRO auction days).43 The data indicate that quoting
activity, volatility and spreads are hardly changed on MRO settlement days. However, the MID data suggest
a massive increase in turnover. The refined picture of Table 14 indicates this tripling of turnover is
distributed relatively evenly over the morning and the afternoon, and the changed volume pattern is in no
way associated with any noteworthy changes in ticks, volatility or spreads. However, there is no guarantee
that the turnover increase on settlement Wednesdays is generally equally large outside the MID system as
well. Since the biggest euro money market traders are normally not active in the MID and since for them
MRO settlement transactions are not larger than many other tickets they handle over the day, it cannot be
taken for granted that their trading swells on those days in proportion to MID turnover.
[TABLES 13 AND 14 ABOUT HERE]
In sum, the available evidence suggests that the market deals with the extremely large trading requirements
on MRO settlement days with ease and without any significant repercussions. One factor for this calm
market may be the revolving nature of MROs, namely that the usual settlement Wednesday is preceded by a
Tuesday MRO in which market participants can procure liquidity from the Eurosystem needed on the next
day. Another one may be that for the larger players MRO settlement transactions are not of extraordinary
size.
4.4.3 Payment system disturbances
If market participants become aware that a disturbance in a major payment system may prevent them from
settling transactions with their counterparties, they may become reluctant to enter into new contracts. Hence,
severe payment system problems might be associated with large bid-ask spreads and fading trading activity.
43 Following those criteria out of 20 settlement days happening during our sample period 15 entered the comparison.
40 ECB • Work ing Pape r No 80 • Oc tobe r 2001

In order to check whether such effects can be observed in the euro overnight market, we compared ticks,
MID volumes, volatility and spreads for the special payment system days described in sub-section 3.3 with
those observed on “normal” days without late net settlement completion or problems.44 Since there were few
interesting features on those days and since any changes were relatively small, we do not report the results in
detail, but rather give a brief summary of them.
It turns out that the special payment system days identified tend to have slightly higher quoting activity for
several brokers but not the MID, particularly in the afternoon, right before the systems close. Volatility does
not seem to change, except perhaps in the MID where it is slightly up. Bid-ask spreads are slightly higher as
well for a few brokers, in particular in the pre-closing afternoon period. However, MID trading volume was
even higher than “normal”, particularly during the afternoon. In addition, we also scrutinised the only day
when there was a problem affecting TARGET, the 1 December 1999. Our data did not show any special
features on that day. In sum, the number of days with real payment system problems seems to have been
extremely small during the five months examined. Moreover, effects of any payment system problems seem
to have been rather contained, so that one cannot reject the hypothesis that the euro overnight market has
been relatively resilient to such problems during our sample period. However, apart from the general caveat
that the “voice” broker data may sometimes not give a very precise picture, this does not mean, of course,
that if a very large and severe payment system crisis was to happen in the future the money market would
necessarily remain unaffected by it.
4.5 The year 2000 changeover week
Finally, since our sample extends over the millennium change date, we want to briefly examine how the
money market behaved from Christmas 1999 (25 December) to the start of 2000 (3 January). This year 2000
(Y2K) changeover week was regarded as a particular risky episode for financial market participants, because
information technology system failures could prevent banks from trading or settling their transactions in the
payment system. Therefore, observers anticipated trading in the money and other financial markets to dry
up.
Table 15 displays ticks, MID volumes, volatility and spreads of the 5 Y2K changeover weekdays, so that
they can be compared to those of “normal” days, as contained in Tables 4, 5 and 6. The first observation is
that the days of the millennium date change were particularly inactive in terms of quoting for all “voice”
brokers but not the MID. Then, our data show extremely high volatility during the Y2K changeover days
(except for the UK-based broker Prebon Yamane, who virtually ceded quoting during this period). For
44 Using the criterion of late Euro1 end-of-day settlement completion and late TARGET closing described in sub-section 3.3, 19 days in our sample were denoted as being special or having payment system problems. These 19 days also included the only TARGET problem on 1 December 1999.
41ECB • Work ing Pape r No 80 • Oc tobe r 2001

example, this volatility at the changeoverto the new millennium tended to be somewhat higher than usually
the case at the special end-of-reserve maintenance period days. The huge spikes in Figure 4 above, almost
hitting the marginal lending facility rate level for the MID series on 30 December 1999, illustrate the point.
Quoted bid-ask spreads were also higher during the Y2K changeover week (except for the inactive French
broker), in particular in the Italian MID, where they doubled. Interestingly, comparing these spreads to EOM
spreads suggests that market participants may regard EOM days as slightly more illiquid or risky than the
Y2K changeover days. However, in line with the hardly lower MID ticks MID turnovers were only
moderately lower than on “normal” Mondays, Thursdays or Fridays.
[TABLE 15 ABOUT HERE]
In sum, the observations on ticks, volatility and spreads are consistent with the hypotheses that traders were
more reluctant to enter transactions during the Y2K changeover days and therefore overnight market
liquidity dried up, so that sometimes extreme volatility emerged. However, electronic trading in the Italian
MID carried on with almost normal turnovers, in spite of large transaction costs and high volatility.
5. Conclusion
In this paper we started the empirical analysis of the euro money market’s microstructure. This market is
particularly interesting, since it is one of the largest money markets in the world and since in its entirety it
only exists since the introduction of the new transnational currency in January 1999. The paper begins with a
description of the institutional environment of the euro money market, encompassing the central bank’s
interest-rate setting bodies, the instruments for monetary policy operations, the private market financial
instruments and trading mechanisms and the payment and settlement infrastructure for the transfer of funds.
It then describes the data collected for this study, namely five months of intraday overnight rate quotes from
5 euro area and one UK broker as well as from the Italian electronic trading system MID.
A detailed analysis of these data show “two-hump” or “u”-shaped intraday patterns for quoting frequency
and a little bit less pronounced for volatility (analogous, for example, to equity and bond markets), but a
flatter, sometimes rather weakly (single) “hump”-shaped intraday pattern for bid-ask spreads. High spreads
between 11am and 2pm may reflect the lower liquidity of the market around the lunch break (in particular
when coupled with low turnover) and on certain days the arrival of important information during the midday
period. Quoting activity, rate volatility and spreads are relatively high on days with ECB Governing Council
meetings (usually Thursdays) compared to non-Council days in the euro overnight market, particularly
during midday when the ECB’s interest rate decisions are released. These features reflect the risks for the
market related to the arrival of important new information. However, overnight rate fluctuations after the
42 ECB • Work ing Pape r No 80 • Oc tobe r 2001

press release detailing monetary policy decisions are not large compared to the usual step sizes of policy rate
changes and there is no evidence that trading volume dries up before the release, which is both consistent
with the absence of large asymmetric information and relatively precise rate expectations by the market. We
also found that ECB releases of M3 figures, referring to the first pillar of the ECB’s monetary policy
strategy, are preceded by a moderate increase in short-term volatility, but a very short slump in quoting
activity in the half-hour before is not accompanied by a similar slump in trading volume, suggesting only a
moderate degree of uncertainty. We were not able to identify any special overnight rate patterns either
before or after ECB Monthly Bulletin releases.
Tuesday’s Eurosystem main refinancing operations with the open market are associated with high MID
trading volumes across the whole day, particularly right after the announcement of the allotment results. The
latter reflects the post-operation liquidity re-allocation process, which however seems to cause some
moderate volatility only for a very short period. Since in addition bid-ask spreads are not particularly high,
neither before nor after the announcement of the auction results, one may conclude that – despite large
overbidding in the fixed-rate tenders – the overnight market functioned fairly efficiently (without signs of
adverse selection or market power) around Eurosystem open market operations. It is also shown that spreads
and volatility tend to be very high at the end of the maintenance period for Eurosystem minimum reserve
requirements, reflecting the high risks involved for banks when staying too long above or below their
reserve targets. Finally, the largest irregular “autonomous” liquidity shocks for the euro money market,
operations between national Treasuries and central banks, seem to cause some moderate high-frequency
volatility in the overnight market until the imbalances are absorbed.
Turning to the payment system results, most importantly we found that settlement days of Eurosystem main
refinancing operations are characterised by very large market turnovers (at least for the Italian electronic
trading system MID), which however the market seems to transact with ease and without any increases in
transaction costs or volatility. We also argued that institutional changes of EMU led to a balancing of
activity between the morning and afternoon trading in the Italian segment. Finally, payment system
disturbances seem to have been extremely rare and benign, so that we could not detect any strong signs of
difficulty in the overnight market related to the events identified for the two largest euro area payment
systems. Last but not least, we illustrated how the Y2K changeover led to very large volatility and bid-ask
spreads in the euro overnight market, although the MID did not experience substantial volume reductions
during this relatively risky week. Perhaps with the exception of some episodes during the very special Y2K
changeover week, overnight rate differentials between euro area countries seem extremely small, even
intraday, reflecting the very high degree of integration of this market.
The purpose of this paper has been to review a wide range of microstructure issues for the euro area
overnight market related to the institutional environment of it and other money markets more generally. The
43ECB • Work ing Pape r No 80 • Oc tobe r 2001

euro overnight market is also interesting, because it is probably the financial market that integrated fastest
with the EMU. As illustrated by our analysis, remaining cross-country heterogeneities in terms of trading
channels and practices do not lead to the emergence of any noticeable cross-border overnight rate
differentials, thereby ensuring a single interest rate for the euro area at the short end of the yield curve. The
breadth of the present analysis did not allow for going into greater depth on many of the important issues
raised. For example, future research could focus on more elaborate analyses of the relationship between
money market expectations and ECB Governing Council policy decisions as well as on the implications of
changes in open market operation auction procedures for money market trading and efficiency.
44 ECB • Work ing Pape r No 80 • Oc tobe r 2001

References
Angelini, P., 2000, Are banks risk-averse? A note on the intraday timing of operations in the interbank
market, Journal of Money, Credit, and Banking, 32(1), 54-73..
Angeloni, I., V. Gaspar and O. Tristani, 1999, The monetary policy strategy of the ECB, in D. Cobham and
G. Zis, eds., From EMS to EMU (London: Macmillan), 3-42.
Ayuso, J., I. Fuentes, J. Peñalosa, F. Restoy, 1999, El mercado monetario español en la unión monetaria,
Estudios Economicos, Banco de España, no. 67.
Ayuso, J. and R. Repullo, 2000, A model of the open market operations of the Eurosystem, Paper presented
at the Center for European Integration Studies conference “Central Bank Operations: Theory and
Evidence”, Frankfurt, 22-23 September.
Banque de France, 1999, L'adaptation des banques françaises au nouveau cadre opérationnel de la politique
monétaire, Bulletin de la Banque de France, no. 68, aout, 47-63.
Barbier, P., 2000, Etude empirique de la microstructure du marché monétaire européen, Mémoire d’Etude,
DEA de gestion – option finance, Université des Sciences Sociales, Toulouse I, Ecole Supérieure
Universitaire de Gestion, Année universitaire 1999-2000.
Bartolini, L., G. Bertola and A. Prati, 1998, Day-to-day monetary policy and the volatility of the federal
funds interest rate, EUI Working Paper ECO, no. 98/35, European University Institute, November.
Bhattacharya, S. and P. Fulghieri, 1994, Uncertain liquidity and interbank contracting, Economics Letters,
44, 287-294.
Bhattacharya, S. and D. Gale, 1987, Preference shocks, liquidity, and central bank policy, in W.A. Barnett
and K.J. Singleton, eds., New Approaches to Monetary Economics (Cambridge, UK: Cambridge
University Press), 69-88.
Bindseil, U. and P. Mercier, 1999, The single monetary policy and some aspects of its implementation, in Ø.
Thøgersen (ed.), Økonomisk politikk i en turbulent verdensøkonomi (Bergen: Fagbokforlaget), 61-92.
Bindseil, U. and F. Seitz, 2001, The supply and demand for Eurosystem deposits - The first 18 months, ECB
Working Paper, no. 44, February.
Blenck, D., 2000, Main features of the monetary policy frameworks of the Bank of Japan, the Federal
Reserve System and the Eurosystem, Paper presented at the ECB conference “The Operational
Framework of the Eurosystem and Financial Markets”, Frankfurt, 5-6 May.
Borio, C.E.V., 1997, The implementation of monetary policy in industrial countries, BIS Economic Papers,
no. 47, Bank for International Settlements, Basel, July.
Breitung, J. and D. Nautz, 2000, How German banks bid in the Eurosystem’s repo auctions: evidence from a
panel data analysis, Paper presented at the Center for European Integration Studies conference
“Central Bank Operations: Theory and Evidence”, Frankfurt, 22-23 September.
Campbell, J.Y., 1987, Money announcements, the demand for bank reserves, and the behaviour of the
federal funds rate within the statement week, Journal of Money, Credit, and Banking, 19(1), 56-67.
45ECB • Work ing Pape r No 80 • Oc tobe r 2001

Ciampolini, M. and B. Rohde, 2000, Money market integration: a market perspective, Paper presented at the
ECB conference “The Operational Framework of the Eurosystem and Financial Markets”, Frankfurt,
5-6 May.
Dacorogna, M., Müller, U., Nagler, R., Olsen, R., Pictet, O. (1993): A geographical model for the daily and
weekly seasonal volatility in the foreign exchange market, Journal of International Money and Finance,
12, 413-438.
De Bandt, O. and P. Hartmann, 2000, Systemic risk: a survey, ECB Working Papers, no. 35, November.
Detken, C. and P. Hartmann, 2000, The euro and international capital markets, International Finance, 3(1), 53-
94.
Deutsche Bundesbank, 2000, Die Integration des deutschen Geldmarkts in den einheitlichen Euro-
Geldmarkt, Monatsberichte der Deutschen Bundesbank, Januar, 15-32.
Ehrhart, K.M., 2000, Repo auctions: experimental investigation, Paper presented at the Center for European
Integration Studies conference “Central Bank Operations: Theory and Evidence”, Frankfurt, 22-23
September.
Eijffinger, S.C.W. and J.J.G. Lemmen, 1995, Money market integration in Europe, Swiss Journal of
Economics and Statistics, 131(1), 3-37.
Escrivá, J.L. and G.P. Fagan, 1996, Empirical assessment of monetary policy instruments and procedures
(MPIP) in EU countries, EMI Staff Paper, no. 2, European Monetary Institute, Frankfurt, May.
European Central Bank, 1998a, Conditions for the participation of non-euro area EU national central banks
and credit institutions in TARGET, ECB Press Release, Frankfurt, 8 July.
European Central Bank, 1998b, Third progress report on the TARGET project, Frankfurt, November.
European Central Bank, 1999a, The stability-oriented monetary policy strategy of the Eurosystem, ECB
Monthly Bulletin, January, 39-50.
European Central Bank, 1999b, Treasury activities affecting the liquidity situation in the euro area, ECB
Monthly Bulletin, July, 16f.
European Central Bank, 2000a, The TARGET system, ECB Monthly Bulletin, March, 63*f.
European Central Bank, 2000b, Switch to variable rate tenders in main refinancing operations: some
technical details, ECB Press Release, Frankfurt, 16 June.
European Central Bank, 2000c, The single monetary policy in Stage Three: General documentation on
Eurosystem monetary policy instruments and procedures (update of the 1998 edition), Frankfurt,
November.
European Central Bank, 2001, The euro money market, Frankfurt, July.
Fleming, M., 1997, The round-the-clock market for US treasury securities, FRBNY Economic Policy Review,
July, 9-32.
Freixas, X. and C. Holthausen, 2001, Interbank market integration under asymmetric information, mimeo.,
Frankfurt, April.
46 ECB • Work ing Pape r No 80 • Oc tobe r 2001

Furfine, C.H., 1999, The microstructure of the federal funds market, Financial Markets, Institutions, and
Instruments, 8(5), 24-44.
Gajewski, J.F., 1999, Earnings announcements, trades and quotes, European Financial Management, 411-
424.
Gaspar, V., G. Perez-Quiros and J. Sicilia, 2001, The ECB monetary policy strategy and the money market,
mimeo., Frankfurt, May.
Goodhart, C.A.E. and M. O’Hara, 1997, High-frequency data in financial markets: issues and applications,
Journal of Empirical Finance, 4(2-3), 73-114.
J.D. Hamilton, 1996, The daily market for federal funds, Journal of Political Economy, 104(1), 26-56.
Hartmann, P. (1998): Do Reuters spreads reflect currencies' differences in global trading activity, Journal of
International Money and Finance, 17(4), 757-784.
Hartmann, P. (1999): Trading volumes and transaction costs in the foreign exchange market - evidence from
daily dollar-yen spot data, Journal of Banking and Finance, 23(4), 801-824.
Ho, T.S.Y. and A. Saunders, 1985, A micro model of the federal funds market, Journal of Finance, 40(3),
977-990.
Hong, H. and J. Wang, 2000, Trading and returns under periodic market closures, Journal of Finance, 55(1),
297-354.
Huizinga, H. and G. Nicodème, 20001, Are international deposits tax-driven?, mimeo., Brussels, May.
Kim, O., and R.E. Verrecchia, 1991, Market reaction to anticipated announcements, Journal of Financial
Economics, 273-309.
Kim, O., and R.E. Verrecchia, 1994, Market liquidity and volume around earnings announcements, Journal
of Accounting and Economics, 41-67.
Lee, C., B. Mucklow and M. Ready, 1993, Spreads, depth and the impact of earnings information: an
intraday analysis, Review of Financial Studies, 6(2), 345-374.
Manna M, H. Pill and G. Quirós, 2001, The Eurosystem’s operational framework in the context of the
ECB’s monetary policy strategy, International Finance, 4(1), 65-99.
Milgrom, P., and N. Stokey, 1982, Information, trade and common knowledge, Journal of Economic Theory,
26(1), 17-27.
Nautz, D., 1997, How auctions reveal information: a case study of German repo rates, Journal of Money,
Credit, and Banking, 29(1), 17-25.
Nautz, D. and J. Oechsler, 1999, The repo auctions of the European Central Bank and the vanishing quota
puzzle, QSE Discussion Paper, no. 79, Humboldt-Universität zu Berlin.
Nyborg, K. and I.A. Strebulaev, 2000, Multiple unit auctions and short squeezes, Paper presented at the
Center for European Integration Studies conference “Central Bank Operations: Theory and Evidence”,
Frankfurt, 22-23 September.
Paternello, A., 1999, Il mercato interbancario e-MID. Struttura e operatività nella transizione all’euro,
mimeo., Università Cattolica del Sacro Cuore – Milano.
47ECB • Work ing Pape r No 80 • Oc tobe r 2001

Perez-Quiros, G. and H. Rodriguez, 2000, The daily market for funds in Europe: has something changed
after the EMU?, Paper presented at the ECB conference “The Operational Framework of the
Eurosystem and Financial Markets”, Frankfurt, 5-6 May.
Santillàn, J., M. Bayle and C. Thygesen, 2000, The impact of the euro on money and bond markets, ECB
Occasional Paper, no. 1, European Central Bank, Frankfurt, July.
Società Interbancaria per l'Automazione (SIA), 2000, Market for interbank deposits – MIDclient user’s
guide, Milan, 13 January.
Spindt, P.A. and J.R. Hoffmeister, 1988, The micromechanics of the federal funds market: implications for
day-of-the-week effects in funds rate variability, Journal of Financial and Quantitative Analysis,
23(4), 401-416.
Vergara, P., 2000, The performance of the operational framework of the Eurosystem since the introduction
of the euro: a market appraisal, Paper presented at the ECB conference “The Operational Framework
of the Eurosystem and Financial Markets”, Frankfurt, 5-6 May.
Wood, R.A., T.H. McInish and J.K. Ord, 1985, An investigation of transactions data for NYSE stocks,
Journal of Finance, 40(3), 723-741.
48 ECB • Work ing Pape r No 80 • Oc tobe r 2001

Figu
re 3
: Am
ount
s bi
d an
d al
lotte
d in
the
20 m
ain
refin
anci
ng a
uctio
ns b
etw
een
1 N
ovem
ber 1
999
and
23
Mar
ch 2
000
050
010
0015
0020
0025
0030
0035
0040
0045
00
2030
4050
6070
8090
100
Tota
l am
ount
s al
lote
d (b
illio
n Eu
ro)
Total amounts bid (billion Euro)
14-F
eb-0
0
1-Fe
b-00
11-J
an-0
0
2-N
ov-9
9
Sour
ce: E
CB
49ECB • Work ing Pape r No 80 • Oc tobe r 2001

Figu
re 4
: Eur
o ov
erni
ght d
epos
it ra
tes
quot
ed b
y se
lect
ed b
roke
rs, N
ov 1
999
to M
arch
200
0, in
terp
olat
ed
mid
rate
s fo
r 3-h
our i
nter
vals
1.52
2.53
3.54
4.5
03-Nov-99
15-Nov-99
25-Nov-99
08-Dec-99
20-Dec-99
30-Dec-99
13-Jan-00
25-Jan-00
04-Feb-00
17-Feb-00
29-Feb-00
10-Mar-00
23-Mar-00
MID
BES
TC
IMV
GEH
AG
REL
KLIE
MM
MPY
ECPY
WM
EUR
OM
RO
rate
ECB
depo
sit r
ate
ECB
mar
g le
nd. r
ate
50 ECB • Work ing Pape r No 80 • Oc tobe r 2001
Sour
ce: E
CB,
e-M
ID.

Figu
re 5
: Int
rada
y tra
ding
vol
ume
and
quot
ing
frequ
ency
("
best
ser
ies"
) in
the
MID
sys
tem
, "no
rmal
" day
s
0510152025
8:00
-9:0
09:
00-1
0:00
10:0
0-11
:00
11:0
0-12
:00
12:0
0-13
:00
13:0
0-14
:00
14:0
0-15
:00
15:0
0-16
:00
16:0
0-17
:00
17:0
0-18
:00
Trad
ing
volu
me
per h
our (
100
mn.
Eur
o)N
umbe
r of t
icks
per
hou
r
Sour
ce: e
-MID
, aut
hors
' cal
cula
tions
51ECB • Work ing Pape r No 80 • Oc tobe r 2001

Figu
re 6
: Int
rada
y tra
ding
vol
ume
and
quot
ing
frequ
ency
("
best
ser
ies"
) in
the
MID
sys
tem
, end
of m
aint
enan
ce p
erio
d da
ys
051015202530354045
8:00
-9:0
09:
00-1
0:00
10:0
0-11
:00
11:0
0-12
:00
12:0
0-13
:00
13:0
0-14
:00
14:0
0-15
:00
15:0
0-16
:00
16:0
0-17
:00
17:0
0-18
:00
Trad
ing
volu
me
per h
our (
100
mn.
Eur
o)N
umbe
r of t
icks
per
hou
r
Sour
ce: e
-MID
, aut
hors
' cal
cula
tion
52 ECB • Work ing Pape r No 80 • Oc tobe r 2001

53ECB • Work ing Pape r No 80 • Oc tobe r 2001
Tabl
e 4:
Ave
rage
quo
ting
freq
uenc
y an
d M
ID v
olum
es in
the
euro
ove
rnig
ht m
arke
t on
"nor
mal
" da
ys, N
ovem
ber 1
999
to M
arch
200
0
FRA
NC
ESP
AIN
NET
HER
LAN
DS
UK
WEE
KDAY
INTR
ADAY
PER
IOD
GR
ELKL
IEM
MM
GEH
AC
IMV
PYW
MEU
RO
PYEC
POO
LED
"VO
ICE"
BR
OKE
RS
MID
BES
TM
ID V
OLU
MES
(in m
il. E
uro)
DA
Y A
VER
AG
E: 8
:00-
17:0
00.
93.
13.
25.
02.
55.
720
.368
.194
95.8
MO
ND
AY
8:00
-11:
000.
62.
51.
62.
31.
53.
311
.827
.929
51.0
(17
in s
ampl
e)11
:00-
14:0
00.
10.
10.
41.
20.
10.
42.
216
.026
85.1
14:0
0-17
:00
0.2
0.6
1.2
1.5
0.8
1.9
6.2
24.2
3859
.7
DA
Y A
VER
AG
E: 8
:00-
17:0
02.
38.
48.
07.
35.
912
.244
.174
.421
214.
1TU
ESD
AY
8:00
-11:
001.
34.
13.
72.
82.
04.
918
.825
.159
49.5
(17
in s
ampl
e)11
:00-
14:0
00.
21.
92.
02.
61.
82.
611
.218
.562
48.4
14:0
0-17
:00
0.8
2.4
2.3
1.8
2.1
4.6
14.0
30.8
9016
.2
DA
Y A
VER
AG
E: 8
:00-
17:0
01.
17.
66.
84.
84.
210
.534
.965
.725
026.
0W
EDN
ESD
AY
8:00
-11:
000.
53.
63.
31.
82.
34.
315
.823
.284
78.8
(17
in s
ampl
e)11
:00-
14:0
00.
21.
21.
10.
90.
41.
45.
213
.755
44.0
14:0
0-17
:00
0.3
2.8
2.4
2.1
1.5
4.8
13.8
28.8
1100
3.3
DA
Y A
VER
AG
E: 8
:00-
17:0
01.
85.
66.
97.
16.
513
.140
.982
.292
77.9
THU
RSD
AY
8:00
-11:
000.
32.
93.
11.
52.
15.
415
.226
.630
72.5
(17
in s
ampl
e)11
:00-
14:0
00.
51.
82.
63.
81.
62.
813
.222
.423
02.6
14:0
0-17
:00
1.0
0.9
1.1
1.8
2.7
4.9
12.4
33.2
3902
.8
DA
Y A
VER
AG
E: 8
:00-
17:0
00.
66.
76.
66.
15.
29.
534
.784
.597
20.8
FRID
AY
8:00
-11:
000.
12.
93.
32.
32.
93.
815
.433
.333
91.8
(18
in s
ampl
e)11
:00-
14:0
00.
21.
11.
02.
40.
41.
16.
218
.825
41.8
14:0
0-17
:00
0.3
2.7
2.3
1.4
1.8
4.6
13.1
32.4
3787
.2
DA
Y A
VER
AG
E: 8
:00-
17:0
01.
36.
36.
36.
14.
910
.235
.075
.114
886.
1A
LL "
NO
RM
AL"
DA
YS8:
00-1
1:00
0.6
3.2
3.0
2.1
2.2
4.3
15.4
27.3
4752
.7(8
6 in
sam
ple)
11:0
0-14
:00
0.2
1.2
1.4
2.2
0.9
1.7
7.6
17.9
3849
.014
:00-
17:0
00.
51.
91.
81.
71.
84.
211
.929
.962
84.4
Not
es:
The
cell
entri
es d
escr
ibe
the
aver
age
num
ber o
f quo
te c
hang
es (t
ick
frequ
ency
) for
the
resp
ectiv
e in
terv
al d
urin
g th
e sa
mpl
e."N
orm
al" d
ays
are
all b
usin
ess
days
, exc
ludi
ng th
e la
st tw
o da
ys o
f the
min
imum
rese
rve
mai
nten
ance
per
iod
and
the
days
of t
he y
ear 2
000
(Y2K
) cha
ngeo
ver w
eek.
The
"poo
led"
ser
ies
is d
eriv
ed fr
om th
e un
ion
of "v
oice
" bro
ker q
uote
s in
Fra
nce,
Ger
man
y, S
pain
, the
Net
herla
nds
and
the
UK.
Sour
ce:
Reu
ters
, e-M
ID, a
utho
rs' c
alcu
latio
ns
GER
MA
NY
ITA
LY

54 ECB • Work ing Pape r No 80 • Oc tobe r 2001
Tabl
e 5:
Ave
rage
vol
atili
ty in
the
euro
ove
rnig
ht m
arke
t on
"nor
mal
" da
ys, N
ovem
ber 1
999
to M
arch
200
0
FRA
NC
ESP
AIN
NET
HER
LAN
DS
UK
ITA
LY
WEE
KDAY
INTR
ADAY
PER
IOD
GR
ELKL
IEM
MM
GEH
AC
IMV
PYW
MEU
RO
PYEC
POO
LED
"VO
ICE"
BR
OKE
RS
MID
BES
T
DA
Y VO
LATI
LITY
3.1
[1.1
]3.
6 [0
.9]
2.2
[1.0
]2.
2 [0
.7]
4.6
[2.5
]2.
5 [0
.8]
3.0
[1.2
]2.
3 [1
.4]
MO
ND
AY
8:00
-11:
000.
9 [1
.1]
2.2
[1.2
]0.
6 [1
.5]
3.7
[1.0
]0.
5 [2
.6]
3.2
[0.9
]1.
9 [1
.4]
3.2
[1.8
](1
7 in
sam
ple)
11:0
0-14
:00
7.6
[0.0
]2.
9 [0
.0]
1.5
[0.5
]1.
2 [0
.6]
3.0
[0.0
]1.
1 [0
.6]
2.9
[0.5
]1.
2 [1
.2]
14:0
0-17
:00
2.0
[1.1
]3.
9 [0
.4]
3.3
[0.6
]1.
9 [0
.6]
6.1
[2.1
]3.
3 [0
.7]
3.4
[0.9
]2.
6 [1
.2]
DA
Y VO
LATI
LITY
4.2
[2.8
]2.
7 [1
.3]
2.5
[1.6
]2.
7 [1
.1]
4.3
[1.6
]3.
0 [1
.3]
3.2
[1.6
]2.
5 [1
.8]
TUES
DA
Y8:
00-1
1:00
6.7
[5.3
]4.
4 [1
.5]
2.7
[1.7
]3.
9 [1
.7]
2.0
[1.7
]5.
1 [1
.7]
4.1
[2.3
]3.
0 [1
.7]
(17
in s
ampl
e)11
:00-
14:0
02.
5 [1
.8]
1.8
[1.4
]2.
9 [1
.0]
1.6
[1.0
]3.
4 [2
.3]
2.1
[1.0
]2.
4 [1
.4]
2.4
[1.6
]14
:00-
17:0
04.
3 [1
.0]
2.3
[1.0
]2.
1 [2
.1]
2.1
[0.7
]6.
2 [0
.8]
2.6
[1.2
]3.
3 [1
.1]
2.2
[1.9
]
DA
Y VO
LATI
LIT Y
3.9
[2.3
]2.
9 [1
.4]
3.0
[1.2
]4.
3 [1
.1]
3.4
[1.7
]3.
1 [1
.1]
3.4
[1.5
]2.
9 [1
.5]
WED
NES
DA
Y8:
00-1
1:00
4.1
[2.4
]3.
2 [1
.1]
2.9
[1.2
]3.
8 [1
.3]
5.6
[2.2
]3.
3 [1
.1]
3.8
[1.6
]3.
1 [1
.7]
(17
in s
ampl
e)11
:00-
14:0
03.
1 [1
.8]
2.7
[1.6
]3.
0 [1
.2]
2.6
[0.8
]5.
0 [0
.6]
2.6
[1.4
]3.
2 [1
.2]
2.0
[1.3
]14
:00-
17:0
04.
2 [2
.5]
3.0
[1.8
]3.
0 [1
.2]
7.9
[1.1
]2.
0 [0
.8]
3.7
[1.1
]3.
9 [1
.4]
3.7
[1.6
]
DA
Y VO
LATI
LIT Y
7.1
[2.6
]4.
7 [1
.9]
4.2
[1.9
]6.
5 [1
.6]
5.6
[2.3
]4.
2 [1
.9]
5.4
[2.0
]2.
9 [1
.8]
THU
RSD
AY
8:00
-11:
0013
.1 [0
.0]
4.6
[1.8
]4.
5 [1
.8]
4.2
[0.8
]3.
7 [2
.6]
4.8
[1.9
]5.
8 [1
.8]
4.0
[2.0
](1
7 in
sam
ple)
11:0
0-14
:00
2.6
[1.8
]6.
2 [2
.0]
4.7
[2.3
]6.
3 [2
.0]
6.8
[1.4
]5.
5 [2
.3]
5.3
[1.9
]2.
7 [1
.7]
14:0
0-17
:00
6.0
[2.8
]4.
0 [1
.8]
3.5
[1.4
]13
.0 [1
.7]
5.9
[2.7
]2.
6 [1
.5]
5.8
[2.0
]1.
9 [1
.7]
DA
Y VO
LATI
LITY
5.8
[2.1
]3.
0 [1
.3]
2.7
[1.3
]5.
7 [3
.5]
3.8
[1.4
]2.
6 [1
.1]
3.9
[1.8
]2.
9 [1
.6]
FRID
AY
8:00
-11:
008.
5 [0
.0]
2.1
[1.3
]1.
8 [1
.1]
3.2
[8.4
]2.
8 [1
.8]
2.8
[1.3
]3.
5 [2
.8]
3.6
[1.9
](1
8 in
sam
ple)
11:0
0-14
:00
5.2
[3.5
]1.
6 [1
.1]
1.3
[0.9
]1.
2 [1
.3]
2.5
[1.6
]1.
8 [0
.7]
2.3
[1.5
]1.
7 [1
.5]
14:0
0-17
:00
2.7
[1.4
]4.
8 [1
.5]
4.1
[1.9
]7.
9 [0
.9]
5.1
[0.8
]3.
3 [1
.1]
4.7
[1.3
]3.
6 [1
.3]
DA
Y VO
LATI
LITY
5.1
[2.3
]3.
3 [1
.4]
2.9
[1.5
]3.
8 [1
.7]
4.3
[1.9
]3.
1 [1
.3]
3.8
[1.7
]2.
7 [1
.6]
ALL
"N
OR
MA
L" D
AYS
8:00
-11:
009.
1 [3
.1]
3.6
[1.4
]2.
8 [1
.5]
3.7
[3.2
]3.
0 [2
.2]
3.9
[1.4
]4.
4 [2
.1]
3.4
[1.8
](8
6 in
sam
ple)
11:0
0-14
:00
3.5
[2.2
]2.
8 [1
.6]
2.6
[1.4
]2.
6 [1
.2]
4.4
[1.7
]2.
7 [1
.3]
3.1
[1.6
]2.
0 [1
.4]
14:0
0-17
:00
4.0
[1.9
]3.
5 [1
.4]
3.2
[1.5
]7.
4 [1
.0]
4.9
[1.4
]3.
1 [1
.1]
4.2
[1.4
]2.
8 [1
.5]
Not
es:
See
Tabl
e 4.
Cel
l ent
ries
desc
ribe
the
aver
age
abso
lute
ove
rnig
ht ra
te c
hang
e fo
r the
resp
ectiv
e in
terv
al d
urin
g th
e sa
mpl
e pe
riod.
Sta
rt an
d en
d ra
tes
have
bee
n de
rived
by
linea
r int
erpo
latio
n.Av
erag
e qu
ote-
to-q
uote
sta
ndar
d de
viat
ions
for t
he re
spec
tive
inte
rval
are
repo
rted
in s
quar
e br
acke
ts.
Both
vol
atilit
y m
easu
res
are
mul
tiplie
d by
100
, so
that
they
are
in b
asis
poi
nts
(100
th o
f per
cent
age
poin
ts).
Sour
ce:
Reu
ters
, e-M
ID, a
utho
rs' c
alcu
latio
ns
GER
MA
NY

55ECB • Work ing Pape r No 80 • Oc tobe r 2001
Tabl
e 6:
Ave
rage
bid
-ask
spr
eads
in th
e eu
ro o
vern
ight
mar
ket o
n "n
orm
al"
days
, N
ovem
ber 1
999
to M
arch
200
0
FRA
NC
ESP
AIN
NET
HER
LAN
DS
UK
ITA
LY
WEE
KDAY
INTR
ADAY
PER
IOD
GR
ELKL
IEM
MM
GEH
AC
IMV
PYW
MEU
RO
PYEC
POO
LED
"VO
ICE"
BR
OKE
RS
MID
BES
T
DA
Y A
VER
AG
E4.
43.
63.
69.
93.
73.
84.
92.
5M
ON
DA
Y8:
00-1
1:00
4.3
3.5
3.8
9.9
3.6
3.6
4.8
3.3
(17
in s
ampl
e)11
:00-
14:0
04.
03.
03.
310
.03.
53.
34.
51.
914
:00-
17:0
05.
04.
23.
59.
83.
94.
15.
12.
0
DA
Y A
VER
AG
E7.
34.
23.
210
.04.
34.
15.
52.
7TU
ESD
AY
8:00
-11:
008.
04.
03.
910
.04.
43.
75.
73.
1(1
7 in
sam
ple)
11:0
0-14
:00
6.7
4.5
3.2
10.0
4.2
4.3
5.5
2.1
14:0
0-17
:00
6.2
4.4
2.1
9.9
4.2
4.2
5.2
2.5
DA
Y A
VER
AG
E7.
14.
03.
89.
93.
74.
45.
52.
8W
EDN
ESD
AY
8:00
-11:
006.
83.
83.
610
.23.
54.
25.
33.
4(1
7 in
sam
ple)
11:0
0-14
:00
4.8
4.3
3.9
9.7
4.5
4.6
5.3
2.4
14:0
0-17
:00
9.6
4.2
3.9
9.7
3.8
4.4
5.9
2.3
DA
Y A
VER
AG
E7.
94.
44.
610
.04.
24.
56.
02.
9TH
UR
SDA
Y8:
00-1
1:00
7.6
4.3
4.0
10.1
4.4
4.4
5.8
3.2
(17
in s
ampl
e)11
:00-
14:0
010
.94.
35.
410
.04.
64.
16.
62.
714
:00-
17:0
06.
65.
04.
59.
93.
94.
85.
82.
7
DA
Y A
VER
AG
E9.
34.
13.
710
.03.
94.
35.
92.
6FR
IDA
Y8:
00-1
1:00
7.0
3.9
3.4
9.9
4.1
4.2
5.4
3.5
(18
in s
ampl
e)11
:00-
14:0
08.
74.
53.
910
.14.
64.
46.
12.
314
:00-
17:0
010
.64.
23.
99.
93.
54.
36.
11.
9
DA
Y A
VER
AG
E7.
24.
13.
810
.04.
04.
25.
62.
7A
LL "
NO
RM
AL"
DA
YS8:
00-1
1:00
6.9
3.9
3.7
10.0
4.0
4.1
5.4
3.3
(86
in s
ampl
e)11
:00-
14:0
08.
24.
44.
210
.04.
44.
25.
92.
314
:00-
17:0
07.
24.
33.
59.
83.
94.
45.
52.
3
Not
es:
See
Tabl
e 4.
Cel
l ent
ries
desc
ribe
the
aver
age
quot
ed b
id-a
sk s
prea
d (a
sk o
vern
ight
rate
min
us b
id o
vern
ight
rate
) for
the
resp
ectiv
e in
terv
al d
urin
g th
e sa
mpl
e.Sp
read
s ar
e m
ultip
lied
by 1
00 a
nd th
eref
ore
in b
asis
poi
nts
(100
th o
f per
cen
t).So
urce
: R
eute
rs, e
-MID
, aut
hors
' cal
cula
tions
GER
MA
NY

56 ECB • Work ing Pape r No 80 • Oc tobe r 2001
Tabl
e 7:
Ave
rage
quo
ting
freq
uenc
y, M
ID v
olum
es, v
olat
ility
and
spr
eads
in th
e eu
ro o
vern
ight
mar
ket o
n "n
orm
al"
ECB
Gov
erni
ng C
ounc
il da
ys a
s co
mpa
red
to "
norm
al"
non-
Gov
erni
ng C
ounc
il Th
ursd
ays,
Nov
embe
r 199
9 to
Mar
ch 2
000
(all
brok
ers)
FRA
NC
ESP
AIN
NET
HER
LAN
DS
UK
GR
ELKL
IEM
MM
GEH
AC
IMV
PWYM
EUR
OPY
ECPO
OLE
D "V
OIC
E" B
RO
KER
SM
ID B
EST
MID
VO
LUM
ES (i
n m
il. E
uro)
Who
le d
ays
1.8
7.3
9.2
8.1
5.4
13.3
52.0
85.6
1004
9.7
8:00
-11:
000.
33.
44.
12.
01.
54.
315
.624
.729
06.7
11:0
0-14
:00
0.5
2.4
3.8
4.3
0.9
2.4
14.3
23.2
2528
.314
:00-
17:0
01.
01.
51.
31.
83.
06.
615
.237
.746
14.8
Who
le d
ays
1.0
2.9
2.7
4.3
6.1
7.9
25.3
60.8
9424
.38:
00-1
1:00
0.2
1.6
1.3
0.6
2.3
2.8
8.77
21.1
3444
.111
:00-
14:0
00.
20.
80.
82.
41.
92.
48.
5515
.821
96.5
14:0
0-17
:00
0.6
0.6
0.6
1.3
1.9
2.7
7.56
23.9
3783
.8
Who
le d
ays
7.4
4.9
4.8
6.3
7.4
5.2
5.8
3.6
8:00
-11:
0017
.63.
94.
93.
94.
25.
46.
04.
911
:00-
14:0
03.
08.
56.
85.
64
10.2
6.6
6.7
3.5
14:0
0-17
:00
2.5
4.1
3.5
11.6
6.4
3.5
4.9
2.6
Who
le d
ays
6.3
4.0
3.1
2.6
3.1
2.7
3.5
2.4
8:00
-11:
007.
83.
12.
33.
93.
13.
23.
43.
411
:00-
14:0
01.
62.
01.
62.
61.
41.
81.
81.
314
:00-
17:0
09.
56.
25.
15.
54.
93.
34.
02.
4
Who
le d
ays
8.0
4.7
4.1
9.9
5.6
4.5
5.6
2.9
8:00
-11:
006.
74.
13.
710
.25.
04.
54.
93.
511
:00-
14:0
013
.15.
25.
510
.16.
84.
07.
22.
414
:00-
17:0
08.
35.
24.
69.
54.
54.
65.
32.
5
Who
le d
ays
5.2
3.5
3.3
9.7
4.3
4.3
4.8
2.0
8:00
-11:
007.
53.
43.
99.
84.
54.
64.
32.
411
:00-
14:0
05.
03.
13.
510
.04.
04.
15.
11.
514
:00-
17:0
04.
83.
73.
010
.33.
84.
45.
51.
8
Not
es:
For d
efin
ition
s of
quo
te fr
eque
ncy,
vol
atilit
y an
d sp
read
s se
e no
tes
to T
able
s 4,
5 a
nd 6
.D
ates
of E
CB
Gov
erni
ng C
ounc
il m
eetin
gs w
ere:
4/1
1/99
, 18/
11/9
9, 2
/12/
99, 1
5/12
/99,
5/0
1/00
, 20/
01/0
0, 3
/02/
00, 1
7/02
/00,
2/0
3/00
, 16/
03/0
0.
The
20/0
1/00
mee
ting
is e
xclu
ded
from
the
data
in th
e ta
ble,
sin
ce it
coi
ncid
ed w
ith th
e en
d of
a re
serv
e m
aint
enan
ce p
erio
d."N
orm
al" T
hurs
days
with
out E
CB
Gov
erni
ng C
ounc
il m
eetin
gs (t
he c
ontro
l gro
up d
ays)
wer
e: 1
1/11
/99,
25/
11/9
9, 9
/12/
99, 1
6/12
/00,
06/
01/0
0, 1
3/01
/00,
27/
01/0
0, 1
0/02
/00,
24/
02/0
0, 9
/03/
00So
urce
: R
eute
rs, e
-MID
, aut
hors
' cal
cula
tions
NO
N-G
OVE
RN
ING
CO
UN
CIL
DAY
S (1
0)
QU
OTI
NG
FR
EQU
ENC
YG
OVE
RN
ING
CO
UN
CIL
DAY
S (9
)
NO
N-G
OVE
RN
ING
CO
UN
CIL
TH
UR
SDAY
S (1
0)
VOLA
TILI
TYG
OVE
RN
ING
CO
UN
CIL
DAY
S (9
)
NO
N-G
OVE
RN
ING
CO
UN
CIL
TH
UR
SDAY
S (1
0)
SPR
EAD
S
ITA
LYG
ERM
AN
Y
GO
VER
NIN
G C
OU
NC
IL D
AYS
(9)

57ECB • Work ing Pape r No 80 • Oc tobe r 2001
Tabl
e 8:
Hig
h-fr
eque
ncy
anal
ysis
of a
vera
ge q
uotin
g fr
eque
ncy,
vol
umes
, vol
atili
ty a
nd s
prea
ds in
the
Italia
n M
ID o
n "n
orm
al"
ECB
as c
ompa
red
to "
norm
al"
non-
Gov
erni
ng C
ounc
il Th
ursd
ays,
Nov
embe
r 199
9 to
Mar
ch 2
000
INTR
ADAY
PER
IOD
QU
OTI
NG
FR
EQU
ENC
YVO
LUM
ESVO
LATI
LITY
S
PREA
DS
ECB
GO
VER
NIN
G C
OU
NC
IL D
AYS
(9)
DA
Y A
VER
AG
E10
3.9
1099
8.6
1.5
[1.5
]3.
47:
45-8
:30
2.0
0.0
0.7
[0.9
]11
.48:
30-9
:15
9.3
379.
83.
2 [1
.2]
4.0
9:15
-10:
007.
011
20.3
1.7
[1.3
]2.
310
:00-
10:4
56.
010
78.7
1.5
[1.4
]3.
110
:45-
11:3
08.
486
1.6
1.3
[1.5
]4.
011
:30-
12:1
56.
078
4.4
1.0
[1.4
]2.
212
:15-
13:0
05.
358
0.4
1.1
[1.1
]2.
513
:00-
13:4
54.
342
1.0
0.7
[1.2
]2.
613
:45-
14:3
09.
264
1.2
4.6
[3.3
]5.
114
:30-
15:1
513
.015
86.9
1.5
[2.0
]3.
615
:15-
16:0
09.
312
79.3
1.2
[1.6
]2.
516
:00-
16:4
511
.910
45.1
1.3
[1.6
]2.
616
:45-
17:3
08.
780
8.5
1.7
[1.7
]2.
517
:30-
18:1
53.
341
1.5
0.8
[1.1
]3.
0
OTH
ER T
HU
RSD
AYS
(10)
DA
Y A
VER
AG
E70
.989
91.2
1.0
[0.9
]2.
17:
45-8
:30
1.8
1.5
0.9
[0.6
]9.
08:
30-9
:15
7.0
402.
92.
7 [1
.0]
3.1
9:15
-10:
003.
812
74.1
1.2
[0.7
]1.
210
:00-
10:4
57.
510
43.1
1.2
[0.9
]1.
610
:45-
11:3
06.
285
2.2
0.8
[0.8
]1.
611
:30-
12:1
56.
960
4.5
0.9
[1.2
]1.
812
:15-
13:0
03.
747
1.3
0.6
[0.8
]1.
413
:00-
13:4
52.
043
2.6
0.4
[0.6
]1.
113
:45-
14:3
02.
123
9.3
0.4
[0.7
]1.
514
:30-
15:1
57.
099
6.7
0.9
[1.0
]1.
615
:15-
16:0
06.
487
6.7
0.9
[1.3
]2.
716
:00-
16:4
54.
894
8.8
0.8
[1.0
]1.
716
:45-
17:3
010
.763
9.9
1.3
[1.3
]2.
317
:30-
18:1
51.
020
7.6
0.8
[0.9
]1.
4
Not
es:
See
Tabl
e 7.
Sour
ce:
e-M
ID, a
utho
rs' c
alcu
latio
ns
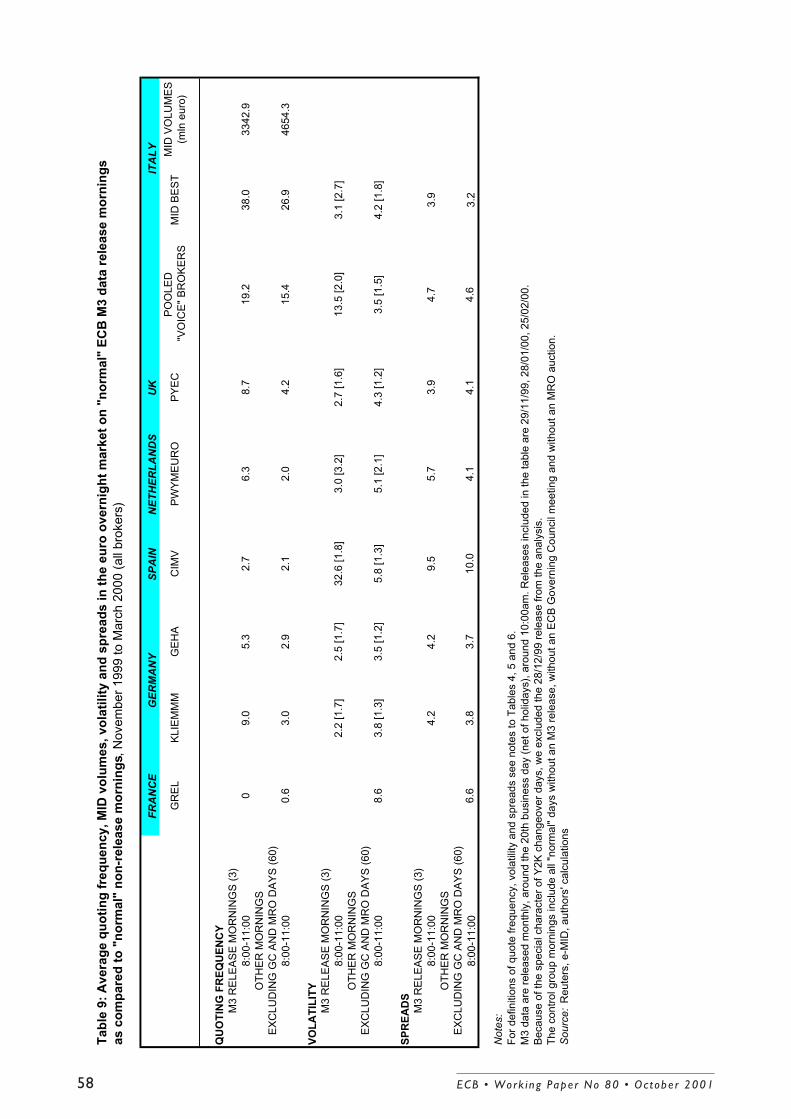
58 ECB • Work ing Pape r No 80 • Oc tobe r 2001
Tabl
e 9:
Ave
rage
quo
ting
freq
uenc
y, M
ID v
olum
es, v
olat
ility
and
spr
eads
in th
e eu
ro o
vern
ight
mar
ket o
n "n
orm
al"
ECB
M3
data
rele
ase
mor
ning
s as
com
pare
d to
"no
rmal
" no
n-re
leas
e m
orni
ngs,
Nov
embe
r 199
9 to
Mar
ch 2
000
(all
brok
ers)
FRA
NC
ESP
AIN
NET
HER
LAN
DS
UK
GR
ELKL
IEM
MM
GEH
AC
IMV
PWYM
EUR
OPY
ECPO
OLE
D "V
OIC
E" B
RO
KER
SM
ID B
EST
MID
VO
LUM
ES(m
ln e
uro)
QU
OTI
NG
FR
EQU
ENC
YM
3 R
ELEA
SE M
OR
NIN
GS
(3)
8:00
-11:
000
9.0
5.3
2.7
6.3
8.7
19.2
38.0
3342
.9O
THER
MO
RN
ING
SEX
CLU
DIN
G G
C A
ND
MR
O D
AYS
(60)
8:00
-11:
000.
63.
02.
92.
12.
04.
215
.426
.946
54.3
VOLA
TILI
TYM
3 R
ELEA
SE M
OR
NIN
GS
(3)
8:00
-11:
002.
2 [1
.7]
2.5
[1.7
]32
.6 [1
.8]
3.0
[3.2
]2.
7 [1
.6]
13.5
[2.0
]3.
1 [2
.7]
OTH
ER M
OR
NIN
GS
EXC
LUD
ING
GC
AN
D M
RO
DAY
S (6
0)8:
00-1
1:00
8.6
3.8
[1.3
]3.
5 [1
.2]
5.8
[1.3
]5.
1 [2
.1]
4.3
[1.2
]3.
5 [1
.5]
4.2
[1.8
]
SPR
EAD
SM
3 R
ELEA
SE M
OR
NIN
GS
(3)
8:00
-11:
004.
24.
29.
55.
73.
94.
73.
9O
THER
MO
RN
ING
SEX
CLU
DIN
G G
C A
ND
MR
O D
AYS
(60)
8:00
-11:
006.
63.
83.
710
.04.
14.
14.
63.
2
Not
es:
For d
efin
ition
s of
quo
te fr
eque
ncy,
vol
atilit
y an
d sp
read
s se
e no
tes
to T
able
s 4,
5 a
nd 6
.M
3 da
ta a
re re
leas
ed m
onth
ly, a
roun
d th
e 20
th b
usin
ess
day
(net
of h
olid
ays)
, aro
und
10:0
0am
. Rel
ease
s in
clud
ed in
the
tabl
e ar
e 29
/11/
99, 2
8/01
/00,
25/
02/0
0.
Beca
use
of th
e sp
ecia
l cha
ract
er o
f Y2K
cha
ngeo
ver d
ays,
we
excl
uded
the
28/1
2/99
rele
ase
from
the
anal
ysis
.Th
e co
ntro
l gro
up m
orni
ngs
incl
ude
all "
norm
al" d
ays
with
out a
n M
3 re
leas
e, w
ithou
t an
ECB
Gov
erni
ng C
ounc
il m
eetin
g an
d w
ithou
t an
MR
O a
uctio
n.So
urce
: R
eute
rs, e
-MID
, aut
hors
' cal
cula
tions
ITA
LYG
ERM
AN
Y

59ECB • Work ing Pape r No 80 • Oc tobe r 2001
Tabl
e 10
: Hig
h-fr
eque
ncy
anal
ysis
of a
vera
ge q
uotin
g fr
eque
ncy,
vol
umes
, vol
atili
ty a
nd s
prea
ds in
the
Italia
n M
ID o
n "
norm
al"
ECB
M3
data
rele
ase
mor
ning
s as
com
pare
d to
"no
rmal
" no
n-re
leas
e m
orni
ngs,
Nov
embe
r 199
9 to
Mar
ch 2
000
INTR
ADAY
PER
IOD
QU
OTI
NG
FR
EQU
ENC
YVO
LUM
ESVO
LATI
LITY
SPR
EAD
S
M3
REL
EASE
MO
RN
ING
S (3
)M
OR
NIN
G A
VER
AG
E42
.739
45.0
1.6
[1.7
]4.
08:
00-8
:30
2.0
0.0
1.8
[1.9
]11
.88:
30-9
:00
11.0
338.
85.
3 [2
.2]
7.2
9:00
-9:3
07.
782
0.7
5.4
[1.6
]2.
09:
30-1
0:00
2.0
949.
71.
4 [0
.6 ]
1.0
10:0
0-10
:30
7.7
787.
01.
8 [1
.5]
1.7
10:3
0-11
:00
7.7
446.
61.
9 [1
.7]
3.3
11:0
0-11
:30
3.0
214.
81.
2 [3
.6]
4.4
11:3
0-12
:00
1.7
387.
31.
7 [0
.7 ]
1.2
MO
RN
ING
AVE
RA
GE
34.1
61
70.2
1.
0 [1
.2]
3.0
8:00
-8:3
02.
02.
90.
9 [1
.1]
10.9
8:30
-9:0
05.
513
2.8
2.1
[1.0
]5.
19:
00-9
:30
6.7
1108
.72.
4 [1
.0]
2.0
9:30
-10:
004.
511
94.3
1.2
[0.9
]1.
710
:00-
10:3
04.
810
94.3
0.9
[1.1
]1.
810
:30-
11:0
03.
911
21.3
0.9
[1.4
]2.
311
:00-
11:3
03.
780
4.4
0.8
[1.0
]1.
911
:30-
12:0
03.
171
1.4
0.9
[1.0
]1.
9
Not
es:
See
Tabl
e 9.
Sour
ce:
e-M
ID, a
utho
rs' c
alcu
latio
ns
OTH
ER M
OR
NIN
GS,
EXC
L. G
C a
nd M
RO
DAY
S (6
0)

60 ECB • Work ing Pape r No 80 • Oc tobe r 2001
Tabl
e 11
: Hig
h-fr
eque
ncy
anal
ysis
of q
uotin
g fr
eque
ncy,
vol
umes
, vol
atili
ty a
nd s
prea
ds in
the
Italia
n M
ID o
n"n
orm
al"
MR
O a
uctio
n da
ys a
s co
mpa
red
to "
norm
al"
non-
MR
O w
eek
days
, Nov
embe
r 199
9 to
Mar
ch 2
000
INTR
ADAY
PER
IOD
QU
OTI
NG
FR
EQU
ENC
YVO
LUM
ESVO
LATI
LITY
S
PREA
DS
MR
O A
UC
TIO
N D
AYS
(14)
DA
Y A
VER
AG
E81
.225
154.
01.
3 [2
.0]
2.3
8:15
-9:0
06.
834
1.5
1.2
[0.9
]4.
89:
00-9
:45
9.1
3167
.61.
8 [1
.1]
2.1
9:45
-10:
304.
823
95.5
0.9
[1.1
]2.
110
:30-
11:1
55.
316
26.0
0.9
[1.4
]2.
011
:15-
12:0
09.
828
72.7
1.8
[1.4
]2.
012
:00-
12:4
54.
612
28.5
1.6
[1.2
]1.
812
:45-
13:3
03.
414
99.4
1.1
[1.3
]2.
213
:30-
14:1
51.
655
2.4
0.8
[0.7
]1.
314
:15-
15:0
05.
732
80.1
1.4
[1.3
]2.
115
:00-
15:4
57.
832
20.2
1.0
[1.2
]1.
815
:45-
16:3
07.
522
65.8
1.3
[1.0
]1.
916
:30-
17:1
58.
820
13.9
1.2
[1.3
]2.
117
:15-
18:0
05.
969
0.6
1.1
[1.4
]2.
3
OTH
ER D
AYS
, EXC
L. G
C D
AYS
(58)
DA
Y A
VER
AG
E79
.515
412.
01.
2 [2
.1]
2.5
8:15
-9:0
07.
514
6.3
2.6
[1.3
]6.
59:
00-9
:45
9.1
1804
.61.
7 [1
.1]
1.9
9:45
-10:
307.
016
49.9
1.1
[1.1
]1.
810
:30-
11:1
55.
915
07.6
0.9
[1.3
]2.
311
:15-
12:0
04.
710
59.7
0.9
[1.0
]1.
712
:00-
12:4
54.
673
1.2
0.8
[1.2
]2.
012
:45-
13:3
03.
910
29.0
0.8
[1.1
]2.
413
:30-
14:1
51.
925
7.8
0.8
[1.4
]2.
514
:15-
15:0
05.
711
56.0
0.9
[1.0
]2.
115
:00-
15:4
57.
518
86.5
1.1
[1.1
]1.
915
:45-
16:3
09.
015
86.8
1.0
[1.3
]2.
016
:30-
17:1
58.
113
35.7
1.5
[1.4
]2.
417
:15-
18:0
04.
412
61.0
1.2
[1.3
]2.
6
Not
es:
For d
efin
ition
s of
quo
te fr
eque
ncy,
vol
atilit
y an
d sp
read
s se
e no
tes
to T
able
s 4,
5 a
nd 6
.D
ates
of M
RO
s ar
e: 8
/11/
99, 1
6/11
/99,
23/
11/9
9, 3
0/11
/99,
07/
12/0
0, 1
4/12
/99,
21/
12/9
9, 3
0/12
/99,
11/
01/0
0, 1
8/01
/00,
25/
01/0
0, 0
1/02
/00,
08/
02/0
0, 1
5/02
/00,
22/0
2/00
, 29/
02/0
0, 0
6/03
/00,
14/
03/0
0, 2
2/03
/00.
The
ope
ratio
ns o
f 23/
11/9
9, 2
1/12
/99,
22/
02/0
0, 2
2/03
/00
(end
of r
eser
ve m
aint
enan
ce p
erio
d) a
nd
30/1
2/99
(Y2K
cha
ngeo
ver d
ay) a
re e
xclu
ded
from
the
anal
ysis
. The
con
trol g
roup
incl
udes
all
"nor
mal
" day
s w
ithou
t an
MR
O o
r an
ECB
Gov
erni
ng C
ounc
il m
eetin
g.So
urce
: e-
MID
, aut
hors
' cal
cula
tions

61ECB • Work ing Pape r No 80 • Oc tobe r 2001
Tabl
e 12
: Ave
rage
quo
ting
freq
uenc
y, M
ID v
olum
es, v
olat
ility
and
spr
eads
in th
e eu
ro o
vern
ight
mar
ket o
n th
e tw
o la
st d
ays
of th
e m
inim
um
rese
rve
mai
nten
ance
per
iod,
Nov
embe
r 199
9 to
Mar
ch 2
000
FRA
NC
ESP
AIN
NET
HER
LAN
DS
UK
INTR
ADAY
PER
IOD
GR
ELKL
IEM
MM
GEH
AC
IMV
PWYM
EUR
OPY
ECPO
OLE
D "V
OIC
E" B
RO
KER
SM
ID B
EST
MID
VO
LUM
ES (i
n m
il. E
uro)
QU
OTI
NG
FR
EQU
ENC
Y (1
0 da
ys)
DA
Y A
VER
AG
E2.
9 [3
.6]
15.8
[18.
0]14
.6 [1
3.3]
8.6
[5.2
]10
.7 [2
0.1]
26.4
[24.
6]79
.0 [7
1.1]
167.
9 [5
3.0]
9700
.78:
00-1
1:00
1.2
6.0
6.3
0.7
5.7
11.3
31.2
42.3
3435
.611
:00-
14:0
01.
24.
13.
34.
22.
25.
720
.731
.525
70.6
14:0
0-17
:00
0.5
5.7
5.0
3.7
2.8
9.4
27.1
94.1
3694
.5
VOLA
TILI
TY (1
0 da
ys)
DA
Y A
VER
AG
E7.
9 [5
.2]
7.3
[3.9
]8.
4 [4
.0]
6.0
[3.8
]10
.4 [3
.9]
9.2
[5.4
]8.
2 [4
.4]
8.4
[7.2
]8.
00-1
1.00
6.6
[7.0
]4.
6 [3
.1]
8.2
[4.4
]6.
2 [0
.8]
7.5
[3.9
]6.
1 [3
.3]
6.5
[3.8
]11
.4 [5
.3]
11:0
0-14
:00
3.1
[4.6
]7.
4 [2
.9]
7.1
[2.2
]6.
3 [2
.4]
8.1
[4.1
]8.
9 [3
.0]
6.8
[3.2
] 6
.1 [3
.8]
14:0
0-17
:00
10.8
[3.5
]9.
7 [5
.4]
9.7
[5.7
]4.
6 [5
.8]
12.8
[3.6
]12
.8 [1
0.1]
10.1
[5.7
] 7
.7 [1
2.4]
SPR
EAD
S (1
0 da
ys)
DA
Y A
VER
AG
E5.
95.
36.
911
.37.
88.
77.
77.
58:
00-1
1:00
6.8
4.1
6.1
9.7
7.7
5.9
6.7
5.8
11:0
0-14
:00
6.9
3.7
6.3
9.9
8.6
5.6
6.8
4.0
14:0
0-17
:00
1.6
7.7
8.3
13.2
8.5
14.6
9.0
8.7
Not
es:
For d
efin
ition
s of
quo
te fr
eque
ncy,
vol
atilit
y an
d sp
read
s se
e no
tes
to T
able
s 4,
5 a
nd 6
.En
d of
rese
rve
mai
nten
ance
per
iod
days
in th
e sa
mpl
e ar
e: 2
2/11
/99,
23/
11/9
9, 2
2/12
/99,
23/
12/9
9, 2
0/01
/00,
21/
01/0
0, 2
2/02
/00,
23/
02/0
0, 2
2/03
/00,
23/
03/0
0.So
urce
: R
eute
rs, e
-MID
, aut
hors
' cal
cula
tions
GER
MA
NY
ITA
LY

62 ECB • Work ing Pape r No 80 • Oc tobe r 2001
Tabl
e 13
: Ave
rage
quo
ting
freq
uenc
y, M
ID v
olum
es, v
olat
ility
and
spr
eads
in th
e eu
ro o
vern
ight
mar
ket
on "
norm
al"
MR
O s
ettle
men
t day
s as
com
pare
d to
"no
rmal
" no
n-M
RO
set
tlem
ent d
ays,
N
ovem
ber 1
999
to M
arch
200
0 (a
ll br
oker
s)
DE,
ES,
FR
, NL,
UK
INTR
ADAY
PER
IOD
POO
LED
"VO
ICE"
BR
OKE
RS
MID
BES
TM
ID V
OLU
MES
(in
mil.
Eur
o)
QU
OTI
NG
FR
EQU
ENC
YM
RO
SET
TLEM
ENT
DAY
S (1
5)D
AY
AVE
RA
GE
33.2
62.8
2728
7.4
8:00
-11:
0016
.923
.993
13.7
11:0
0-14
:00
5.1
11.5
5961
.414
:00-
17:0
011
.327
.412
012.
3
OTH
ER D
AYS,
EXC
L. G
C A
ND
MR
O D
AYS
(49)
DA
Y A
VER
AG
E30
.775
.693
19.1
8:00
-11:
0014
.428
.631
14.2
11:0
0-14
:00
5.9
17.5
2488
.314
:00-
17:0
010
.429
.637
16.6
VOLA
TILI
TYM
RO
SET
TLEM
ENT
DAY
S (1
5)D
AY
AVE
RA
GE
2.7
2.3
8:00
-11:
003.
01.
911
:00-
14:0
03.
12.
614
:00-
17:0
02.
22.
3
OTH
ER D
AYS,
EXC
L. G
C A
ND
MR
O D
AYS
(49)
DA
Y A
VAR
AG
E3.
32.
78:
00-1
1:00
4.2
3.0
11:0
0-14
:00
3.4
3.5
14:0
0-17
:00
2.1
1.6
SPR
EAD
SM
RO
SET
TLEM
ENT
DAY
S (1
5)D
AY
AVE
RA
GE
4.8
2.6
8:00
-11:
004.
63.
211
:00-
14:0
05.
22.
114
:00-
17:0
04.
82.
2
OTH
ER D
AYS,
EXC
L. G
C A
ND
MR
O D
AYS
(49)
DA
Y A
VER
AG
E 5.
12.
68:
00-1
1:00
4.7
3.3
11:0
0-14
:00
6.1
2.1
14:0
0-17
:00
5.0
2.2
Notes:
For d
efin
ition
s of
quo
te fr
eque
ncy,
vol
atilit
y an
d sp
read
s se
e no
tes
to T
able
s 4,
5 a
nd 6
."N
orm
al" t
radi
ng d
ays
on w
hich
MR
O s
ettle
men
ts to
ok p
lace
are
: 10/
11/9
9, 1
7/11
/99,
24/
11/9
9, 0
1/12
/99,
08/
12/0
0, 1
5/12
/99,
12/0
1/00
, 19/
01/0
0, 2
6/01
/00,
02/
02/0
0, 0
9/02
/00,
16/
02/0
0, 0
1/03
/00,
08/
03/0
0, 1
5/03
/00.
4 M
RO
set
tlem
ent d
ays
are
excl
uded
, bec
ause
they
hap
pene
d on
a d
ay a
t the
end
of t
he m
inim
um re
serv
e m
aint
enan
ce p
erio
d or
dur
ing
the
Y2K
chan
geov
er w
eek.
The
cont
rol g
roup
incl
udes
all
"nor
mal
" day
s w
ithou
t MR
O s
ettle
men
t, w
ithou
t an
MR
O a
nd w
ithou
t an
ECB
Gov
erni
ng C
ounc
il m
eetin
g.Source:
Reu
ters
, e-M
ID, a
utho
rs' c
alcu
latio
ns
ITA
LY

63ECB • Work ing Pape r No 80 • Oc tobe r 2001
Tabl
e 14
: Hig
h-fr
eque
ncy
anal
ysis
of a
vera
ge q
uotin
g fr
eque
ncy,
vol
umes
, vol
atili
ty a
nd s
prea
ds in
the
Italia
n M
ID o
n"n
orm
al"
MR
O s
ettle
men
t day
s as
com
pare
d to
"no
rmal
" no
n-M
RO
set
tlem
ent w
eek
days
, Nov
embe
r 199
9 to
Mar
ch 2
000
INTR
ADAY
PER
IOD
QU
OTI
NG
FR
EQU
ENC
YVO
LUM
ESVO
LATI
LITY
SPR
EAD
S
MR
O S
ETTL
EMEN
T D
AYS
15)
DA
Y A
VER
AG
E67
.630
885.
51.
2 [1
.1]
2.6
8:15
-9:0
06.
419
9.3
1.9
[1.2
]6.
09:
00-9
:45
10.4
3414
.61.
9 [1
.0]
2.3
9:45
-10:
303.
8731
51.3
1.1
[1.1
]1.
910
:30-
11:1
54.
330
45.2
0.8
[1.1
]2.
011
:15-
12:0
03.
117
57.3
0.9
[0.9
]1.
812
:00-
12:4
53.
510
00.1
0.7
[1.0
]1.
512
:45-
13:3
02.
525
04.6
1.3
[0.9
]3.
013
:30-
14:1
51.
633
5.3
1.2
[1.5
]2.
514
:15-
15:0
05.
418
83.5
1.0
[1.3
]2.
615
:00-
15:4
57.
940
43.6
1.4
[1.2
]2.
1615
:45-
16:3
09.
33
60.6
0.9
[1.0
]1.
916
:30-
17:1
56.
128
30.8
1.2
[1.3
]2.
317
:15-
18:0
03.
133
59.3
1.2
[1.2
]2.
8
OTH
ER D
AYS
, EXC
L. G
C a
nd M
RO
DA
YS (4
9)D
AY
AVE
RA
GE
83.0
1059
2.7
1.3
[2.2
]2.
68:
15-9
:00
7.8
129.
02.
8 [1
.3]
6.7
9:00
-9:4
58.
512
32.9
1.6
[1.0
]1.
89:
45-1
0:30
7.8
1114
.81.
2 [1
.0]
1.7
10:3
0-11
:15
6.4
959.
11.
0 [1
.2]
2.5
11:1
5-12
:00
5.14
890.
81.
0 [0
.9]
1.8
12:0
0-12
:45
4.9
1152
.30.
9 [1
.0]
2.1
12:4
5-13
:30
4.1
510.
20.
7 [0
.9]
2.3
13:3
0-14
:15
2.0
220.
00.
6 [1
.0]
2.4
14:1
5-15
:00
5.8
960.
41.
1 [0
.9]
2.0
15:0
0-15
:45
8.0
1113
.21.
1 [1
.0]
2.1
15:4
5-16
:30
9.31
969.
91.
1 [1
.3]
2.0
16:3
0-17
:15
8.7
803.
71.
8 [1
.4]
2.8
17:1
5-18
:00
4.8
536.
31.
2 [1
.2]
3.0
Not
es:
See
Tabl
e 13
.So
urce
: e-
MID
, aut
hors
' cal
cula
tions
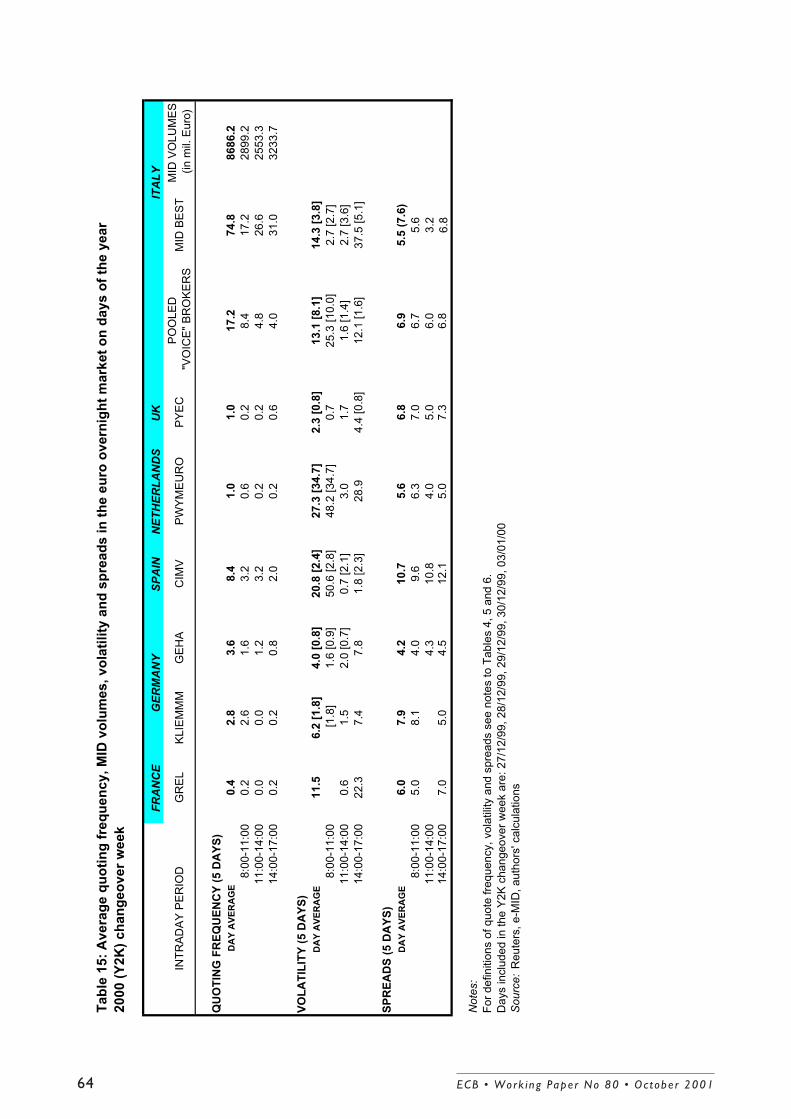
64 ECB • Work ing Pape r No 80 • Oc tobe r 2001
Tabl
e 15
: Ave
rage
quo
ting
freq
uenc
y, M
ID v
olum
es, v
olat
ility
and
spr
eads
in th
e eu
ro o
vern
ight
mar
ket o
n da
ys o
f the
yea
r20
00 (Y
2K) c
hang
eove
r wee
k
FRA
NC
ESP
AIN
NET
HER
LAN
DS
UK
INTR
ADAY
PER
IOD
GR
ELKL
IEM
MM
GEH
AC
IMV
PWYM
EUR
OPY
ECPO
OLE
D "V
OIC
E" B
RO
KER
SM
ID B
EST
MID
VO
LUM
ES (i
n m
il. E
uro)
QU
OTI
NG
FR
EQU
ENC
Y (5
DA
YS)
DA
Y A
VER
AG
E0.
42.
83.
68.
41.
01.
017
.274
.886
86.2
8:00
-11:
000.
22.
61.
63.
20.
60.
28.
417
.228
99.2
11:0
0-14
:00
0.0
0.0
1.2
3.2
0.2
0.2
4.8
26.6
2553
.314
:00-
17:0
00.
20.
20.
82.
00.
20.
64.
031
.032
33.7
VOLA
TILI
TY (5
DA
YS)
DA
Y A
VER
AG
E 11
.56.
2 [1
.8]
4.0
[0.8
]20
.8 [2
.4]
27.3
[34.
7]2.
3 [0
.8]
13.1
[8.1
]14
.3 [3
.8]
8:00
-11:
00 [1
.8]
1.6
[0.9
]50
.6 [2
.8]
48.2
[34.
7]0.
725
.3 [1
0.0]
2.7
[2.7
]11
:00-
14:0
00.
61.
52.
0 [0
.7]
0.7
[2.1
]3.
01.
71.
6 [1
.4]
2.7
[3.6
]14
:00-
17:0
022
.37.
47.
81.
8 [2
.3]
28.9
4.4
[0.8
]12
.1 [1
.6]
37.5
[5.1
]
SPR
EAD
S (5
DA
YS)
DA
Y A
VER
AG
E 6.
07.
94.
210
.75.
66.
86.
95.
5 (7
.6)
8:00
-11:
005.
08.
14.
09.
66.
37.
06.
75.
611
:00-
14:0
04.
310
.84.
05.
06.
03.
214
:00-
17:0
07.
05.
04.
512
.15.
07.
36.
86.
8
Not
es:
For d
efin
ition
s of
quo
te fr
eque
ncy,
vol
atilit
y an
d sp
read
s se
e no
tes
to T
able
s 4,
5 a
nd 6
.D
ays
incl
uded
in th
e Y2
K ch
ange
over
wee
k ar
e: 2
7/12
/99,
28/
12/9
9, 2
9/12
/99,
30/
12/9
9, 0
3/01
/00
Sour
ce:
Reu
ters
, e-M
ID, a
utho
rs' c
alcu
latio
ns
GER
MA
NY
ITA
LY

European Central Bank Working Paper Series 1 “A global hazard index for the world foreign exchange markets” by V. Brousseau and
F. Scacciavillani, May 1999. 2 “What does the single monetary policy do? A SVAR benchmark for the European Central
Bank” by C. Monticelli and O. Tristani, May 1999. 3 “Fiscal policy effectiveness and neutrality results in a non-Ricardian world” by C. Detken,
May 1999. 4 “From the ERM to the euro: new evidence on economic and policy convergence among
EU countries” by I. Angeloni and L. Dedola, May 1999. 5 “Core inflation: a review of some conceptual issues” by M. Wynne, May 1999. 6 “The demand for M3 in the euro area” by G. Coenen and J.-L. Vega, September 1999. 7 “A cross-country comparison of market structures in European banking” by O. de Bandt
and E. P. Davis, September 1999. 8 “Inflation zone targeting” by A. Orphanides and V. Wieland, October 1999. 9 “Asymptotic confidence bands for the estimated autocovariance and autocorrelation
functions of vector autoregressive models” by G. Coenen, January 2000. 10 “On the effectiveness of sterilized foreign exchange intervention” by R. Fatum,
February 2000. 11 “Is the yield curve a useful information variable for the Eurosystem?” by J. M. Berk and
P. van Bergeijk, February 2000. 12 “Indicator variables for optimal policy” by L. E. O. Svensson and M. Woodford,
February 2000. 13 “Monetary policy with uncertain parameters” by U. Söderström, February 2000. 14 “Assessing nominal income rules for monetary policy with model and data uncertainty”
by G. D. Rudebusch, February 2000. 15 “The quest for prosperity without inflation” by A. Orphanides, March 2000. 16 “Estimating the implied distribution of the future short term interest rate using the Longstaff-
Schwartz model” by P. Hördahl, March 2000. 17 “Alternative measures of the NAIRU in the euro area: estimates and assessment”
by S. Fabiani and R. Mestre, March 2000. 18 “House prices and the macroeconomy in Europe: Results from a structural VAR analysis”
by M. Iacoviello, April 2000.
65ECB • Work ing Pape r No 80 • Oc tobe r 2001

19 “The euro and international capital markets” by C. Detken and P. Hartmann, April 2000.
20 “Convergence of fiscal policies in the euro area” by O. De Bandt and F. P. Mongelli,
May 2000. 21 “Firm size and monetary policy transmission: evidence from German business survey data”
by M. Ehrmann, May 2000. 22 “Regulating access to international large value payment systems” by C. Holthausen
and T. Rønde, June 2000. 23 “Escaping Nash inflation” by In-Koo Cho and T. J. Sargent, June 2000. 24 “What horizon for price stability” by F. Smets, July 2000. 25 “Caution and conservatism in the making of monetary policy” by P. Schellekens, July 2000. 26 “Which kind of transparency? On the need for clarity in monetary policy-making”
by B. Winkler, August 2000. 27 “This is what the US leading indicators lead” by M. Camacho and G. Perez-Quiros,
August 2000. 28 “Learning, uncertainty and central bank activism in an economy with strategic interactions”
by M. Ellison and N. Valla, August 2000. 29 “The sources of unemployment fluctuations: an empirical application to the Italian case” by
S. Fabiani, A. Locarno, G. Oneto and P. Sestito, September 2000. 30 “A small estimated euro area model with rational expectations and nominal rigidities”
by G. Coenen and V. Wieland, September 2000. 31 “The disappearing tax base: Is foreign direct investment eroding corporate income taxes?”
by R. Gropp and K. Kostial, September 2000. 32 “Can indeterminacy explain the short-run non-neutrality of money?” by F. De Fiore,
September 2000. 33 “The information content of M3 for future inflation” by C. Trecroci and J. L. Vega,
October 2000. 34 “Capital market development, corporate governance and the credibility of exchange rate
pegs” by O. Castrén and T. Takalo, October 2000. 35 “Systemic risk: A survey” by O. De Bandt and P. Hartmann, November 2000. 36 “Measuring core inflation in the euro area” by C. Morana, November 2000. 37 “Business fixed investment: Evidence of a financial accelerator in Europe” by P. Vermeulen,
November 2000.
66 ECB • Work ing Pape r No 80 • Oc tobe r 2001

38 “The optimal inflation tax when taxes are costly to collect” by F. De Fiore, November 2000. 39 “A money demand system for euro area M3” by C. Brand and N. Cassola, November 2000. 40 “Financial structure and the interest rate channel of ECB monetary policy” by B. Mojon,
November 2000. 41 “Why adopt transparency? The publication of central bank forecasts” by P. M. Geraats,
January 2001. 42 “An area-wide model (AWM) for the euro area” by G. Fagan, J. Henry and R. Mestre,
January 2001. 43 “Sources of economic renewal: from the traditional firm to the knowledge firm”
by D. R. Palenzuela, February 2001. 44 “The supply and demand for eurosystem deposits – The first 18 months” by U. Bindseil and
F. Seitz, February 2001. 45 “Testing the Rank of the Hankel matrix: a statistical approach” by G. Camba-Mendez and
G. Kapetanios, February 2001. 46 “A two-factor model of the German term structure of interest rates” by N. Cassola and
J. B. Luís, February 2001. 47 “Deposit insurance and moral hazard: does the counterfactual matter?” by R. Gropp and
J. Vesala, February 2001. 48 “Financial market integration in Europe: on the effects of EMU on stock markets” by
M. Fratzscher, March 2001. 49 “Business cycle and monetary policy analysis in a structural sticky-price model of the euro
area” by M. Casares, March 2001. 50 “Employment and productivity growth in service and manufacturing sectors in France,
Germany and the US” by T. von Wachter, March 2001. 51 “The functional form of the demand for euro area M1” by L. Stracca, March 2001. 52 “Are the effects of monetary policy in the euro area greater in recessions than in booms?” by
G. Peersman and F. Smets, March 2001. 53 “An evaluation of some measures of core inflation for the euro area” by J.-L. Vega and
M. A. Wynne, April 2001. 54 “Assessment criteria for output gap estimates” by G. Camba-Méndez and D. R. Palenzuela,
April 2001. 55 “Modelling the demand for loans to the private sector in the euro area” by A. Calza,
G. Gartner and J. Sousa, April 2001.
67ECB • Work ing Pape r No 80 • Oc tobe r 2001
56 “Stabilization policy in a two country model and the role of financial frictions” by E. Faia, April 2001.
57 “Model-based indicators of labour market rigidity” by S. Fabiani and D. Rodriguez-Palenzuela,
April 2001. 58 “Business cycle asymmetries in stock returns: evidence from higher order moments and
conditional densities” by G. Perez-Quiros and A. Timmermann, April 2001. 59 “Uncertain potential output: implications for monetary policy” by M. Ehrmann and F. Smets,
April 2001. 60 “A multi-country trend indicator for euro area inflation: computation and properties” by
E. Angelini, J. Henry and R. Mestre, April 2001. 61 “Diffusion index-based inflation forecasts for the euro area” by E. Angelini, J. Henry and
R. Mestre, April 2001. 62 “Spectral based methods to identify common trends and common cycles” by G. C. Mendez
and G. Kapetanios, April 2001. 63 “Does money lead inflation in the euro area?” by S. N. Altimari, May 2001. 64 “Exchange rate volatility and euro area imports” by R. Anderton and F. Skudelny, May 2001. 65 “A system approach for measuring the euro area NAIRU” by S. Fabiani and R. Mestre,
May 2001. 66 “Can short-term foreign exchange volatility be predicted by the Global Hazard Index?” by
V. Brousseau and F. Scacciavillani, June 2001. 67 “The daily market for funds in Europe: Has something changed with the EMU?” by
G. P. Quiros and H. R. Mendizabal, June 2001. 68 “The performance of forecast-based monetary policy rules under model uncertainty” by
A. Levin, V. Wieland and J. C.Williams, July 2001. 69 “The ECB monetary policy strategy and the money market” by V. Gaspar, G. Perez-Quiros
and J. Sicilia, July 2001. 70 “Central Bank forecasts of liquidity factors: Quality, publication and the control of the
overnight rate” by U. Bindseil, July 2001. 71 “Asset market linkages in crisis periods” by P. Hartmann, S. Straetmans and C. G. de Vries,
July 2001. 72 “Bank concentration and retail interest rates” by S. Corvoisier and R. Gropp, July 2001. 73 “Interbank lending and monetary policy transmission – evidence for Germany” by
M. Ehrmann and A. Worms, July 2001.
68 ECB • Work ing Pape r No 80 • Oc tobe r 2001

74 “Interbank market integration under asymmetric information” by X. Freixas and C. Holthausen, August 2001.
75 “Value at risk models in finance” by S. Manganelli and R. F. Engle, August 2001.
76 “Rating agency actions and the pricing of debt and equity of European banks: What can we infer about private sector monitoring of bank soundness?” by R. Gropp and A. J. Richards, August 2001. 77 “Cyclically adjusted budget balances: An alternative approach” by C. Bouthevillain, P. Cour-
Thimann, G. van den Dool, P. Hernández de Cos, G. Langenus, M. Mohr, S. Momigliano and M. Tujula, September 2001.
78 “Investment and monetary policy in the euro area” by B. Mojon, F. Smets and P. Vermeulen,
September 2001. 79 “Does liquidity matter? Properties of a synthetic divisia monetary aggregate in the euro
area”by L. Stracca, October 2001. 80 “The microstructure of the euro money market”by P. Hartmann, M. Manna and
A. Manzanares, October 2001.
69ECB • Work ing Pape r No 80 • Oc tobe r 2001