Embed Size (px)
Citation preview
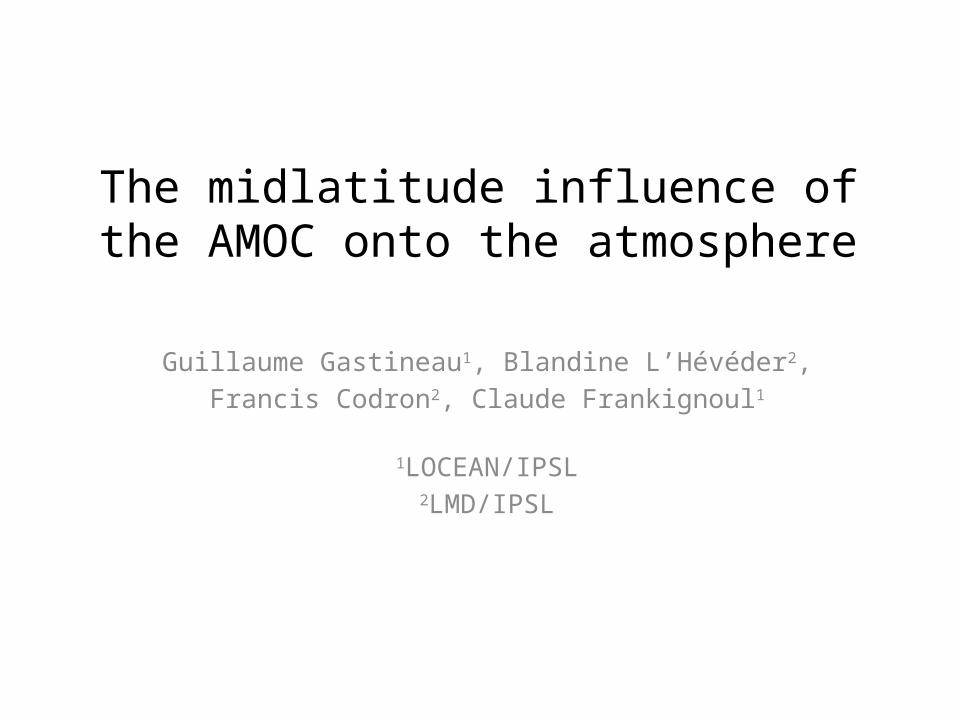
The midlatitude influence of the AMOC onto the atmosphere
Guillaume Gastineau1, Blandine L’Hévéder2,Francis Codron2, Claude Frankignoul1
1LOCEAN/IPSL2LMD/IPSL
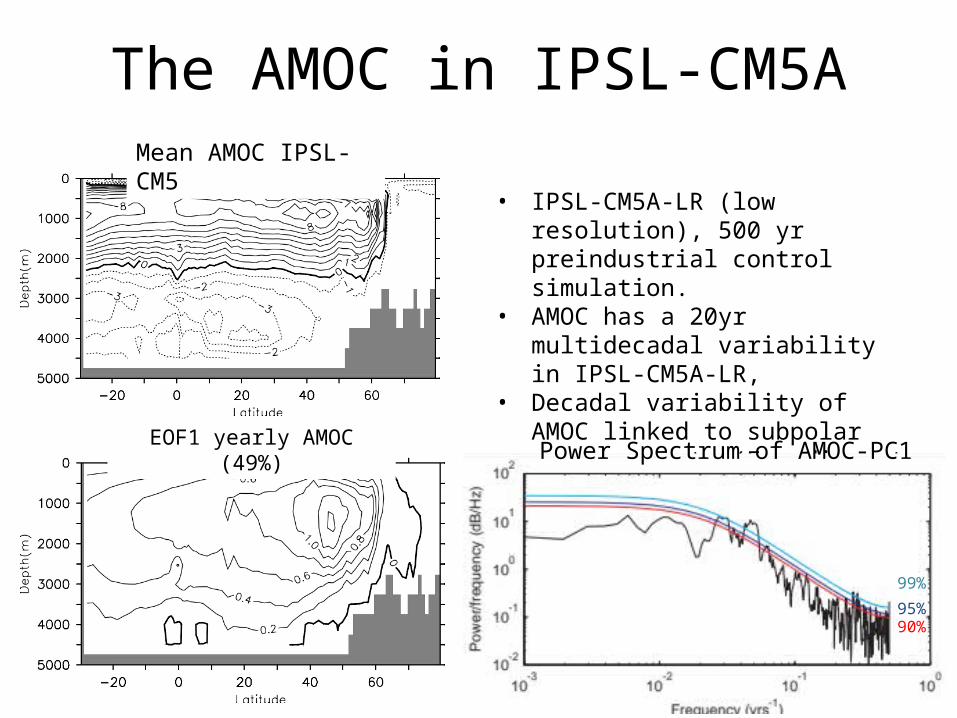
The AMOC in IPSL-CM5A
• IPSL-CM5A-LR (low resolution), 500 yr preindustrial control simulation.
• AMOC has a 20yr multidecadal variability in IPSL-CM5A-LR,
• Decadal variability of AMOC linked to subpolar gyre currents (Escudier et al., 2013).
Mean AMOC IPSL-CM5
EOF1 yearly AMOC (49%) Power Spectrum of AMOC-PC1
99%
95%90%
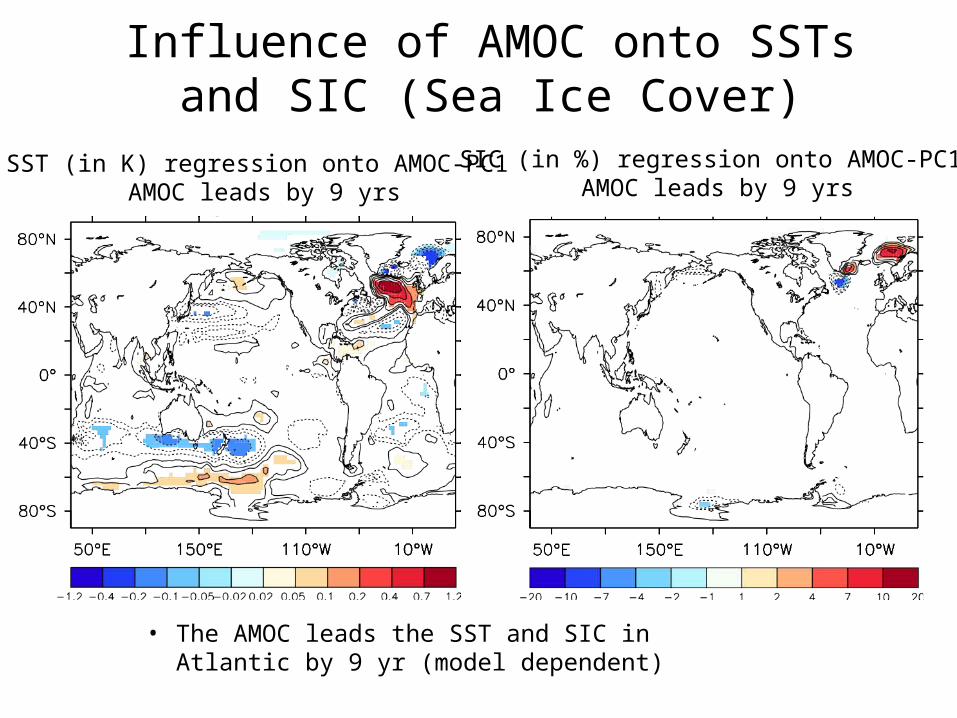
Influence of AMOC onto SSTsand SIC (Sea Ice Cover)
• The AMOC leads the SST and SIC in Atlantic by 9 yr (model dependent)
SST (in K) regression onto AMOC-PC1 AMOC leads by 9 yrs
SIC (in %) regression onto AMOC-PC1 AMOC leads by 9 yrs
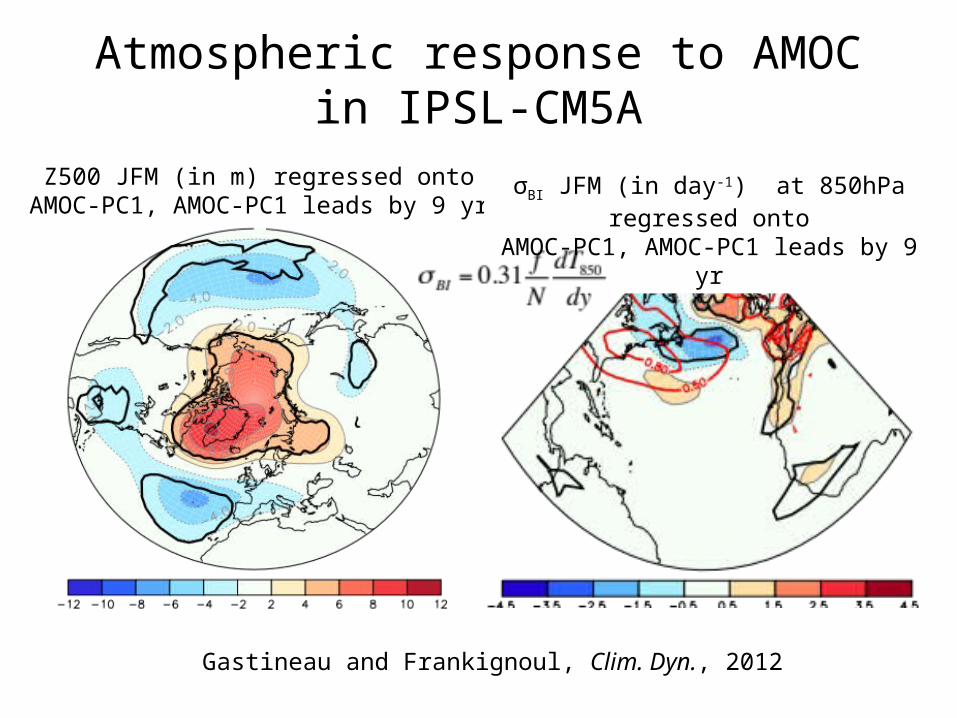
Atmospheric response to AMOC in IPSL-CM5A
Z500 JFM (in m) regressed ontoAMOC-PC1, AMOC-PC1 leads by 9 yr
Gastineau and Frankignoul, Clim. Dyn., 2012
σBI JFM (in day-1) at 850hPa regressed ontoAMOC-PC1, AMOC-PC1 leads by 9 yr
Question
• What is the cause of the atmospheric response? • Do sea-ice anomalies play a role?• Does some remote influence from tropics also play a role?
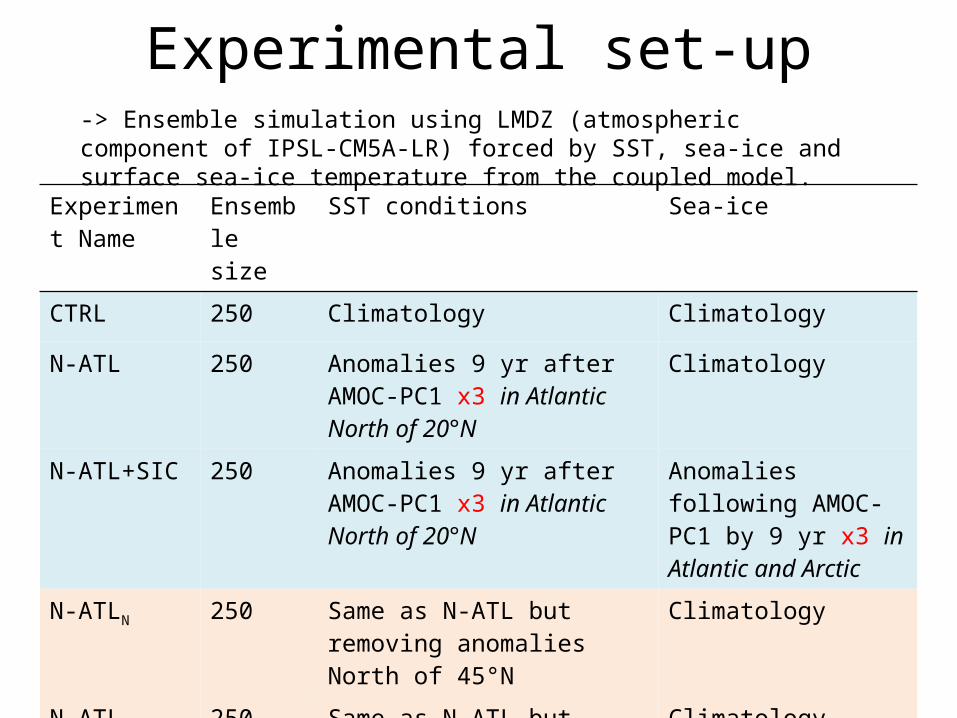
Experimental set-up
Experiment Name
Ensemble size
SST conditions Sea-ice
CTRL 250 Climatology Climatology
N-ATL 250 Anomalies 9 yr after AMOC-PC1 x3 in Atlantic North of 20°N
Climatology
N-ATL+SIC 250 Anomalies 9 yr after AMOC-PC1 x3 in Atlantic North of 20°N
Anomalies following AMOC-PC1 by 9 yr x3 in Atlantic and Arctic
N-ATLN 250 Same as N-ATL but removing anomalies North of 45°N
Climatology
N-ATLS 250 Same as N-ATL but removing anomalies North of 45°N
Climatology
ALL 250 Anomalies 9 yr after AMOC-PC1x3 everywhere but Atlantic North
Climatology
-> Ensemble simulation using LMDZ (atmospheric component of IPSL-CM5A-LR) forced by SST, sea-ice and surface sea-ice temperature from the coupled model.
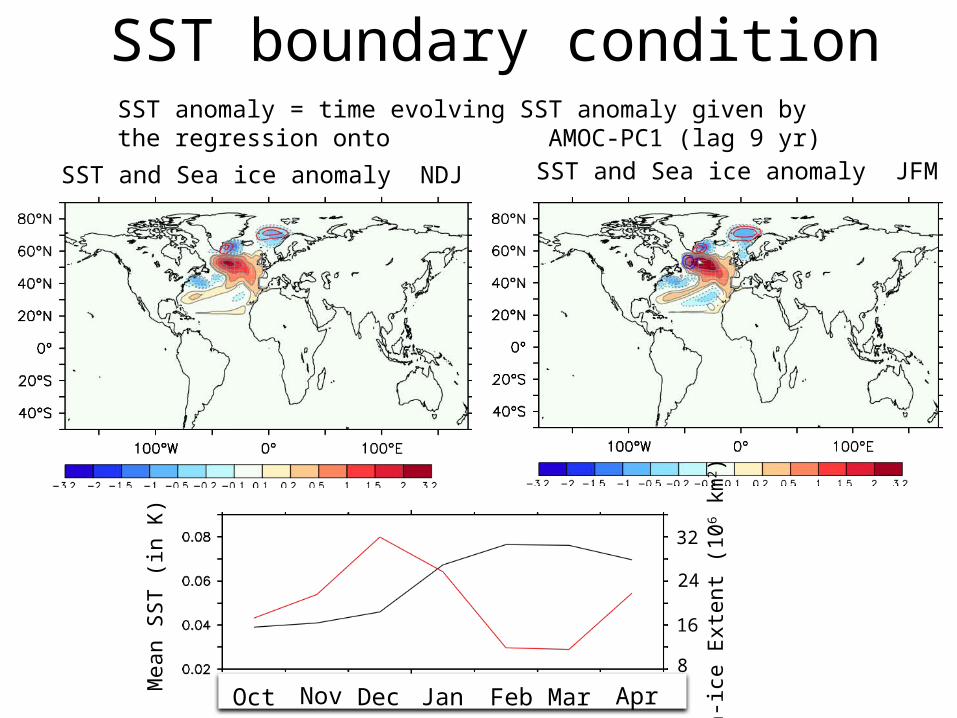
SST boundary condition
Oct Nov Dec Jan Feb Mar Apr
SST and Sea ice anomaly JFM M
ean
SST
(in K
)
Sea-
ice
Exte
nt (1
06 km
2 )
8
16
24
32
SST and Sea ice anomaly NDJ
SST anomaly = time evolving SST anomaly given by the regression onto AMOC-PC1 (lag 9 yr)
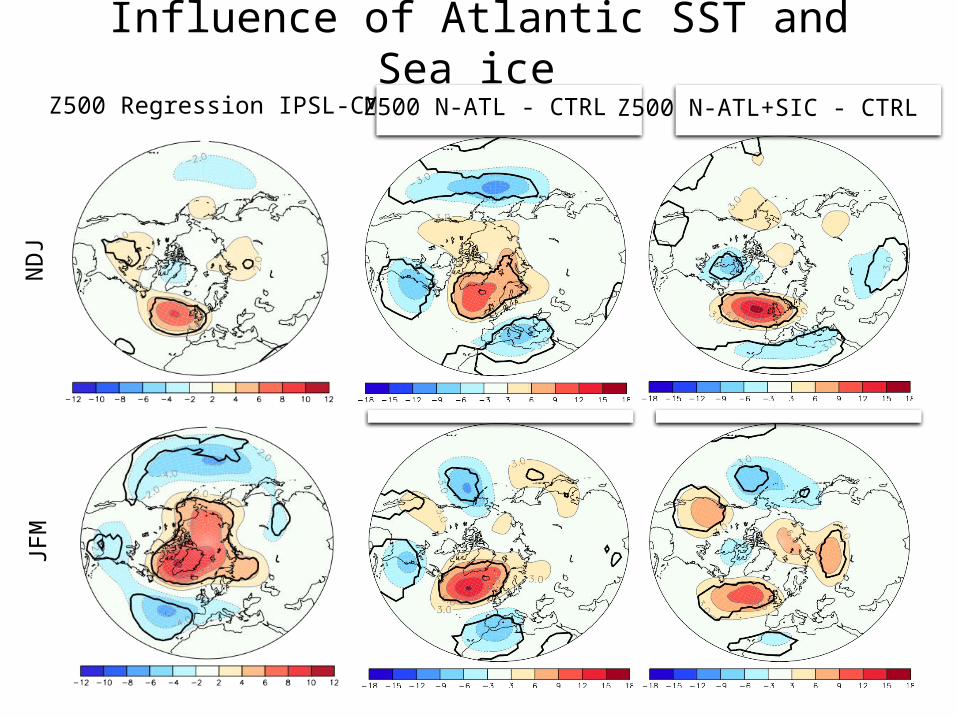
Influence of Atlantic SST and Sea ice JF
MN
DJ
Z500 Regression IPSL-CM5A Z500 N-ATL - CTRL Z500 N-ATL+SIC - CTRL
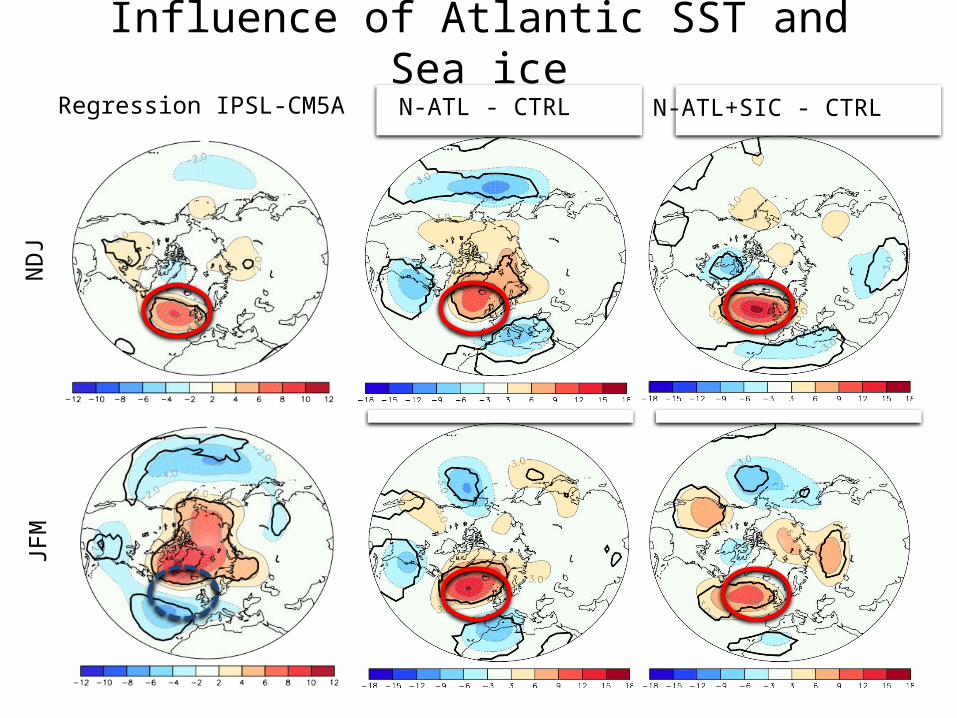
Influence of Atlantic SST and Sea iceJF
MN
DJ
Regression IPSL-CM5A N-ATL - CTRL N-ATL+SIC - CTRL
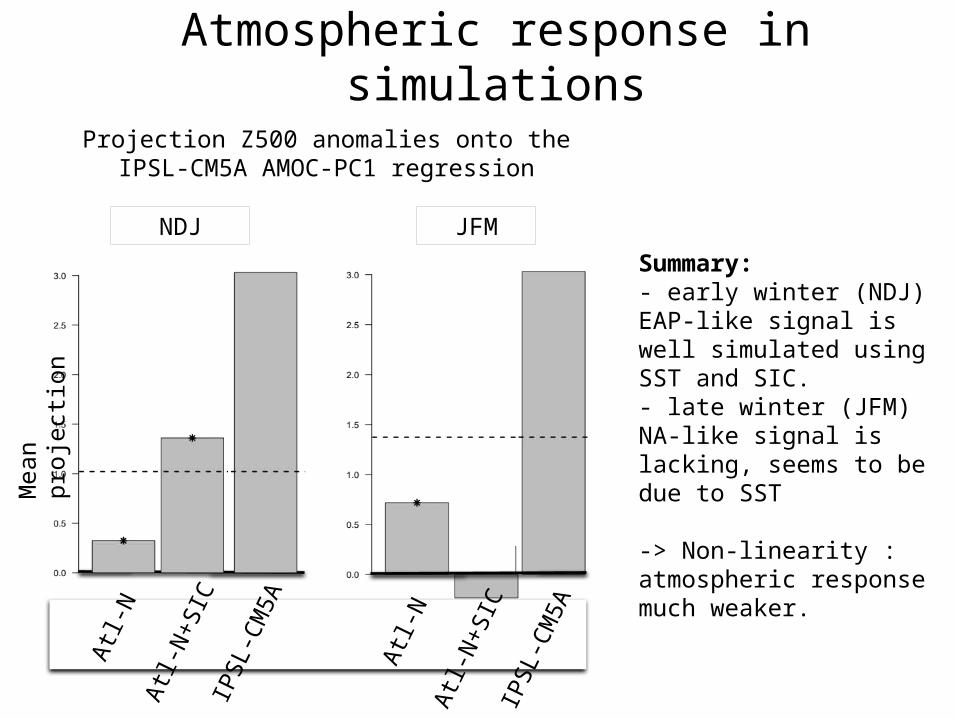
Atmospheric response in simulations
JFMNDJ
Summary:- early winter (NDJ) EAP-like signal is well simulated using SST and SIC. - late winter (JFM) NA-like signal is lacking, seems to be due to SST
-> Non-linearity : atmospheric response much weaker.
Mea
n pr
ojec
tion
Atl-N
Atl-N
+SIC
IPSL
-CM
5A
Atl-N
Atl-N
+SIC
IPSL
-CM
5A
Projection Z500 anomalies onto the IPSL-CM5A AMOC-PC1 regression
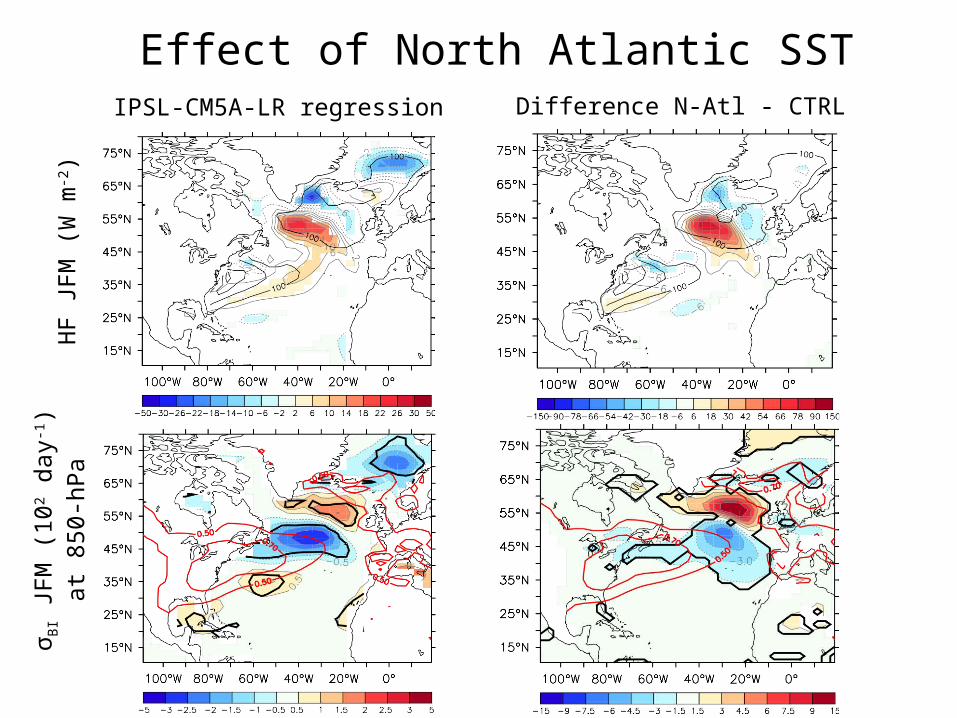
Effect of North Atlantic SSTH
F JF
M (W
m-2
)σ BI
JFM
(102 d
ay-1
)at
850
-hPa
IPSL-CM5A-LR regression Difference N-Atl - CTRL
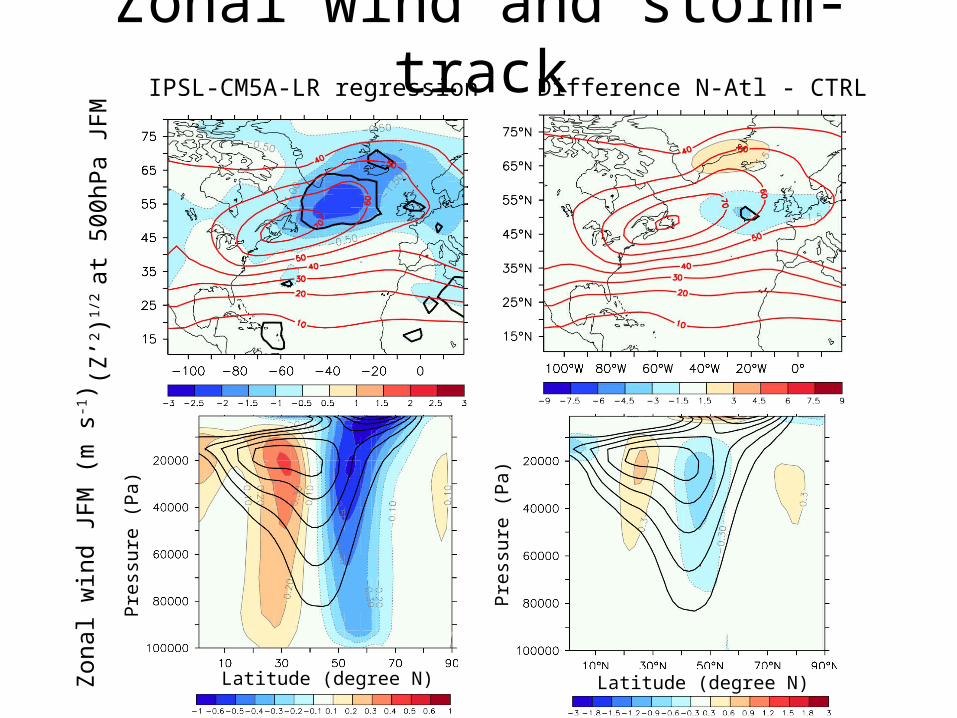
Zonal wind and storm-trackZo
nal w
ind
JFM
(m s
-1)
(Z’2 )1/
2 at
500
hPa
JFM
IPSL-CM5A-LR regression Difference N-Atl - CTRL
Latitude (degree N) Latitude (degree N)
Pres
sure
(Pa)
Pres
sure
(Pa)
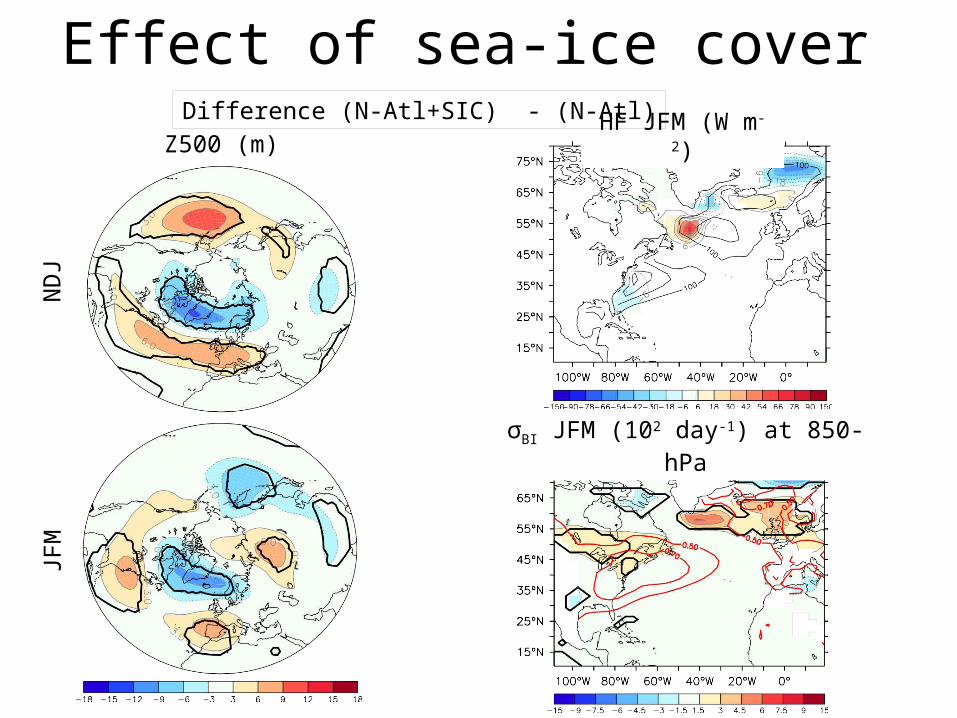
Effect of sea-ice cover Z500 (m)
NDJ
JFM
σBI JFM (102 day-1) at 850-hPa
HF JFM (W m-2)Difference (N-Atl+SIC) - (N-Atl)
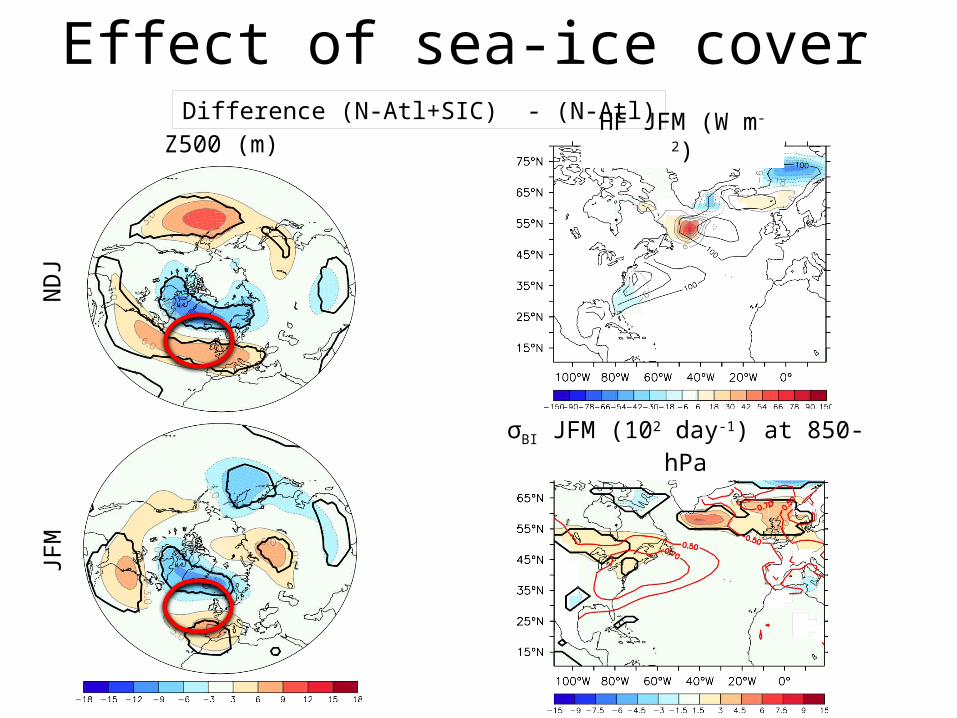
Effect of sea-ice cover Z500 (m)
NDJ
JFM
σBI JFM (102 day-1) at 850-hPa
HF JFM (W m-2)Difference (N-Atl+SIC) - (N-Atl)
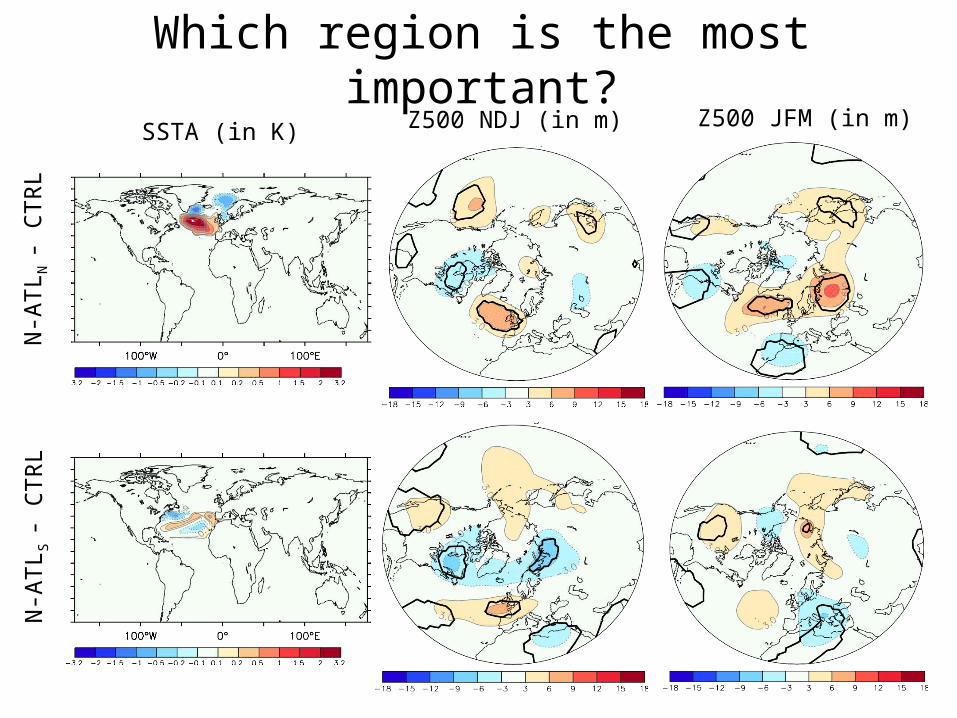
Which region is the most important?SSTA (in K) Z500 NDJ (in m) Z500 JFM (in m)
N-A
TLN
- CT
RLN
-ATL
S - C
TRL
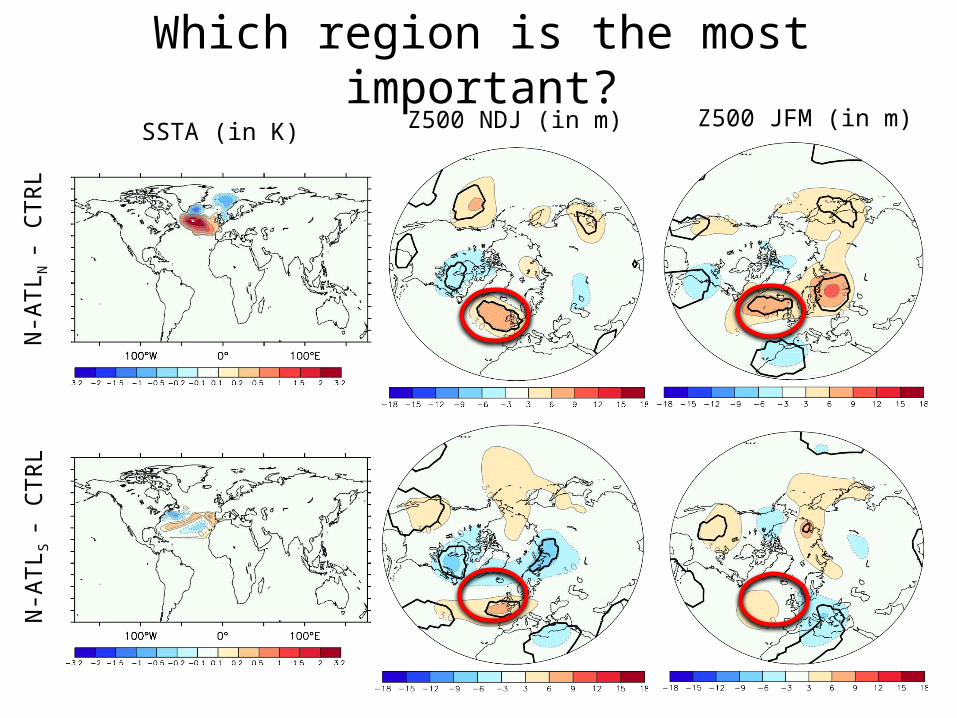
Which region is the most important?SSTA (in K) Z500 NDJ (in m) Z500 JFM (in m)
N-A
TLN
- CT
RLN
-ATL
S - C
TRL
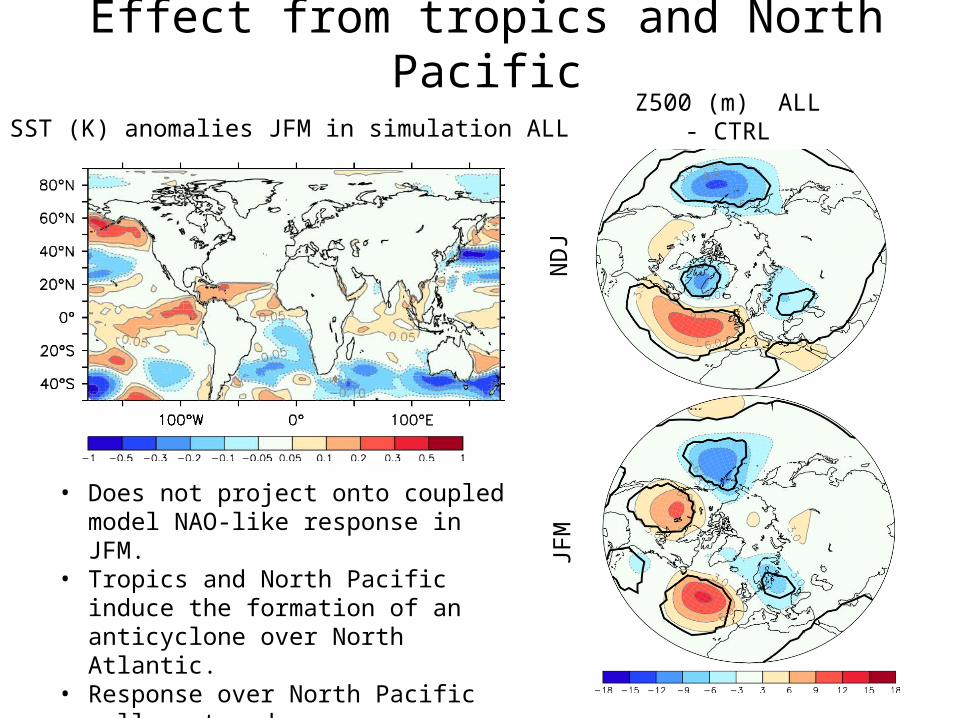
Effect from tropics and North Pacific
• Does not project onto coupled model NAO-like response in JFM.
• Tropics and North Pacific induce the formation of an anticyclone over North Atlantic.
• Response over North Pacific well captured.
SST (K) anomalies JFM in simulation ALLZ500 (m) ALL - CTRL
NDJ
JFM
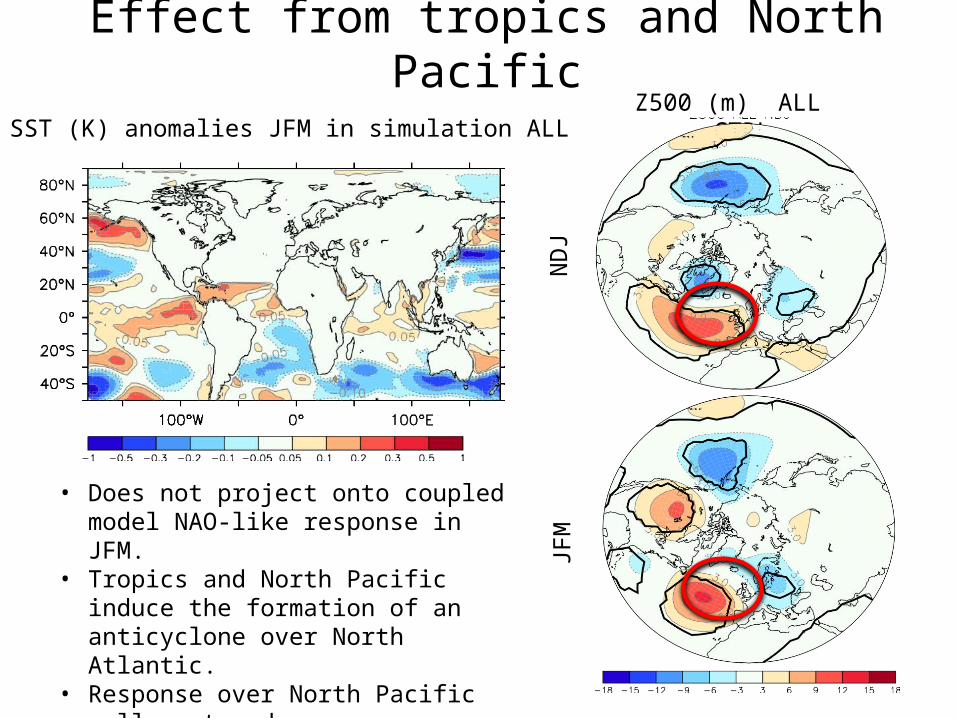
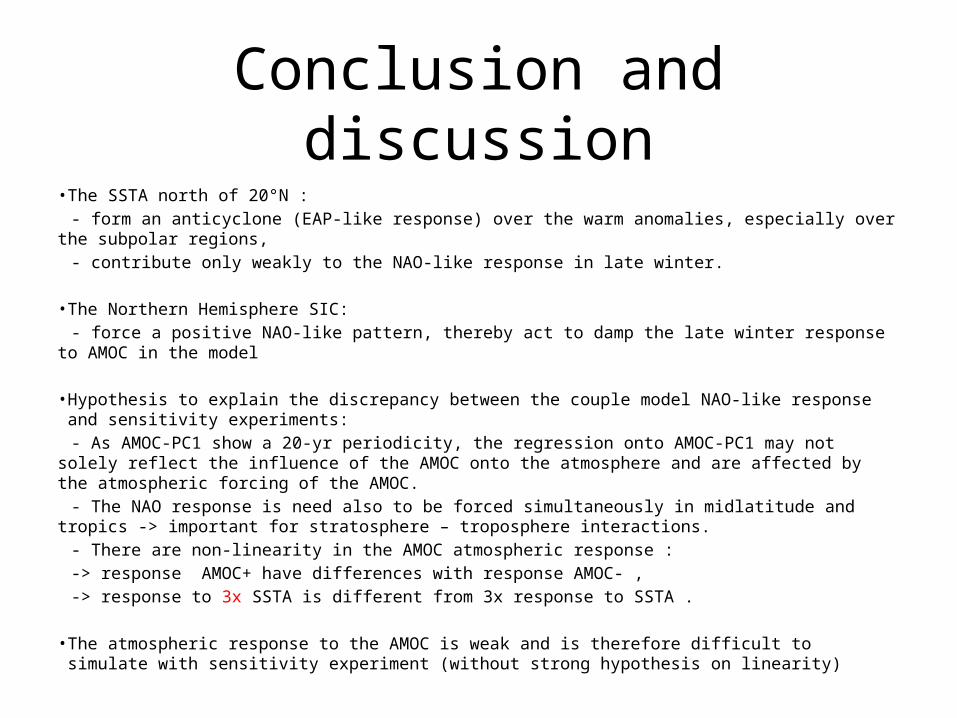
Conclusion and discussion• The SSTA north of 20°N :
- form an anticyclone (EAP-like response) over the warm anomalies, especially over the subpolar regions,- contribute only weakly to the NAO-like response in late winter.
• The Northern Hemisphere SIC:- force a positive NAO-like pattern, thereby act to damp the late winter response to AMOC in the model
• Hypothesis to explain the discrepancy between the couple model NAO-like response and sensitivity experiments:
- As AMOC-PC1 show a 20-yr periodicity, the regression onto AMOC-PC1 may not solely reflect the influence of the AMOC onto the atmosphere and are affected by the atmospheric forcing of the AMOC.
- The NAO response is need also to be forced simultaneously in midlatitude and tropics -> important for stratosphere – troposphere interactions.
- There are non-linearity in the AMOC atmospheric response :-> response AMOC+ have differences with response AMOC- ,-> response to 3x SSTA is different from 3x response to SSTA .
• The atmospheric response to the AMOC is weak and is therefore difficult to simulate with sensitivity experiment (without strong hypothesis on linearity)
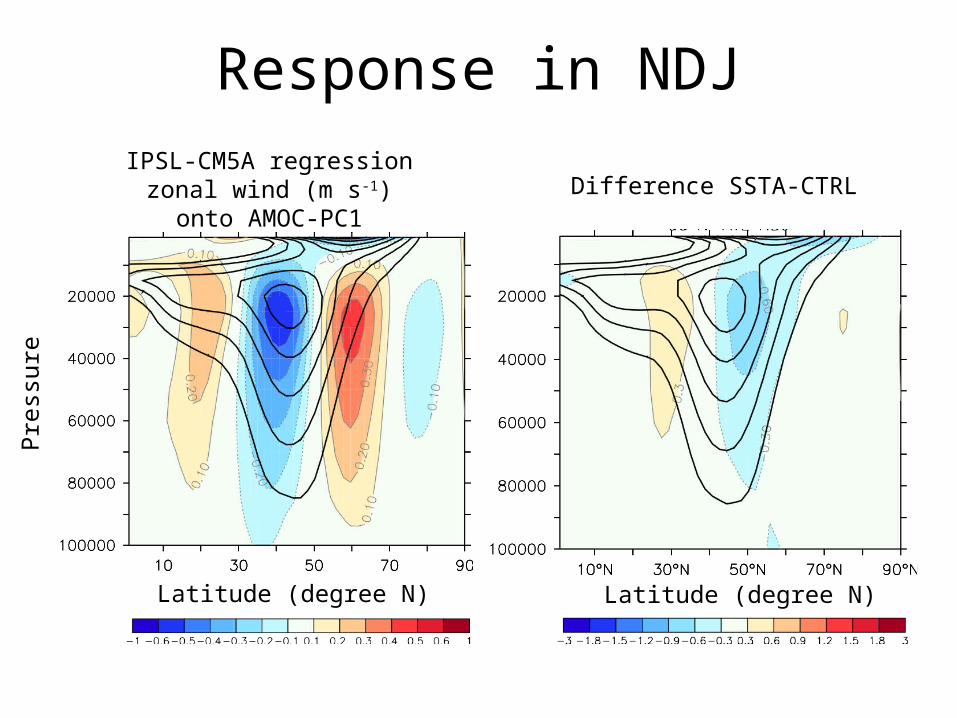
Response in NDJIPSL-CM5A regression zonal wind (m s-1) onto AMOC-PC1 Difference SSTA-CTRL
Pres
sure
Latitude (degree N) Latitude (degree N)

The research leading to these results has received funding from the European Union 7th Framework Programme (FP7 2007-2013), under grant agreement n.308299NACLIM www.naclim.eu