Embed Size (px)
Citation preview

The Millennium Development Goals in the Eastern Caribbean: A Progress Report* By Andrew S Downes PhD and Doris A Downes MSc 140 Rock Dundo Park Cave Hill, St Michael Barbados Tel no: (246) 424-0322 Email: [email protected] June 2003 Revised September 2003 Final Version December 2003 Prepared for the United Nations Development Programme (UNDP) – Barbados and the OECS

List of Acronyms
AIDS Acquired Immune Deficiency Syndrome
BVI British Virgin Islands
CARICAN Caribbean-Canadian
CARICOM Caribbean Community
CBI Caribbean Basin Initiative
DOTS Directly Observable Treatment Schedule
EU-ACP European Union-African Caribbean Pacific
FTAA Free Trade Area of the Americas
GDI Gender-related Development Index
GEM Gender Empowerment Measure
HDI Human Development Index
HIPC Heavily Indebted Poor Countries
HIV Human Immunodeficiency Virus
ICT Information and Communication Technologies
IDT International Development Target
MDG Millennium Development Goal
OECD Organisation of Economic Corporation and Development
OECS Organisation of Eastern Caribbean States
SIDS Small Island Developing States
UN United Nations
UNDP United Nations Development Programme
WTO World Trade Organisation

Acknowledgements
We would like to thank the Barbados and OECS offices of the United Nations Development Programme (UNDP) for giving us the opportunity to prepare this report. Dr Rosina Wiltshire (Resident Representative) and Kemberley Haynes were particularly helpful and patient. We have benefited greatly from the detailed comments on sections of the report provided by the staff of the ILO and PAHO. The participants at a regional conference organized to discuss the implementation of the Millennium Development Goals (MDGs) also provided additional comments on the experience in the Caribbean. Yolanda Goodwin was the main source of data for this report. Her ‘data collection survey’ was used extensively throughout the presentation. We are also grateful to the staff of PAHO who kindly provided us with additional health data. Any limitation of the report should however rest on our shoulders.

Contents
Executive Summary i
Introduction 1
Goal 1: Eradication of Extreme Poverty and Hunger 2
Goal 2: Achieving Universal Primary Education 9
Goal 3: Promotion of Gender Equality and Empowerment of Women 12
Goal 4: Reduction of Child Mortality 15
Goal 5: Improvement of Maternal Health 19
Goal 6: Combating HIV/AIDS and other diseases 20
Goal 7: Ensuring Environmental Sustainability 26
Goal 8: Promotion of a Global Partnership for Development 30
Overall Assessment for the Eastern Caribbean 37
Conclusion 41
References 42
Appendix 1 :Eastern Caribbean’ Progress Towards the MDGs:
Status at a Glance 43
Appendix 2: Statistical Tables 45

Millennium Development Goals Executive Summary
Goal1: Eradication of Extreme Poverty and Hunger Status and Trends
• Low incidence of extreme poverty in the Eastern Caribbean (highest: Grenada – 5% in 1999)
• Rural poverty tends to be greater than urban poverty as the education level of the poor is generally low and therefore the rural poor have to make do with low level jobs in the informal sector
• Poor households tend to be larger and so overcrowding is a problem. For example, in Grenada, more than 13 percent of households contained rooms that were occupied by more than 2 persons
• Low incidence of under-nutrition in St Lucia and Barbados • High use of pit toilets among poor. In St Lucia, 62.3 percent of households use pit
latrines, while in Dominica, 25 percent of households have no access to toilet facility at all (possible pollution of water sources)
• Access to piped water is a challenge for more than 37 percent of households in Dominica and St Kitts. Poor have to rely solely on stand pipes
• Higher education levels among females do not translate into equal access to better paying jobs
Challenges
• Upgrading the human resource base of the population of the EC in general and the poor, in particular
• Maintaining a level of economic growth to eradicate extreme poverty and hunger in light of changes in the external economic environment (e.g., trade liberalization)
• Developing new industries to replace declining ones • Globalization and its adverse impact on Small Island Developing States • Loss of protected trade markets
Supportive Environment
• Governments of Barbados and St Lucia are focusing on poverty alleviation strategies with the setting up of a Ministry of Social Transformation in Barbados and a Poverty Reduction Fund in St Lucia
• Skills Training Program Priorities for Development Assistance
• Human resource development and social infrastructure • Capacity building in social and economic monitoring (e.g., statistical departments)
Data Needs
• Several gaps in data collection for many of the countries o Proportion of population living below $1 per day o Poverty gap ratio o Prevalence of underweight children o Dietary energy consumption
• Ongoing data collection on poverty/hunger (every 5 years)

Goal Achievement The low incidence of poverty and hunger indicate that the goal of eradication of poverty and hunger can be achieved with sustained policy action. Goal 2: Achievement of Universal Primary Education Status and Trends
• High net enrolment in primary education • High levels of student population have completed up to Grade 5 • Literacy rates in 2000 stood at over 90 percent except for St Vincent (88.8), Antigua
(84.4%) and Anguilla (75.4%) • Literacy rates among 15-24 year olds greater than 90 percent except for Antigua (69.9%
in 1990) • Under-performance of boys relative to girls
Challenges • Improving the quality and relevance of education • Increasing attendance and reducing drop outs in school system (note: registration (i.e.,
enrolment) does not mean ongoing attendance) Supportive Environment
• All governments in the EC have made education a priority in national development (free primary level education). A significant percent of their budgets goes to education
• Educational reform programs have been implemented (e.g., EduTech in Barbados) Priorities for Development Assistance
• Upgrade for school plant and teacher training • Provision of relevant teaching materials and equipment • A balance of academic and non-academic pursuits
Data Needs • School attendance/dropout rate • Performance of children (other than national exams) • Functional literacy
Goal Achievement Some countries have almost achieved this goal. Goal is definitely achievable by 2015. Goal 3: Promotion of Gender Equality and Empowerment of Women Status and Trends
• Ratio of girls to boys at secondary and tertiary levels of education is greater than 1 • Growth in female participation rate in labour market • Ratio of literate females to males (15-24 year olds) generally greater than 1 • Females accounted for more than 40 percent employment in the non-agricultural sector • Women have not significantly increased their seats in National Assembly but the trend
is upward • Increasing degree of domestic violence against women
Challenges • Enhancement of empowerment and equality in political participation • Increasing the number of women in top managerial positions (esp, private sector)
Supportive Environment

• Several countries have established bureaus/desks of gender/women affairs in order to monitor progress in this area
• Active women associations in some countries • Non-discrimination laws
Priorities for Development • Development of gender bureaus in sub-region • Educational programs on gender issues in social/economic/political areas.
Data Needs • More research on gender (as social relationship) than on sex (biological). Sex
distributions are necessary but not sufficient for analysis of gender issues. Goal Achievement This goal has been achieved only in terms of education and employment. In terms of political achievement, a lot of progress has to be made but goal is achievable by 2015. Goal 4: Reduction of Child Mortality Status and Trends
• Under-five mortality rates fluctuated widely during the study period • Infant mortality rates fell or showed moderate fluctuation • Generally good immunization coverage for measles
Challenges • Fluctuations in rate indicates that gains achieved are not being sustained (or problems of
data collection) Supportive Environment
• Health care is a high priority for governments, with a substantial budget allocation • Advisory role of international health organizations (PAHO/WHO) • Ongoing health education program
Priorities for Development Assistance • Upgrade of health facilities • Ongoing training for health personnel • Educational programs for young mothers
Data Needs • Identification of sources of child mortality • Strengthening data collection process
Goal Achievement At present, there is much fluctuation in the under-five mortality rates but the goal of reducing this rate by two-thirds is achievable once enough effort is made to sustain the gains that have already been achieved. Goal 5: Improvement in Maternal Health Status and Trends
• Low mortality rates except for Montserrat where 2003 data show mortality rate of 20.3 deaths per 1000 live births
• Nearly 100 percent births have been attended by skilled health personnel (in St Kitts – 80 percent only)
Challenges • Reduction in teenage pregnancies • Improving the nutritional status of young mothers

Supportive Environment • All governments in the EC have made health care a priority area and so a significant
proportion of the budget is allocated to health Priorities of Development Assistance
• Educational programs in schools/clinics on maternal health • Improved training of health personnel in maternal health care
Data Needs • Identifying causes of maternal ill-health
Goal Achievement Significant progress has been made in this area and the goal has been achieved in several countries in the Eastern Caribbean. This goal is definitely achievable by the remaining countries by 2015. Goal 6: Reduction in HIV/AIDS and Other Diseases Status and Trends
• High adult prevalence rate • Small number of infected individuals fall in the 15-24 year old age group • In Montserrat, majority of infected individuals fall in 30-50 year old age group • Decline in the use of contraceptives in Antigua and Grenada but an increase in use in
Dominica • In Antigua, the number of HIV/AIDS orphans remains unchanged while in Grenada
there was an increase in the number • Cases of malaria detected in Antigua and St Vincent though the disease is not endemic
in these countries. Disease was imported into these countries. • Number of cases of TB fluctuated. Highest number of cases was found in Montserrat
but no deaths were recorded. Challenges
• Educating the population about the serious nature of the HIV/AIDS disease ( lack of a cure, effects on social/economic environments, etc)
• High cost of treatment • Combating the social stigma associated with HIV/AIDS
Supportive Environment • Special health clinics established by Governments • National educational programs by all parties – Governments, NGOs, labour, private
sector Priorities for Development Assistance
• Reduction in the cost of health care (drug cocktails) • Educational programs
Data Needs • More data on prevalence (especially among 15 to 24 year old pregnant women) and on
the incidence of disease, especially in the OECS • Number of children orphaned by HIV/AIDS
Goal Achievement The achievement of this goal presents a major challenge for the Eastern Caribbean. The goal can be achieved by the year 2015 only if greater effort and resources are expended in the areas of HIV/AIDS education and prevention strategies.

Goal 7: Environmental Sustainability Status and Trends
• Dominica is the most forested of islands of the OECS. St Vincent recorded a loss of forest cover
• Several governments have taken measures to protect land for biological diversity • St Lucia recorded largest increase in GDP per unit energy • Slight increase in the level of carbon dioxide emissions • Over 90 percent of households (except for Dominica and St Lucia) have access to piped
water • Considerable improvement in level of sanitation in Antigua, St Kitts and St Vincent;
moderate improvements in Dominica and St Lucia • Rise in prevalence rates of gastroenteritis and salmonellosis (?poor sanitation, hygiene
practices, unsafe food handling) • High prevalence rate of Dengue fever (?poor environmental sanitation) • Over 65 percent of households in OECS (except for BVI and Montserrat ) own their
properties Challenges
• Poverty (leads to destruction of the environment, unsafe sanitary practices) • Tourism development and its effects on the environment (e.g., destruction of coral reefs,
negative impact on turtle nesting) Supportive Environment
• Education – improvement in level of awareness Priorities for Development Assistance
• Distribution of land (cater to landless) • Proper planning of infrastructural development (housing, tourism) to limit damage to
environment • Adequate waste disposal (methods of disposal) • Natural Disaster Management
Data Needs • Improvement in data collection on an ongoing basis
Goal Achievement Some degree of progress has been made with respect to the achievement of this goal. However, for the goal to be fully achieved by 2015, a number of measures must be instituted, namely:
o Measures implemented to alleviate poverty o Provision of adequate infrastructure o Education to increase awareness with respect to environmental issues o Enforcement of legislation to reduce/prevent damage to the environment
Goal 8: Development of a Global Partnership for Development Status and Trends
• Official development assistance needed to help with infrastructural development and other developmental projects
• EC countries have been signatories to several bilateral and multi-lateral agreements to facilitate market access for exports of the region
• Debt service ratio relatively low in the region • High levels of unemployment amongst the youth especially females
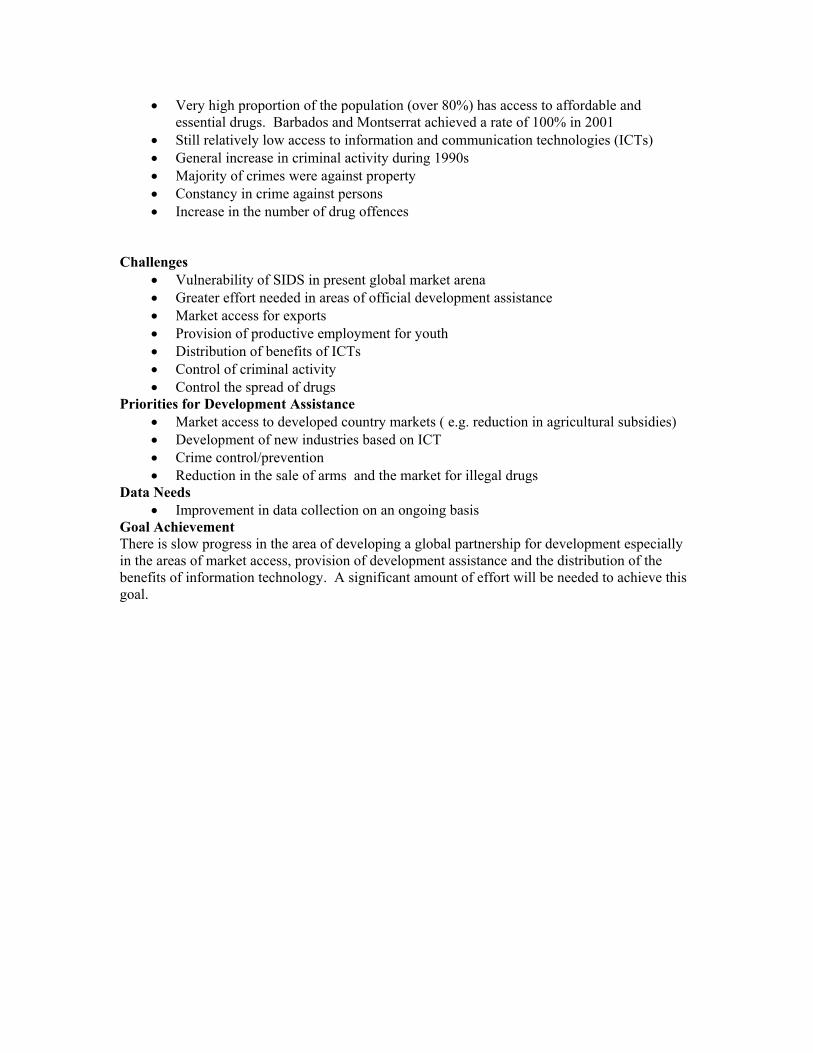
• Very high proportion of the population (over 80%) has access to affordable and essential drugs. Barbados and Montserrat achieved a rate of 100% in 2001
• Still relatively low access to information and communication technologies (ICTs) • General increase in criminal activity during 1990s • Majority of crimes were against property • Constancy in crime against persons • Increase in the number of drug offences
Challenges
• Vulnerability of SIDS in present global market arena • Greater effort needed in areas of official development assistance • Market access for exports • Provision of productive employment for youth • Distribution of benefits of ICTs • Control of criminal activity • Control the spread of drugs
Priorities for Development Assistance • Market access to developed country markets ( e.g. reduction in agricultural subsidies) • Development of new industries based on ICT • Crime control/prevention • Reduction in the sale of arms and the market for illegal drugs
Data Needs • Improvement in data collection on an ongoing basis
Goal Achievement There is slow progress in the area of developing a global partnership for development especially in the areas of market access, provision of development assistance and the distribution of the benefits of information technology. A significant amount of effort will be needed to achieve this goal.

1
1 Introduction
One of the main objectives of the United Nations (UN) is the promotion of social and
economic development among its members. In order to keep track of the extent of social
and economic development in member states, the United Nations Development
Programme (UNDP) has developed an aggregate measure of human development
incorporating social and economic dimensions. The Human Development Index (HDI)
measures three basic dimensions of human development: longevity, knowledge and
access to resources. The HDI has been complemented by other measures of social
progress: the Human Poverty Index (HPI), the Gender-related Development Index (GDI)
and the Gender Empowerment Measure (GEM).
Associated with the development of human development measures was a series of
summits and conferences dealing with education (Jomtien, 1990), environment and
development (Rio, 1992), population and development (Cairo, 1994), social development
(Copenhagen, 1995) and women (Beijing, 1995). These meetings resulted in the
adoption of a set of International Development Targets (IDTs) by the Development
Assistance Committee of the OECD in 1996. These targets covered such areas as
poverty, primary level education, gender equality and empowerment of women, infant
mortality, maternal mortality, access to primary health care and sustainable development.
In September 2000, the Millennium Declaration was adopted by all 189 UN member
states at the General Assembly of the UN. This Declaration consisted of a set of
development goals which were very similar to the IDTs. The IDTs and the goals in the
Millennium Declaration were later merged into a set of Millennium Development Goals
(MDGs). These MDGs reflect the need to promote human development, that is,
enlarging people’s choices by expanding the functionings and capabilities of people in all
countries. The MDGs consist of eight goals, eighteen targets and forty-eight indicators.
The goals are:
i. the eradication of extreme poverty and hunger
ii. the achievement of universal primary education

2
iii. the promotion of gender equality and the empowerment of women
iv. the reduction of child mortality
v. the improvement of maternal health
vi. the control of HIV/AIDS and other diseases
vii. the promotion of environmental sustainability
viii. the development of a global partnership for development.
The development planning period for the achievement of these goals is 1990 to 2015.
These goals are broadly specified so that individual countries can identify their own goals
and associated strategies and policies for achieving them. The goals are quantitative in
nature so that goal achievement can be tracked over the development planning period.
Underlying the quantitative nature of these goals is the qualitative changes needed to
sustain the eradication of poverty. In effect, the MDGs address the various dimensions of
the human development of nations.
This report provides an assessment of progress with the achievement of the MDGs in the
Eastern Caribbean, that is, Barbados and members of the Organisation of Eastern
Caribbean States (OECS), over the period 1990 to 2002. It complements previous UNDP
reports prepared on social and economic development in the Eastern Caribbean, namely,
the Sub-Regional Common Assessment of Barbados and the OECS (UNDP, 2000) and
the OECS Human Development Report 2002 (OECS, 2002).
The structure of the presentation is as follows: in sections 2 to 9, an assessment of the
eight MDGs in the Eastern Caribbean is undertaken. In section 10, an overall assessment
of progress towards the achievement of the MDGs is presented. The final section
summarizes the main issues in the report.
2 Goal 1: Eradication of Extreme Poverty and Hunger An important MDG is the eradication of poverty and hunger throughout the world. The
achievement of this goal involves two targets and five indicators/measures. The first
target relates to the reduction in the proportion of people whose income is less than one

3
dollar (in terms of purchasing power parity) a day by half between 1990 and 2015. The
second target refers to the halving of the proportion of people who suffer from hunger.
The data on poverty and hunger in the Eastern Caribbean is very sparse. Little or no time
series data exist on the indicators used for goal 1 since many of the studies on poverty
were one-off studies
Target 1: Halve between 1990 and 2015 the proportion of people whose income is
less than one dollar a day.
Indicator 1: Proportion of population below $1 per day (PPP values).
No data exist for Anguilla, Antigua and Barbuda, Dominica, St Kitts and Nevis, BVI,
Montserrat and Barbados. However, for Grenada, St Kitts and Nevis and St Vincent and
the Grenadines, the proportion of the population earning below US $1 per day is shown
in Table 2.1.
Table 2.1
Proportion of Population Living below $1 per day
Country
Year
Proportion of
Population living
below US $1 a day
%
Grenada 1999 4.7
St Lucia 1995 2.97
St Vincent 1996 5.55
Source: Data Collection Survey
Indicator 2: Poverty Gap Ratio
This ratio combines the incidence (that is, the number of units below the national poverty
line) and depth (that is, the difference between the poverty line and the income of the
poor unit) of poverty in a country. In Antigua and Montserrat, no data exist on the
poverty gap ratio. The data available for the Eastern Caribbean are shown in Table 2.2.

4
The Windward Islands of Grenada, St Vincent and Dominica exhibited the highest values
of the poverty gap ratio.
Table 2.2: Poverty Gap Ratio
(% of population)
Country
Year
Poverty Gap
Ratio %
Anguilla 2001/2002 6.9
Barbados 1997 2.3
BVI 2002 4.1
Dominica 2002 10.2
Grenada 1998 15.3
St Kitts 1999/2000 8.2
Nevis 1999/2000 2.8
St Lucia 1995 8.6
St Vincent 1996 12.6
Source: Caribbean Development Bank
Indicator 3: Shares of Poorest Quintile in National Consumption
The share of the poorest quintile is available for Anguilla, Dominica, Grenada, St Kitts,
St Lucia and St Vincent and values are shown in Table 2.3. No data were available for
Antigua, Montserrat and Barbados
Table 2.3
Share of Poorest Quintile in National Consumption
Country Year Share
Anguilla 2001/2001 35
Dominica 2001 40
Grenada 1999 32.1
St Kitts 1999 31.3*
St Lucia 1995 25.1
St Vincent 1996 37.5 Note: *derived from an average of 30.5 for St Kitts and 32.1 for Nevis
Source: Data Collection Survey

5
Although time series data are not available from 1990, the indicators for the first target
suggest a relatively low incidence of poverty in the Eastern Caribbean compared to other
developing countries. The share of the poorest quintile in national consumption however
was relatively high (that is, over 25 percent) during the late 1990s.
Target 2: Halve between 1990 and 2015 the proportion of people who suffer from
hunger.
Indicator 4: Prevalence of underweight children ( % of children under 5 years of age)
An assessment of this indicator in the Eastern Caribbean is very difficult. Some data are
available for Anguilla, Antigua and Grenada (see Table 2.4). The prevalence of
underweight children appears to be relatively low in these countries. The percent of
children under 5 years of age is less than three. No data exist for Dominica, St Kitts, St
Lucia, British Virgin Islands, Montserrat, St Vincent and Barbados.
Table 2.4
Prevalence of Underweight Children (under 5 years of age)
Anguilla Antigua Grenada
Male Female Total Male Female Total Male Female Total
1992 - 0.61 0.30 - - - - - -
1995 - 0.78 0.39 - - 0.6a - - -
1997 0.78 2.86 1.83 - - 0.87a - - -
1999 1.35 1.12 1.23 - - 0.62 1.8a 1.5a 1.79
2000 1.15 2.95 2.07 - - 0.9 1.4a 1.5a 1,5a
2001 0.95 1.28 1.12 - - 1.08a - - -
Note: a – abnormal weight for age/recorded as underweight
Source: Data Collection Survey

6
Indicator 5: Proportion of population below minimum level of dietary energy
consumption.
In St Lucia, the only country for which data exist for 1995, the proportion of the
population which was below the minimum level of dietary energy consumption was 7.1
percent. In Barbados, the Barbados Food Consumption and Anthropometric Survey
(2000), reported a low incidence of mild under-nutrition but virtually no incidence of
moderate or severe under-nutrition.
Poverty assessments undertaken in the Eastern Caribbean during the 1990s have
produced a profile of the poor which include, among other features:
• low human capital (i.e., level of education and skill) base, with lesser accessibility
to secondary level schooling;
• poor housing conditions with overcrowding being a problem. There is relatively
high use of pit latrines and limited access to potable water;
• high incidence of malnutrition among children in poor households;
• high levels of employment in the informal sector (acting as a cushion for
unemployment in the formal sector). Growth in the informal sector is unlikely to
promote any significant economic growth at the individual or country level; hence
poverty will persist among this group
• high incidence of poverty in female-headed households
Rural poverty tends to be greater than urban poverty as the former tends to be associated
with low level skills and therefore low levels of remuneration. The education level of the
rural poor is also low. Three quarters of the poor in the OECS do not go beyond primary
level education (OECS Human Development Report, 2002). Poor households tend to be
larger than those of the non-poor and the dependency ratios in these households are also
higher. From the data available, Grenada showed the greatest extent of overcrowding
with 13.0 percent of households contained rooms in which more than two people shared
the same space [see Table 2.5].

7
Table 2.5:
Dependency Ratio and Incidence of overcrowding
in the OECS, 2002
Country
Dependency
Ratio
Overcrowding*
Anguilla 52.1 4.2
Antigua 45.5 …
Dominica 56.8 10.9
Grenada 89.1 13.6
Montserrat … 2.9
St Kitts 62.8 …
St Lucia 64.4 …
St Vincent 54.3 …
*percentage of households with >2 persons per room
Source: Government Statistical Offices and OECS (2002) and Data
Collection Survey
Grenada had the highest dependency ratio (89.1) and Antigua, the lowest (45.5). In
Montserrat, only in about 3 percent of households do more than two people share a room.
Where several generations live under one roof there is inter-generational transfer of
poverty (OECS Human Development Report, 2002). In this way poverty can become
endemic in the community.
Another measure of poverty is access to toilet facilities and potable water. In St Vincent
and the Grenadines a significant proportion of households (62.3 percent) use pit latrines.
In St Lucia, St Kitts and Antigua 40 percent or more of households rely on pit latrines. In
Dominica, a quarter of households have no toilet facility whatsoever. These findings
point to the potentially serious public health consequences as water sources can easily
become contaminated with faecal organisms.
Over thirty-seven percent of households in Dominica and St Kitts have to rely on stand
pipes as their water source. Fetching water places an additional burden on the poor as the
time can be spent in productive income generating activities. In Dominica, diseases

8
related to the water supply sewage disposal and poor sanitation in general are significant
among children.
The Government of Barbados has been committed to the reduction and eventual
eradication of poverty in the island. To this end, the government established a Ministry
of Social Transformation. A Poverty Alleviation Bureau, established in 1998, is one of
the agencies within the Ministry which seeks to alleviate poverty through involvement at
the community level by ensuring that individuals have access to resources and
opportunities.
The Poverty Alleviation Bureau liaises with other government agencies, non-
governmental agencies and the private sector in order to implement programs for the
benefit of the poor. The groups which are eligible for assistance from the government
include the unemployed, one parent families, mentally and physically challenged
individuals and non-contributory pensioners. These individuals benefit from assistance
such as the payment of arrears in utility bills, help in the acquisition of house spots, house
repairs and home help services for the physically and mentally challenged.
Two studies of poverty have been undertaken in Barbados. The IADB (1998) undertook
a national study of poverty and income distribution for the period 1996/97, while
Saptigiri (2002) examined poverty in two districts (rural and urban) in October-
November 2001. These two studies are not comparable. While the IADB study found
that rural poverty was higher than urban poverty, Saptigiri found the opposite in her
comparison of the two districts. The surveys however found that in poor households, the
majority of the income was spent on food and the payment of bills.
In Barbados, access to piped water is very high with over 96 percent of households being
supplied with piped water, while the number of private households with water-borne
toilets stood at 81 percent in 2000.

9
Improvements that have been made so far show that the goal of eradicating extreme
poverty and hunger is achievable.
3 Goal 2: Achieving Universal Primary Education It has been well established that the development of the human resources of a country
provides the foundation for the long-term eradication of poverty. Human resources
development in the form of education, training, health care and nutrition is therefore one
of the primary policy goals of governments in developing countries. The second MDG
focuses on the achievement of universal primary level education whereby children in all
countries will be able to complete a full course of primary schooling by the year 2015.
This goal and associated targets are reflected in three indicators.
Indicator 1: Net enrolment Ratio in Primary Education
The net enrolment ratio is defined as the number of children of a given school age (e.g.,
primary level school age) enrolled in a given level of education (e.g., primary education)
as a percentage of the total number of children in the same age group in the population.
The maximum value of this ratio is 100.
The data survey of the Eastern Caribbean indicated that no information existed for
Anguilla, Grenada, the BVI and St Vincent. The available data indicate that there are
relatively high net enrolment ratios in the Eastern Caribbean [see Table 3.1]. The target
has been achieved in Barbados and is achievable by the year 2015 in Dominica, St Kitts
and St Lucia (although it seems that the gross enrolment ratio was used in some
instances). Antigua would need to make a greater effort to achieve the 100 percent
enrolment rate by 2015. The volcanic disruptions in Montserrat would make the target of
universal primary level education difficult to achieve by the year 2015. Supplementary
data for St Vincent and the Grenadines indicate that net primary enrolment rate was 84
percent in the late 1990s which suggests that the target is achievable. An analysis of the
enrolment rates by sex indicates that they are slightly higher for females at the primary
level in Barbados. Similar data are not available for the OECS.

10
Indicator 2: Proportion of Pupils Starting Grade 1 Who reach Grade 5
Data on this indicator are very sparse in the Eastern Caribbean. The information
available for some countries suggests that the target of 100 percent is achievable by 2015:
Antigua: 94.4 percent (2000); Dominica: 91.1 percent (1999); Grenada: 99 percent
(2001) and St Lucia: 94.8 percent (1990/91). These high levels indicate a low drop-out
rate at the primary level.
Indicator 3: Literacy Rate of 15-24 year olds
Very little data are available on literacy rates in the Caribbean over the 1990s. It should
be noted that there have been arguments relating to the measurement of literacy in the
region. The available evidence does indicate a high degree of literacy amongst the
population (and hence among the 15-24 years old category). Data on literacy rates in the
Eastern Caribbean are shown in Figs 3.1a and 3.1b (see also Tables 4a and 4b in
Appendix 2).
With a high level of primary school enrolment, it is expected that the literacy rate would
be high. Based on the indicators for goal 2, it is likely that the countries of the Eastern
Caribbean would achieve the goal of universal primary level education by the year 2015.
All of the governments in the region have set universal primary level education as a key
goal of their human resources development strategies. In some cases, universal
secondary level education has been established as a goal. In many situations, the
existence of poverty at the household level has prevented the achievement of universal
primary level education.

11
Figure 3.1a
Literacy Rates in the Eastern Caribbean
0
20
40
60
80
100
120
1992 1991 1991 1993 1991 1996 1991 1991 1991
Anguilla Antigua BVI Dominica Grenada Montserrat StKitts/Nevis
St Lucia St Vincent
Year/Country
Num
ber Male
Female
Total
Figure 3.1b
Literacy Rates among 15-24 year olds in the Eastern Caribbean
020406080
100120
1990 1990 1990 2001 1990 1990 2001
Antigua StKitts/Nevis
St Lucia BVI Barbados
Year/Country
Perc
ent
Male
Female
Total

12
4 Goal 3: Promotion of Gender Equality and
Empowerment of Women
The promotion of gender equality and the empowerment of women has been an important
goal of members of the United Nations, especially since the Beijing Conference on
Women which was held in 1995. The main target of this goal is the elimination of gender
disparity in primary and secondary level education by 2005 and at all levels of education
by 2015. Concern has been raised over the level of domestic violence against both
women and men, with violence against women showing a higher incidence. Domestic
violence has also been documented across all socioeconomic groups. However, the
available evidence suggests that there is a greater incidence of violence in poor
households. Domestic violence tends to be associated with power relations between men
and women, deficiencies in the levels of education, unemployment and job status
(Handwerker, 1988).
Several countries have established bureaus/desks of gender/women affairs in order to
monitor and promote progress with this MDG. While the establishment of these units in
central government is an important first step, they tend to be understaffed and therefore
are unable to fully handle the issues of gender equality and the empowerment of women.
In many instances, several non-governmental organizations have had to provide advocacy
on gender issues in the respective countries. In order to determine the achievement of the
target associated with this goal, four indicators have been identified.
Indicator 1: The ratio of girls to boys in primary, secondary and tertiary education
The available data for the Eastern Caribbean indicate that at the secondary and tertiary
levels, the ratio of girls to boys is generally greater than one [see Fig 4.1 and Appendix 2,
Table 5]. In effect, more girls than boys attend secondary and tertiary level institutions in
the region. The trend has also been observed in the ratio of females to males graduating
from University of the West Indies over the past decade. In addition, the labour market
data for several Caribbean countries indicate a relative constancy of the male
participation rate and a growth in the female participation rate over the past two decades.

13
Figure 4.1
Indicator 2: The Ratio of Literate Females to Males aged 15 -24 year old
Little information is available on this indicator. The data available for Anguilla (1990
and 2001), Antigua (1990) and BVI (1990) indicate a ratio of just over one. Given the
general high degree of adult literacy in the Eastern Caribbean and the high ratio of girls to
boys in the secondary and tertiary levels of education, it is expected that the ratio of
literate females to males in the youth cohort would be generally greater than one.
Indicator 3: The Share of Women in Wage Employment in the Non-Agricultural
Sector
Labour market data are very scarce in the Eastern Caribbean. Only Barbados and St
Lucia conduct regular labour force surveys. Occasional surveys are undertaken in the
other countries. In many cases, the only reliable information on the labour market is the
population census conducted every ten years. The available data indicate that in the
1990s, females accounted for over 40 percent of the employment in the non-agricultural
sector. With the growth in the services sector in the Eastern Caribbean, several women
have been employed in service-oriented jobs such as sales, clerical and related
occupations. Several women have also been employed in data entry and related activities
Ratio of Boys to Girls in Primary, Secondary and Tertiary Education
0
0.5
1
1.5
2
2.5
1990 2001 1990 2001 1995 2001 1995 2000 1991 2000 1990 1999 1990 1998 1990 1998 1990 2001 1990 2001
Anguilla Antigua Dominica Grenada StKitts/Nevis
St Lucia BVI Montserrat StVin/Gren
Barbados
Year/Country
Ratio
Primary
Secondary
Tertiary

14
in the manufacturing sector. In addition, there was a general increase in this figure
during the 1990s in all the countries for which data are available [see Figure 4.2].
Figure 4.2
Share of Women in Wage Employment in the Non-agricultural Sector in the Eastern Caribbean
0
10
20
30
40
50
60
1990
2001
1990
1990
1999
1990
1990
1995
1999
1990
1990
1991
2001
Anguilla Antigua Dominica GrenadaMontserrat St Lucia StKitts/Nev StVin/Gren
Barbados
Year/Country
Perc
ent
Indicator 4: Proportion of Seats Held by Women in the National Parliament
The participation of women in national political activity is still small as suggested by this
indicator [see Figure 4.3]. Although women participate fully in the political process –
voting, canvassing, and membership of boards – they have not been very successful in
significantly increasing their seats in national Parliaments. There is however a general
upward trend in the available data although the number of seats in Parliament still remain
small. For example, in Barbados, in 2002 four of the twenty-six seats were held by
women in the Lower House of Parliament.

15
Figure 4.3
The available information on the four indicators reflecting the promotion of gender
equality and empowerment of women indicate that women have made some strides on
the economic and social fronts. However, the MDG indicators provide only a limited
view of the nature of gender equality and empowerment. For example, there is still a
need to enhance empowerment and equality on the political front. Given the low
percentages associated with political equality and the extent to which women are more
affected by poverty than men, it is doubtful whether this aspect of the target can be
reached by the year 2015.
5 Goal 4: Reduction of Child Mortality In general, health care in the Eastern Caribbean has improved significantly over the years
as evidenced by increased life expectancies and the eradication of communicable diseases
such as measles, polio and small pox through successful immunization and surveillance
programs. Improvements in health care have been due to aggressive health policies of
most of the governments of the region as concerted efforts have been made over the years
to maintain health expenditure even in the face of declining government revenues.
Proportion of Seats held by Women in the National Parliament 1990-2001
0 5
10 15 20 25 30 35
1990 20011992 2000 1990200119902000199220001992199619921996 1990 2001
Antigua Dominica GrenadaMontserratSt Lucia StKitts Nev
StVincent
Barbados
Year/Country
Percent

16
The goal of eradicating child mortality involves one target and three indicators. The
target is the reduction in under-five mortality rates by two-thirds between 1990 and 2015.
Three indicators are associated with this goal.
Indicator 1: Under-five Mortality Rate.
The under-five mortality rate is defined as the number of deaths among children under
five years of age per 1000 live births. The under-five mortality rate for all countries
comprising the study group is presented below in Figure 5.1. No data were available for
Montserrat for the period under investigation.
Figure 5.1
Under five mortality rate in the Eastern Caribbean
05
10
15202530
3540
Ang
uilla
Ant
igua
/Bar
Dom
inic
a
Gre
nada
St L
ucia
BV
I
St V
in/G
ren
St K
itts
Bar
bado
s
Year/Country
Mor
talit
y ra
te 19901995199719982001
Under-five mortality rates for all countries have fluctuated during the study period. Only
in Anguilla were rates below 7.0 per thousand between 1996 and 2000. Overall, perinatal
mortality accounts for 38 percent of all deaths under five years in the region of the
Americas.

17
Indicator 2: Infant Mortality Rate
Infant mortality rates for children under one year of age fluctuated between 5 and 25
deaths per 1000. The only available figure for Anguilla shows an infant mortality rate of
5 deaths per 1000 population in 2000. Consistently lower rates of less than 15 deaths per
thousand were reported for British Virgin Island and Barbados throughout the review
period. While infant mortality rates for the British Virgin Islands showed a gradual
decline during the period, rates for Barbados showed a gradual increase after falling to 11
deaths per thousand in 1998. Infant mortality rates for Dominica, Grenada, St Lucia,
Antigua and St Vincent and the Grenadines all stood at below 25 deaths per thousand of
population. In the case of St Lucia, the infant mortality rate fell from 18.1 deaths per
1000 in 1990 to 12 per 1000 in 2001 (see Table 9, Appendix 2). Infant mortality rates for
St Kitts and Nevis fell from over 25 deaths per thousand to just under 15 deaths over the
period 1990 to 2000. Fluctuating results for Antigua, Dominica and St Vincent and the
Grenadines show that the gains achieved in lowering the infant mortality rate have not
been sustained.
Figure 5.2

18
Indicator 3: Proportion of 1 year old children immunized against measles
This indicator is defined as the number of children aged 1 year who received one dose of
vaccine against measles and expressed as a percentage of the 1 year old population. The
proportion of such children who received this vaccine is shown in Figure 5.3 and Table
10, Appendix 2.
The data indicate that in the Eastern Caribbean, immunization coverage for measles is
generally good. Coverage for Dominica, in particular has been consistently high
(between 95 and 100 percent) throughout the review period. Health authorities in
Montserrat in particular and, to a lesser extent, Anguilla must be mindful that the level of
immunization does not fall appreciably. On the whole, the goal of reducing child
mortality is achievable by 2015 once the immunization efforts are sustained.
Figure 5.3
Proportion of under-1 Population vaccinated against measles
75
80
85
90
95
100
105
Anguil
la
Ant/Barb
Barbad
os
Domini
ca
Grenad
a
Mon
tserra
t
St Kitts
/Nev
is
St Luc
ia
St Vin/
Gren BVI
Country
Prop
of u
nder
-1yr
old
1998
1999
2000
2001

19
6 Goal 5: Improvement of Maternal Health The goal of improving maternal health involves one target and two indicators.
Target: Reduce by three-quarters, between 1990 and 2015, the maternal mortality ratio.
Indicator 1: Maternal Mortality Ratio
This indicator is defined as the number of maternal deaths per 100,000 live births.
However, because of the smaller number of births in the Eastern Caribbean, it is
recommended that the rate for the region should be defined per 1000 live births instead of
100,000 as recommended internationally.
Data on maternal mortality have been sparse throughout the Eastern Caribbean.
However, the available data point to low maternal mortality ratios. Montserrat recorded
maternal mortality ratio figure of 20.3 per 1000 live births in 2000. This figure is
particularly high for the region and may have been due to disruption of services brought
about by the volcanic eruption in that island. In general, maternal health care in the sub-
region has improved significantly. Between eighty to ninety percent of the population in
the Eastern Caribbean now have access to skilled maternal health care.
Indicator 2: Proportion of Births attended by Skilled Health Personnel
This indicator refers to the number of births which were attended by skilled health
personnel as a percentage of the total number of births. Attendance rates have been as
shown in Figure 6.1. Attendance rates have been very high with rates for 2000 and 2001
between 98 and 100 percent. At the present level, the goal of improving maternal health
by 2015 is definitely achievable.

20
Proportion of deliveries attended by trained personnel
86
88
90
92
94
96
98
100
102
Angu
illa
Ant/B
arb
Barb
ados
Dom
inica
Gren
ada
Mon
tserra
tSt
Kitt
s/Nev
St L
ucia
St V
in/G
ren
BVI
Countries
Perc
enta
ge
1990
1998
1999
2000
2001
Figure 6.1
7 Goal 6: Combating HIV/AIDS and Other Diseases The incidence of HIV/AIDS still remains high with an adult prevalence rate of 1.96. At
present, the Caribbean region is second only to sub-Saharan Africa in terms of incidence
of the disease. The prevalence of HIV/AIDS is exacerbated by poverty, lack of
information, unequal gender relations and social and cultural beliefs and behaviours that
guide sexual activity. The disease places a tremendous burden on the human and
economic resources of the countries of the Eastern Caribbean. It threatens to reverse the
real development gains that have been made over the last four decades with grave
implications for the long-term development of these countries. HIV/AIDS reduces life
expectancy, resulting in a negative impact on savings, investment, education,
employment and productivity. The additional burden on households and health care
systems also affects social cohesion, changes in societal values and deepens gender
inequalities. The other areas of health care are likely to be negatively affected as
increasing resources have to be diverted in order to keep the HIV/AIDS epidemic in

21
check. The goal of combating HIV/AIDS and other diseases is associated with two
targets and seven indicators.
Target 1: Have halted by 2015 and begun to reverse, the spread of HIV/AIDS
Indicator 1: HIV Prevalence among 15-24 year old pregnant women
Data are unavailable with respect to the number of 15-24 year old pregnant women
affected by HIV/AIDS. However, only a small number of infected individuals fall in this
general age group when compared to the total number of individuals who are infected.
Further, there is no disaggregation by sex. For the British dependencies of Montserrat
and British Virgin Islands, the trend shows that infected individuals fall into the 30-50
year old age group.
Indicator 2: Contraceptive Prevalence Rate
Contraceptive prevalence rate is defined as the number of persons aged 15-49 who
currently use any type of contraceptive method as a percentage of the population aged 15-
49. In some cases, first visits to family clinics are taken as a proxy for contraceptive use.
Data with respect to contraceptive use are only available for seven countries: Antigua,
Barbados, Dominica, Grenada, St Kitts/Nevis. St Lucia and St Vincent and the
Grenadines [see Figure 7.1].

22
Figure 7.1
Prevalence of contraceptive use in women of childbearing age 1991-2000
0
10
20
30
40
50
60
Anti/Barb
Barbad
os
Dom
inica
Gren
ada
St Kitts
/Nev
is
St Luc
ia
St Vinc
ent/G
ren
Country
Perc
ent
Source: PAHO/WHO Country Representation based on country information Note: Value represents the last available year 1991-1998, 2000
According to the data provided, between 40 and 52 percent of women of childbearing age
in the Eastern Caribbean used contraceptive methods during the 1991-2000 period. Over
50 percent of women of child bearing age in Barbados, Antigua and Barbados and
Grenada used contraceptive methods. Contraceptive use was lower in St Kitts and Nevis
and St Vincent and the Grenadines.
Indicator 3: Number of children orphaned by HIV/AIDS
Very little data exist with respect to the number of children who have been orphaned by
HIV/AIDS. Antigua and Grenada are the only two countries with any information. In
Antigua, the number of orphans remained at eleven during 2000 and 2001, while in
Grenada, the numbers have increased over the 1999-2001 period from one in 1999, four
in 2000 to five in 2001. HIV/AIDS continues to be the major cause of death of persons
between the ages of 25 and 44. Consequently, there will a rise in the number of children
left orphaned by the disease unless regional governments implement programs which
provide anti-retroviral drugs to those persons who are eligible. There are serious

23
implications as children left as orphans are prone to be used in child labour or they may
turn to prostitution in order to eke out a living.
The Barbados government recently announced some success in the fight against
HIV/AIDS. The provision of highly active retroviral drugs free of cost to infected
individuals has resulted in a forty-three percent reduction in the number of deaths due to
AIDS (Daily Nation, 23 September 2003). Additionally, there has been a reduction in
mother-to-child transmission of the virus so that more children will be HIV-free at birth.
With this reduction in the number of AIDS death, it is expected that the number of AIDS
orphans will fall. As this success story is replicated in other countries in the region, it is
likely that by 2015 a significant reversal in the spread of HIV/AIDS would be seen.
Target 2: Have halted by 2015, and begun to reverse, the incidence of malaria and
other major diseases.
Indicator 1: Prevalence and death rates associated with malaria
Malaria is not endemic in counties in the Eastern Caribbean; only imported cases of the
disease are seen. Antigua and St Vincent are the only two countries with recorded cases
of malaria, and in both countries these cases were imported. No deaths resulted from this
disease in either country. In the case of St Vincent a prevalence rate of 0.9 per 1000
population was recorded in 1995, while in Antigua, the prevalence rates were: 2.95
(1995), 1.41 (1999) and 2.64 (2001).
Indicator 2: Proportion of population in malaria risk areas using effective malaria
prevention and treatment measures.
No data are available for the proportion of the population using effective malaria
prevention and treatment measures.
Indicator 3: Prevalence and death rates associated with tuberculosis (TB)
The prevalence rate is defined as the number of reported cases per 100,000 population,
while the death rate is the number of deaths from TB per 100,000 population.

24
The number of cases of patient infected with Tuberculosis declined in Barbados and
Antigua and Barbuda and St Vincent and the Grenadines over the 1996-2002 period. The
number of reported cases in St Lucia fell from over 20 in 1996 to about nine in 2000 but
by 2001 there was an increase in the incidence of the disease again. In fact, St Lucia is
regarded by the Caribbean Epidemiology Centre (CAREC) as a priority country with
respect to this disease. In 2002, Dominica also reported a rise in the number of cases of
persons infected with tuberculosis. Tuberculosis, which is an opportunistic disease
attacks, AIDS victims because of a compromised immune system. In some countries
where the prevalence of HIV and TB is high, the diagnosis of tuberculosis in patients
who present with no obvious signs of HIV/AIDS may foretell a possible infection with
HIV/AIDS. The prevalence of tuberculosis fluctuated within the Eastern Caribbean [see
Figure 7.2 ].
Figure 7.2
Reported cases ofTuberculosis (All Forms) 1996-2002
0
5
10
15
20
25
Anguil
la
Ant/Barb
Barbad
os
Domini
ca
Grenada
Montse
rrat
St Luc
ia
St Kitts
/Nev
St Vin/
GreBVI
Country
Rep
orte
d ca
ses
of T
B
1996
1998
20002001
2002
Indicator 4: Proportion of TB cases detected and cured under DOTS
Use of the Directly Observed Treatment Short Course (DOTS) resulted in a cure rate of
50 percent of TB cases over the study period. This form of treatment for tuberculosis, as
the name implies, is administered over a much shorter period than the traditional course
of treatment which has to be administered over a lengthy period.

25
It is no surprise that the number of reported smear positive case has been large in St
Lucia given the increase in numbers of individuals infected with the disease. However
by 2001, a steady decline was noted in the number of positive cases. Reported smear
positive tests for 2001however indicated resurgence in the disease in Barbados [see
Figure 7.3].
Figure 7.3
New smear-positive cases(1993-2001)
02468
10121416
Angu
illa
Ant/B
arb
Barb
ados BV
I
Domini
ca
Grenad
a
Montse
rrat
St K
itts/N
ev
St L
ucia
St V
in/Gre
Country
Num
ber
of C
ases 1993
1995
1997
1999
2001
The data indicate that the goal of combating HIV/AIDS, malaria and other diseases is
achievable only if great effort and resources are expended especially in the area of
HIV/AIDS. Changes are required in life styles and attitudes towards sexual behavior in
particular. Since HIV weakens the immune system, opportunistic diseases such as
tuberculosis can be kept under control if there is a corresponding control in the rate of
HIV infection.
With regard to health-related indicators, the region has made considerable progress with
differences within and between countries. Specifically, considerable progress has been
made with respect to underweight children, infant, child and maternal mortality, measles
immunization, births attended by skilled personnel, improved water quality and sanitation
and access to essential drugs. However, there is a need to focus attention on perinatal

26
mortality. While there is no indigenous transmission of malaria, in most countries there
has been a resurgence of TB and an increase in HIV/AIDS.
On the whole, the epidemiology is changing from a picture of communicable disease to
one of non-communicable disease with heart disease, cancer, stroke and diabetes being
the leading causes of death. Barbados, for instance, has a very high incidence of diabetes
within its population. These conditions have common risk factors with the majority of
them being preventable. Along with the rise in non-communicable disease is the high
incidence in adult and child obesity.
8 Goal 7: Ensure Environmental Sustainability The economic well-being of the peoples of the region is heavily dependent on the
exploitation of the natural environment be it for tourism, agriculture or fisheries.
Degradation of the resources that facilitate these activities (marine and coastal
environment, land) will impact negatively on both the social and economic development
of the region. However, use of these resources must not conflict with attempts to
preserve biological diversity of individual islands. Already the clearing of the land since
early settlement has resulted in the loss of a substantial amount of biodiversity.
The goal of ensuring environmental sustainability consists of three targets and seven
indicators.
Target 1: Integrate the principles of sustainable development into country policies and
programmes and reverse the loss of environmental resources.
Indicator 1: Proportion of land area covered by forest.
To date, Dominica has by far the largest area of forest (66 percent). This figure
represents an increase in the forested area since 1991. An increase in forested area was
also recorded in Grenada from 14.7 percent in 1990 to 18 percent in 2000, while in St
Vincent, there was a loss of forest coverage. In Barbados, almost all of the original forest

27
cover was removed after 1827. The remaining wooded area represents about 20 percent
of total land area. An additional 5 percent exists as gully lands. Forested land is lost
because of the demand for settlement and space for infrastructure. Forests not only
contribute to biodiversity; they also play a role in soil and water conservation and have a
mitigating effect on climate.
Indicator 2: Land area protected to maintain biological diversity
Several governments in the OECS region have taken measures to earmark/protect land in
order to promote and maintain biological diversity. For instance, all governments with
the exception of the Montserrat government have increased the area of forest cover in
their respective countries. In Montserrat, the eruption of Soufriere Hills volcano in 1995
caused destruction to much of the forest and woodland cover. However, in 1997, 10
square kilometers of land were earmarked for the preservation of biological diversity.
In Barbados, from the time of settlement, the forested land and biological diversity which
it housed have been gradually lost through clearing for tobacco and sugar cultivation. At
present, plans are afoot to set aside land to maintain the remaining biological diversity.
Indicator 3: GDP per Unit of Energy Use
Antigua, Grenada and St Lucia have all recorded increases in GDP per unit of energy
over the period under investigation, with St Lucia recording the largest increase of all.
However, values for Dominica and Anguilla have also been decreasing. Values for St
Kitts have fluctuated. In Barbados, figures for carbon dioxide emissions per capita show
that the level moved from 4192 giga tonnes in 1990 to 3196 in 1996. A steady increase
has been recorded since then, and in 1998, this value stood at 5865 giga tonnes. While
increased values indicate greater usage of energy to stimulate economic growth through
industrial and construction activities, these activities also contribute to increased levels of
carbon dioxide, a greenhouse gas which contributes to global warming. Alternative
means should be explored as it is possible to achieve economic growth using less energy
and raw materials per unit of output.

28
Indicator 4: Carbon dioxide emission
Carbon dioxide emission levels have either increased slightly or remained constant over
the period throughout the Eastern Caribbean.
Target 2: Halve by 2015, the proportion of people without sustainable access to safe
drinking water
Indicator 5: Access to Improved Water Source
Except for Dominica with a slight increase and St Lucia with a moderate increase over
the 1990-2000 period, the other islands recorded access to piped water by well over 90
percent of households. In the case of Montserrat, a decline was recorded. This
development no doubt reflects the damage caused to the infrastructure as a result of the
Soufriere Hills volcano. In Barbados, data for 2000 show that 96.5 percent of households
had access to an improved water source or piped drinking water. This figure excludes
those households who have access to standpipes or water from a friend’s or neighbor’s
property or a well or spring.
Indicator 6: Proportion of people with Access to Improved Sanitation
Considerable improvement in the level of sanitation (i.e., access to water-borne toilet
facilities) from 50 percent to 96 percent was recorded in Antigua, St Kitts and St Vincent.
Only moderate improvements in sanitary facilities were recorded in Dominica and St
Lucia where the percentage of households with access to this type of facility in 1995 rose
from 36.8 and 38.4 percent, respectively, to 45.6 and 52.7 percent in 2001. In Barbados,
82 percent of households had water borne toilet facilities as a percentage of total private
households in 2000.
The availability of safe drinking water and the establishment of proper sanitation and
environmental hygiene are critical in the fight against diseases such as gastroenteritis in
children under five, salmonellosis and dengue fever. The prevalence rates of
salmonellosis across countries in the Eastern Caribbean indicate much fluctuation in the
disease. In the case of gastroenteritis, prevalence rates were particularly high for
Anguilla, Antigua, Montserrat, St Vincent and St Kitts. Gastroenteritis and salmonellosis

29
are water and food-borne illnesses. The sources of infection are contaminated food and
untreated water. The rise in prevalence rates for both diseases may be attributed to the
growing number of individuals who ‘eat out’ and the inability of the relevant authorities
to properly monitor food preparation and handling. In cases where no facilities exist for
the treatment of sewage and especially where water can easily become contaminated,
individuals may be placed at risk. This is particularly so in poor areas.
There has been a high prevalence rate of dengue fever. In 2001, there was an outbreak of
dengue fever in St Lucia. The prevalence rate of the disease was then ten-fold the 1996
prevalence rate. The fluctuating rates of these diseases show measures employed to keep
them under control are not being sustained. Greater efforts must be made by the relevant
authorities to upgrade facilities (toilet facilities, piped water and sewage treatment) in
under-privileged communities
Indicator 7: Access to Secure Tenure
Over sixty-five percent of households in the OECS, except for Montserrat and the British
Virgin Islands, are owner occupied. In the BVI and Montserrat, the percentages of
owner-occupied homes are 49.6 and 37.6 percent, respectively. Since these are British
dependent territories, the greater part of the land will reside in the hands of the Crown
and therefore not available for private ownership. In Barbados, about seventy-five
percent of households are owner-occupied. The government continues to encourage and
provide incentives and loans for low income earners to own their own homes.
In general, as individuals own their own homes, there is a tendency for them to take pride
in their surroundings. This reduces squatting and the resultant destruction of the
environment. Contamination of water resources is also reduced as home ownership is
confined to zones earmarked for such development.
The data indicate that the goals of halving the proportion of people without sustainable
access to safe drinking water and achieving significant improvement in the lives of at
least slum dwellers are achievable in the Eastern Caribbean by 2015.

30
9 Goal 8: A Global Partnership for Development
The achievement of the previous seven MDGs requires the cooperation of the
international community and also the strengthening of governance within countries. An
important aspect of the implementation program is the availability of finance and the
human capacity to manage the process. The eighth MDG is therefore a capstone goal and
forms the basis for achieving the other goals. In building a global partnership for
development, developing countries would be able to eradicate poverty and achieve
sustainable development over the development planning period 1990-2015. This
capstone goal involves the provision of official development assistance, the improvement
of access to markets (especially in developed countries), achieving debt sustainability, the
developing and implementation of strategies for decent and productive work for the
youth, the provision of access to affordable drugs and the distribution of the benefits of
new technologies to all countries.
The goal of a global partnership for development consists of seven targets and seventeen
indicators. Some of these targets and indicators are not applicable to the Eastern
Caribbean. For example, the countries of the Eastern Caribbean are not classified
amongst the ‘Least Developed Countries’, hence the target relating to special needs of
this group would not be applicable. Indeed, the countries of the Eastern Caribbean are
classified as ‘middle income countries’ by the international community. As small island
developing states, the Eastern Caribbean would however have a set of special needs
which have to be addressed at the regional and international levels.
Indicator 1: Official Development Assistance
Data on official development assistance were not readily available from a survey of
Eastern Caribbean countries. Over the years, however, these countries have received
some degree of financial assistance from developed countries (Canada, USA and UK) to
finance social infrastructural and other development projects. The countries of the
Eastern Caribbean are vulnerable to natural disasters – hurricanes, floods, volcanic
eruptions, landslides – and their disruptive effects have been greater than the resource

31
base of these countries [see Table 9.1]. Official development assistance is therefore
needed to help with the re-building process.
Table 9.1
Disaster Exposure in the Eastern Caribbean 1970-1999
Country
Disaster
Occurrence
Total
Fatalities per
1000 persons
(1995)
Economic Loss
as % of GDP
(1995)
Antigua/Barbuda 7 0.1 18.1
Dominica 7 0.6 55.0
Grenada 4 0.0 9.5
St Kitts/Nevis 7 0.2 116.5
St Lucia 8 0.3 272.3
St Vincent 9 0.04 26.5
Montserrat 5 3.4 899.0
Barbados 5 0.01 6.3
Source: C. Charveriat: Natural Disasters in Latin America and the Caribbean: An Overview
of Risk (IADB, Washington, October 2000), page 38
Indicator 2: Market Access
The ability to access the markets of developed countries and, in some cases, those of
developing countries is an element in generating economic growth and reducing poverty
in the Eastern Caribbean. Empirical evidence on the growth process in small developing
countries points to the critical role of exports expansion in the process. Eastern
Caribbean Countries have been signatories to several bilateral and multilateral
agreements which contain provisions for market access: CARICAN, CBI, EU-ACP,
CARICOM. In many cases, these countries have been unable to take full advantage of
these agreements primarily due to supply capacity constraints. The exports of the Eastern
Caribbean are highly concentrated – bananas, sugar and tourism. The manufacturing
sector, which can benefit from these agreements, is very small.

32
Data for Antigua in 1999 indicate that approximately 90 percent of its total exports are
admitted free of duties and quotas to other countries. In the case of tariff rates, Antigua
reports that the average tariff on agricultural products was 25 percent over the 1995-2001
period, while there was a decline in the average tariff on textiles and clothing from 30
percent in 1995 to 15 percent in 2001. Anguilla allows agricultural products to enter the
country duty-free, while the average tariff on textile and clothing was 15 percent over the
1990-2001 period.
With the process of trade liberalization within the WTO and the proposed FTAA, it is
expected that tariff rates for most commodities would decline in the Eastern Caribbean.
The key aspect of the trade negotiations is to achieve enhanced market access in
developed countries for commodities from the Eastern Caribbean.
Indicator 3: Debt Sustainability
A high debt burden can restrict the ability of countries to achieve important development
goals. It is therefore important for the small developing countries in the Eastern
Caribbean to maintain a debt profile that is sustainable in the medium and long terms.
The countries of the Eastern Caribbean are not members of the group of Heavily Indebted
Poor Countries (HIPC) and therefore debt cancellation is not an option.
In general, the debt service ratios (debt service as a percentage of total exports) of the
Eastern Caribbean countries are relatively low (under 10 percent) [see Figure 9.1]. There
was however a slight upward trend in several countries during the 1990s. This can be
partly attributed to the problems associated with export markets over the past decade.

33
Figure 9.1
Debt Service Ratio for the Eastern Caribbean, 1990, 1995, 2001
0
5
10
15
20
Anguilla
Antigua/Bar
Dominica
Grenada
Montserra
t
St Kitts
St Lucia
St Vin/Gren
Barbados
Country
Rat
io
1990
1995
2001
Indicator 4: Unemployment Rate of 15-24 Year Olds
One of the targets associated with the promotion of a global partnership for development
is design and implementation of strategies to provide decent and productive work for the
youth. In the Eastern Caribbean, labour market data indicate a high incidence of
unemployment among the young cohorts of the labour force (15-24 years). In 1990, the
unemployment rate among the 15-24 year olds ranged from 7.5 percent in the BVI to 36
percent in St Vincent. Recent evidence suggests that there has not been much change in
the high rate of youth unemployment. Barbados was able to reduce its youth employment
rate from 42.7 percent in 1992 to 18.5 percent in 2000. This reflects the general
downward trend in overall unemployment in the country. There is however a general
observation in the region that the youth unemployment rate has a tendency to fall more
slowly than the overall unemployment rate. This may be due to the lack of work
experience at such an early stage of working life as well as the existence of job queuing
for existing job openings. The existence of social networks and household sharing
mechanism, along with informal working activity helps to ease the burden of high levels
of youth unemployment.

34
The creation of employment for the youth will therefore be a major development
challenge over the development period 1990-2015. Several counties in the region have
used skills-training and other educational innovation to enhance the supply side of the
youth labour market. However, the problem would only be fully resolved when more
attention is paid to the demand-side (job creation) of the labour market.
Indicator 5: Proportion of the Population with Access to Affordable Essential Drugs
on a Sustainable Basis
In addition to education and training, the provision of health care is an important element
of human resources development. Many citizens of developing countries are unable to
overcome medical/health problems because of a lack of access to essential drugs. As part
of the global partnership for development, countries are seeking to cooperate with
pharmaceutical companies to provide access to affordable, essential drugs for those
persons in developing countries.
The available data for the Eastern Caribbean indicate that the proportion of the
population with access to affordable and essential drugs is very high, that is, over 80
percent during the 1990s. Barbados and Montserrat achieved a rate of 100 percent by
2001. Barbados has pioneered the established of a National Drug Service which has
become a model for other developing countries. The Service provides formulary drugs
free of cost to persons aged 65 and over, children under 16 and those persons requiring
drugs for the treatment of cancer, diabetes or hypertension.
Indicator 6: Telephone Lines and Personal Computers per 1000 People
Access to the benefits of new developments in information and communications
technologies (ICTs) has been perceived as one of the ways that poverty can be reduced.
ICTs can assist with poverty reduction through the provision of information to social
services (health, education, skill training), the development of micro and small
enterprises, and the transmission of information about the plight of the poor. At present,
there is unequal access to ICTs across the world, that is, the so-called ‘digital divide’. A
program of global cooperation for development can help to reduce this digital divide thus

35
ensuring that all countries benefit from developments in ICTs in the form of international
public ‘good’.
In the Eastern Caribbean, the access to telephone main lines, mobile phones and personal
computers per 1000 persons is still relatively low [see Figures 9.2, 9.3 and 9.4]. The
figures however show a growth in access as the telecommunications market in the
Eastern Caribbean is gradually liberalized. Some countries have removed taxes from
computers in order to enhance their use for both personal and business purposes. The
low values for these variables do not mean that persons cannot access these facilities
since a high degree of sharing takes place within and among households. In addition,
persons without their telephone lines or computers can always access public facilities (for
example, pay phones and community centres).
Figure 9.2
Access toTelephone Lines in the Eastern Caribbean 1995, 2000
0100200300400500600
Antigua/
Bar
Dominica
Grenada
St Kitts
/Nev
is
St Lucia
St Vincen
t/Gre
Barbad
os
Country
Num
ber
of T
elep
hone
Lin
es
19952000

36
Figure 9.3
Access to Mobile Phones in the Eastern Caribbean 1995, 2000
050
100150200250300350
Antigua/
Bar
Dominica
Grenada
St Kitts
/Nev
is
St Lucia
St Vincen
t/Gren
Barbad
os
Country
Num
ber
of P
hone
s
19952000
Figure 9.4
Access to Personal Computers in the Eastern Caribbean 1995, 2000
020406080
100120140160180200
Antigua/
Bar
Dominica
Grenada
St Kitts
/Nev
St Lucia
St Vincen
t/Gre
Barbad
os
Year/Country
Pers
onal
com
pute
rs p
er 1
000
pers
ons
19952000

37
Indicator 7: Reduction of Crime and Terrorism
An increase in criminal activity and terrorism can derail efforts to reduce international
poverty. In recent years, countries have added two additional goals to the set of MDGs:
i. to intensify efforts to fight transnational crime in all its dimensions including drug
trafficking, the smuggling of human beings and money laundering;
ii. to take concerted action against international terrorism and to accede as soon as
possible to all the relevant conventions.
The available data on the crime situation in the Eastern Caribbean point to the following
conclusions:
i. a general increase in criminal activity during the 1990s
ii. the majority of crimes were those against property (thefts, burglaries) and various
miscellaneous offences
iii. a relative constancy of crime against persons
iv. a relative low murder rate (generally less than 15 per 100,000 persons)
v. an increase in the number of drug offences especially among the youth (especially
for cannabis and cocaine)
Little data exist in the region on such aspects as the prevalence of drug abuse among
school children and the number of persons receiving treatment for substance abuse.
Anecdotal evidence suggests that the drug trade has increased in the region. There is no
evidence of terrorism in the Eastern Caribbean.
10 Overall Assessment for the Eastern Caribbean
An assessment of the degree of progress with the MDGs in the Eastern Caribbean can be
undertaken at two levels: the policy level and the data collection level.
At the policy level, the assessment needs to take into consideration the extent to which
the goals have been incorporated into plans, policies and programs in the various
countries. Although the goals have been under discussion since the mid 1990s, they were

38
not fully adopted until the year 2000. In effect, countries that did not formulate their
development plans/programs in the late 1990s would not have explicitly incorporated the
MDGs into these plans/programs. In the context of the Eastern Caribbean, development
planning has not been a regular exercise. Greater concern was placed on macroeconomic
short-run policy matters during the 1990s. The OECS has formulated a Development
Strategy which covers several of the variables (although not targets/indicators) specified
in the UN’s MDGs. The key element of the OECS Development Strategy is the
promotion of human development in the context of global change. This issue is further
developed in the OECS Human Development Report 2002, which has as its theme
‘building competitiveness in the face of vulnerability’.
In the case of Barbados, the last development plan covered the period 1993 to 2000 with
the theme ‘prosperity through increased productivity’. Although these strategy and
planning documents have not addressed the MDGs, several initiatives which are related
to the goals have taken place in the region. For example, poverty assessments have been
undertaken to determine the extent of poverty and to identify policy measures to reduce
the extent of poverty. Several human resource development initiatives (health, nutrition,
education, training) have been undertaken to assist with poverty reduction. For example,
in St Lucia, the Government has established a Poverty Reduction Fund, a micro-finance
institution, a National Skills Development Centre and a Basic Needs Fund to assist in the
reduction of poverty. Barbados has also set up a Social Investment Fund, a poverty
alleviation program and rural and urban development commissions. Bureaus/desks of
gender affairs have also been established and there has been an ongoing concern with
sustainable development. In effect, some progress has been made with the achievement
of the MDGs in the Eastern Caribbean.
The weakest aspect of the progress towards the achievement of the MDGs is the process
of data collection on the indicators. Since the MDGs have not been explicitly
incorporated in planning documents in quantitative for in the region, there has not been
the pressure to collect data to accurately reflect the various variables (via
surveys/censuses or administrative records). The data collection survey undertaken for

39
this report indicates a significant quantity of missing data, inconsistent definitions and
several anomalies. These problems suggest that the quantitative indicators for the targets
associated with the MDGs have not permeated government departments and statistical
offices. Much of the data has been obtained from one-off surveys and the decennial
population census. In many respects governments are formulating policies and programs
with evidence (data) – the science of muddling through.
There is a need to relate policy design and analysis with data collection in the region. It
would not be incorrect to say that the achievement of the MDGs has not infused policy
making in the Eastern Caribbean. Indeed, there has been little reference to the goals in
ministerial statements and policy documents. There is need for greater advocacy on the
part of the United Nations for the incorporation of the MDGs in national/regional
planning and policy processes. One approach would be to develop a Balanced Scorecard
for Poverty Eradication which would see the goals/targets/indicators linked in a cause-
effect manner. Such an idea has been developed for companies which are strategy-
focused and performance-oriented.
Although the planning/policy frameworks and the data collection processes in the Eastern
Caribbean have not been designed to reflect the MDGs, the available data can provide
some idea of the extent to which progress is being made with respect to the achievement
of the MDGs [see Table 10.1].
In summary, aspects of the global partnership for development are achievable. For
example, debt sustainability, access to affordable essential drugs and control of crime and
terrorism. However, greater effort is needed in the area of official development
assistance, market access for exports from the region and the provision of productive
employment for the youth and the distribution of the benefits from information
communication technology (ICT).

40
Table 10.1
Progress with the Achievement of the MDGs in the Eastern Caribbean
Goal 1: Eradication of Extreme Poverty and Hunger
Extreme poverty and hunger in the Eastern Caribbean is very low. The countries of the
region can achieve this goal by 2015
Goal 2: Achievement of Universal Primary Education
The Eastern Caribbean countries have almost achieved universal primary education. This
goal is achievable by 2015.
Goal 3: Promotion of Gender Equality and Empowerment of Women
This goal has been achieved in terms of education and employment. In terms of the
indicator on political achievement, a lot of progress has to be made. It may be difficult to
attain higher political involvement value by the year 2015.
Goal 4: Reduction in Child Mortality
At present there is much fluctuation in the under-five mortality rates but the goal of
reducing this rate by two-thirds by 2015 is achievable once enough effort is made to
sustain the gains that have already been achieved.
Goal 5: Improvement in Maternal Health
Significant progress has been made in this area and the goal has been achieved in several
countries in the Eastern Caribbean. This goal is definitely achievable by the remaining
countries by 2015.
Goal 6: Reduction in HIV/AIDS and Other Diseases
The achievement of this goal presents a major challenge for the Eastern Caribbean. The
goal can be achieved by the year 2015 only if greater effort and resources are expended in
the areas of HIV/AIDS education and prevention strategies.

41
Goal 7: Ensure Environmental Sustainability
Some degree of progress has been made with respect to the achievement of this goal.
However, for the goal to be fully achieved by 2015, a number of measures must be
instituted, namely:
i. measures implemented to alleviate poverty
ii. provision of adequate infrastructure
iii. education to increase awareness with respect to environmental issues
iv. enforcing legislation to reduce/prevent damage to the environment
Goal 8: Promotion of a Global Partnership for Development
There is slow progress in the area of developing a global partnership for development
especially in the areas of market access, provision of development assistance, the
distribution of the benefits of information technology. Rich countries need to take action
in these areas to enable poorer countries to achieve goals 1 to 7. .
Poor countries will also need to adjust their internal structures and policies in order to
enhance their own development. A significant amount of effort will therefore be needed
to achieve this goal by 2015.
11 Conclusion This report has provided an assessment of the progress towards the achievement of the
MDGs within the Eastern Caribbean (Barbados and the OECS). The collection of data
for several of the indicators over the 1990s proved to be a significant challenge. In
several cases, a time trend could not be observed due to the inadequacy of the data. Data
were non-existent for several of the indicators. At the policy and planning levels, the
MDGs have not been explicitly incorporated in documents and in actions. Given the
availability of resources and the issues of the day, the Eastern Caribbean countries have
been selective in the development policy goals. Poverty reduction, economic growth and
sustainable development have been the main developmental goals.

42
An assessment of the MDGs indicates that some degree of progress has been made with
respect to the achievement of some of the goals: reduction of extreme poverty and
hunger, universal primary level education, gender equality and improved maternal health.
Some degree of effort would be needed for the other goals to be fully achieved by the
year 2015. One approach would be the development of a Balanced Scorecard for Poverty
Reduction which would link the goals in a systematic manner and provide critical success
factors needed for strategy formulation and goal achievement. This Scorecard can
therefore be used in national strategic development plans in the region.
Selected References
1 ECLAC (2001): Quality of Life: A Compendium of Social Statistics of Five
Caribbean Countries (1995-2001) (Port-of-Spain, Sub-Regional Headquarters for
the Caribbean).
2 Handwerker W P (1998): Why Violence? A Test of Hypotheses Representing
Three Discourses on the Roots of Domestic Violence, Human Organization, Vol
57, No 2, pp 200-208.
3 IADB (1998): Poverty and Income Distribution in Barbados 1996-1997
(Economic and Sector Study Series, Region 3, RE3-98-010, October,
Washington, DC).
4 OECS (2002): OECS Human Development Report 2002: Building
Competitiveness in the Face of Vulnerability (St Lucia, OECS, OECS
Secretariat).
5 UNDP (2000): Sub-Regional Common Assessment of Barbados and the OECS
(Bridgetown, Barbados, January).
6 Saptigiri L (2002): “Poverty and Income Distribution in Barbados (2001-02)”
(Commonwealth Secretariat/Ministry of Social Transformation, Barbados).

43
Appendix 1
Eastern Caribbean’s Progress Towards the MDGs: Status at a Glance

44
Appendix 1: Eastern Caribbean’s Progress towards the MDGs
Status at a Glance+ Goals Will developmental goal
be reached?
Status of supportive
environment
Extreme Poverty Halve the proportion of people living below the poverty line
Probably potentially unlikely lack of data
Strong fair weak but improving weak
Hunger Halve the proportion of people who suffer from hunger between 1990 and 2015
Probably potentially unlikely lack of data
Strong fair weak but improving weak
Universal Primary Education Ensure that by 2015 children everywhere, boys and girls alike, will be able to complete a full course of primary schooling
Probably potentially unlikely lack of data
Strong fair weak but improving weak
Gender Equity Achieve equal access for boys and girls to primary and secondary schooling by 2015
Probably potentially unlikely lack of data
Strong fair weak but improving weak
Child Mortality Reduce under-five mortality by two-thirds by 2015
Probably potentially unlikely lack of data
Strong fair weak but improving weak
Maternal Health Reduce maternal mortality ratio by three-quarters by 2015
Probably potentially unlikely lack of data
Strong fair weak but improving weak
HIV/AIDS Halt and reverse the spread of HIV/AIDS by 2015
Probably potentially unlikely lack of data
Strong fair weak but improving weak
Malaria and Other Major Diseases Halt and reverse the incidence of malaria and other diseases by 2015
Probably potentially unlikely lack of data
Strong fair weak but improving weak
Environmental Resources
Reverse loss of environmental resources
Probably potentially unlikely lack of data
Strong fair weak but
improving weak
Access to Safe Drinking Water
Halve the proportion of people without
access to safe drinking water
Probably potentially unlikely lack of data
Strong fair weak but
improving weak
Note: +The achievement of a specific goal and status of the corresponding supportive environment is
highlighted in red.

45
Appendix 2
Statistical Data

46
Table 1
Proportion of Population Living below $1 per day
Country
Year
Proportion of
Population living
below US $1 a day
%
Grenada 1999 4.7
St Lucia 1995 2.97
St Vincent 1996 5.55
Source: Data Collection Survey
Table 2
Poverty Gap Ratio
(% of population)
Country
Year
Poverty Gap
Ratio %
Anguilla 2001/2002 6.9
Barbados 1997 2.3
BVI 2002 4.1
Dominica 2002 10.2
Grenada 1998 15.3
St Kitts 1999/2000 2.8
Nevis 1999/2000 2.8
St Lucia 1995 8.6
St Vincent 1996 12.6
Source: Caribbean Development Bank

47
Table 3
Share of Poorest Quintile in National Consumption
Country Year Share
Anguilla 2001/2001 35
Dominica 2001 40
Grenada 1999 32.1
St Kitts 1999 31.3*
St Lucia 1995 25.1
St Vincent 1996 37.5 Note: *derived from an average of 30.5 for St Kitts and 32.1 for Nevis
Table 4a
Literacy Rates in the Eastern Caribbean
Country Year Male Female Total
Anguilla 1992 72.8 77.9 75.4
Antigua 1991 87.4 85.9 84.4
BVI 1991 97.8 98.2 95.7
Dominica 1993 + + 96.4
Grenada 1991 93.7 95.1 94.4
Montserrat 1996 91.1 95.7 94.2
St Kitts & Nevis 1991 98.2 97.4 97.8
St Lucia 1991 +. + 90,2
St Vincent 1991 88.2 89.5 88.8
Notes: + not available
Source: OECS (2002)

48
Table 4b
Literacy Rates among 15-24 year olds in the
Eastern Caribbean
Country Year Male Female Total
Antigua 1990 75.9 69.9 69.9
St Kitts and Nevis 1990 98.9 97.4 97.8
1990 94.7 97.5 96.1
St Lucia 2001 94.8 95.9 95.3
British Virgin Islands 1990 98.7 99.7 99.2
1990 97.9 96.4 97.2
Barbados 2001 + + 97.0
Notes: + not available
Table 5
Ratio of Girls to Boys at Different Levels of Education in the
Eastern Caribbean 1990 to 2001 Country Year Primary Secondary Tertiary
Anguilla 1990 1.02 1.14 +
2001 0.96 1.04 +
Antigua 1990 0.97 1.01 +
2001 0.91 1.29 +
Dominica 1995 0.92 1.39 1.50
2001 0.88 1.20 2.0
Grenada 1995 0.88 1.42 1.18
2000 0.90 1.33 1.01
St Kitts/Nevis 1991 0.94 1.02 1.16
2000 0.95 1.03 2.21
St Lucia 1990 0.94 1.27 1.83
1999 0.93 1.63 +
BVI 1990 0.89 1.13 +
1998 0.96 0.88 +
Montserrat 1990 0.90 0.48 +
1998 0.78 0.89 +
St Vincent 1990 0.91 1.50 1.81
2001 0.90 1.37 1.50
Barbados 1990 0.97 1.13 1.20
2001 0.97 0.97 1.55
Notes: + not available

49
Source: Data Collection Survey
Table 6
Share of Women in Wage Employment
in the Non-Agricultural Sector in the Eastern
Caribbean 1990-2001
Country Year Percent 1990 42.1 Anguilla 2001 47.6
Antigua 1990 47.7 1990 43.3 Dominica 1999 44.2
Grenada 1990 40.0 Montserrat 1990 43.4
1995 48.6 St Lucia 1999 50.3
St Kitts and Nevis 1990 47.1 St Vincent 1990 39.9
1991 45.3 Barbados 2001 47.7
Source: Data Collection Survey
Table 7
Proportion of Seats Held by Women in the National
Parliament 1990-2001 Country Year Percentage Antigua 1990 2.8 2001 11.1 Dominica 1992 5.0 2000 14.3 Grenada 1990 10.0 2001 17.0 Montserrat 1990 30.8 2000 30.0 St Lucia 1992 16.7 2000 17.4 St Kitts 1992 1.0 1996 13.3 St Vincent 1992 2.0 1996 10.5 Barbados 1990 4.0 2001 11.0
Source: OECS (2002) and Data Collection Survey

50
Table 8
Under Five Mortality Rate in the Eastern Caribbean, 1990-2001 Country 1990 1995 1997 1998 2001
Anguilla 18.9 18.0 5.9 0.0 +
Antigua 27.2 20.0 18.0 13.9 21.2
Dominica 16.8 20.7 18.7 16.2 +
Grenada - 7.4 17.3 22.2 21.1
St Lucia 24.6 14.0 20.9 19.7 15.8P
British Virgin Islands - - 5.8 18.0 +
St Vincent/Grenadines 26.6 19.1 24.7 28.3 +
St Kitts 33.1 25.1R 25.1 34.7 20.0
Barbados 14.4 23.0 15.4 12.0 18.0
Note: + Not available; R revised; P provisional;
Source: Data Collection Survey
Table 9
Infant Mortality Rate, reported (less than 1 year)
1990, 1998-2001
Country 1990 1998 1999 2000 2001 Anguilla + + + 5.2 + Antigua and Barbuda 20.6 12.5 + 22.3 + Barbados 14.5 11 12.8 13.4 + Dominica 18.4 14.5 13.7 18 + Grenada 14.7 19.5 + 14.3 + Montserrat + + + + = St Kitts and Nevis 26.1 + 13.9 14.3 + Saint Lucia 18.1 + 15.0 15.0 12 St Lucia and the Grenadines 21.1 17.2 24.2 15.7 19.2 Virgin Islands (UK) + 10.8 9.5 9.2 +
Notes: + not available = less than zero Source: PAHO/WHO Country Representation, based on country information 2000

51
Table 10
Proportion of under-1 vaccinated against measles, Eastern Caribbean
1998-2001
Country 1998 1999 2000 2001 Anguilla 96 99 100 92 Antigua and Barbuda 99 99 90 96 Barbados 97 86 94 + Dominica 98 99 100 99 Grenada 97 94 92 99 Montserrat 99 99 100 89 St Kitts and Nevis 99 99 100 94 St Lucia 90 95 89 + St Vincent and the Grenadines 99 87 96 98 Virgin Islands (UK) 99 92 100 99
Notes: * Less than zero Source: PAHO/WHO Country Representation, based on country information.
Table 11
Proportion of deliveries attended by trained personnel
1998-2001
Country 1998 1999 2000 2001
Anguilla + + 100 + Antigua and Barbuda 100 + 99.9 100 Barbados + 91 98 + Dominica 95 99.9 100 + Grenada 100 99 100 + Montserrat + + + 98 St Kitts and Nevis 99.4 + 99.4 + St Lucia + + 100 + St Vincent and the Grenadines 98 99.3 100 100 Virgin Islands (UK) 100 100 100 +
Notes: + Not available Source: PAHO/WHO Country Representation, based on country information

52
Table 12a
Reported Cases of Tuberculosis (All Forms)
1996 - 2002
Country 1996 1998 2000 2002 Anguilla + + + + Antigua and Barbuda 6 4+ 2 2 Barbados 9 15 6 4 Virgin Islands (UK) 2 1 1 2 Dominica 6 8 1 4 Grenada 0 2 1 0 Montserrat 0 2 0 0 St Lucia* 22 17 9 14 St Kitts and Nevis 2 3 0 0 St Vincent and the Grenadines 1 5 13 10 Total 48 57 33 36 Notes: + Not available
* Priority country
Source: CAREC
Table 12b
New Smear Positive Cases (DOTS) 1993-2001
Number of cases
Country 1993 1995 1997 1999 2001 Anguilla + 0 0 + 0 Antigua and Barbuda + 0 + 1 1 Barbados + 3 5 2 6 Virgin Islands (UK) + + 0 + 0 Dominica 6 5 5 + + Grenada 0 2 1 3 + Montserrat + + + 2 0 St Kitts and Nevis 2 4 + 2 0 St Lucia + 11 14 9 6 St Vincent and the Grenadines 11 5 2 4 3 Notes: + not available Source: Global TB Control, WHO Report, 2003

53
Table 13
Debt Service Ratios for the Eastern Caribbean 1990-2001 (%)
Country 1990 1995 2001 Anguilla 1.0 1.4 1.7 Antigua 3.9 3.6 4.1 Dominica 5.7 6.7 7.5 Grenada 4.1(a) 7.4 6.0 Montserrat 2.6 1.7 0.6 St Kitts 3.6(a) 5.3 13.7 St Lucia 3.0(a) 2.9 10.1 St Vincent 2.8 4.8 6.6 Barbados 14.4 7.0 6.3
Notes: (a) refers to 1991
Table 14 Access to Telephones and Personal Computers
in the Eastern Caribbean Telephone Mainlines per 1000 persons
Mobile Phones per 1000 persons
Personal Computers per 1000 persons
Country
1995 2000 1995 2000 1995 2000 Antigua/Barbuda 388 499 - 287 - - Dominica 241 294 0 16 - 71.3 Grenada 260 332 4 46 - 127.1 St Kitts/Nevis 363 569 - 31 - 181.7 St Lucia 210 313 7 16 0.6 141.0 St Vincent 165 220 2 21 - 105.8 Barbados 345 437 18 111 57.5 82.2
Source: World Bank: ICT at a Glance