Embed Size (px)
Citation preview
355 14TH SINKHOLE CONFERENCE NCKRI SYMPOSIUM 5
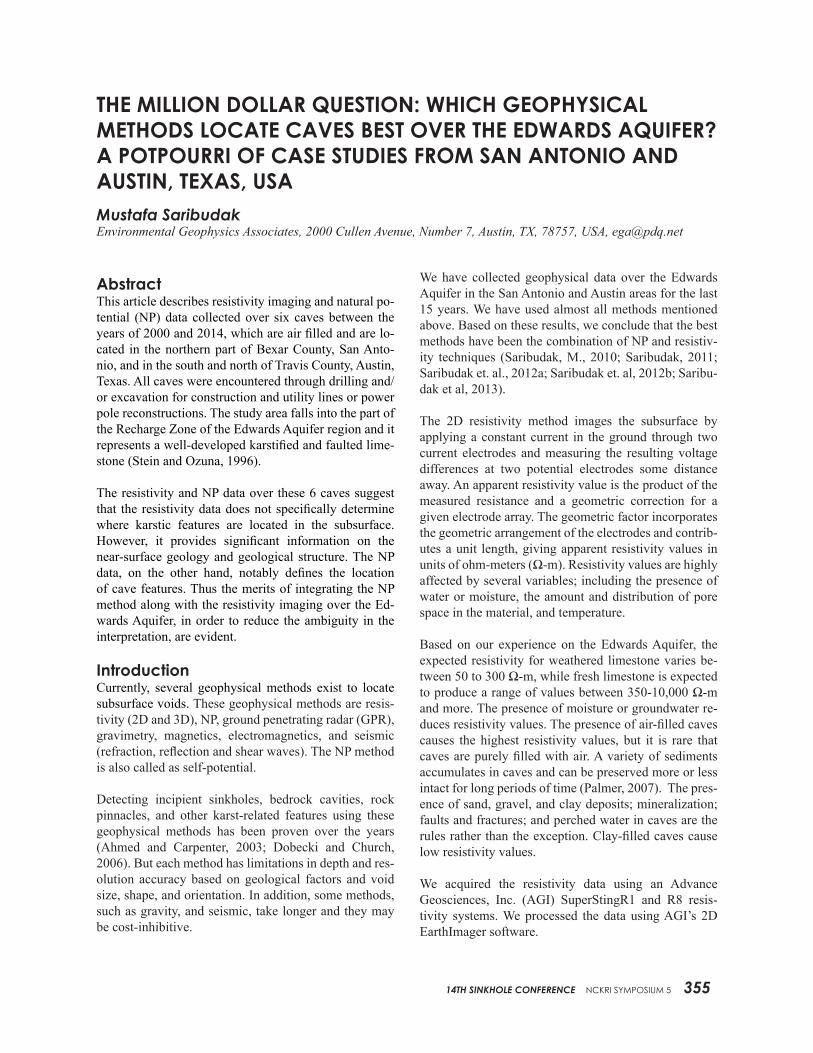
THE MILLION DOLLAR QUESTION: WHICH GEOPHYSICAL METHODS LOCATE CAVES BEST OVER THE EDWARDS AQUIFER? A POTPOURRI OF CASE STUDIES FROM SAN ANTONIO AND AUSTIN, TEXAS, USA
AbstractThis article describes resistivity imaging and natural po-tential (NP) data collected over six caves between the years of 2000 and 2014, which are air filled and are lo-cated in the northern part of Bexar County, San Anto-nio, and in the south and north of Travis County, Austin, Texas. All caves were encountered through drilling and/or excavation for construction and utility lines or power pole reconstructions. The study area falls into the part of the Recharge Zone of the Edwards Aquifer region and it represents a well-developed karstified and faulted lime-stone (Stein and Ozuna, 1996).
The resistivity and NP data over these 6 caves suggest that the resistivity data does not specifically determine where karstic features are located in the subsurface. However, it provides significant information on the near-surface geology and geological structure. The NP data, on the other hand, notably defines the location of cave features. Thus the merits of integrating the NP method along with the resistivity imaging over the Ed-wards Aquifer, in order to reduce the ambiguity in the interpretation, are evident.
IntroductionCurrently, several geophysical methods exist to locate subsurface voids. These geophysical methods are resis-tivity (2D and 3D), NP, ground penetrating radar (GPR), gravimetry, magnetics, electromagnetics, and seismic (refraction, reflection and shear waves). The NP method is also called as self-potential.
Detecting incipient sinkholes, bedrock cavities, rock pinnacles, and other karst-related features using these geophysical methods has been proven over the years (Ahmed and Carpenter, 2003; Dobecki and Church, 2006). But each method has limitations in depth and res-olution accuracy based on geological factors and void size, shape, and orientation. In addition, some methods, such as gravity, and seismic, take longer and they may be cost-inhibitive.
We have collected geophysical data over the Edwards Aquifer in the San Antonio and Austin areas for the last 15 years. We have used almost all methods mentioned above. Based on these results, we conclude that the best methods have been the combination of NP and resistiv-ity techniques (Saribudak, M., 2010; Saribudak, 2011; Saribudak et. al., 2012a; Saribudak et. al, 2012b; Saribu-dak et al, 2013).
The 2D resistivity method images the subsurface by applying a constant current in the ground through two current electrodes and measuring the resulting voltage differences at two potential electrodes some distance away. An apparent resistivity value is the product of the measured resistance and a geometric correction for a given electrode array. The geometric factor incorporates the geometric arrangement of the electrodes and contrib-utes a unit length, giving apparent resistivity values in units of ohm-meters (Ω-m). Resistivity values are highly affected by several variables; including the presence of water or moisture, the amount and distribution of pore space in the material, and temperature.
Based on our experience on the Edwards Aquifer, the expected resistivity for weathered limestone varies be-tween 50 to 300 Ω-m, while fresh limestone is expected to produce a range of values between 350-10,000 Ω-m and more. The presence of moisture or groundwater re-duces resistivity values. The presence of air-filled caves causes the highest resistivity values, but it is rare that caves are purely filled with air. A variety of sediments accumulates in caves and can be preserved more or less intact for long periods of time (Palmer, 2007). The pres-ence of sand, gravel, and clay deposits; mineralization; faults and fractures; and perched water in caves are the rules rather than the exception. Clay-filled caves cause low resistivity values.
We acquired the resistivity data using an Advance Geosciences, Inc. (AGI) SuperStingR1 and R8 resis-tivity systems. We processed the data using AGI’s 2D EarthImager software.
Mustafa SaribudakEnvironmental Geophysics Associates, 2000 Cullen Avenue, Number 7, Austin, TX, 78757, USA, [email protected]
356 NCKRI SYMPOSIUM 5 14TH SINKHOLE CONFERENCE
Natural electrical currents occur everywhere in the sub-surface. In seepage or cave investigations, we are con-cerned with the unchanging or slowly varying direct currents (D.C.) that give rise to a surface distribution of NPs due to the flow of groundwater within permeable materials. Differences of potential are most common in the millivolts range and can be detected using a pair of non-polarizing copper sulfate electrodes and a sensitive measuring device (i.e. a voltmeter or potentiometer). It should be noted that water movement should be pres-ent within or surrounding a cave in order to determine a void or cave location. Positive and negative NP values are attributed to changes in the flow conditions and the resistivity distribution of the subsurface. The source of NP anomalies can be also due to changes in topography, soils and rock conditions. It should be noted that NP measurements made on the surface are the product of electrical current due to groundwater flow and the sub-surface resistivity structure. The NP anomalies do not provide information on the depth of their sources.
There is no commercially available NP geophysical in-strument in the geophysical market. For this reason, we developed a NP system to locate karstic features. We processed the NP data using Geosoft Oasis Montaj Map-ping software.
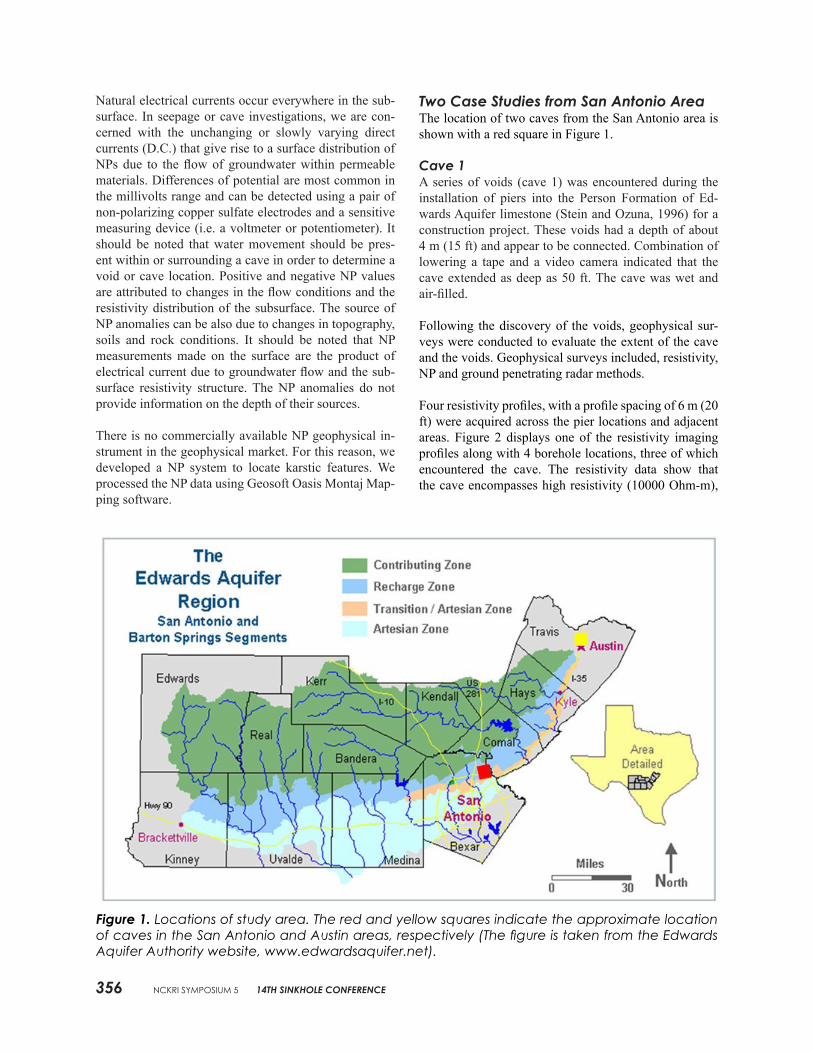
Two Case Studies from San Antonio AreaThe location of two caves from the San Antonio area is shown with a red square in Figure 1.
Cave 1 A series of voids (cave 1) was encountered during the installation of piers into the Person Formation of Ed-wards Aquifer limestone (Stein and Ozuna, 1996) for a construction project. These voids had a depth of about 4 m (15 ft) and appear to be connected. Combination of lowering a tape and a video camera indicated that the cave extended as deep as 50 ft. The cave was wet and air-filled.
Following the discovery of the voids, geophysical sur-veys were conducted to evaluate the extent of the cave and the voids. Geophysical surveys included, resistivity, NP and ground penetrating radar methods.
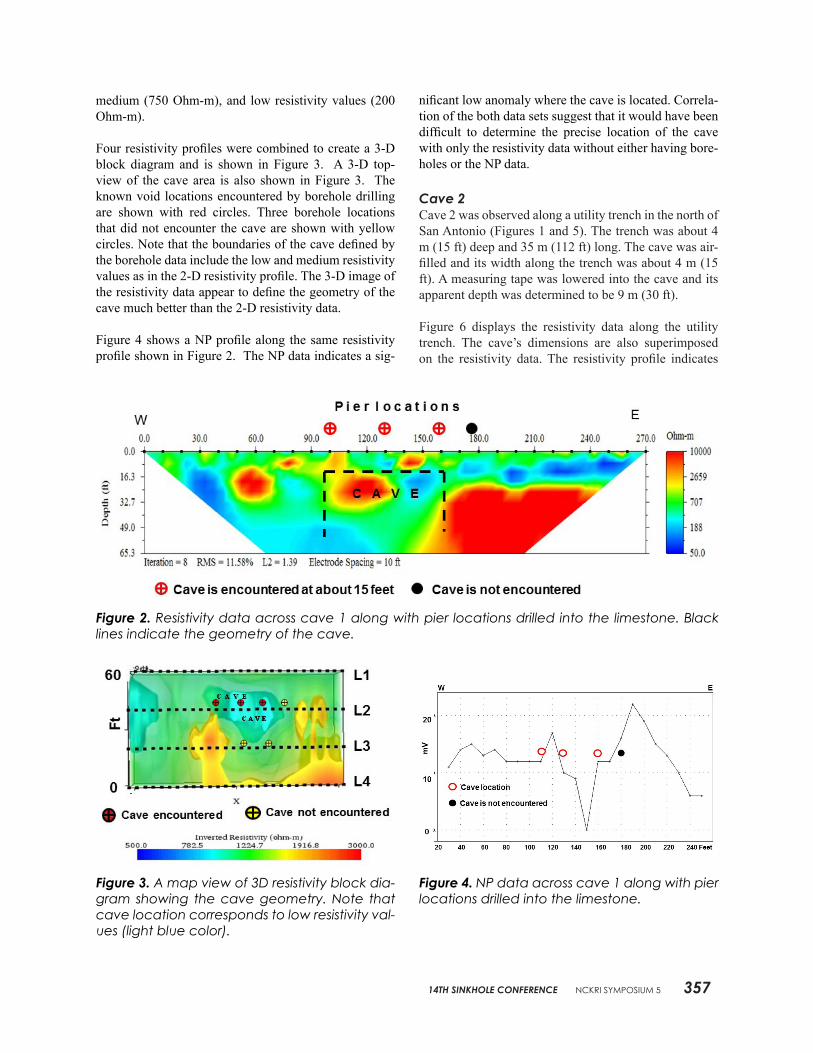
Four resistivity profiles, with a profile spacing of 6 m (20 ft) were acquired across the pier locations and adjacent areas. Figure 2 displays one of the resistivity imaging profiles along with 4 borehole locations, three of which encountered the cave. The resistivity data show that the cave encompasses high resistivity (10000 Ohm-m),
Figure 1. Locations of study area. The red and yellow squares indicate the approximate location of caves in the San Antonio and Austin areas, respectively (The figure is taken from the Edwards Aquifer Authority website, www.edwardsaquifer.net).
35714TH SINKHOLE CONFERENCE NCKRI SYMPOSIUM 5
medium (750 Ohm-m), and low resistivity values (200 Ohm-m).
Four resistivity profiles were combined to create a 3-D block diagram and is shown in Figure 3. A 3-D top-view of the cave area is also shown in Figure 3. The known void locations encountered by borehole drilling are shown with red circles. Three borehole locations that did not encounter the cave are shown with yellow circles. Note that the boundaries of the cave defined by the borehole data include the low and medium resistivity values as in the 2-D resistivity profile. The 3-D image of the resistivity data appear to define the geometry of the cave much better than the 2-D resistivity data.
Figure 4 shows a NP profile along the same resistivity profile shown in Figure 2. The NP data indicates a sig-
nificant low anomaly where the cave is located. Correla-tion of the both data sets suggest that it would have been difficult to determine the precise location of the cave with only the resistivity data without either having bore-holes or the NP data.
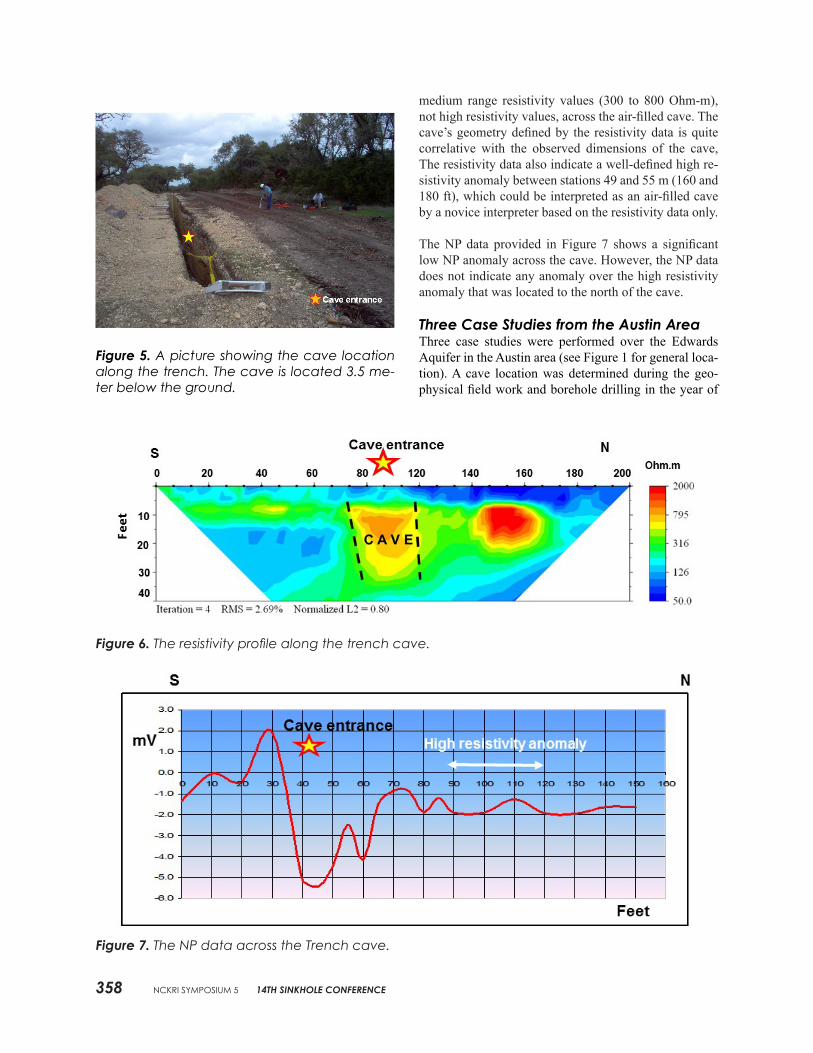
Cave 2Cave 2 was observed along a utility trench in the north of San Antonio (Figures 1 and 5). The trench was about 4 m (15 ft) deep and 35 m (112 ft) long. The cave was air-filled and its width along the trench was about 4 m (15 ft). A measuring tape was lowered into the cave and its apparent depth was determined to be 9 m (30 ft).
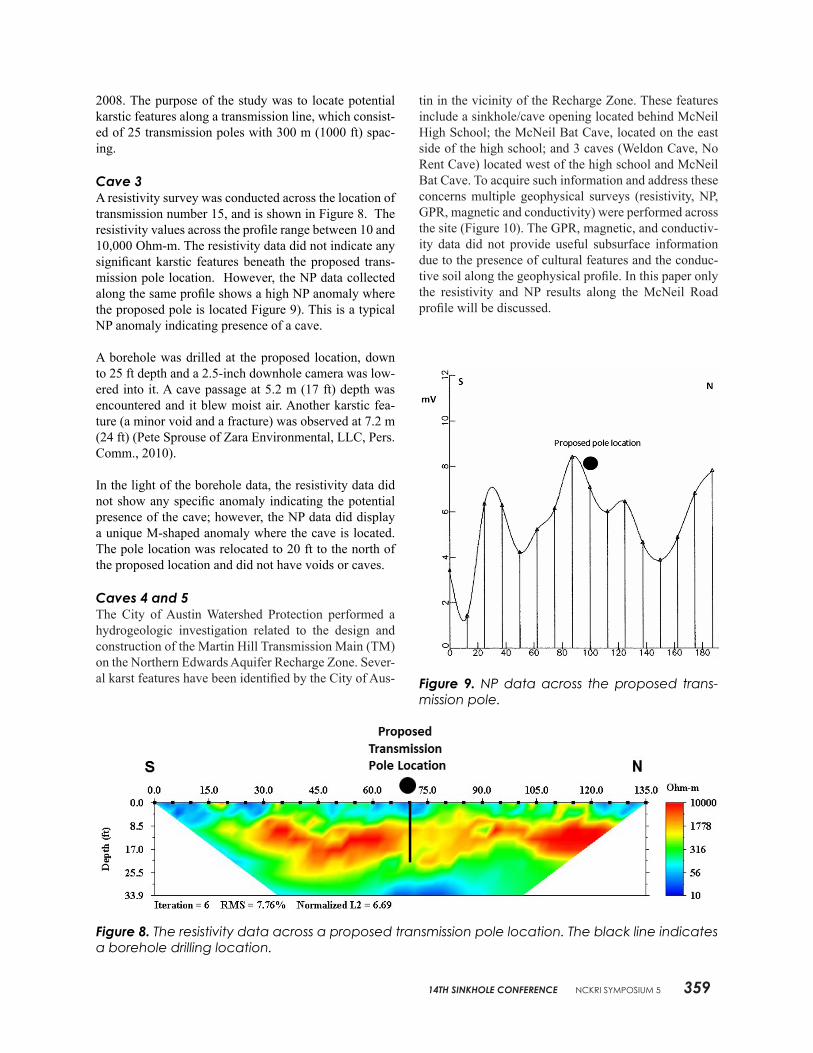
Figure 6 displays the resistivity data along the utility trench. The cave’s dimensions are also superimposed on the resistivity data. The resistivity profile indicates
Figure 4. NP data across cave 1 along with pier locations drilled into the limestone.
Figure 2. Resistivity data across cave 1 along with pier locations drilled into the limestone. Black lines indicate the geometry of the cave.
Figure 3. A map view of 3D resistivity block dia-gram showing the cave geometry. Note that cave location corresponds to low resistivity val-ues (light blue color).
358 NCKRI SYMPOSIUM 5 14TH SINKHOLE CONFERENCE
medium range resistivity values (300 to 800 Ohm-m), not high resistivity values, across the air-filled cave. The cave’s geometry defined by the resistivity data is quite correlative with the observed dimensions of the cave, The resistivity data also indicate a well-defined high re-sistivity anomaly between stations 49 and 55 m (160 and 180 ft), which could be interpreted as an air-filled cave by a novice interpreter based on the resistivity data only.
The NP data provided in Figure 7 shows a significant low NP anomaly across the cave. However, the NP data does not indicate any anomaly over the high resistivity anomaly that was located to the north of the cave.
Three Case Studies from the Austin Area Three case studies were performed over the Edwards Aquifer in the Austin area (see Figure 1 for general loca-tion). A cave location was determined during the geo-physical field work and borehole drilling in the year of
Figure 5. A picture showing the cave location along the trench. The cave is located 3.5 me-ter below the ground.
Figure 6. The resistivity profile along the trench cave.
Figure 7. The NP data across the Trench cave.
35914TH SINKHOLE CONFERENCE NCKRI SYMPOSIUM 5
2008. The purpose of the study was to locate potential karstic features along a transmission line, which consist-ed of 25 transmission poles with 300 m (1000 ft) spac-ing.
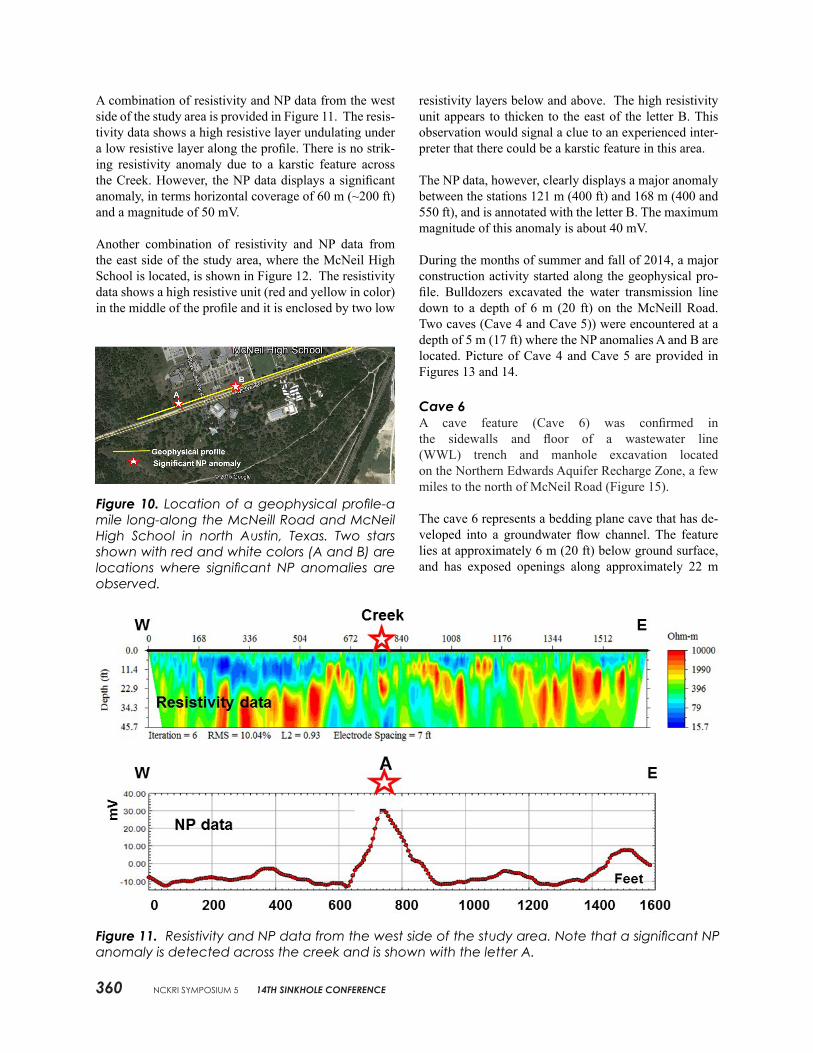
Cave 3A resistivity survey was conducted across the location of transmission number 15, and is shown in Figure 8. The resistivity values across the profile range between 10 and 10,000 Ohm-m. The resistivity data did not indicate any significant karstic features beneath the proposed trans-mission pole location. However, the NP data collected along the same profile shows a high NP anomaly where the proposed pole is located Figure 9). This is a typical NP anomaly indicating presence of a cave.
A borehole was drilled at the proposed location, down to 25 ft depth and a 2.5-inch downhole camera was low-ered into it. A cave passage at 5.2 m (17 ft) depth was encountered and it blew moist air. Another karstic fea-ture (a minor void and a fracture) was observed at 7.2 m (24 ft) (Pete Sprouse of Zara Environmental, LLC, Pers. Comm., 2010).
In the light of the borehole data, the resistivity data did not show any specific anomaly indicating the potential presence of the cave; however, the NP data did display a unique M-shaped anomaly where the cave is located. The pole location was relocated to 20 ft to the north of the proposed location and did not have voids or caves.
Caves 4 and 5The City of Austin Watershed Protection performed a hydrogeologic investigation related to the design and construction of the Martin Hill Transmission Main (TM) on the Northern Edwards Aquifer Recharge Zone. Sever-al karst features have been identified by the City of Aus-
tin in the vicinity of the Recharge Zone. These features include a sinkhole/cave opening located behind McNeil High School; the McNeil Bat Cave, located on the east side of the high school; and 3 caves (Weldon Cave, No Rent Cave) located west of the high school and McNeil Bat Cave. To acquire such information and address these concerns multiple geophysical surveys (resistivity, NP, GPR, magnetic and conductivity) were performed across the site (Figure 10). The GPR, magnetic, and conductiv-ity data did not provide useful subsurface information due to the presence of cultural features and the conduc-tive soil along the geophysical profile. In this paper only the resistivity and NP results along the McNeil Road profile will be discussed.
Figure 8. The resistivity data across a proposed transmission pole location. The black line indicates a borehole drilling location.
Figure 9. NP data across the proposed trans-mission pole.
360 NCKRI SYMPOSIUM 5 14TH SINKHOLE CONFERENCE
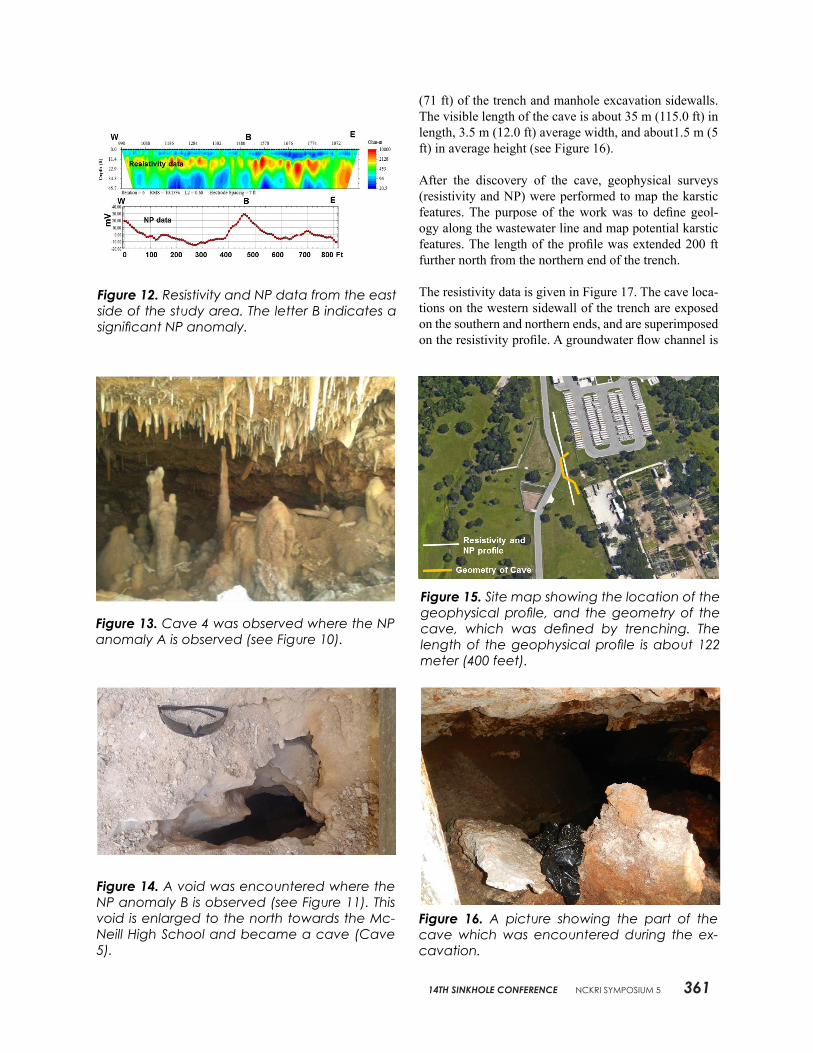
A combination of resistivity and NP data from the west side of the study area is provided in Figure 11. The resis-tivity data shows a high resistive layer undulating under a low resistive layer along the profile. There is no strik-ing resistivity anomaly due to a karstic feature across the Creek. However, the NP data displays a significant anomaly, in terms horizontal coverage of 60 m (~200 ft) and a magnitude of 50 mV.
Another combination of resistivity and NP data from the east side of the study area, where the McNeil High School is located, is shown in Figure 12. The resistivity data shows a high resistive unit (red and yellow in color) in the middle of the profile and it is enclosed by two low
resistivity layers below and above. The high resistivity unit appears to thicken to the east of the letter B. This observation would signal a clue to an experienced inter-preter that there could be a karstic feature in this area.
The NP data, however, clearly displays a major anomaly between the stations 121 m (400 ft) and 168 m (400 and 550 ft), and is annotated with the letter B. The maximum magnitude of this anomaly is about 40 mV. During the months of summer and fall of 2014, a major construction activity started along the geophysical pro-file. Bulldozers excavated the water transmission line down to a depth of 6 m (20 ft) on the McNeill Road. Two caves (Cave 4 and Cave 5)) were encountered at a depth of 5 m (17 ft) where the NP anomalies A and B are located. Picture of Cave 4 and Cave 5 are provided in Figures 13 and 14.
Cave 6A cave feature (Cave 6) was confirmed in the sidewalls and floor of a wastewater line (WWL) trench and manhole excavation located on the Northern Edwards Aquifer Recharge Zone, a few miles to the north of McNeil Road (Figure 15).
The cave 6 represents a bedding plane cave that has de-veloped into a groundwater flow channel. The feature lies at approximately 6 m (20 ft) below ground surface, and has exposed openings along approximately 22 m
Figure 10. Location of a geophysical profile-a mile long-along the McNeill Road and McNeil High School in north Austin, Texas. Two stars shown with red and white colors (A and B) are locations where significant NP anomalies are observed.
Figure 11. Resistivity and NP data from the west side of the study area. Note that a significant NP anomaly is detected across the creek and is shown with the letter A.
36114TH SINKHOLE CONFERENCE NCKRI SYMPOSIUM 5
(71 ft) of the trench and manhole excavation sidewalls. The visible length of the cave is about 35 m (115.0 ft) in length, 3.5 m (12.0 ft) average width, and about1.5 m (5 ft) in average height (see Figure 16).
After the discovery of the cave, geophysical surveys (resistivity and NP) were performed to map the karstic features. The purpose of the work was to define geol-ogy along the wastewater line and map potential karstic features. The length of the profile was extended 200 ft further north from the northern end of the trench.
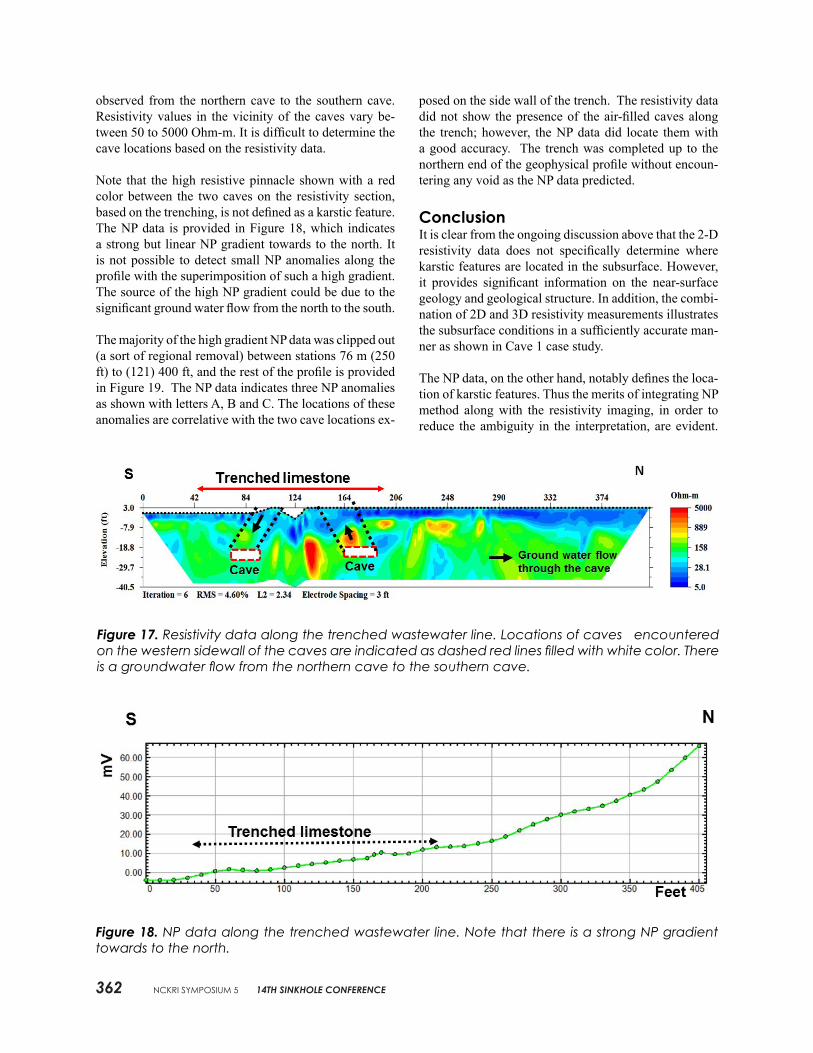
The resistivity data is given in Figure 17. The cave loca-tions on the western sidewall of the trench are exposed on the southern and northern ends, and are superimposed on the resistivity profile. A groundwater flow channel is
Figure 16. A picture showing the part of the cave which was encountered during the ex-cavation.
Figure 15. Site map showing the location of the geophysical profile, and the geometry of the cave, which was defined by trenching. The length of the geophysical profile is about 122 meter (400 feet).
Figure 14. A void was encountered where the NP anomaly B is observed (see Figure 11). This void is enlarged to the north towards the Mc-Neill High School and became a cave (Cave 5).
Figure 13. Cave 4 was observed where the NP anomaly A is observed (see Figure 10).
Figure 12. Resistivity and NP data from the east side of the study area. The letter B indicates a significant NP anomaly.
362 NCKRI SYMPOSIUM 5 14TH SINKHOLE CONFERENCE
observed from the northern cave to the southern cave. Resistivity values in the vicinity of the caves vary be-tween 50 to 5000 Ohm-m. It is difficult to determine the cave locations based on the resistivity data.
Note that the high resistive pinnacle shown with a red color between the two caves on the resistivity section, based on the trenching, is not defined as a karstic feature. The NP data is provided in Figure 18, which indicates a strong but linear NP gradient towards to the north. It is not possible to detect small NP anomalies along the profile with the superimposition of such a high gradient. The source of the high NP gradient could be due to the significant ground water flow from the north to the south.
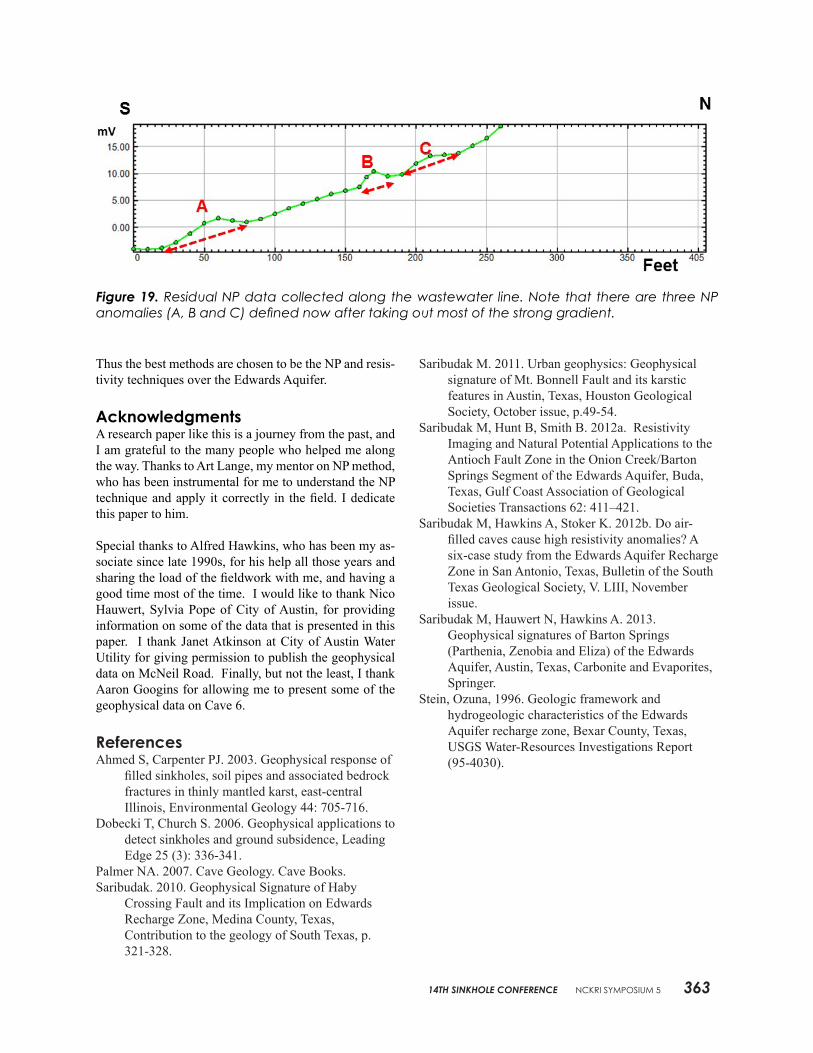
The majority of the high gradient NP data was clipped out (a sort of regional removal) between stations 76 m (250 ft) to (121) 400 ft, and the rest of the profile is provided in Figure 19. The NP data indicates three NP anomalies as shown with letters A, B and C. The locations of these anomalies are correlative with the two cave locations ex-
posed on the side wall of the trench. The resistivity data did not show the presence of the air-filled caves along the trench; however, the NP data did locate them with a good accuracy. The trench was completed up to the northern end of the geophysical profile without encoun-tering any void as the NP data predicted.
ConclusionIt is clear from the ongoing discussion above that the 2-D resistivity data does not specifically determine where karstic features are located in the subsurface. However, it provides significant information on the near-surface geology and geological structure. In addition, the combi-nation of 2D and 3D resistivity measurements illustrates the subsurface conditions in a sufficiently accurate man-ner as shown in Cave 1 case study.
The NP data, on the other hand, notably defines the loca-tion of karstic features. Thus the merits of integrating NP method along with the resistivity imaging, in order to reduce the ambiguity in the interpretation, are evident.
Figure 17. Resistivity data along the trenched wastewater line. Locations of caves encountered on the western sidewall of the caves are indicated as dashed red lines filled with white color. There is a groundwater flow from the northern cave to the southern cave.
Figure 18. NP data along the trenched wastewater line. Note that there is a strong NP gradient towards to the north.
36314TH SINKHOLE CONFERENCE NCKRI SYMPOSIUM 5
Thus the best methods are chosen to be the NP and resis-tivity techniques over the Edwards Aquifer.
AcknowledgmentsA research paper like this is a journey from the past, and I am grateful to the many people who helped me along the way. Thanks to Art Lange, my mentor on NP method, who has been instrumental for me to understand the NP technique and apply it correctly in the field. I dedicate this paper to him.
Special thanks to Alfred Hawkins, who has been my as-sociate since late 1990s, for his help all those years and sharing the load of the fieldwork with me, and having a good time most of the time. I would like to thank Nico Hauwert, Sylvia Pope of City of Austin, for providing information on some of the data that is presented in this paper. I thank Janet Atkinson at City of Austin Water Utility for giving permission to publish the geophysical data on McNeil Road. Finally, but not the least, I thank Aaron Googins for allowing me to present some of the geophysical data on Cave 6.
ReferencesAhmed S, Carpenter PJ. 2003. Geophysical response of
filled sinkholes, soil pipes and associated bedrock fractures in thinly mantled karst, east-central Illinois, Environmental Geology 44: 705-716.
Dobecki T, Church S. 2006. Geophysical applications to detect sinkholes and ground subsidence, Leading Edge 25 (3): 336-341.
Palmer NA. 2007. Cave Geology. Cave Books. Saribudak. 2010. Geophysical Signature of Haby
Crossing Fault and its Implication on Edwards Recharge Zone, Medina County, Texas, Contribution to the geology of South Texas, p. 321-328.
Saribudak M. 2011. Urban geophysics: Geophysical signature of Mt. Bonnell Fault and its karstic features in Austin, Texas, Houston Geological Society, October issue, p.49-54.
Saribudak M, Hunt B, Smith B. 2012a. Resistivity Imaging and Natural Potential Applications to the Antioch Fault Zone in the Onion Creek/Barton Springs Segment of the Edwards Aquifer, Buda, Texas, Gulf Coast Association of Geological Societies Transactions 62: 411–421.
Saribudak M, Hawkins A, Stoker K. 2012b. Do air-filled caves cause high resistivity anomalies? A six-case study from the Edwards Aquifer Recharge Zone in San Antonio, Texas, Bulletin of the South Texas Geological Society, V. LIII, November issue.
Saribudak M, Hauwert N, Hawkins A. 2013. Geophysical signatures of Barton Springs (Parthenia, Zenobia and Eliza) of the Edwards Aquifer, Austin, Texas, Carbonite and Evaporites, Springer.
Stein, Ozuna, 1996. Geologic framework and hydrogeologic characteristics of the Edwards Aquifer recharge zone, Bexar County, Texas, USGS Water-Resources Investigations Report (95-4030).
Figure 19. Residual NP data collected along the wastewater line. Note that there are three NP anomalies (A, B and C) defined now after taking out most of the strong gradient.

364 NCKRI SYMPOSIUM 5 14TH SINKHOLE CONFERENCE