Embed Size (px)
Citation preview

The Missing Piece of the Unemployment Puzzle
An Inaugural Lecture
Andrew J. OswaldDepartment of EconomicsUniversity of Warwick
CV4 7AL*England
November 1997
Summary
The paper studies one of the puzzles of modern economics. Why does Western Europe have 20million unemployed workers? This is more than 10% of the workforce. Yet in the 1950s and 60s,unemployment rates were consistently less than 3%.
The paper provides evidence for four ideas*.1. Unemployed people are very unhappy.2. Oil prices explain the main cycles in post-war unemployment, but not the underlying upwardtrend.3. Europe's high unemployment is probably not much to do with generous welfare benefits, hightaxes, trade union power, or wage 'inflexibility'.4. The large rise in European home-ownership may be the missing piece of the unemploymentpuzzle. [* This paper uses simple forms of evidence -- mainly scatter-plots -- to give the flavour of recent research findings. Asmight be guessed, the four ideas have actually been established using more formal statistical methods.]
Helpful comments were received in technical presentations of this work at Aarhus, Bristol,Dartmouth, Essex, Exeter, Harvard, MIT, Princeton, Stockholm, Toulouse, Uppsala, and theInstitute for Employment Research (Warwick). Many colleagues in the Warwick Economicsdepartment kindly provided suggestions.
I thank especially, without implicating, Charlie Bean, Danny Blanchflower, Alison Booth, AlanCarruth, Francis Castles, Chris Doyle, Ann Green, Barry McCormick, Jack Menge, Steve Nickell,Mike Oxley, Chris Pickvance, Chris Riley, Martin Robson, Jonathan Skinner, Marion Steele, andJohn Treble. For research assistance and comments, I thank Andrew Benito, Jonathan Gardner,Steve McCintosh, Gaelle Pierre, Mark Roberts, and Julian Steer.

1
The Missing Piece of the Unemployment Puzzle
Andrew J. Oswald
"Most economists agree that unemployment is higher in Europe than America because Europe'slabour markets are riddled with rigidities .... and generous unemployment benefits."
The Economist, p.142, October 11, 1997
"Europe's unemployment crisis is deep-seated and self-inflicted. Over-generous social protectionand labour market rigidity have resulted in a situation where continental economies have forgottenhow to create jobs."
The Sunday Times, editorial, February 9, 1997
Introduction
This paper looks at one of the famous puzzles of modern economics. Why are there so
many unemployed people in the industrialised countries, and why do unemployment rates now
differ markedly across those nations? Figure 1 and Table 1 lay out the facts to be explained. This
paper reviews conventional wisdom, concludes that the supporting evidence is not strong, and
suggests alternative ideas.
Despite some journalists' claims, the truth is that economists are not entirely sure why
unemployment has been trending upwards (Bean's 1994 survey is open-minded). Politicians
claim to have answers, but their occupation, of course, obliges them to be confident when asked.
Privately, prime ministers probably realise they do not understand the causes of widespread
joblessness.
This paper tries to provide evidence for four ideas.
(i) Unemployed people are very unhappy.
(ii) Movements in oil prices cause cyclical changes in unemployment, but cannot explain the
upward trend in European joblessness.
(iii) Despite conventional wisdom, high unemployment does not appear to be primarily the result
of things like overly generous benefits, trade union power, taxes, or wage 'inflexibility'.

2
(iv) By impairing people's mobility, high levels of European home-ownership may be an
important part of the explanation for high unemployment.
Idea 1: Unemployed People are Very Unhappy
There is a natural question with which to start. Does this topic really matter? Some
economists, especially in the US, take the view that jobless people are consciously electing not to
have a job (they simply do not find work very attractive) and that for this reason unemployment is
not a major social or economic problem.
Are large numbers of Europeans effectively choosing to be unemployed? If the answer is
yes, the State might wish to reduce the attractiveness of being without work, and to allow those in
jobs to keep a larger share of the tax revenue that at present goes to cross-subsidize the jobless. If
the answer is no, the State may have to look elsewhere for ways to tackle unemployment, and
perhaps consider methods of directly raising the number of jobs rather than reducing the number of
benefit claimants.
The first piece of the unemployment puzzle is that the unemployed are much less happy
than those in work. To put this in a tangible way, data collected by psychologists and economists
show that unemployment seems to be worse than breaking up with one's wife or husband.
Using random samples of individuals, Tables 2a and 2b show that reported happiness
levels are much lower among the unemployed. For example, looking at a random sample of
approximately one hundred thousand Europeans, a third of unemployed people describe
themselves as "not too happy", the lowest of three possible answers in regular Eurobarometer
Surveys. By contrast, approximately one fifth of all individuals do so.
Quite generally, statistics from both the US and Europe, measuring well-being in different
ways, support the conclusion that losing one's job is amongst the worst things that can happen to a
person. This is true even among people with low or no qualifications, who might be thought to
face the least-interesting jobs. It can be checked that causation runs from jobs to happiness: it is
not just that miserable people are not hired. These findings make it difficult to take seriously those

3
who suggest that high levels of British joblessness are in some sense the result of voluntary
choices by contented or lazy individuals who are happily drawing the dole. Some readers may feel
that they knew this without the need for statistical analysis.
Using data from the new British Household Panel Study, for example, it is possible to
explore whether, in the 1990s, unemployed people are relatively happy or unhappy. To do this
test, one can draw upon mental well-being scores from a form of psychiatric evaluation known as
the General Health Questionnaire (GHQ). The first sweep of the British Household Panel Study
provides information, for the year 1991, about a random sample of approximately six thousand
working Britons. In its simplest form the survey weights the answers to the following set of
questions.
Have you recently:
*1. been able to concentrate on whatever you are doing?
2. lost much sleep over worry?
*3. felt that you are playing a useful part in things?
*4. felt capable of making decisions about things?
5. felt constantly under strain?
6. felt you couldn't overcome your difficulties?
*7. been able to enjoy your normal day-to-day activities?
*8. been able to face up to your problems?
9. been feeling unhappy and depressed?
10. been losing confidence in yourself?
11. been thinking of yourself as a worthless person?
*12. been feeling reasonably happy all things considered?
People's answers to these questions are coded on a four-point scale running from "disagree
strongly" to "agree strongly". Starred items are coded in reverse, so that, for example, zero then
corresponds to "agree strongly". The questions are combined into a single level of mental stress
for each person.

4
The data are reported in Table 3. They suggest involuntary, rather than voluntary,
unemployment. Unemployed Britons in 1991 show high levels of mental distress. Using the
GHQ method just described, the average level of distress is 2.98 for the jobless and 1.45 for
employees (both measured on a scale from 0 to 12). The 522 jobless people in the sample thus had
approximately twice the mean mental distress score of those 4893 individuals with jobs. The
difference here between the employed and unemployed is large and statistically significant.
To understand the size of the effect, it is necessary to have some feel for the statistical
distribution of the six thousand answers. In the full sample, taking all those classified as in the
labour force, more than half of individuals report a mental distress score of zero. Thus zero is the
most common level of recorded distress or 'unhappiness'. Just under one thousand other
individuals have a distress level of 1, and approximately five hundred have a distress level of 2.
Thus the average difference of approximately one-and-a-half points on an unemployed person's
distress level means that those without work appear to be substantially more miserable than people
with jobs.
Moreover, it is not just that unemployed people tend to be less qualified, and thus cannot
get cushy jobs. Table 4, which gives a break-down by education, provides evidence. It reveals
that distress from joblessness is, at 3.44, greatest for those (eighty six) people who are highly
educated. But being unemployed is very bad even for those in Britain with low or no
qualifications (compare 1.43 with 2.7). Unemployment does not look 'voluntary'.
Sadly, the unpleasantness of joblessness also shows up in another way. The data Platt and
Kreitman (1985) gather on Edinburgh males suggest that, among unemployed men in the lowest
social class (Class V), one in twenty try to kill themselves in a given year. Table 5 summarises the
data. Most social scientists are not used to working with suicide statistics. Economists,
especially, are likely to see this area as far from their usual concerns, and of little relevance to
them. This attitude may not be the right one. As writer Wilfred Sheen is reputed to have
remarked: suicide is about life, being in fact the sincerest criticism that life gets. Kammerling and
O'Connor (1993) also argue that unemployment influences suicide rates.
5
More recent longitudinal research has confirmed the bad effects of joblessness upon well-
being. The findings of Clark (1996), Gerlach and Stephan (1996), Korpi (1994, 1997) and
Winkelmann and Winkelmann (1997) seem particularly important. Their methods allow them to
control for individuals' innate characteristics and to track the same person through time.
Di Tella et al (1997) finds that as unemployment in a country rises, employees report lower
well-being (presumably through some 'fear' effect). Hence the unemployment rate also has
indirect effects on happiness.
Finally, it is worth noting that psychologists have done checks on the reliability of
happiness measures. For example, it is known that people who report high happiness scores tend
to laugh and smile more, and to be rated by others as happier (Pavot et al, 1991; Diener, 1984;
Watson and Clark, 1991).
Idea 2: Oil Prices Explain Many of the Cyclical Changes in Unemployment
It may not be widely realised how well movements in the price of energy predict changes in
unemployment. Economists are aware that there were huge rises in the price of crude oil in 1973
and in 1979, and that, as stressed in early work by Bruno and Sachs (1985), on each occasion this
was followed by falls in output around the world. What may be less well-known is that
(i) the reductions in world unemployment in the middle 1980s coincided with oil-price falls,
(ii) the start of the most recent US and UK recessions can be timed at the late summer of 1990
when the invasion of Kuwait produced an upward spike in oil prices,
(iii) there are studies showing that almost all post-war US recessions seem to be associated with
increases in the price of petroleum, and
(iv) econometric research suggests there are strong oil-price effects upon the labour market.
A likely reason for such a link is that, by requiring wages to fall to restore profit margins,
higher energy costs indirectly force up unemployment. When the oil sheikhs take more of the
world's real income, workers have to take less. But there is only one way in which this can
happen. Unemployment has to rise. It has to rise enough to make employees so fearful of their

6
jobs that they are willing to accept lower pay. Equilibrium -- at a greater level of joblessness -- can
thereby be regained. Time-series movements in oil prices are therefore followed by fluctuations in
the level of joblessness.
However, more than the oil market matters. There is strong secular movement in aggregate
joblessness, and this trend cannot be explained by the petroleum price, because the real price is
now much what it was in the 1960s. The paper returns to this issue later.
Figures 2 to 4 provide simple graphs of the real oil price against unemployment for the
UK, Germany, and the US. Time-series movements in oil prices are followed quite closely by
fluctuations -- in the same direction -- in the level of joblessness. The lag appears to be between
one and two years. Formal analysis is given in Carruth, Hooker and Oswald (1997). Their
analysis also focuses upon the effect of the real interest rate, and attempts to see how well business
cycle movements are predicted by oil prices and interest rates alone.
An explanation of unemployment may thus have to keep a special place for the real price of
energy. Nevertheless, effects from oil prices cannot explain all the facts. This has led to work like
Blanchard and Summers (1986), which boils down to the idea that high unemployment begets high
unemployment and is self-sustaining. However, an alternative is that some important explanatory
factor is missing.
Idea 3: High Unemployment Probably is Not Explaine d by High Levels of Unemployment
Benefit, Union Power, Taxes or Wage Inflexibility
Overly Generous Benefits?
If there is a journalists' consensus, it is that Europe's problem is that its welfare state has
made life progressively less unpleasant for the unemployed. This is the notion that there is a
happiness gap between work and joblessness but that over the last two decades that gap has
gradually fallen. It has got easier to be without a job, so less people bother to have a job. Many
7
issues of magazines like The Economist contain sentiments similar to this (see, for example,
"Labouring the Point", p.142, The Economist , October 11, 1997).
However, to a Briton, it would be surprising if generous unemployment benefits were the
explanation for high unemployment. Figure 5 shows why. The best OECD-calculated measure of
benefit generosity indicates a sharp fall over the period of the last two decades, so it is difficult to
see why unemployment would have trended up.
There is another way to get at the issue. The Eurobarometer Survey Series records
responses made by more than 100,000 randomly sampled Europeans to the question:
"On the whole, are you very satisfied, fairly satisfied, not very satisfied, or not at all satisfied with
the life you lead?"
Answers are available, from 1973 to the present, for approximately 1000 people per year per
country. The nations are Belgium, Denmark, West Germany, Greece, Spain, France, Ireland,
Italy, Luxembourg, The Netherlands, Portugal and Great Britain. If one plots the reported well-
being of employed and unemployed Europeans over time, there is a gap in life satisfaction between
the two, and there is no evidence of convergence. The unhappiness gap is the same as it was in the
mid-1970s. In other words, people do not feel that unemployment is any more attractive, relative
to having a job, than they did twenty years ago. It is as bad as ever. Figure 6 plots the data. If the
welfare state in Europe's nations is making it much more attractive to be unemployed, the
unemployed apparently do not notice. Figure 6's spike around the start of the 1980s is noticeable,
and may be a reaction to the surge in joblessness that occurred in those years (perhaps unemployed
workers then felt that they were not individually to blame for their own lack of a job).
In conclusion, the 'utility' gap between work and no-work has been roughly constant over
time. It is therefore not especially plausible to suggest that rising unemployment has been
produced by a growing generosity of the welfare state.
A further approach is to look across countries. Figures 7, 8 and 9 use data on benefit
generosity -- measured in different ways -- nation by nation. Figure 7 appears to show no
correlation with unemployment levels. Figures 8 and 9, however, suggest a small link

8
between aggregate joblessness and the unemployment benefit system. Although Di Tella and
MacCulloch (1996) point out that causality might run in the other direction, there is interesting
evidence here that long-lasting benefits may play a role (as stressed by Layard, Nickell and
Jackman, 1991) in sustaining high levels of joblessness. A later section returns to this issue.
Too-High Labour Taxes or Too-Powerful Trade Unions?
Economists like Edmund Phelps (1994) and European Commissioner Monti worry that
high levels of taxation of employers, like firms' payroll taxes, have caused unemployment
problems in Europe. Nickell (1997) has found some evidence that the total tax wedge -- summing
payroll taxes and income taxes and consumption taxes -- is slightly associated with unemployment
across countries. Yet Figure 10 illustrates that payroll taxes alone are uncorrelated with the pattern
of unemployment across nations. A more formal analysis confirms that.
Figure 11 looks at possible links between unemployment in countries and how many
workers in those countries belong to trade unions. There is no obvious sign of a positive
relationship. A more technical type of analysis, using data through time, can find a small effect;
that is discussed later in the paper.
Wage Flexibility as the Problem?
It is sometimes said that the trouble with European countries like the UK is that wage levels
do not adjust in a flexible way. However, recent research appears to indicate that the degree of
local wage flexibility is approximately the same in the UK as in many different countries.
To be more precise, there is a negatively-sloped curve linking pay to the local rate of
unemployment, and it seems to have the same curvature in the US as in Japan as in Britain as in
Norway. The main evidence is presented in a book, written with David Blanchflower, called The
Wage Curve , published by MIT Press. The conclusions are at odds with conventional wisdom,
which teaches students that the reason some countries had comparatively small rises in joblessness
is that those nations' wages are inherently more responsive to the level of unemployment. If only a

9
short run of aggregate data are available, calculating the true responsiveness of pay to
unemployment, in a world where many aggregate variables move together, is not an easy task.
This makes it natural to study, say, regions through time. In this spirit, Blanchflower and Oswald
(1994) is an attempt to document the existence of an empirical regularity using random samples of
individuals from twelve nations. These samples record statistical information about three and a
half million people.
The book concludes that there seems to be a curve linking wages to the local rate of
unemployment. The nature of this relationship -- "the wage curve" -- is almost identical across the
countries of the world. It is also present, within nations, across different periods of time. The
three main conclusions of the Blanchflower-Oswald book are the following.
i. A wage curve exists. Employees who work in areas of high unemployment earn less, other
things constant, than those who are surrounded by low unemployment.
ii. Approximately the same curve holds in data from the USA, Great Britain, Germany, Canada,
Austria, Holland, Switzerland, Korea, Norway, Ireland, Italy, Japan, Australia, the Cote d'Ivoire,
Sweden and India.
iii. In the countries studied in the The Wage Curve book, the estimated unemployment elasticity of
pay is approximately -0.1. A doubling of unemployment is then associated with a ten percent fall
in pay. Recent work by Blanchard and Katz (1997) gets larger elasticities.
In summary, the degree of wage flexibility may be more similar across countries than has
been believed. As there are very different rates of unemployment across nations, it is possible that
we have all spent too long looking for our answers in the cupboard marked "wage flexibility".
Idea 4: Rising Home-Ownership and Rising Unemployment
Over the last few decades, European governments have made concerted efforts to reduce
the size of the private rented housing sector and to increase home-ownership.
In this country the proportion of people owning their own home has gone from roughly
30% in the early 1950s to 67% today. The private rental sector housed 52% of the British

10
population at the start of the 1950s, but only 8% by the mid-1990s. The nature of owners has also
changed. For example, the 1995 General Household Survey shows that 43% of unskilled manual
workers now live in their own homes, compared to a figure of 27% as recently as 1981. For
professional workers the figure is 87% in both years.
Yet home-owners are relatively immobile, partly, presumably, because they find it much
more costly than private renters to move around in search of new jobs. Using the Working Lives
Survey, Owen and Green (1997) uncover the remarkable fact that moves to and from the tiny
British private rental sector account for almost as many residential moves as the whole of the
owner-occupation sector. From the 1995 General Household Survey we know too that the length
of time at one current address is markedly lower if one is a renter:
Proportion of people at th eir current address for less than a year
Owners 5%
Private renters (unfurnished) 27%
Private renters (furnished) 49%.
Some of the difference is explained by age-differences of people, but not all of it.
A decline in people's willingness to switch locations might be expected to raise the average
amount of unemployment. Could changes in the housing market then be part of the story of high
unemployment? One reason to think it could is that, as shown later, home-ownership and
unemployment rates are surprisingly correlated across nations and regions.
It is known that those who live in rented public-sector housing are less likely to move
regions or leave the pool of unemployment (see the long line of research by Hughes and
McCormick, 1981, 1985, 1987, and McCormick, 1983; see also Bover, Muellbauer and Murphy,
1988, who study links between housing and the labour market, though concentrating on house
prices). Intuition suggests that the same might be true of home-owners. If owning a house
reduces an individual's mobility -- Henley (1996) appears to find exactly that -- then the
consequences for the labour market of secularly rising home-ownership could be profound.
Another small piece of evidence consistent with this way of thinking is in the work of Wadsworth

11
(1995) which reveals, in the author's table 6, that private renters have a notably fast outflow rate
from unemployment into jobs.
Questionnaire evidence can be gleaned from the British Social Attitudes Surveys. It
reveals, in Table 6, the greater (expressed) willingness to move of renters compared to home-
owners. Both those currently unemployed, and those in employment who think if they lost their
jobs it would take a long time to find another, were asked whether they would be willing to
consider moving areas to find work. Home-owners expressed themeselves markedly less willing.
Among currently unemployed home-owners who thought it would take them at least three months
to find work, only 24% said they would be willing to move areas. Americans would probably
view this as remarkably low.
Consider the early 1960s. In this era, there was not thought to be a problem with the
labour market (except in North America, paradoxically, which failed to have the 2%-3%
unemployment rates of the European countries). Yet labour market institutions were much as they
are today.
Figure 12 plots data -- for North America and the main European nations -- that would have
been available to an economist working thirty years ago. Each dot is a country. The figure has
national unemployment rates on the vertical axis, and home-ownership proportions on the
horizontal axis. It shows a weak but interesting pattern. Figure 13 fits a line through the scatter.
There is little reason to take Figures 12 and 13 too seriously because there are few data
points. Economists in the 1960s did not.
Nevertheless, as Figure 14 reveals, much the same pattern is visible in today's data. Of
course simple cross-section correlations are often unreliable. As Assar Lindbeck has pointed out to
me, having a country with high mountains also seems to be a fairly good predictor of low
unemployment. This is unlikely to be because everyone becomes ski-instructors.
Figure 16 contains more interesting evidence that is less subject to the high-mountain kind
of objection. It shows that the nations with the fastest growth in home-ownership had the fastest
growth in unemployment. This is less easy to dismiss as coincidence -- partly because the identity

12
of the high home-ownership countries has changed through time. Rather strikingly, the gradient of
the best-fitting line is close to 0.2, just as in Figure 15. It is rare, in cross-country analysis, to find
that gradients are the same whether levels or changes are on the axes.
Most industrialized countries have recently experienced growth in home-ownership. Two
exceptions are Switzerland and the US. They also have had almost no change in their
unemployment rates. Moreover, Ireland, Finland, Greece and Spain currently have the highest
rates of owner-occupied housing in the Western world. They have the highest unemployment
rates.
It is also possible to explore the issue by looking inside countries systematically, nation-by-
nation, to see how regional unemployment and regional home-ownership are related. This test
would not be expected to work perfectly, because other things are not being held constant, but it is
a useful rough-and-ready way to explore the data. A good theory of unemployment ought to
explain why joblessness differs across regions inside countries. Most recent empirical work on
unemployment is silent here: aggregate variables like benefits and bargaining structure tend to be
common to all regions within a country.
One way to check the robustness of a relationship is to find out whether it holds in quite
different circumstances and places. In this spirit, Figure 17 is a plot for the states of the USA. It
studies the statistical relationship between the growth in home-ownership and the growth in
unemployment. Each dot is a state. Drawing the best line throught the scatter of points gives
Figure 18.
Figure 18 is of some interest. The reason is that the slope of the line is 0.21358, or in
other words approximately 0.2. This is close both to the gradient in Figure 16 for growth rates
across nations, and to the gradient of Figure 15 on levels across nations.
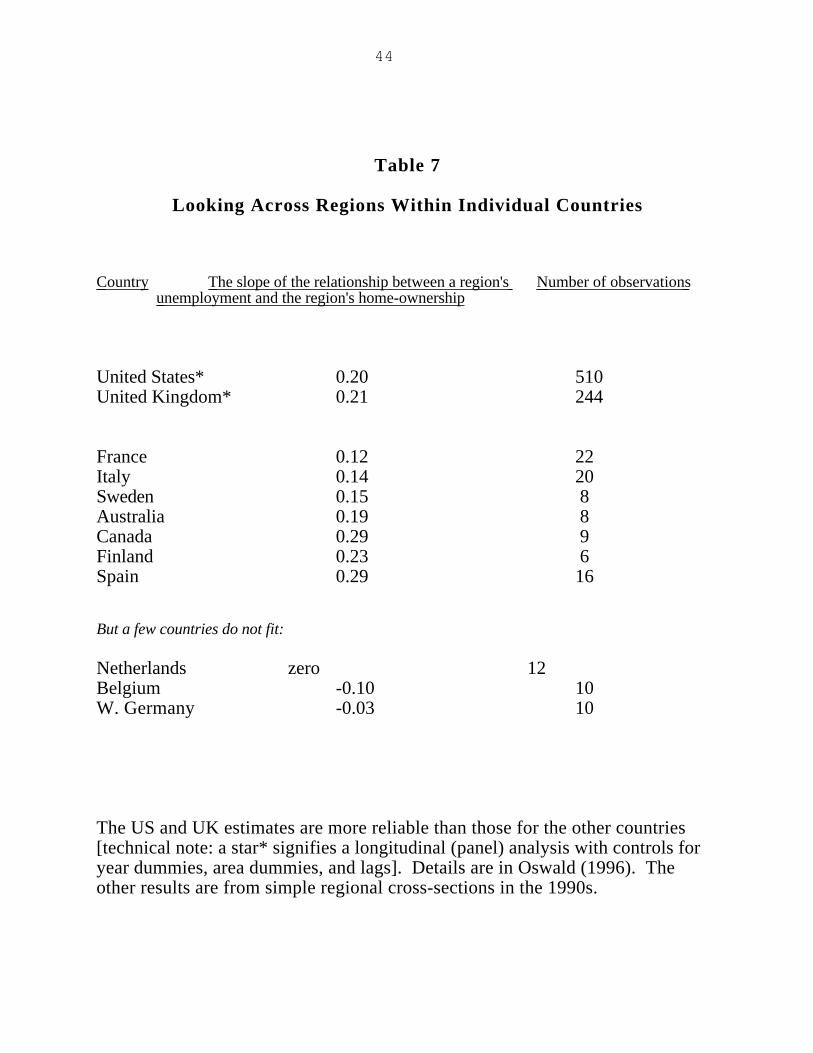
Table 7 turns to other countries' regions. For the Netherlands, Belgium and West
Germany, there is no sign of a positive relationship between area unemployment and area home-
ownership. Nevertheless, Table 7 finds much evidence consistent with a gradient of 0.2.
Moreover, the first two rows in Table 7 should be taken more seriously than the others. The

13
reason is that the analytical methods and data are here superior to those used for the other
countries' entries.
Finally, a formal statistical analysis -- called a panel analysis but the details are not
explained in this paper -- produces the equation of Table 8. The Table is based on data for nineteen
countries running from 1960 to 1990. It finds that, even holding constant the amount of
unemployment benefits and unionism, joblessness is higher in countries where lots of people own
their homes. Moreover, the slope of the relationship, at 0.17, is surprisingly like that seen before
in simpler tests.
As Table 9 shows, home-ownership growth would -- according to these kinds of
calculations -- account for the dominant reason behind the rise in UK unemployment. That is
because a thirty percentage points rise in home-ownership times 0.17 equals approximately five
percentage points on the unemployment rate. Effects from benefits and unionism are calculated to
be much less.
A different and informal inquiry can be made by asking the elementary question: across
countries in the 1990s what variable is most strongly correlated with unemployment? The answer
is home-ownership. Table 10 records some simple results.
More work will need to be done on the reason for the apparent links between housing and
mobility. Figures A.1 and A.2 in the appendix are indicative of a connection, and it can be shown
that a formal analysis, following regions through time and holding other factors constant, leads to
the same kind of relationship.
So is rising home-ownership and the decline of the private rental housing sector really an
important part of the explanation for the industrialised nations' unemployment?
It would be unwise at this point to read too much into the paper's findings. They have to
be checked by other economists. Much remains to be done. But the early patterns in the data
suggest the idea is worth exploring.

14
Conclusions
Unemployment in the Western economies is much higher than it used to be, but we are not
really sure why. This paper describes four ideas -- various pieces of the puzzle -- and argues that
they will have to feature in a complete explanation.
(i) Unemployed individuals are extremely unhappy. This might be thought commonsense, but
some politicians and economists come close to viewing joblessness as a conscious choice made by
people who do not find it unpleasant.
(ii) Movements in oil prices cause cyclical changes in unemployment, but cannot explain the
upward trend in European joblessness.
(iii) Contrary to conventional wisdom, high unemployment does not appear to be primarily the
result of overly generous benefits, trade union power, taxes, or wage inflexibility. Present policy
in the European nations may end up doing more harm than good.
(iv) Rising home-ownership in Europe may be the missing piece of the unemployment puzzle.
If the last becomes part of conventional thinking, it will probably be used to justify a
rekindling of the private-rented housing sector. That sector housed the majority of Britons after the
War; it now covers only a few percent of the population. Relatively little is known about what this
change may have done to Great Britain.

15
Background Notes
The main sources of information used in the paper are the Eurobarometer Surveys of 1973onwards, the British General Household Surveys of 1973 onwards, the first 1991 sweep of theBritish Household Panel Study, and the US General Social Surveys of 1972 onwards. These areface-to-face surveys of randomly sampled individuals. Suicide data come from the Office ofPopulation Censuses and Surveys. All the paper's sources of data are publicly available. Thispaper has not attempted to document its literature sources fully in the way a normal academic paperwould. Although little-read by economists, the pioneering work on the statistical study of well-being includes Andrews and Withey (1976). A good modern introduction is Argyle (1989).
Many of the British results on the distress caused by unemployment are due to Jahoda (1982),Peter Warr (1978 onwards) and Jackson et al (1983). New work includes Whelan (1992) andGallie and Russell (1995). The unemployment findings are now conventional in the psychologyliterature but probably still not well-known among economists. Innovative early work byeconomists includes Bjorklund (1985) and Edin (1988), although modern results are stronger.
Readers wishing to dip into the general issues discussed in the paper might try Balchin (1996),Bean (1994), Freeman (1988), Green (1994), Hogarth, Elias and Ford (1996), Junankar andMadsen (1994), Layard, Nickell and Jackman (1991), Lindbeck (1990, 1993), McCormick(1996), Nickell (1997), OECD (1994), Oswald (1997, 1998), Oxley and Smith (1996), Pissarides(1990), and Wadsworth (1995).
An interesting natural experiment is described in Wilcock (1957). The author's work reveals thatafter a US plant closed it was the home-owners who were reluctant to leave the area.

16
Figure 1
The Unemployment Puzzle -- Over Time
200019901980197019600
2
4
6
8
10
12
Europe's Unemployment Rate
Year
Eu
rop
e's
Un
emp
loym
ent
Rat
e
This is a plot of the percentage unemployment rate for Western Europe from the early 1960s. Thesource is OECD data.

17
Table 1
The Unemployment Puzzle -- Across Countries
Country Unemployment % 1960 Unemployment % mid-1990s
Spain 3 24Ireland 6 14
France 2 12Italy 4 11Denmark 2 8UK 2 9NL 1 7W. Germany 1 8Belgium 3 10Canada 6 10
Switzerland 0 3USA 5 6
These are standardized OECD unemployment rates in the 1990s, and as close as can be obtained tostandardized rates for the earlier period. Source: OECD Employment Outlook.

18
Some of the Evidence for Idea 1
(The unemployed are very unhappy.)

19
Table 2(a)
Patterns in the Reported Happiness of People in Europe: 1975-86*
"Taking all things together, how would you say things are these days -- would
you say you're very happy, fairly happy, or not too happy?
All Individuals Unemployed Individuals
Not too happy % 18.6% 33.0%
Fairly happy % 57.9% 51.1%
Very happy% 23.4% 15.9%
Highest-paid quarter of the population Lowest-paid quarter of the population
Not too happy % 13.1% 26.7%
Fairly happy % 58.5% 54.5%
Very happy% 28.4% 18.8%
* After 1986 the happiness question was dropped from the surveys.Source: Di Tella, MacCulloch and Oswald (1996) using Eurobarometer data.
Total sample 108,802 observations.

20
Table 2(b)
Patterns in the Reported Happiness of People in the USA: 1972-94
"Taken all together, how would you say things are these days -- would you say
you're very happy, pretty happy, or not too happy?"
All Individuals Unemployed Individuals
Not too happy % 11.5% 29.6%
Fairly happy % 55.8% 52.7%
Very happy% 32.7% 17.7%
Source: Di Tella, MacCulloch and Oswald (1996) using US General Social Survey data.
Total sample: 26,668 observations.
21
Table 3
High Distress Levels among Unemployed Peoplein Britain in the 1990s
Labour market status Number in sample Average mental distress*
Unemployed 522 2.98
Employee 4893 1.45
Self-employed 736 1.54
Table 4
Unemployment Appears to Hurt Both the Poorly Educated andthe Highly Educated
Number in sample Mental distress
High education (HNC up to degree)
Unemployed 86 3.44
In work 1612 1.48
Low education (less than any GCSE qualifications)
Unemployed 273 2.70
In work 1848 1.43
Source for both Tables: Clark and Oswald (1994) using 1991 BHPS data on GHQ mental health scores. * Thesenumbers are on a scale where the minimum is 0 and the maximum is 12. Calculating means in this way imposesan implicit assumption of cardinality.

22
Table 5
Attempted-Suicide Rates by Duration of Unemployment: EdinburghCity Males in 1982
Duration of unemployment Parasuicide rate/100 000 Relative Risk
Less than 4 weeks 1012 8.85-26 weeks 615 5.427-52 weeks 1193 10.4Over 52 Weeks 2164 18.9
All unemployed 1345 11.8 All employed 114 1.0
Source: Platt and Kreitman (1985)
Note: Para-suicide is the technical term for attempted suicide.

23
Some of the Evidence for Idea 2
(Oil prices cause important cyclical changes in unemployment.)

24
Figure 2 Wide UK unem and oil plot here

25
Figure 3 Wide German Oil and Unem plot here

26
Figure 4 Wide US Oil and Unem plot here

27
Some of the Evidence for Idea 3
(Despite journalists' conventional wisdom, benefit generosity, rigidities, and soon, are probably not of primary importance.)

28
Figure 5
The Generosity of UK Unemployment Benefits HasBeen Falling Over Time
2000199019801970196016
18
20
22
24
26
28
Unemployment benefit generosity
Year
The data come from the OECD Database on Unemployment Benefit Entitlements and ReplacementRates. These figures measure benefit entitlements before tax as a percentage of previous earningsbefore tax. The data are summary statistics, for the UK through the years, averaging acrossdifferent earnings levels, length of unemployment spell, and family situation.

29
Figure 6 -- Wide Life Satisfaction Plot goes in here

30
Figure 7
Countries with High 'Replacement Rates' of Unemployment BenefitsDo Not Appear to Have More Unemployment
1008060402000
10
20
Unemployment benefit 1990s
Un
emp
loym
ent
rate
'89
-94
Each dot is a country. The unemployment data are standardized OECD rates, and the benefitvariable is the replacement rate (measuring the proportion of income paid). Both series come fromNickell (1997).
The countries are Austria (unemployment = 3.7%, benefits level = 50 per cent), Belgium (8.1,60), Denmark (10.8, 90), Finland (10.5, 63), France (10.4, 57), West Germany (5.4, 63), Ireland(14.8, 37), Italy (8.2, 20), Netherlands (7.0, 70), Norway (5.5, 65), Portugal (5.0, 65), Spain(18.9, 70), Sweden (4.4, 80), Switzerland (2.3, 70), UK (8.9, 38), Canada (9.8, 59), US (6.2,50), Japan (2.3, 60), Australia (9.0, 36), New Zealand (8.9, 30).
Fitting a line through the scatter produces a negative slope. The R-squared is 0.01.
31
Figure 8
Countries with Long-Lasting Unemployment BenefitsHave Slightly More Unemployment
1210864200
10
20
Duration of benefits (10max)
Un
emp
loym
ent
rate
'89
-94
y = 6.6930 + 0.31999x R^2 = 0.101
Each dot is a country. The unemployment data are standardized OECD rates, and the benefitduration variable is the number of years that benefits can be drawn in the country. Both seriescome from Nickell (1997), but he approximates "unlimited duration" by 4 years, and I alter this to10 years.
The countries are Austria (unemployment = 3.7%, unemployment benefit duration = 2 years),Belgium (8.1, 10), Denmark (10.8, 2.5), Finland (10.5, 2), France (10.4, 3), West Germany(5.4, 10), Ireland (14.8, 10), Italy (8.2, 0.5), Netherlands (7.0, 2), Norway (5.5, 1.5), Portugal(5.0, 0.8), Spain (18.9, 3.5), Sweden (4.4, 1.2), Switzerland (2.3, 1), UK (8.9, 10), Canada(9.8, 1), US (6.2, 0.5), Japan (2.3, 0.5), Australia (9.0, 10), New Zealand (8.9, 10).

32
Figure 9
Countries with More Generous Unemployment BenefitsHave A Little More Unemployment
60504030201000
10
20
Benefit generosity oecd 1991
Un
emp
loym
ent
rate
'89
-94
y = 5.5745 + 8.1891e-2x R^2 = 0.066
Each dot is a country. The unemployment data are standardized OECD rates. The benefitgenerosity variable is taken from the OECD Database on Unemployment Benefit Entitlements andReplacement Rates. It is a summary measure of benefit entitlement before tax as a percentage ofprevious earnings before tax. It thus combines a country's amount and length of benefits, becausethe data are averages over different earnings levels, length of unemployment spells, and familysituations.
The countries are Austria (unemployment = 3.7%, benefits = 31.0 per cent), Belgium (8.1, 42.3),Denmark (10.8, 51.9), Finland (10.5, 38.8), France (10.4, 37.2), West Germany (5.4, 28.1),Ireland (14.8, 29.3), Italy (8.2, 2.5), Netherlands (7.0, 51.3), Norway (5.5, 38.8), Portugal(5.0, 34.4), Spain (18.9, 33.5), Sweden (4.4, 29.4), Switzerland (2.3, 21.9), UK (8.9, 17.5),Canada (9.8, 27.8), US (6.2, 11.1), Japan (2.3, 9.9), Australia (9.0, 26.5), New Zealand (8.9,30.4).

33
Figure 10
Countries which Tax Labour Highly Do NotHave More Unemployment
504030201000
10
20
Payroll tax rate %
Un
emp
loym
ent
rate
'89
-94
Each dot is a country. The unemployment data, which are standardized OECD rates, and thepayroll tax data are from Nickell (1997).
The countries are Austria (unemployment = 3.7%, payroll tax rate = 22.6 per cent), Belgium (8.1,21.5), Denmark (10.8, 0.6), Finland (10.5, 25.5), France (10.4, 38.8), West Germany (5.4,23.0), Ireland (14.8, 7.1), Italy (8.2, 40.2), Netherlands (7.0, 27.5), Norway (5.5, 17.5),Portugal (5.0, 14.5), Spain (18.9, 33.2), Sweden (4.4, 37.8), Switzerland (2.3, 14.5), UK (8.9,13.8), Canada (9.8, 13.0), US (6.2, 20.9), Japan (2.3, 16.5), and Australia (9.0, 2.5). Data onpayroll taxes in New Zealand were unavailable.
Fitting an line through the scatter produces a horizontal slope. The R-squared is 0.000.

34
Figure 11
Unemployment Rates and Trade-Unionism Across Countries
1008060402000
10
20
Proportion unionized 1990s
Un
emp
loym
ent
rate
'89
-94
Each dot is a country. The unemployment data are standardized OECD rates, and the unionized-proportion variable is the proportion of workers in the country who are members of trade unions.Both series come from Nickell (1997).
The countries are Austria (unemployment = 3.7%, unionized proportion = 46.2 per cent), Belgium(8.1, 51.2), Denmark (10.8, 71.4), Finland (10.5, 72.0), France (10.4, 9.8), West Germany(5.4, 32.9), Ireland (14.8, 49.7), Italy (8.2, 38.8), Netherlands (7.0, 25.5), Norway (5.5, 56.0),Portugal (5.0, 31.8), Spain (18.9, 11.0), Sweden (4.4, 82.5), Switzerland (2.3, 26.6), UK (8.9,39.1), Canada (9.8, 35.8), US (6.2, 15.6), Japan (2.3, 25.4), Australia (9.0, 40.4), New Zealand(8.9, 44.8).
Fitting a line through the scatter produces a negative slope. The R-squared is approximately 0.00.
35
Some of the Evidence for Idea 4
(The rise of home-ownership and the decline of the private rental housing sector may havebeen an important contributor to high unemployment.)

36
Table 6
"Would You be Willing to Move to a Different Areato Find an Acceptable Job?"
People who are currently unemployed, and who think it will take them at leastanother 3 months to find work, answer:
Proportion of the private renters saying yes 40%Proportion of the council house tenants saying yes34%Proportion of the home-owners saying yes 24%[Total sample = 600 individuals]
People who are currently in work, but who would expect to take at least 3 monthsto find an acceptable job if they lost their current job, answer:
Proportion of the private renters saying yes 47%Proportion of the council house tenants saying yes33%Proportion of the home-owners saying yes 35%[Total sample = 2500 individuals]
Source of the data: British Social Attitudes Surveys, pooled, 1983-1994.
Note: The same patterns are found in regression equations that include personal characteristic variables, region andindustry dummies, year dummies, etc.

37
Figure 12
Home-Ownership and Unemployment: The Countries ofNorth America and Europe in 1960
7060504030200
1
2
3
4
5
6
Home ownership % 1960
Un
emp
loym
ent
% 1
960
Each dot is a country. The countries are Austria (u = 2%, h = 38%), Belgium (2.4, 50), Canada(4.7, 66), Denmark (1.5, 43), France (1.7, 41), West Germany (0.7, 29), Ireland (5, 60), Italy(3.6, 45), Netherlands (1.1, 29), Norway (2, 53), Spain (2.4, 52), Sweden (1.6, 36),Switzerland (0.1, 34), United Kingdom (2.6, 42) and United States (4.7, 64).
The unemployment rates are from the OECD and are as close as can be obtained to standardizeddata for that era. I have omitted Finland from the Figure because I have doubts about the reliabilityof its data: it has the lowest male employment/population ratio in the sample while recordingostensibly low unemployment. I have omitted the Communist bloc because data are not available.The home ownership rates are so-called 'owner-occupation' proportions from national censuses,and were provided by Francis Castles of the Political Science Program, RSSS, Australian NationalUniversity, Canberra.

38
Figure 13
The Previous Figure with a Best-Fitting Line
7060504030200
1
2
3
4
5
6
Home ownership % 1960
Un
emp
loym
ent
% 1
960
y = - 2.5980 + 0.11007x R^2 = 0.765
Each dot is a country. The countries are Austria (u = 2%, h = 38%), Belgium (2.4, 50), Canada(4.7, 66), Denmark (1.5, 43), France (1.7, 41), West Germany (0.7, 29), Ireland (5, 60), Italy(3.6, 45), Netherlands (1.1, 29), Norway (2, 53), Spain (2.4, 52), Sweden (1.6, 36),Switzerland (0.1, 34), United Kingdom (2.6, 42) and United States (4.7, 64).
The unemployment rates are from the OECD and are as close as can be obtained to standardizeddata for that era. I have omitted Finland from the Figure because I have doubts about the reliabilityof its data: it has the lowest male employment/population ratio in the sample while recordingostensibly low unemployment. I have omitted the Communist bloc because data are not available.The home ownership rates are so-called 'owner-occupation' proportions from national censuses,and were provided by Francis Castles of the Political Science Program, RSSS, Australian NationalUniversity, Canberra.

39
Figure 14
In the 1990s, Do Countries with More Home-OwnershipHave More Unemployment?
807060504030200
10
20
Home-ownership % c.1990
Un
emp
loym
ent
rate
'89
-94
Each dot is a country. The unemployment data are standardized OECD rates from Nickell (1997),and the home-ownership data are from Oswald (1996) and come originally from UN sources.
The countries are Austria (unemployment = 3.7%, home-ownership proportion = 54 per cent),Belgium (8.1, 65), Denmark (10.8, 55), Finland (10.5, 78), France (10.4, 56), West Germany(5.4, 42), Ireland (14.8, 76), Italy (8.2, 68), Netherlands (7.0,45), Norway (5.5, 60), Portugal(5.0, 58), Spain (18.9, 75), Sweden (4.4, 43), Switzerland (2.3, 28), UK (8.9, 65), Canada(9.8, 63), US (6.2, 64), Japan (2.3, 59), Australia (9.0, 70), New Zealand (8.9, 71).

40
Figure 15
The Previous Figure with a Best-Fitting Line
807060504030200
10
20
Home-ownership % c.1990
Un
emp
loym
ent
rate
'89
-94
y = - 4.7097 + 0.21280x R^2 = 0.449
Each dot is a country. The unemployment data are standardized OECD rates from Nickell (1997),and the home-ownership data are from Oswald (1996) and come originally from UN sources.
The countries are Austria (unemployment = 3.7%, home-ownership proportion = 54 per cent),Belgium (8.1, 65), Denmark (10.8, 55), Finland (10.5, 78), France (10.4, 56), West Germany(5.4, 42), Ireland (14.8, 76), Italy (8.2, 68), Netherlands (7.0,45), Norway (5.5, 60), Portugal(5.0, 58), Spain (18.9, 75), Sweden (4.4, 43), Switzerland (2.3, 28), UK (8.9, 65), Canada(9.8, 63), US (6.2, 64), Japan (2.3, 59), Australia (9.0, 70), New Zealand (8.9, 71).

41
Figure 16
The Correlation Between the Growth in Home-Ownershipand the Growth in Unemployment: 19 Countries
from 1960 to 1990
3020100-10-200
10
20
Change in home-ownership '60-90
Ch
ange
in
un
emp
loym
ent
% '
60-9
0
y = 2.4737 + 0.18603x R^2 = 0.293
Each dot is a country. These are thirty-year changes, that is, the level in 1990 minus the level in1960. The countries here are Australia (∆u=4.9, ∆h=7), Austria (1.4, 17), Belgium (4.2, 12),Canada (1.8, -5), Denmark (7.2, 8), Finland (1.9, 10), France (7.1, 13), W.Germany (3.9, 9),Ireland (8.4, 21), Italy (2.8, 22), Japan (0.4, -10), Netherlands (6, 15), New Zealand (7.5, 2),Norway (2.9, 6), Sweden (0.3, 6), Switzerland (1.4, -4), UK (4.3, 26), USA (0.2, 0), Spain(13.7, 24).
The home ownership data were provided by Francis Castles of the Political Science Program,RSSS, Australian National University, Canberra. A Spanish observation of 52% home ownershipin 1960 was added to the data set by using UN data for that year. The unemployment data arecalculated from Table A3 of Layard, Nickell and Jackman.
Removing the single most favourable observation, Spain, changes the gradient of the line toapproximately 0.13.

42
Figure 17
The Growth of Home-Ownership and Unemployment Acrossthe States of the USA: 1970 to 1990
20100-10-4
-2
0
2
4
6
Change in home-ownership '70-90
Ch
ange
in
un
emp
loym
ent
'70-
90
Each dot is a state. These are twenty-year changes, that is, the 1990 figure minus the 1970 figure.There are 49 observations, one for each of the mainland states of the US (Hawaii and Alaska areomitted) plus DC. The axes are in percentage points; thus a state that went from 4% to 5%unemployment and from 40% home-ownership to 46% home-ownership would appear as (1, 6).

43
Figure 18
The Previous Figure with a Best-Fitting Line
20100-10-4
-2
0
2
4
6
Change in home-ownership '70-90
Ch
ange
in
un
emp
loym
ent
'70-
90
y = 0.64793 + 0.21358x R^2 = 0.248
Each dot is a state. These are twenty-year changes, that is, the 1990 figure minus the 1970 figure.There are 49 observations, one for each of the mainland states of the US (Hawaii and Alaska areomitted) plus DC.
Omitting the three most favourable observations (Utah, Washington, and DC) would alter thegradient of the fitted line to 0.11.
44
Table 7
Looking Across Regions Within Individual Countries
Country The slope of the relationship between a region's Number of observations unemployment and the region's home-ownership
United States* 0.20 510United Kingdom* 0.21 244
France 0.12 22Italy 0.14 20Sweden 0.15 8Australia 0.19 8Canada 0.29 9Finland 0.23 6Spain 0.29 16
But a few countries do not fit:
Netherlands zero 12Belgium -0.10 10W. Germany -0.03 10
The US and UK estimates are more reliable than those for the other countries[technical note: a star* signifies a longitudinal (panel) analysis with controls foryear dummies, area dummies, and lags]. Details are in Oswald (1996). Theother results are from simple regional cross-sections in the 1990s.

45
Table 8
An Equation to Explain Nations' Unemployment Rates
(using data on 19 OECD countries from the 1960s to the 1990s)
Unemployment rate = 0.17 home-ownership rate + 0.06 unemployment benefit
generosity + 0.08 proportion of workers who are in trade unions + a
constant + demand influences such as oil prices
Table 9
If this equation is right, what does it imply about unemploymentin the UK in the 1990s?
It implies:
1. Home-ownership growth has added around 5 percentage points to the UKunemployment rate since 1960.
2. The reduction in unemployment benefit generosity has reduced the UKunemployment rate by 0.5 percentage points.
3. The fall in union membership has reduced the UK unemployment rate by 0.5percentage points.
4. Oil prices have had important, but only temporary, effects.

46
Table 10
Which Features of Economies are Most Highly Correlatedwith Unemployment Rates?
Rank Variable Explanatory power (out of 100%)*
1 (highest correlation) Home-ownership rate 33%2 Benefit duration 28%3 Employer coordination 26%4 Active labour market policy 7%5 Union coverage 6%6 Labour standards 4%7 Union coordination 3%8 Benefit replacement ratio 1%9 (weakest correlation) Union density 1%
* This is based on data on 20 countries for the early 1990s, and tells us how well the whole scatterof 20 unemployment dots can be 'explained' statistically solely by the variable in question. It canbe seen how poorly most of the listed variables do alone. A perfect correlation would be 100%,meaning that every nation's unemployment rate was exactly explained. Looking across countries,it can be seen that unemployment is more highly correlated with home-ownership than any of theconventional variables.
The data on all but home-ownership were kindly provided to me by Steve Nickell and are reportedin his paper Nickell (1997). The unemployment rates and all nine explanatory variables are for theearly 1990s. Following Nickell (1997), in this table the benefit duration variable is set to 4 years ifduration is indefinite. If indefinite duration is instead proxied by 10 years, explanatory power fallsto around 10%.
This table effectively provides a statistical description of the data. It is not meant to be interpretedas suggesting that only one variable should be used to explain unemployment rates.

47
APPENDIX
UK Regions with Large Proportions of Private Renters Have High Outflows fromUnemployment and Large Numbers of Movers per Head
111098765130
140
150
160
170
180
190
% Private renters 1989
Ou
tflo
w r
ate
from
un
em (
Rob
son
) y = 81.396 + 9.3659x R^2 = 0.860
121086420.01
0.02
0.03
% Private renters 1989
Gro
ss #
mov
ers
per
hea
d
y = 1.6746e-3 + 2.2522e-3x R^2 = 0.793
Notes: overleaf

48
Notes to Appendix Figures . Each dot is a region. The data on outflows -- measuring the rate thatpeople leave from unemployment into employment -- are taken from Table 2 of M. Robson, "TheCompetitiveness of Unemployed Job-Seekers: Evidence from British Regional Data", mimeo,University of Newcastle, May 1997. The regions are South-East (outflow rate 161.3 %), EastAnglia (180.9), South West (169.3), East Midlands (152.9), West Midlands (130.7), Yorks andHumberside (148.1), North West (137.2), North (139.8), Wales (149.5), Scotland (146.7).The number of movers is the gross number of people leaving the region (expressed here as apercentage of that region's resident population). The data are based on National Health Servicerecords on patients re-registering in other parts of the UK. The population and movers data comefrom Tables 4.9 and 4.7 of Regional Trends 26 (1991 Edition). The data on the proportion ofprivate renters come from the same publication, Table 5.2. Net inter-regional migration in the UKis small, so a similar picture would be produced by using the gross number of those entering theregion.
References
Andrews, F.M. and Withey, S.B. (1976). Social Indicators of Well-B eing , Plenum, New York.Argyle, M. (1989). The Psychology of Happiness , Routledge, London.Balchin, P. (1996). (ed.) Housing Policy in Europe , Routledge, London and New York.Bean, C.R. (1994). "European Unemployment: A Survey", Journal of Economic Literature , 32, 573-619.Bjorklund, A. (1985). "Unemployment and Mental Health: Some Evidence from Panel Data", Journal of Human Resources , 20, 469-483.Blanchard, O.J. and Katz, L. (1997). "What We Know and Do Not Know About the Natural Rate ofUnemployment", Journal of Economic Perspectives .Blanchard, O.J. and Summers, L.H. (1986). "Hysteresis and the European Unemployment Problem", in Fischer, S.(ed.) NBER Macroeconomics Annual , pp. 15-78, MIT Press: Cambridge, MA.Blanchflower, D.G. and Oswald, A.J. (1994). The Wage Curve , MIT Press: Cambridge, MA.Bover, O., Muellbauer, J. and Murphy, A. (1989). "Housing, Wages and UK Labour Markets", Oxford Bulletin of Economics and Statistics , 51, 97-136.Bruno, M. and Sachs, J. (1985). Economics of Worldwide Stagflation , Basil Blackwell: Oxford.Carruth, A.A., Hooker, M. and Oswald, A.J. (1998). "Input Prices and Unemployment Equilibria: Theory andEvidence for the United States", Review of Economics and Statistics , forthcoming.Clark, A.E. (1996). "Working and Well-Being: Some International Evidence", mimeo, OECD.Clark, A.E. and Oswald, A.J. (1994). "Unhappiness and Unemployment", Economic Journal , 104, 648-659.Diener, E. (1984). "Subjective Well-Being", Psychological Bulletin , 95, 542-575.Di Tella, R. and MacCulloch, R. (1996). "The Determination of Unemployment Benefits", mimeo, OxfordUniversity.Di Tella, R., MacCulloch, R. and Oswald, A.J. (1997). "The Macroeconomics of Happiness", paper presented at anNBER macroeconomics conference, Cambridge Mass., November 1997.Edin, P-A. (1988). Individual Consequences of Plant Closures , Uppsala University, doctoral dissertation.Freeman, R.B (1988). "Labour Market Institutions and Economic Performance", Economic Policy , 6, 64-78.Gallie, D. and Russell, H. (1995). "Unemployment, Gender and Life Satisfaction", mimeo, Nuffield College.Gerlach, K. and Stephan, G. (1996). "A Paper on Unhappiness and Unemployment in Germany", Economics Letters , 52, 325-330.Green, A.E. (1994). "The Role of Migration in Labour-Market Adjustment: The British Experience in the 1980s", Environment and Planning , 26, 1563-1577.Henley, A. (1996). "Residential Mobility, Housing Wealth and the Labour Market", mimeo, University of Wales atAberystwyth, October 1996.Hogarth, T., Elias, P. and Ford, J. (1996). Mortgages, Families and Jobs , Institute of Employment Research,University of Warwick.Hughes, G.A. and McCormick, B. (1981). "Do Council House Policies Reduce Migration between Regions?", Economic Journal , 91, 919-937.

49
Hughes, G.A. and McCormick, B. (1985). "Migration Intentions in the UK: Which Households Want to Migrateand Which Succeed?", Economic Journal , 95, Supplement, 113-123.Hughes, G.A. and McCormick, B. (1987). "Housing Markets, Unemployment and Labour Market Flexibility in theUK", European Economic Review , 31, 615-645.Jackson, P.R., Stafford, E.M., Banks, M.H. and Warr, P.B. (1983). "Unemployment and Psychological Distress inYoung People: The Moderating Role of Employment Commitment", Journal of Applied Psychol ogy , 68, 525-535.Jahoda, M. (1982). Employment and Unemployment: A Social Psychological Approach , Cambridge UniversityPress, Cambridge.Junankar, P.N. and Madsen, J.B. (1994). "Unemployment in the OECD: Models, Myths and Mysteries", mimeo,Australian National University.Kammerling, R.M. and O'Connor, S. (1993). "Unemployment Rate as Predictor of Rate of Psychiatric Admission", British Medical Journal , 307, 1536-1539.Korpi, T. (1994). Escaping Unemployment , Dissertation Series: Swedish Institute for Social Research, Stockholm.Korpi, T. (1997). "Is Utility Related to Employment Status?", Labour Economics , forthcoming.Layard, R., Nickell, S.J. and Jackman, R. (1991). Unemployment: Macroeconomic Performance and the Labour Market , Oxford University Press: Oxford.Lindbeck, A. (1990). "Remaining Puzzles and Neglected Issues in Macroeconomics", in Honkapohja, S. (ed.) The State of Macroeconomics , Basil Blackwell, Oxford.Lindbeck, A. (1993). Unemployment and Macroeconomics , MIT Press: Cambridge, Mass.McCormick, B. (1983). "Housing and Unemployment in Great Britain", Oxford Economic Papers , 35, 283-305.McCormick, B. (1996). "Regional Unemployment and Labour Mobility in the UK", mimeo, SouthamptonUniversity.Nickell, S.J. (1997). "Unemployment and Labor Market Rigidities: Europe Versus North America", J ournal of Economic Perspectives , 11, Summer, 55-74.OECD (1994). Jobs Study , Paris.Oswald, A.J. (1996). "A Conjecture on the Explanation for High Unemployment in the Industrialized Nations: PartI", Warwick Economics Research Paper, #475, December.Oswald, A.J. (1997). "Happiness and Economic Performance", Economic Journal , forthcoming.Oswald, A.J. (1998). "Home-Ownership and Unemployment", Correspondence, Journal of Economic Perspectives ,forthcoming.Owen, D. and Green, A. (1997). "Analysis of Geographical Mobility", working paper, Institute of EmploymentResearch, University of Warwick.Oxley, M. and Smith, J. (1996). Housing Policy and Rented Housing in Europe , Spon (Chapman Hall), London.Pavot, W. (1991). "Further Validation of the Satisfaction with Life Scale: Evidence for the Cross-MethodConvergence of Well-being Measures", Journal of Personality Assessment , 57, 149-161.Phelps, E.S. (1994). S tructural Slumps , Harvard University Press: Cambridge, Mass.Pissarides, C.A. (1990). Equilibrium Unemployment Theory : Basil Blackwell, Oxford.Platt, S. and Kreitman, N. (1985). "Para-Suicide and Unemployment among Men in Edinburgh 1968-82", Psychological Medicine , 291, 1563-1566.Wadsworth, J. (1995). "Eyes Down for a Full House: Employment Polarisation and the Housing Market", mimeo,Royal Holloway College, London University.Warr, P.B. (1978). "A Study of Psychological Well-Being", British Journal of Psychology , 69, 111-121.Warr, P.B. (1987). Work, Unemployment , and Mental Health. Oxford University Press, Oxford.Warr, P.B., Jackson, P. and Banks, M. (1988). "Unemployment and Mental Health: Some British Studies", Journal of Social Issues , 44, 47-68.Watson, D. and Clark, L. (1991). "Self Versus Peer Ratings of Specific Emotional Traits: Evidence of Convergentand Discriminant Validity", Journal of Personality and Social Psychology , 60, 927-940.Whelan, C.T.(1992). "The Role of Income, Life-Style Deprivation and Financial Strain in Mediating the Impact ofUnemployment on Psychological Distress: Evidence from the Republic of Ireland", Journal of Occupational and Organizational Psychology , 65, 331-344.Wilcock, R. (1957). "Employment Effects of a Plant Shut-Down in a Depressed Area, Monthly Labor Review ,September.Winkelmann, L. and Winkelmann, R. (1997). "Why Are the Unemployed so Unhappy? Evidence from Panel Data", Economica , forthcoming.