Embed Size (px)
Citation preview
NBER WORKING PAPER SERIES
THE MISSING PROFITS OF NATIONS
Thomas R. TørsløvLudvig S. WierGabriel Zucman
Working Paper 24701http://www.nber.org/papers/w24701
NATIONAL BUREAU OF ECONOMIC RESEARCH1050 Massachusetts Avenue
Cambridge, MA 02138June 2018
We thank the Danish Tax Administration for data access and many conversations, Alan Auerbach,Johannes Becker, Richard Bolwijn, Iain Campbell, Kimberly Clausing, Alex Cobham, Mihir Desai,Michael Devereux, Fritz Foley, Maya Forstater, Teresa Fort, Jason Furman, Martin Hearson, NielsJohannesen, Petr Jansky, Michael Keen, Edward Kleinbard, Claus Kreiner, Paul Krugman, Gian MariaMilesi-Ferretti, Casey Mulligan, Gaetan Nicodeme, Mitchell Petersen, Thomas Piketty, Nadine Riedel,Dani Rodrik, Emmanuel Saez, Antoinette Schoar, Juan Carlos Suarez Serrato, Amir Sufi, Felix Tintelnot,John Van Reenen, Eric Zwick, and numerous seminar and conference participants for helpful commentsand reactions. Zucman acknowledges financial support from the FRIPRO program of the ResearchCouncil of Norway. The authors retain sole responsibility for the views expressed in this research.An online appendix and all data are available online at http://gabriel-zucman.eu/missingprofits. Theauthors retain sole responsibility for the views expressed in this research, which do not necessarilyreflect the views of the National Bureau of Economic Research.
NBER working papers are circulated for discussion and comment purposes. They have not been peer-reviewed or been subject to the review by the NBER Board of Directors that accompanies officialNBER publications.
© 2018 by Thomas R. Tørsløv, Ludvig S. Wier, and Gabriel Zucman. All rights reserved. Short sectionsof text, not to exceed two paragraphs, may be quoted without explicit permission provided that fullcredit, including © notice, is given to the source.

The Missing Profits of NationsThomas R. Tørsløv, Ludvig S. Wier, and Gabriel Zucman NBER Working Paper No. 24701June 2018, Revised August 2018JEL No. F23,H26,H87
ABSTRACT
By exploiting new macroeconomic data known as foreign affiliates statistics, we show that foreignfirms are an order of magnitude more profitable than local firms in tax havens, but less profitable thanlocal firms in other countries. Leveraging this differential profitability, we estimate that close to 40%of multinational profits are shifted to tax havens globally each year. The non-haven European Unioncountries appear to be the main losers from this shifting. We show theoretically and empirically thatin the current international tax system, tax authorities of high-tax countries do not have incentivesto combat profit shifting to tax havens. They instead focus their enforcement effort on relocating profitsbooked in other high-tax places. This policy failure can explain the persistence of profit shifting totax havens despite the sizable costs involved for high-tax countries. We provide a new internationaldatabase of GDP, trade balances, and factor shares corrected for profit shifting, showing that the riseof the global corporate capital share is significantly underestimated.
Thomas R. TørsløvUniversity of Copenhagen,Øster Farimagsgade 5DK-1353 [email protected]
Ludvig S. WierUniversity of CopenhagenØster Farimagsgade 5DK-1353 [email protected]
Gabriel ZucmanDepartment of EconomicsUniversity of California, Berkeley530 Evans Hall, #3880Berkeley, CA 94720and [email protected]
A Appendix and Data is available at http://gabriel-zucman.eu/missingprofits/

1 Introduction
Perhaps the most striking development in tax policy throughout the world over the last few
decades has been the decline in corporate income tax rates. Between 1985 and 2018, the global
average statutory corporate tax rate has fallen by more than half, from 49% to 24%. In 2018,
most spectacularly, the United States cut its rate from 35% to 21%. One often cited reason
for this decline is that globalization makes countries compete for capital. By cutting their tax
rates, countries can attract more machines, plants, and equipment, which makes workers more
productive and boosts their wage (see Keen and Konrad, 2013, for a survey of the large literature
on tax competition).
Our paper asks a simple question: globally, how much profits move across borders today
because of differences in corporate income tax rates? Imagine that all countries agreed tomorrow
to adopt the same tax rate. By how much would the profits booked in the United States, the
European Union, and developing countries increase—and by how much would they fall in low-tax
places like Ireland? And would a lot of tangible capital move back to today’s high tax-countries,
or would firms merely change the location of paper profits without many tangible assets moving
across borders?
These questions matter for core issues in macroeconomics and public finance. First they
matter for understanding the redistributive impacts of globalization—that is, which countries
(and social groups) have gained most from it, and which have gained less or lost. Second, they
are of interest to policymakers, who would like to know how much capital their country could
realistically attract by cutting its rate, the extent to which such a policy could contribute to
boosting wages, and how much revenue they lose today because of profit shifting to tax havens.
Third, they matter for public finance economists, who would like to better understand why
profit shifting—if its revenue costs for many governments really are high—nonetheless persists.
Last, they matter for the measurement of world economic activity. How does tax optimization
by multinationals affect the measured GDP, trade balances, and labor and capital shares of the
various countries in which they operate?
To make progress in addressing these questions, we make two contributions. The first—
and most important one—is to produce a new global database of where profits are booked by
multinational companies today. Until recently, it was not possible to have such a global map,
because firms usually do not publicly disclose the countries in which their profits are booked, and
national accounts data did not make it possible to study multinational corporations separately
from other firms. But in recent years, the statistical institutes of most of the world’s developed
1
countries—including the major tax havens—have started releasing new macroeconomic data
known as foreign affiliates statistics. Following new international guidelines, these statistics
record the amount of profits made by affiliates of foreign multinational companies and the
wages these affiliates pay. They make it possible to break down the national account aggregates
of the main tax haven and non-haven countries by firm ownership—foreign-owned firms vs. local
firms. We use these data to quantify the international mobility of profits. Although a large
literature studies profit shifting by U.S. multinationals (e.g., Clausing, 2016), and a number of
recent papers attempt to estimate the total amount of profits shifted globally (Crivelli, de Mooij
and Keen, 2015; UNCTAD, 2015), to our knowledge it is the first time that profits gains and
losses for each country are estimated based on directly observable data covering the activities
of all multinationals in tax havens.1 Our goal is to update this database annually, so as to be
able to monitor the changing distributional implications of financial globalization and to study
the effects of ongoing corporate tax policy reforms throughout the world.
We stress at the outset that we are well aware of the deficiencies of existing foreign affiliates
statistics and national account data. The complex structures used by multinationals to organize
their global activity raise considerable challenges for statistical authorities. But these macro
data are at present the most comprehensive that exist to study the activities of multinational
corporations globally. In addition, we feel that the best way for scholars to contribute to future
data improvement is to use the existing statistics in a systematic manner, so as to better identify
their limits and how these limits could be overcome. Our article, therefore, can also be viewed as
an attempt to assess the internal consistency of the foreign affiliates statistics of all the world’s
countries, and to pinpoint the areas in which progress needs to be made.
Using our new database, we document a new and striking fact. Foreign firms are system-
atically more profitable than local firms in some countries (namely, tax havens) but not in
others. For local firms, the ratio of pre-tax profits to wages is typically around 30%–40% in
both high-tax countries and tax havens. But for foreign firms in tax havens, the ratio is an
order of magnitude higher—as much as 800% in Ireland. This corresponds to a capital share of
corporate value-added of 80%–90% (vs. around 25% in local firms). By contrast, in non-haven
countries, foreign firms are systematically less profitable than local firms. Global macro data
thus show a large redistribution of profits within divisions of multinational companies, away
1Cobham and Jansky (2018) estimate country-level tax revenue losses due international corporate tax avoid-ance, but these estimates are based on indirect inferences from the cross-country relationship between thecorporate tax revenue collected by each country and the statutory tax rates of other countries, not direct statis-tics on the profits booked by multinationals in tax havens (the foreign affiliates statistics used in this paper).See Section 2.
2

from high-tax countries and towards low-tax places.
To better understand the high profits booked by multinationals in tax havens, we provide
decompositions into real effects (more tangible capital used by foreign firms in tax havens) and
profit shifting effects (above-normal returns to capital and receipts of interest). This distinction
matters because these two processes have different distributional implications. Movements of
tangible capital across borders affect wages, since tangible capital has a finite elasticity of
substitution with labor. By contrast, movements of paper profits (i.e., profit shifting) don’t: for
a given global profitability, whether income is booked in the United States or in Bermuda has no
reason to affect workers’ productivity in either of these places. Our results show that the high
profits-to-wage ratios of multinationals in tax havens are essentially explained by shifting effects.
Tangible capital is internationally mobile—and there is evidence that this mobility has become
slightly more correlated with tax rates over the last twenty years. But globally, machines don’t
move massively to low-tax places; paper profits do.
Exploiting these facts and new bilateral balance of payments data recently published by tax
havens, we develop a methodology to estimate how much profits are shifted into each haven
and how much each country loses in profits from such shifting. Our computations are relative
to a benchmark in which all countries would have the same tax rate keeping everything else (in
particular the definition of the corporate tax base and world profits) fixed. Globally, we find
that close to 40% of multinational profits—defined as profits made by multinational companies
outside of the country where their parent is located—are shifted to tax havens in 2015. The
governments of the (non-haven) European Union countries appear to be the prime losers of this
shifting. When we look at where the firms that shift profits are headquartered, we find that
U.S. multinationals shift comparatively more profits than multinationals from other countries.
The shareholders of U.S. multinationals thus appear to be the main winners from global profit
shifting. Moreover, we find that the governments of tax havens derive sizable benefits from
this phenomenon: by taxing the large amount of paper profits they attract at very low rates
(less than 5%), they have been able to generate more tax revenue, as a fraction of their national
income, than the United States and non-haven European countries that have much higher rates.
Overall, financial globalization with unequal tax rates has sizable redistributive impacts. But
these impacts are different than in the textbook model of tax competition that influences much
of the discussion about tax policy (such as the decision by the United States to reduce its rate
in 2017; e.g., Council of Economic Advisors, 2017). Instead of affecting wages, it redistributes
tax bases across nations, for the the benefit of very low-tax places and shareholders of multina-
3

tionals. Although these results are not completely unexpected, we feel that quantifying these
redistributions transparently on the basis of readily available statistics is important to moni-
tor globalization and help design policies that may contribute to making it more sustainable
politically and economically. A number of proposals for fundamental reforms that would make
profit shifting harder have recently been formulated, for instance the adoption of a destination-
based corporate cash flow tax (Auerbach, 2010) or the use of a formulary apportionment system
(e.g., Avi-Yonah and Clausing, 2007). Our estimates could be used to quantify how much each
country could gain in taxable profits from such reforms.
Our second contribution is to explain why, despite the sizable revenue costs involved, govern-
ments in high-tax countries have so far failed to protect their tax base from the tax avoidance
opportunities created by globalization. Our innovation is to focus on the incentives faced by tax
authorities, which had not been studied until now. We show theoretically that the fiscal author-
ities of high-tax countries do not have incentives to combat shifting to tax havens, but instead
have incentives to focus their enforcement effort on relocating profits booked by multinationals
in other high-tax countries. Chasing the profits booked in other high-tax places is feasible (the
information exists), cheap (there is little push-back from multinationals, since it does not affect
much their global tax bill), and fast (a framework exists to settle disputes between high-tax
countries quickly). This type of enforcement crowds out enforcement on tax havens, which is
hard (little data exists), costly (as multinationals spend large resources to defend their shifting
to low-tax locales), and lengthy (due to a lack of cooperation by tax havens).
We analyze data on tax disputes between tax authorities. Consistent with the theory, our
analysis shows that the vast majority of high-tax countries enforcement effort are directed at
other high-tax countries. In effect, non-haven countries steal revenue from each other while
letting tax havens flourish.
This result suggests that some of the current policy efforts aimed at reducing tax avoidance
by multinationals might in fact, and quite counter-intuitively, exacerbate it. The OECD has
launched an initiative to curb base erosion and profit shifting. Action 14 of this plan calls for
more effective dispute resolution mechanisms (OECD, 2015). But the easier it is for, say, the
French tax authority to relocate profits booked in Germany, the less resources it may devote
to chasing the profits shifted to Bermuda—potentially increasing shifting to low-tax locales.
And indeed, our results show that countries without functioning dispute resolution mechanisms
are more likely to focus their efforts on tax havens today. A more effective way for high-tax
countries to curb profit shifting might be to impose economic sanctions to the jurisdictions that
4

enable it (Zucman, 2015) or to change how corporate profits are taxed.
Last, our findings show that headline economic indicators, including GDP, trade balances,
and corporate labor and capital shares, are significantly distorted. The flip side of the profits
shifted to tax havens is that output, net exports and profits recorded in non-haven countries
are too low. We provide a new database of corrected macro statistics for all OECD countries
and the largest emerging economies. Adding back the profits shifted out of high-tax countries
increases the corporate capital share significantly. By our estimates, the rise in the European
corporate capital share since the early 1990s is twice as large as recorded in the national account
data used, e.g., by Karabarbounis and Neiman (2014). This finding has implications for current
debates about the changing nature of technology and inequality.
The rest of this paper proceeds as follows. In Section 2 we relate our work to the literature.
Section 3 outlines our conceptual framework and data. We present our estimate of the amount
of profits shifted to each tax haven in Section 4, before analyzing the implications of this
phenomenon for non-haven countries in Section 5. Section 6 analyzes the incentives that tax
authorities face and studies their enforcement efforts. We present our corrected estimates of
GDP, trade balances, and factor shares in Section 7, and provide concrete proposals to improve
economic statistics and the monitoring of global activity in the conclusion (Section 8). There
are numerous intricacies in the ways multinationals structure their global activities and in the
international statistics used in this paper. The most important ones are discussed in the article;
others are detailed in a comprehensive Online Appendix that enable the reader to reproduce
all our estimates step by step starting from publicly available data. All the data used in this
research are available online too.2
2 Related Literature
We start by relating our work to previous attempts to estimate profit shifting. The main
difference between our work and previous studies is the following. Most of the literature uses an
indirect method to estimate profit shifting, extrapolating from the correlation between tax rates
and reported pre-tax profits (at the firm or country level). By contrast, we base our analysis on
the directly observable amount of profits booked by multinationals in tax havens globally—using
data that were not available until recently. This difference has important implications, as we
explain in this Section. We refer the reader to Appendix Section D for a detailed comparison
of our results with earlier estimates.
2The Appendix and dataset are available online at http://gabriel-zucman.eu/missingprofits.
5

2.1 Microeconometric Estimates of Profit Shifting
A large body of work studies profit shifting using corporate financial and balance-sheet micro-
data, collected in the Orbis database of Bureau van Dijk.3 Profit shifting is estimated by running
regressions of the following form:
log(πic) = α + β(τp − τc) + δF irmi + γCountryc + εic (1)
where πic denotes the pre-tax profits booked by company i in country c, τc the tax rate in country
c, τp the tax rate in the company’s parent’s country, and Firmi and Countryc firms and country
controls. A positive β is interpreted as evidence of profit shifting, and the global amount of
profits shifted for tax reasons is extrapolated from the estimated β. The OECD (2015) uses this
methodology for its official estimate of the size of base erasion and profit shifting (see Johansson
et al., 2017).4
One limitation of this procedure is that little micro-data exists about the profits booked
by multinationals in low-tax countries. Orbis provides accurate information about the global
consolidated profits of most of the world’s multinationals (see, e.g., Cobham and Loretz, 2014).
Multinational companies, however, are generally not required to publish their profits country
by country or subsidiary by subsidiary. Orbis relies on administrative information in public
business registries (collected by Chambers of Commerce throughout the world) to record how
much profits multinationals make in their various subsidiaries. Because countries such as France
maintain comprehensive registries, almost all the profits made by French resident firms (includ-
ing subsidiaries of foreign multinationals) can be seen in Orbis. In 2010 for instance, the national
accounts of France report that French resident corporations made $240 billion in pre-tax profits
after net interest payments. In Orbis one finds a very close figure, $237 billion. But in many
countries public registries are much more limited: they either do not exist (e.g., Bermuda), or
when they do no income information is available (e.g., United States, Ireland, Switzerland).5 As
3See Kalemli-Ozcan et al. (2015) for a presentation of these data.4The literature considers four measures for the incentives to shift profits: (1) the differential with the tax rate
of the parent’s country (e.g., Dharmapala and Riedel, 2013); (2) the weighted tax rate differential with all othersubsidiaries (e.g., Huizinga and Laeven, 2008); (3) the unweighted tax rate differential with other subsidiaries(e.g., Johansson et al. 2017), and (4) the simple corporate tax rate (e.g., Lohse and Riedel, 2013). On a prioriground, it is unclear which of these measures is preferable. Heckemeyer and Overesch (2013) give an overviewof 26 studies using this approach; see also Wier (2018).
5In the Spring of 2017, the United Kingdom announced that it would mandate its overseas territories (e.g.,Bermuda, the British Virgin Islands, and the Cayman Islands) to develop public registries of the owners ofcompanies formed there by the end of 2020. This initiative doesn’t capture the Crown Dependencies (such asJersey, Guernsey and Isle of Man). It is unclear whether income or balance sheet information will be madeavailable in these registries.
6

a result, much of the profits booked by multinationals in these countries are not visible in Or-
bis. For instance, as shown by Figure 1, Orbis correctly reports that the worldwide consolidated
profits of Apple were 55.3 billion euros in 2016. But if one adds up all the profits recorded in
Orbis by all of Apple’s subsidiaries throughout the world, then one finds only 2.0 billion euros.
None of the profits made by Apple in the United States or in Ireland, Jersey, or similar tax
havens—which are known to be used by Apple6—are visible. Similarly large discrepancies are
observed for Google Alphabet, Facebook, and Nike.
In Figure 2, we compare the true consolidated global profits of each multinational in Orbis
to the sum of its subsidiary-by-subsidiary profits. In 2012, only 17% of the global profits of
multinationals could be traced in Orbis—83% were booked in subsidiaries unknown to Orbis, or
for which no profits data was available. The problem is particularly acute for low- and zero-tax
countries.7
The limited reporting of data in tax havens, already noted in the literature (e.g., Dowd et
al., 2017), has two implications. First, it means that estimating equation 1 above with publicly
available financial accounts data is likely to deliver estimates of β that are downwards biased.
It is only in the special case where the semi-elasticity of profit shifting with respect to tax rate
differentials is constant that the estimated β is unbiased.8 But there is evidence in the literature
that the shifting elasticity is highly nonlinear, with far more responsiveness at lower tax rates
than at higher ones.9 Further, one may imagine that multinational companies usually try to
shift profits in a discreet manner (e.g., for public relation reasons). In the extreme case where
they only shift profits to subsidiaries that do not publish income statements, then the estimated
β in Orbis is zero, while in actual facts it is positive and possibly large. This bias could explain
the puzzling disconnect noted by Dharmapala (2014) between the relatively small estimated
profit shifting elasticities from recent research and the “anecdotal evidence suggesting extensive
6See for instance the detailed U.S. Senate (2014) investigation on Apple’s corporate tax structure; see also theanalysis of leaked documents from the “Paradise Papers” at https://www.nytimes.com/2017/11/06/world/
apple-taxes-jersey.html.7A number of papers study shifting by U.S. multinationals using data from the Bureau of Economic Analysis
on the activities of U.S. multinationals abroad (see, e.g., Desai et al., 2003, Clausing, 2009) and IRS data(e.g., Altshuler and Grubert, 2005; Grubert, 2013; Dowd, Landefeld and Moore, 2017, and De Simone, Millsand Stomberg, 2017). These data do not suffer from the problems in Orbis, as U.S. multinationals have to(confidentially) report information on all their subsidiaries to the BEA and to the IRS. These data, however, canonly be used to study shifting by U.S. multinationals, while we are interested in shifting by all multinationals.
8Even in this case, extrapolating the global amount of profits shifted from β requires to be able to observe inwhich countries multinationals have subsidiaries—which is not possible in Orbis, since subsidiaries in countrieswith no public corporate registry are not visible.
9For instance, using U.S. corporate income tax data, Dowd et al. (2017) find tax semi-elasticities of 4.7 atcorporate tax rates of 5 percent and 0.6 at tax rates of 30 percent. See also Wier and Reynolds (2018).
7

income shifting among major multinational corporations.” Second, estimating equation 1 with
financial accounts micro-data can lead to biased inferences about the location of shifted profits.
For instance, if only high-tax countries have public registries, then one can find that all profit
shifting takes place between high-tax countries—whereas in actual facts this shifting may be
second-order relative to the shifting to low-tax countries.10
The main contribution of our paper is to bring in direct evidence on the amount of profits
that multinationals book in tax havens by drawing on two key data sources that had not been
used in the literature so far. First, and most importantly, we exploit new foreign affiliates
statistics published by the world’s largest economic and financial centers. Such data have been
compiled in the United States as far back as 1950. But in most European countries—including
key countries such as Ireland, Luxembourg, and the Netherlands—the publication of these
statistics started only around 2010. These data allow us to directly observe the amount of
profits booked by foreign firms in the world’s prominent tax havens. Second, we collect and
exploit the national account data of the smaller tax havens (including places like Bermuda, the
Cayman Islands, the British Virgin Islands, etc.) in a systematic manner. These countries do
not currently publish foreign affiliate statistics, but because most (sometimes all) of the activity
in these offshore financial centers takes place in affiliates of foreign multinationals, their national
account aggregates provide useful information for our purposes.
The macro data we use in this paper are more comprehensive than the data available in
Orbis or similar databases, for one simple reason. While Orbis has to rely on publicly available
corporate registries, statistical authorities have access to a much broader set of information
to compile their foreign affiliates and national account statistics—most importantly corporate
income tax returns, censuses of the activities of domestic and foreign corporations, and (private)
income statements and balance sheets. As a result, the flow of profits recorded in these macro
data is much larger than the one in Orbis. However, the macro data of tax havens are still
imperfect and need to be corrected, as we discuss below.
10Inferring the amount of profits shifted globally from financial accounts micro data (using variants of equation1 above) faces other limitations which have been noted in the literature. Most of the work in this area focuseson estimating the marginal effects of tax differentials on reported pre-tax profits. This raises a number of issues.First, as already noted, it is unclear which tax differential matters to capture the incentives to shift profits.Second, it is unclear that marginal tax differentials matter much in explaining the behavior of multinationalcompanies. The most prominent cases of profit shifting involve corner solutions where highly valuable intangibleassets are shifted once and for all, independently of any change in tax laws. Third, the standard approach (assummarized by equation 1 above) under-estimates profit shifting if all firms shift profits, with the ones that havea parent in a low-tax country simply shifting more. Last, this approach misses modern forms of profit shifting,where a firm is incorporated in a tax haven (say Luxembourg), and from there directly sells services (such asdigital subscriptions to music or movie databases) to foreign clients without any subsidiary abroad.
8

2.2 Macro Estimates of Profit Shifting
A nascent literature takes a macro perspective to study multinationals’ profit shifting. The
OECD (2015) itself, while it used Orbis for its official BEPS estimate, also suggested that
global macro data be used to estimate profit shifting.
Most of this macro literature uses U.S. statistics, hence focuses on U.S. multinationals only
(Clausing, 2009, 2016; Gravelle, 2009; Zucman, 2014; Guvenen et al., 2018). In this paper, by
contrast, we take a global perspective: we estimate profit shifting by all the world’s multina-
tionals and the implications of this phenomenon for each OECD country, the main emerging
economies, and tax havens. Our results are thus relevant for policy-makers across the world
and make it possible to put the United States in an international perspective (e.g., to show that
U.S. multinationals shift significantly more profits than other multinationals in 2015).
Two recent studies, UNCTAD (2015) and Crivelli, de Mooij and Keen (2015), use global
macro data to study profit shifting and are the most closely related to our work.11 Our paper,
however, uses completely different data and methodologies. UNCTAD (2015) and Crivelli, de
Mooij and Keen (2015) do not base their estimates on the tax haven data (foreign affiliates
statistics and bilateral balances of payments) that are central to our estimation procedure.12
The new data we use in this paper allow us to push knowledge forward in a number of directions.
First and most importantly, the foreign affiliates statistics allow us to directly observe the profits
booked by multinationals in tax havens and to compute factor shares in foreign vs. local firms
across the world. This enables us to have a simple and transparent estimate of profit shifting
(based on the abnormally high capital share reported by foreign firms in tax havens) that can be
easily tracked by policy makers on a year-to-year basis.13 Second, while UNCTAD (2015) and
Crivelli, de Mooij and Keen (2015) focus on the global tax revenue losses caused by international
corporate tax avoidance (and study broad groups of countries such as advanced vs. developing
economies), our data and methodology allow us to estimate the profits losses for OECD countries
11These studies are replicated and tested for robustness in Jansky and Palansky (2017) and Cobham andJansky (2018).
12Instead, they rely on the balance of payments and FDI statistics of non-haven countries (UNCTAD, 2015)or corporate income tax revenue data (Crivelli, de Mooij and Keen, 2015). A number of papers in internationalfinance (e.g., Lane and Milesi-Ferretti, 2018) use tax havens’ international investment positions, but this litera-ture attempts to characterize patterns in international investment, not to estimate the size of profit shifting aswe do here.
13Crivelli, de Mooij and Keen (2015) infer the tax revenue losses due to international corporate tax avoidancefor developing vs. advanced economies from the correlation between corporate tax revenue collected and thestatutory tax rates of other countries estimated in a panel model—not direct statistics on the profits booked bymultinationals in tax havens. We view the two approaches as complementary.
9

and the main emerging economies individually.14 In addition to quantifying profit losses we also
quantify the profits gains for each tax haven in a globally consistent way (i.e., such that profits
gains and losses add up globally). This enables us to estimate the benefits that tax havens
derive by taxing multinationals at very low rates, and to study how profit shifting redistributes
tax revenues across nations. Third, the new bilateral balance of payments data we use enable
us to provide a granular map of profit shifting, e.g., to quantify the amount of profits shifted
by French firms in Luxembourg, German corporations in the Netherlands, etc.—which was not
possible with earlier approaches. Such granular data make it possible to calibrate quantitative
models of international tax competition and multinational production with profit shifting (e.g.,
Wang, 2018).
2.3 Literature on Tax Competition
Our paper is also related to the large theoretical literature on international tax competition.
While a large body of work focuses on competition for tangible capital, a number of studies
consider profit shifting, its interaction with competition for tangible capital, the incentives of tax
havens, and the costs involved for non-haven countries.15 Our contribution here is to highlight
the incentives of tax authorities, to show that these authorities do not combat shifting to tax
havens as much as one might have imagined, but instead try to relocate profits booked in
other high-tax countries, and to explain why. This insight can explain why tax avoidance by
multinationals persists despite its revenue costs for high-tax countries.
3 Conceptual Framework and Methodology
There are three main steps in our empirical analysis. We first show that there are large, sys-
tematic differences in the profitability of local vs. foreign firms: in low-tax countries, foreign
firms are much more profitable than local firms, while in high-tax countries they are less prof-
itable. Second we show that these differences mainly reflect profit shifting (not higher capital
intensities in low-tax places). Third we apportion the shifted profits to the countries where they
would have been booked absent international differences in taxes (or to the countries where
14Using the methodology in Crivelli, de Mooij and Keen (2015), Cobham and Jansky (2018) estimate country-level tax revenue losses due to international corporate tax avoidance. As in Crivelli, de Mooij and Keen (2015),these estimates are based on extrapolations from the estimated cross-country correlation between corporateincome tax revenue and foreign countries’ tax rates. A systematic reconciliation of the findings from these twodifferent methodologies is a fruitful avenue for future research.
15See Slemrod and Wilson (2009); Hong and Smart (2010); Johannesen (2010); the application of the Kanburand Keen (1993) model of commodity tax competition to profit shifting in Keen and Konrad (2013).
10

tax-avoiding multinationals are headquartered). We discuss each step in turn.
3.1 Macroeconomic Profitability Ratios
We base our analysis of profitability on macro data on corporate profits that we collected for all
the world’s countries including tax havens. Our key statistic of interest is the ratio π of pre-tax
corporate profits to wages. We are interested in how this statistic varies across countries, and
how it varies within countries but across foreign-owned (πf ) vs. local (πl) firms.
We define π at the country level as follows. Using standard notations, we denote by Y the
corporate output of a country, obtained by combining effective labor AL and capital K. We
include in the corporate sector all resident corporations, both non-financial and financial. Part
of corporate output is paid to workers, and the rest, operating surplus, accrues to the owners
of capital: Y = F (K,AL) = rK + wL. The capital share of corporate output is α = rK/Y
and the ratio of operating surplus to wages is α/(1 − α). Corporations pay p percent of their
operating surplus rK in net interest. We define (pre-tax) corporate profits as (1− p) · rK. Our
ratio of interest π measures how much profits are generated by resident firms per dollar of wage
paid: π = (1 − p) · α/(1 − α).16 We subtract net interest paid from corporations’ operating
surplus because interest payments are typically deductible from the corporate tax base while
interest received (e.g., by banks) is typically taxable. At the country level, net interest paid
by corporations is generally small (interest paid by non-financial corporations is typically offset
by interest received by financial corporations), so π is usually close to α/(1 − α). As we shall
see, the main exception involves tax havens which receive net interest from foreign countries;
for them π > α/(1 − α). We also subtract depreciation from profits, because depreciation is
deductible from taxable profits. Thus Y , α, r, and π are all net of capital depreciation.
Our main interest is to study how the profits-to-wage ratio differs for foreign corporations
(πf ) vs. local firms (πl) within each country. We compute πf and πl using the same concepts
and methods as for π. That is, πf is equal to the pre-tax profits (after net interest payments)
made by foreign firms divided by the wages paid by these firms: πf = (1−pf )·αf/(1−αf ), where
αf is the net-of-depreciation capital share of the net value-added of foreign firms. Following
internationally-agreed guidelines, foreign firms include all firms where foreign investors own more
than 50% of shares with voting rights. However this condition is sufficient but not necessary:
there are some other ways firms can be foreign-controlled (see Eurostat, 2012, for a detailed
16Our measure of wage always include non-wage employee compensation (such as retirement benefits, healthbenefits, payroll taxes, etc.). That is, “wage” in this article always refers to what is called “employee compen-sation” in the national accounts.
11
discussion). Local firms are all firms that are not foreign. By definition, π = s · πf + (1− s) · πl,where s is the share of wages paid by foreign firms.
We compute π in tax havens and non-haven countries using harmonized national accounts
data that follow the 2008 System of National Accounts (United Nations, 2009). We include in
our list of tax havens all the countries considered as havens by Hines and Rice (1993), as well
as Belgium and the Netherlands.17 The basic data source to compute π is the OECD’s detailed
national accounts by sector (Table 14A). This source covers the most prominent corporate tax
havens: Ireland, Luxembourg, Netherlands, Belgium, and Switzerland. For the other tax havens
(such as Singapore, Hong Kong, and Puerto Rico) we have gathered all the national account
data from each country’s own statistical authorities. When no national accounts were available
(which is the case for a number of Caribbean tax havens, most importantly Bermuda and
the Cayman Islands), we imputed data based on counterpart countries’ statistics, as described
in details in the Online Appendix Section A. We compute profitability for foreign vs. local
firms within each country using harmonized foreign affiliates (FATS) statistics. These data are
disseminated by Eurostat and the OECD. When no FATS data are available, we impute πf and
πl by using balance of payments data and counterpart country statistics (see Online Appendix
Section A).
Table 1 presents our database by showing its global totals. In 2015, global gross value-added
(i.e., global GDP) reached $75 trillion and global net value-added (i.e., after capital depreciation)
about $63 trillion. About 54% of global net value-added was produced by corporations; the rest
was produced by governments, households, and non-corporate businesses. Within corporations,
the capital share of net value-added was about 1/3 and the labor share about 2/3. Out of
the $11.5 trillion in net-of-depreciation corporate profits, close to 15% ($1.7 trillion) were made
in affiliates of foreign firms. This $1.7 trillion number includes all the profits made by, say,
Apple in France, Germany, Ireland, Jersey, etc., but not by Apple in the United States (where
its headquarter is located). It is what we call “multinational profits.” That is, multinational
profits include all the profits made by multinational companies outside of the country where
their parent is located. Out of these multinational profits, we estimate that more than $600
billion, i.e., 36%, were shifted to tax havens. Another way to present this result is that about
17The Netherlands was not considered as a tax haven by Hines and Rice (1993) because U.S. multinationalsreported paying relatively high tax rates there in 1982; but as we show in Appendix Table A.11, this is not thecase anymore: the tax rate paid by affiliates of U.S. multinationals in the Netherlands was 12% in 2015. Belgiumis a borderline case that is sometimes considered a tax haven in the literature (e.g., because of the deductibilityof notional interest on equity). As shown in Figure 3 below, Belgium’s profitability ratio is only barely higherthan that of non-havens, and we estimate that only $13 billion were shifted to Belgium in 2015 (Table 2 below).Hence excluding Belgium from our list of tax havens would not make any significant difference to our results.
12

5% of global corporate profits (multinational plus local) are shifted to tax havens ($600 out
of $11.5 trillion). But to analyze how the international location of profits would change if all
countries had the same tax rate—our purpose in this paper—multinational profits are a more
relevant focus point, because local profits would be virtually unaffected by such a change.18
3.2 Decomposing Tax Havens Profits: Tangible Capital vs. Shifting
Conceptually, a high recorded profits-to-wage ratio in tax havens can be due to two things:
either paper profits are being shifted offshore, or there’s a lot capital used in production and
the elasticity of substitution between capital and labor is high. We are interested in quanti-
fying the relative contributions of paper profits vs. tangible capital to the profits recorded by
multinationals in their tax haven affiliates.
There are three forms of profit shifting (see Heckemeyer and Overesch, 2013, for a survey),
and each affects the recorded profit-to-wage ratio π. First, multinational groups can manipulate
intra-group exports and import prices: subsidiaries in high-tax countries can try to export
goods and services at low prices to related firms in low-tax countries, and import from them
at high prices.19 Such transfer price manipulations increase the recorded πf (hence π) in tax
havens. Second, multinationals can shift profits using intra-group interest payments: affiliates in
high-tax countries can try to borrow money (potentially at relatively high interest rates) from
affiliates in low-tax countries, which again increase πf in tax havens.20 Last, multinationals
can locate intangibles—such as proprietary trademarks, patents, logos, algorithms, or financial
portfolios—in tax haven affiliates. These affiliates then receive royalties (or interest or payments
from final customers) which boost πf .21 We treat movements of intangible as profit shifting,
because they have the same distributional implications as transfer price manipulations and intra-
group borrowing. Since patents, algorithms, etc., can be used in many locations simultaneously,
18More precisely, all the profits currently recorded as local would be unaffected, with the potential exceptionof some of the local profits of multinationals headquartered in tax havens. That is, if all countries had the samerate, then Nestle might book less profits in Switzerland and more in Germany. As we show below, however,the current profitability of local firms in tax havens is similar to the profitability of local firms in non-havencountries, so changes in the local profits of haven firms would likely be small. By contrast, profits currentlyrecorded as multinational would be affected in two ways: (i) their location would change (less would be bookedin, say, Ireland, and more in Germany); (ii) some of the profits currently recorded as multinational would becomelocal (e.g., Apple would maybe book more profits in the United States and less in offshore tax havens).
19There is extensive evidence of such transfer price manipulations in the literature; see, e.g., Clausing (2003);Bernard, Jensen and Schott (2006), Cristea and Nguyen (2016).
20See, e.g., Huizinga, Laeven, and Nicodeme (2008). Relatedly, Desai, Foley, and Hines (2016) show thatU.S.-owned affiliates in low-tax countries use trade credit to lend, whereas those in high-tax countries use tradecredit to borrow.
21See Faulkender et al. (2017) for evidence suggestive of profit shifting by U.S. multinationals through thestrategic location of intangibles in low-tax countries.
13

movements of intangibles have no particular reason to affect workers’ productivity (keeping
everything else—including the global stock of intangibles—fixed); like transfer pricing and intra-
group borrowing, they can be analyzed as relocating tax bases across countries without affecting
wages. By contrast, if the elasticity of substitution between labor and tangible capital is finite,
movements of tangible capital affect wages.22
To identify which part of the high profits reported by foreign firms in tax havens reflect profit
shifting, it is convenient to start by considering the simple case where all countries—havens and
non-havens—have the same aggregate Cobb-Douglas production function Y = Kα(AL)1−α. If
net interest paid (p) is zero and α = 25%, then all countries have a true π = 33% and any
deviation of the recorded π from this value reflects profit shifting. Specifically, countries with
recorded π above 33% attract paper profits from abroad (they have πf > πl = 33%), while
countries with recorded π below 33% shift profits abroad (they have πf < πl = 33%). With
Cobb-Douglas production, the stock of tangible capital does not affect π, because any increase
in the capital stock is perfectly offset by a corresponding fall in the marginal product of capital.
In the more general case where countries have a constant elasticity of substitution (CES)
production function, the effect of the capital stock on the profits-to-wage ratio is ambiguous.
Namely, π varies with the capital stock depending on the value of the capital-labor elasticity of
substitution σ. If σ > 1, then countries with a high capital intensity K/AL have high profit-
to-wage ratios π. Conversely, if σ < 1, then countries with a high capital intensity have low
π, as the marginal product of capital becomes very low. To identify the contribution of capital
intensity to the high reported profits-to-wage ratios of tax havens, we decompose the measured
πf of these countries into three components:
πf =( K
wL
)f· rf · (1 − pf ) (2)
where rf is the measured return to capital used by foreign firms, including any abnormal
return (above the marginal product of capital) due to tax-induced profit shifting. We then
make assumptions about the value of the elasticity of substitution σ in foreign firms to infer
what fraction of the high πf of tax havens can be attributed to high capital intensities. A large
micro literature finds σ < 1, while a nascent macro literature finds σ > 1 (Karabarbounis and
22There is a view among some policy-makers (e.g., underlying government “patent box” policies, such as inthe United Kingdom, and the related “foreign-derived intangible income” provisions introduced in the 2017 U.S.tax reform) that encouraging companies to locate intangible assets domestically, while benefiting the tax base,may also benefit domestic productivity. One way to rationalize this view is that firms may be more likely tolocate tangible assets in places where they book their intangibles. But it is hard to come up with a plausiblereason to believe that the location of intangibles per se may significantly affect productivity.
14
Neiman, 2014; Piketty and Zucman, 2014).
More precisely, in our benchmark scenario we estimate the amount of profits shifted into each
tax haven by making two assumptions. First, we assume that the reported profitability of local
firms in tax havens πl is not inflated by profit shifting. This assumption is supported by our
finding, described below, that local firms in tax havens are generally as profitable as local firms
in non-haven countries. Second, we assume that the elasticity of substitution between capital
and labor σ is equal to 1 (i.e., Cobb-Douglas production). We do not assume that countries
have similar Cobb-Douglas parameters α. That is, we allow for the possibility, for instance,
that tax havens have structurally higher α than non-haven countries (due, e.g., to anti-labor
policies, or to the existence of rents generated by specific institutional features such as financial
secrecy or lax regulation). Under these assumptions, within a given tax haven, any excess of πf
over πl reflects inward profit shifting.
As we shall see, the results we will obtain will be very robust to relaxing these two assump-
tions. First, our estimate of the amount of profits shifted to tax havens will not significantly
depend on the assumed capital-labor elasticity of substitution σ, because it turns out that
foreign firms in tax havens have similar capital intensity as local firms (and foreign firms in
high-tax countries). As a result, whatever assumption one makes about σ, differences in capital
intensity cannot explain more than a small fraction of the high πf − πl gap observed in tax
havens. Second, relaxing the assumption that the measured profitability of local firms in tax
havens πl broadly reflects their actual profitability will lead us to find even more profit shifting
than in our benchmark scenario—but only slightly so, as we shall see.
3.3 How we Allocate the Shifted Profits
We allocate the shifted profits to the countries where they would be taxed if all countries had
the same tax rate as follows. First, we collect all the available balances of payments for all
countries, havens and non-havens. We then allocate the shifted profits proportionally to the
bilateral service exports and bilateral intra-group interest receipts recorded in the balances of
payments of tax havens. Among services, we focus on the specific types of services which have
been found in the literature to be most conducive of shifting: exports of the rights to use intel-
lectual property (patents and trademarks), headquarter services (administration, management
and advertising), information and communication technology services, and financial services
(Hebous and Johannesen, 2016).23
23We disregard goods exports, which are typically less conducive of profit shifting because reference prices areusually observable by tax authorities. See Appendix Section D, where we discuss the evidence in the literature
15
Our innovation here is to exploit bilateral balance of payments data made available re-
cently. While balance of payments statistics traditionally only reported transactions with all
non-residents as a total, following the adoption of the 6th edition of the IMF (2009) Balance
of Payments Manual, most countries have started publishing bilateral balances of payments,
which in particular include bilateral service trade by type of service, and bilateral foreign direct
investment income (including bilateral intra-group interest payments and receipts).24
We focus on the bilateral data reported by tax havens because they are more comprehensive
than those recorded by counterpart countries. As shown in Appendix B, the service exports
recorded by the 6 E.U. tax havens (Ireland, Luxembourg, Netherlands, Belgium, Malta, Cyprus)
to the 22 non-haven E.U. countries exceed the recorded imports by more than 30% (and more
than 50% for Luxembourg). One likely explanation for this gap is that importers’ data miss
(at least some of) the services that are exported by tax-haven corporations directly to foreign
customers, such as digital music subscriptions, ride-sharing services, and various Internet ser-
vices (server space, voice over IP, etc.).25 There is evidence that the typical business structure
of digital services multinationals involves shifting intellectual property to tax haven subsidiaries
and then directly selling services to final customers without involving any non-haven subsidiary
(see, e.g., Pomeroy, 2016). Using tax haven data is critical to capture such profit shifting, which
cannot be quantified by looking at intra-group transactions as in the transfer pricing litera-
ture, since there is no intra-group transaction (except at the time of the initial transfer of the
intellectual property).
Our procedure to allocate the shifted profits is consistent with how profit shifting is perceived
by policy-makers globally. Many countries have anti-avoidance policies known as controlled-
foreign corporations provisions, whereby specific cross-border transactions thought to be con-
ducive of profit shifting (such as certain royalty payments, interest, or services) are presumed
to be motivated by tax avoidance and taxed in the source country.26 Our procedure is also
on the magnitude of profit shifting through the mispricing of intra-group goods trade vs. other channels.24The data are particularly good for Switzerland and the European Union tax havens (Ireland, Luxembourg,
Belgium, Netherlands, Malta, and Cyprus) which must report detailed statistics to Eurostat, the Europeanstatistical institute, complying with the latest international guidelines. When no bilateral data are available (asis the case for a number of non-E.U. tax havens), we impute data using counterpart country statistics (i.e., serviceimports and intra-group interest payments reported by non-haven countries), see Online Appendix Section B.
25When a firm incorporated in Luxembourg directly exports digital services to French customers withoutgoing through a French subsidiary, French statistical authorities cannot rely on corporate income statementsto capture such flows, and have to use other—typically less comprehensive—data sources, such as householdconsumption surveys. Beginning 2014, value-added taxes have started to be imposed in France (and other E.U.countries) on direct foreign-business-to-consumer sales. In principle, VAT returns could be used as inputs tobetter estimate French imports of services. Looking forward, systematically using VAT returns could help fixthe imports-exports service mismatch between havens and non-havens countries.
26Similarly, in 2017, the United States introduced a “base-erosion anti-avoidance tax” (BEAT) that presumes
16

consistent with Clausing (2009), who estimates how much of the profits booked offshore by U.S.
multinationals are shifted out of the United States by apportioning the offshore profits of U.S.
firms proportionally to the amount of affiliate intra-firm transactions that occur with the United
States. Our paper generalizes this approach in three ways: (i) we apportion the profits shifted
offshore by all (not only U.S.) multinationals; (ii) we use balance of payments data which cap-
ture all cross-border transactions (not only transactions within divisions of multinationals); (iii)
we focus on the types of transaction identified in the literature as being particularly conducive
of shifting.
Our approach differs from Guvenen et al. (2018), who apportion the worldwide profits of
U.S. multinationals proportionally to labor compensation and sales to unaffiliated parties in
each country. Their allocation approximates how the profits of U.S. firms would be split if
all countries used a formulary apportionment system (with labor and sales as apportionment
factors), a system different than the one currently used by governments worldwide. By contrast,
our allocation approximates how the profits of all (U.S. and non-U.S.) multinationals would be
split if the international tax system remained the same but all countries had the same tax rate.
We view these two benchmarks as relevant. In both cases, there are uncertainties involved
and the counterfactual profit allocations should be seen as approximate. One advantage of our
approach is that it does not require us to make assumptions on how the move to a formulary
apportionment system would affect firm behavior (compared to the current international tax
system of arm’s length pricing). Because many of the transactions we consider are intra-group
(not to final customers), our allocation of the shifted profits is not equivalent to a sales-based
apportionment of these profits.27
We also provide an alternative allocation, in which we distribute the profits shifted offshore
to the countries where the ultimate parents of the offshore affiliates are incorporated. To do so,
we draw on the bilateral direct investment statistics on an ultimate ownership basis compiled by
Damgaard and Elkjaer (2017), who exploit the data recently made available by OECD countries
following the implementation of the 6th edition of the IMF (2009) Balance of Payments Manual
(see Appendix Section C.2 for a detailed discussion). This allocation makes it possible to
estimate what fraction of the globally shifted profits ultimately accrue to the shareholders of
U.S. multinationals, European multinationals, etc.
that services transactions by multinational firms with related parties are motivated by tax avoidance.27An alternative approach would involve trying to figure where production has “truly” taken place. However
in many cases, it is impossible to determine where production takes place (e.g., the creation of intangibles occursthrough the cooperation and interaction of subsidiaries in various countries). See Devereux and Vella (2017) fora discussion.
17

4 The Level and Rise of Global Profit Shifting
4.1 Profitability in Tax Havens vs. Non-Haven Countries
We start the analysis by displaying in Figure 3 how the profit-to-wage ratio π varies across
countries. Among the main non-haven countries (displayed in Figure 3), π average 36% in
2015. That is, for any dollar of wage paid, corporations made 36 cents in pre-tax profits. This
corresponds to a capital share of net corporate value-added of 26%, and net interest paid of -3%
of net operating surplus. The profits-to-wage ratio π does not vary much across developed, non-
haven countries; for instance it is 31% in the United States, 39% in Sweden, 42% in the United
Kingdom.28 By contrast, tax havens are abnormally profitable. In Singapore and Hong Kong,
the macroeconomic profit-to-wage ratio exceeds 100%; in Ireland, Puerto Rico, and Luxembourg,
it exceeds 200% (corresponding to a net capital share of net corporate value-added of about
two-thirds).
The profitability ratios of tax havens are higher than recorded in their national accounts,
because the official statistics miss some of the profits made by affiliates of multinational compa-
nies. We know this because parents of multinational companies receive more profits from their
affiliates in tax havens (in the form of dividends and reinvested earnings) than what these affili-
ates report paying to their parents. At the global level, in the world balance of payments, more
direct investment equity income is received than paid.29 This gap reaches about $200 billion in
2015. In Appendix B, we decompose it in a comprehensive way by leveraging the bilateral direct
investment income data of all the world’s countries. We find that the bulk of the gap comes from
missing payments by affiliates located in Ireland, Luxembourg, Netherlands, and Caribbean tax
havens. In Figure 3 we correct for this problem by adding the missing profits paid by tax haven
affiliates to U.S. and E.U. parents. That is, we add the discrepancy between direct investment
equity income received by the United States and non-haven E.U. countries from Ireland, the
Netherlands, Luxembourg, etc., and the income that these havens record paying to the United
28As reported in Appendix Table A.2., profitability ratios are higher in developing countries. This reflects thefact that the capital share of corporate output is typically higher in poorer countries, potentially due, e.g., tothe presence of rents generated by natural resources and to lower labor bargaining power (lower unionizationrates, low or no minimum wages).
29By contrast, for portfolio and other investment income—i.e., cross-border capital income other than pay-ments within divisions of multinational companies—the opposite gap exists in the data: more income is paidthan received. As shown in Zucman (2013), this can be explained by the fact that dividends and interest earnedby households on their offshore bank accounts are duly recorded by the paying country but not by the payee. Forinstance if a French household has a bank account in Switzerland and owns U.S. equities on her Swiss account,the dividends paid by the U.S. are duly recorded in the U.S. balance of payments, but neither Switzerland norFrance records any dividend receipt. Alstadsæter et al. (2018) provide estimates of offshore household wealthby country.
18

States and European Union countries. Most of the discrepancy comes from missing payments to
the United States. The United States has the world’s most sophisticated system for recording
the activities of its multinationals abroad, based on exhaustive census-like surveys conducted
every five years since 1950, and quasi-exhaustive, detailed surveys conducted annually since 1982
(see Appendix Section A.1). Therefore the U.S. data are likely to be more accurate than those
reported by tax havens, which are likely in particular to miss some of the profits made by special
purpose entities (due to a lack of comprehensive enough corporate registries, non-response to
surveys, or other data issues; see, e.g., Angulo and Hierro, 2017; Damgaard and Elkjaer, 2017;
and our discussion and supplementary results in Appendix A). By construction, our correction
ensures that at the global level, parents receive as much profits from their subsidiaries as what
subsidiaries pay to their parents (i.e., global net direct investment income adds up to zero).
Note that it is possible that some parents themselves under-estimate the income that accrues
to them in their offshore subsidiaries—in which case we would under-estimate the amount of
profits booked in tax havens. We discuss alternative corrections in Appendix A.
Figure 4 shows our key empirical result. Foreign firms in tax havens are an order of magnitude
more profitable than local firms, while foreign firms in other countries are less profitable than
local firms. That is, there is a clear trace in global macro data of movements of profits within
divisions of multinational groups, away from high-tax affiliates and towards low-tax affiliates.
There are three other main take-aways from Figure 4. First, the reported profitability of
foreign firms in tax havens is truly exceptional, with πf ratios of 800% (which corresponds to
a capital share of corporate value-added of close to 90%) in Ireland and as high as 1,625% in
Puerto Rico.30 Second, the high overall profits-to-wage ratio π of tax havens is entirely driven
by the high profitability of their foreign firms πf . Local firms in tax havens do not seem to be
more profitable than the local firms of other countries, which could in principle be the case if
low-tax countries also had pro-capital and anti-labor institutions (such as bans on unions or no
minimum wage) or if the reported profitability of local haven firms was inflated by inward profit
shifting. This suggests that the πl ratios of tax havens are a useful benchmark to estimate what
fraction of the huge πf of tax havens can be attributed to profit shifting. Third, although tax
havens generally receive positive net intra-group interest from the rest of the world, their high
πf are mostly driven by the high reported capital shares in foreign firms, not by net intra-group
30Puerto Rico is a U.S. possession, but is treated as a foreign country for purposes of U.S. taxation and insome (but not all) U.S. macroeconomic statistics. In this paper we treat it as a foreign country. Almost all theprofits shifted to Puerto Rico accrue to U.S. multinationals. See Suarez Serrato (2018) for an analysis of theevolution of profit shifting by U.S. multinationals to Puerto Rico.
19

interest. The main exception is Luxembourg, where net intra-group interest receipts are sizable
(see Appendix Table A.5).
The profitability of haven firms has surged since the 1980s. As shown in the top panel
of Figure 5, in Ireland—the tax haven for which the longest and highest quality time series
exist—π was around 25–30% in the early 1970s, a level similar to that recorded in the United
States. Profitability started rising in the 1980s and then increased sharply in the mid-1990s. In
2015, the profits-to-wage ratios recorded by Ireland increased particularly strongly. That year,
recorded real GDP grew 26.3%—largely reflecting transfers of multinational intangible assets
to the island (see e.g., OECD, 2016). By contrast, in non-haven countries π never dramatically
varies. It has tended to increase since the 1980s, driven by the rise in the capital share of
corporate value-added, but this increase pales in comparison to the upsurge in the profitability
of tax havens’ corporations.
In the bottom panel of Figure 5, we can see that the rise in the profitability of tax havens
over time is not specific to Ireland. When we look at all the majority-owned affiliates of U.S.
multinationals throughout the world, a similar pattern emerges. In the early 1970s, the haven
and non-haven affiliates of U.S. multinationals were as profitable, with a π ratio around 50%.
Since then, profitability for haven affiliates has sharply increased: for them π exceeds 350%
today, while it has stayed constant for non-haven affiliates.
4.2 Decomposing The High Profits of Haven Affiliates
Why are the tax haven affiliates of foreign multinationals so profitable? The available data
suggest that their high profits essentially stem from high rates of returns on assets—not high
capital intensities coupled with a high elasticity of substitution between capital and labor. We
study this question by focusing on the majority-owned affiliates of U.S. multinationals in tax
havens, for which the data is particularly good. Crucially, the outward FATS of the United
States include information on the stock of tangible capital used by foreign affiliates of U.S.
multinationals, in contrast to the outward FATS of other countries and the inward FATS of tax
havens, which currently don’t.
We compare the haven affiliates of U.S. multinationals to their non-haven affiliates. As
shown by the top Panel of Figure 6, the haven affiliates of U.S. multinationals are on average
five times more profitable than their non-haven affiliates. Consistent with the patterns shown
above for all multinationals, affiliates in Ireland, Luxembourg, Bermuda and the Caribbean are
particularly profitable, with profits-to-wage ratios above 500%. The bottom panel of Figure 6
20

decomposes the profit-to-wage ratio of the affiliates of U.S. multinationals following equation 2
above. In 2015, haven affiliates have higher capital intensities than non-haven affiliates, but the
difference is not massive. By contrast their rate of return on tangible capital is close to four
times higher. They also receive slightly more interest payments—but by far the main driver of
their profitability is their high recorded returns on tangible capital.
More broadly, the bottom panel of Figure 6 shows that globalization, so far, has not made
the relative capital intensity of affiliates in low- vs. high-tax places change much. What has
changed is their relative rates of return. Up to the late 1970s, affiliates in tax havens had
roughly the same recorded rate of return to tangible capital r, same capital intensity, and same
net interest payments than other affiliates. Since the 1980s, their relative r has increased by a
factor of about 4. By contrast, the relative capital intensity of these two groups of affiliates has
remained close to 1. Capital moves across borders, but it does not seem to move significantly
more towards low-tax places.
Two remarks are in order here. First, even when capital intensities are not particularly high,
foreign firms can account for a large share of employment and bring important economic benefits
to their host countries. This is the case in some of the tax havens that attract large paper profits.
One potential explanation is that it may be easier for multinationals to shift profits into the
countries where they also have sizable real activity.31 Our analysis does not reveal how much
each tax haven gains from international capital mobility vs. movements of paper profits. Such
an analysis would require an explicit model of firm location decisions (factoring in tax and
non-tax reasons), which we leave to future research. Second, the relative capital intensity of tax
haven affiliate seems to be on a rising trend since the early 2000s. So far, this increase is mild
compared to the large rise in the rate of return of low-tax affiliates, but it could accelerate in the
future. For instance, firms may start moving more tangible assets to low-tax places if policy-
makers reduce profit shifting opportunities but tax rates remain different across countries. That
is, while for tax havens capital mobility and artificial shifting may be complement, for non-haven
countries they may be substitutes. What the data suggest is that, so far, profit shifting seems
to have swamped tax-driven capital mobility. But our analysis does not allow us to say what
would have happened in a counter-factual world without profit shifting, nor to predict what will
31According to our estimates, foreign firms pay 24% of all wages in Ireland (Appendix Table A.4), while theyaccount for as much as 78% of all profits (Appendix Table A.7). Note that there are many countries whereforeign firms account for an even larger fraction of the total wage bill and yet there was little profit shiftingin 2015. This includes most Eastern European countries, where foreign firms account for around 40% of bothwages and profits. These countries had corporate rates close to 20% in 2015. Looking forward, one may imaginethat these countries could emerge as profit shifting destinations if their rate is cut (which Hungary has alreadydone in 2016, from 19% to 9%).
21

happen in the future.
Conceptually, the high rates of return of haven affiliates can be seen as the product of two
effects. First, multinationals book intangibles in low-tax affiliates. These intangibles are not
included in our measure of corporations’ capital stocks, for lack of data about their market
value—which in many cases is impossible to assess, given that many of these intangibles are
firm-specific and never exchanged on markets between unrelated parties. Second, for a given
stock of total capital (tangible plus intangible), haven affiliates can report high profits because
of intra-group transfer price manipulations. With the macro data at our disposal, we cannot
separate the role of intangibles vs. intra-group transfer prices in explaining the high rates of
returns recorded by haven affiliates. This distinction is not relevant for our purposes, however,
since both of these techniques have similar redistributive implications.
4.3 Estimates of Profits Shifted to Tax Havens
To form our benchmark estimate of the amount of profits shifted to tax havens, we set πf
equal to πl in each tax haven. That is, we assume that absent profit shifting, foreign firms in
Ireland would be as profitable as local Irish firms, foreign firms in Luxembourg as profitable
as local Luxembourg firms, etc. We present our estimate of the amount of profits shifted into
each tax haven in the bottom panel of Table 2. In total, more than $600 billion in profits
were shifted to tax havens in 2015, close to 40% of multinational profits. By our estimates,
Ireland is the number one shifting destination, accounting for more than $100 billion alone.
Singapore, the Netherlands, Caribbean tax havens, and Switzerland come next. Due to the
complex structures used by multinationals, allocating the shifted profits to specific jurisdictions
involves a margin of error (for instance, the frontier between Ireland and Bermuda is not always
clear). This uncertainty, however, does not affect our estimate of the global amount of profits
shifted offshore.
One potential concern with comparing profitability in foreign vs. local firms is that foreign
firms in tax havens may be in other sectors than local firms, and profits-to-wage ratios may vary
across sectors. To address this issue, we use the fact that in some countries, foreign affiliates
statistics are available by sector of economic activity. Appendix Figure L.1 focuses on the case
of U.S. multinationals, using the outward foreign affiliates statistics of the United States. We
find that the haven affiliates of U.S. multinationals are an order of magnitude more profitable
than non-haven affiliates in the same sector. In non-haven countries, U.S. affiliates are typically
less profitable than local firms operating in the same sector; while in tax havens they are an
22
order of magnitude more profitable than local firms operating in the same sector—consistent
with the pattern depicted in Figure 4. Therefore controlling for sectoral differences in local vs.
foreign firms does not quantitatively affect our findings.
More broadly, the take-away from Appendix Figure L.1 is that profit shifting is not limited
to just a few sectors of the economy, such as information and communication technology: it is an
across-the-board phenomenon, observable even in industries where intangibles play a relatively
minor role in the production process. There are several potential explanations for this finding.
Firms across all industries may shift profits by using intra-group trade and borrowing. It could
also be that multinationals in all sectors can create firm-specific intangibles (such as logos),
book these in low-tax places, and charge royalties to high-tax subsidiaries for the right to use
these intangibles.
Another potential concern with our estimation procedure is that local firms in tax havens
may be smaller than foreign firms, and smaller firms may have lower profits-to-wage ratios,
leading us to over-estimate global profit shifting. Currently available foreign affiliates statistics
do not enable us to control for firm size. But importantly, being a local firm does not imply
being small. There are many large multinationals headquartered in tax havens (for instance,
after “inverting” from the United States). In our data, such firms are treated as local firms in
tax havens, as they are not owned by foreign parents.
A last concern is that by using the local firms of tax havens as benchmark, we may actually
under-estimate the size of global profit shifting, since firms headquartered in tax havens may
shift foreign profits inward, inflating πl.32 This phenomenon could explain the relatively high
profits-to-wage ratio of Irish local firms reported in Figure 4, and suggests that our estimates of
global profit shifting should probably be viewed as conservative.33 We have run robustness tests
where we make the profitability of local haven firms vary and assess the impact on our results,
and found only second-order effects, however. The reason is that the bulk of our estimated
32Another small source of uncertainty in our estimated πl owes to the treatment of offshore mutual funds (i.e.,mutual funds with mostly foreign investors and foreign investments). Throughout this article, we exclude thesemutual funds (which among OECD countries are only significant in Luxembourg, Ireland, and to a much lesserextent the Netherlands) from our π ratios, because they would otherwise distort the local profitability of taxhavens: by convention mutual funds have an apparently high profitability as defined in our paper (i.e., after netinterest payments), but for purely accounting reasons (all income paid by mutual funds to their shareholdersis recorded as dividends in the national accounts, even for mutual funds that only invest in bonds; as a resultbond funds are large receivers of net interest). Estimating the net interest received by mutual funds involves amargin of error, but this uncertainty is very small compared to the large πf of tax havens; see Appendix SectionA.3 for a discussion.
33Ideally we would like to be able to compare the foreign firms of tax havens to local firms of comparable sizeand without foreign affiliates. Existing foreign affiliates statistics, however, do not currently make it possible todecompose local firms into firms with affiliates abroad vs. firms with only domestic operations.
23

$600bn in shifted profits comes from small tax havens where πf is an order of magnitude higher
than πl (hence where the exact level of πl does not matter much); only a small fraction comes
from larger tax havens (such as Netherlands and Belgium) where πf is only slightly higher than
πl (hence where the exact level of πl matters more); see Table 2. If we assumed that local firms
in tax havens are in reality as profitable as local firms are on average in the OECD (πl = 41%),
then our estimate of global profit shifting would rise by about 3%.34
To conclude, comparing foreign and local firms in tax havens is not perfect. But this es-
timation procedure has the advantage that it can be implemented transparently using readily
available macro data which are much more comprehensive than the data used so far to study
global profit shifting. We view our database of local vs. foreign profits across the world as
living series that we will update annually, making it possible for researchers and policy-makers
to track the effects of policies aimed at reducing corporate tax avoidance on a year-to-year
basis. Another advantage is that our results are robust to changes in key assumptions. In par-
ticular, because profits-to-wage ratios vary so dramatically while capital intensities don’t, even
assuming elasticities of substitution between capital and labor way larger than 1 has only small
effects on our estimates of the amount of profits shifted to tax havens. Looking forward, our
estimation procedure could be refined by drawing on more detailed foreign affiliates statistics
(e.g., tabulated by firm size) and global micro-data on the operations of foreign firms.
5 The Redistributive Implications of Profit Shifting
5.1 Allocating the Shifted Profits Across Countries
Which countries lose profits compared to a benchmark of perfect international tax coordination?
The pink bar in the top panel of Figure 7 allocates the roughly $600bn in excess profits in tax
havens across source countries, proportionally to the bilateral intra-group interest received by
tax havens and their bilateral exports of services conducive of profit shifting (such as rights
to use intellectual property). As described in Appendix C, we find that the amount of intra-
group interest received and risky services exported by tax havens (above and beyond what
could be expected given the size of their economies) totals about $600bn. That is, it matches
our independent estimate of the amount of profits shifted in tax havens (based on setting
πf = πl in tax havens). This consistency of findings obtained using completely different data and
methodologies lends support to the view that $600bn is indeed the correct order of magnitude
34See Appendix Table A.7.
24

for the amount of profits shifted to tax havens globally. We find that about 35% of the shifted
profits come from E.U. (non-haven) countries, close to 30% from developing countries, and
about 25% from the United States. About 80% of the profits shifted out of the European Union
are shifted to the E.U. tax havens, primarily Ireland, Luxembourg, and the Netherlands (see
Appendix Figure C.1), while the profits shifted out of the United States are primarily shifted
to the non-E.U. havens.
We also allocate the profits shifted to tax havens to the countries where the ultimate owners
of the tax haven subsidiaries are located (blue bar in the top panel of Figure 7). Multinationals
from all countries shift profits, but we find that U.S. multinationals are the main “shifters”:
about half of all the shifted profits ultimately accrue to U.S. parents, while about 30% accrue to
E.U. parents. As explained in Wright and Zucman (2018), the higher shifting intensity of U.S.
multinationals can be explained by the specific provisions contained in the U.S. tax code before
2018 and by U.S. policies adopted in the mid-1990s that facilitated shifting from foreign high-
tax countries to tax havens (what is known as check-the-box regulations). Industry composition
effects may also play some role, but because profit-shifting seems to happen in all sectors, they
are unlikely to be the key reason why U.S. multinationals shift more.
In the bottom panel of Figure 7 and in Table 2, we estimate the losses of corporate income
tax revenues implied by our estimate of where the shifted profits come from. We consider the
following thought experiment: “How much more corporate income tax revenues would Germany
collect if all countries had the same tax rate as Germany?,” keeping the level and location of
the world capital stock constant. This is an informative thought experiment in light of our
result that what has moved to low-tax places over the past decades is mostly paper profits, not
tangible capital.35 By our estimate, profit shifting by multinationals reduces the corporate tax
revenue of the European Union by around 20%. For the world as a whole, the tax revenue loss
is around 10%. The revenue losses vary significantly across countries. One of the reasons is
that the share of corporate profits that come from multinational corporations varies, as some
economies are more open than others. In Japan and some of the largest developing countries
(e.g., China), a high share of profits originate from local firms; this limits the amount of shifted
profits. Moreover, the size of the revenue losses is correlated with the corporate income tax
35Note that if Ireland had the same tax rate as Germany, there would probably be less activity and profitsmade in Ireland. However, this is not relevant for our purposes here, because the profits made in Ireland aretypically not taxable in Germany (even if they are made by German multinationals). More broadly, almostall countries have territorial tax systems that exempt foreign profits from taxation. What matters—and whatour computations capture—is that if all countries had the same tax rate as Germany, there would not be anyincentives for multinationals to shift profits out of Germany, and hence more corporate income tax would becollected in Germany.
25

rate: within the European Union, higher tax countries (such as France and Italy) experience
higher losses than lower tax countries (such as Eastern European countries). This correlation
is consistent with the notion that higher corporate tax rates give more incentives to shift.
5.2 The Tax Revenue Gains of Tax Havens
Using our estimates of the amount of profits shifted into each haven, we compute how much
tax revenue tax havens have been able to generate by taxing these profits. Although some
havens like Bermuda have 0% corporate tax rates, most others, like Ireland, Singapore, and
Luxembourg, have low but positive rates. A striking fact, depicted on the top panel of Figure 8,
is that tax havens, although they have low statutory tax rates (and even lower effective rates)
generate much more revenue than non-haven countries. Malta collects about 8% of its national
income in corporate tax revenue, Luxembourg 7%, and Ireland more than 5%. By contrast, in
the United States, Germany, and Italy (three of the countries with the highest statutory tax
rates), corporate tax revenue amount to less than 3% of national income.
How do tax havens manage to collect so much tax revenue? As shown by the bottom panel
of Figure 8, most of their revenue derive from taxes collected on foreign firms. With source
taxation (and no international coordination or sanction against tax havens), tax havens can
generate sizable revenue by taxing the huge foreign profits they attract at low but positive
rates. Strikingly, the havens that collect the largest revenue are those that impose the lowest
tax rate on foreign profits: the revenue-maximizing tax rate appears to be very low, less than
5%. The low revenue-maximizing rate of tax havens can explain the rise of the supply of tax
avoidance schemes documented in the literature—such a favorable tax rulings granted to specific
multinationals—and in turn the rise of profit shifting since the 1980s.36
Figure 9 considers the case of Ireland, the country that by our estimates attracts the largest
amount of shifted profits (more than $100 billion in 2015). As shown in the top panel of this
Figure, until the 1990s Ireland used to collect relatively little corporate income tax revenue,
about 1.5%–2% of national income—significantly less than the United States. Then, as profit
shifting surged (Figure 5), so did tax collection: since the mid-1990s, Ireland has collected
significantly more corporate tax revenue (as a fraction of national income) than the United
States—about twice as much in 2015. Tax collection is strongly negatively correlated with the
statutory corporate tax rate (bottom panel of Figure 9): when the tax rate was high (around
50% until the late 1980s), tax collection was low; since the rate was cut to 12.5% in the 1990s,
36See for instance the case between the E.U. Commission and Apple in Ireland. The E.U. Commission contendsthat the Irish tax authorities have allowed Apple to pay particularly low rates, of as little as 0.001%, over years.
26

tax collection has been high. Whenever they choose non-zero rates—even rates effectively quite
close to zero—tax havens derive clear benefits from attracting paper profits.
Although tax havens do collect revenue, profit shifting significantly reduces corporate in-
come tax payments globally: for each $1 paid in tax to a haven, close to 5$ are avoided in
high-tax countries. More than redistributing tax revenues across countries, profit shifting thus
redistributes income to the benefit of the shareholders of multinational companies. According
to our estimates, about half of the benefits accrue to the shareholders of U.S. multinationals
(some of which are Americans and some of which aren’t). To have a sense of the magnitude
of the redistribution involved, note that U.S. firms have seen their foreign effective corporate
tax rate fall from about from 32% in 2000 to about 16%-17% in 2016, and that, according to
the estimates of Wright and Zucman (2018), about half of this decline can be attributed to
profit shifting (and the other half to the decline in statutory tax rates in the countries where
U.S. multinationals have production activities). Because equity ownership is concentrated (see
e.g., Saez and Zucman, 2016, for evidence on equity wealth concentration in the United States),
shareholders tend to be wealthy, hence profit shifting tends, everything else equal, to increase
inequality. A full quantitative analysis of these redistributive effects across income and wealth
groups would require making more assumptions, however—a task we leave to future research.
6 The Incentives of Tax Authorities
The incentives of tax havens can explain the rise of shifting since the 1980s, but they are not
enough to explain why, despite the high revenue costs involved, this profit has persisted since
then. Why haven’t non-haven countries protected their tax base? To understand why profit
shifting has persisted so far, one has to understand how tax authorities throughout the world—
in particular in Europe, the region where revenue losses are the highest—attempt to enforce
taxes on multinational companies and the incentives they face.
6.1 Transfer Price Correction and Mutual Agreement Procedures
To ensure profits are taxed where they have been made (i.e., the prevailing internationally-
agreed rules), tax authorities in high-tax countries routinely audit large companies. They check
that intra-group transactions are conducted at arm’s length (i.e., as if the subsidiaries of a
given multinational group were independent entities). When they find it is not the case, they
can attempt to ask multinationals to correct transactions. All aspects of multinational activity
are examined: transfer mispricing of goods and services; debt shifting; abuses of double-tax
27
treaties, etc. OECD countries have created dispute settlement mechanisms making it easy for a
tax authority in country A to relocate profits that it considers have been mistakenly booked in
country B.37 If an agreement is reached, this procedure results in a relocation of taxable income
across countries.38
In the current international tax system, tax authorities have incentives to relocate profits
booked in other high-tax countries—not profits shifted to havens. Take the case of France.
e1 re-located to France is worth the same to France whether it comes from Germany or from
Bermuda (that is, the French tax authority doesn’t internalize the externality of reducing the
corporate tax base in the partner country). But it is easier for the French tax authority to
relocate e1 booked in Germany, for three reasons. First, it is feasible, because information
exists on the profits booked in Germany (from Orbis), while no or little information typically
exists on the profits booked in Bermuda.39 Second, it is more likely to succeed, because firms
are unlikely to spend much resources opposing this transfer price correction: for them, whether
profits are booked in France or Germany makes little difference to their global tax bill, since the
tax rates in France and Germany are similar. Third, if there is a dispute between France and
Germany, it is likely to be settled relatively quickly through the dispute resolution agreements
in force among OECD countries and E.U. countries.
The correction of transactions between France and Germany crowds out the correction of
transactions between France and low-tax countries. Such corrections are harder to make (less
data exist on the profits booked in tax havens), more costly (as firms spend legal resources to
defend their transfer pricing optimization), and take more time (due to a lack of cooperation
with some tax havens). In Section E.2 of the Online Appendix, we formalize this argument
and make precise the conditions under which it is optimal for high-tax countries to focus their
enforcement resources on relocating profits booked in other high-tax countries.
37The procedure works as follows. After a tax authority has decided on a transfer price correction nationally,the firm may ask the tax authority to enter into a Mutual Agreement Procedure with the countries suspectedof having excessive taxable income. The tax authority that increased its own tax base will then approach thecountry that it perceives as the one having to reduce its tax base. Simply put, the tax authority conductingthe transfer price correction will ask a foreign government to pay for this. For an economic analysis of mutualagreement procedures, see Becker and Davies (2014).
38If no agreement is reached, then taxable income increases in one country without any offsetting decreaseelsewhere. Within the European Union, an agreement is almost guaranteed: a strict system—known as theArbitrage Convention—is in place to ensure that disputes among two E.U. countries are settled within twoyears. If the tax authorities do not come to terms in that time frame, an external panel is brought in to settlethe case.
39In recent years, governments have sought to get access to more information by asking multinational firms toreport country-by-country breakdowns of their profits. We discuss below how more information affects enforce-ment.
28

6.2 Patterns in International Tax Enforcement
This theory is supported by the available data. Our analysis of the enforcement activities of tax
authorities globally shows that most transfer price corrections are between high-tax countries.
These corrections typically do not increase the taxes paid by multinationals, but merely re-
shuffle tax payments across high-tax places. From a global perspective, such corrections are
welfare decreasing, since they consume resources without changing global tax payments.
We first start by analyzing the universe of transfer price corrections initiated by the Danish
tax authority—data internal to the Danish administration to which we were granted access in
the context of this research. As reported in Appendix Figures J.2 and J.2, the vast majority
of transfer price corrections (about 75%) initiated by the Danish tax authorities involve other
high-tax countries. This fraction is even larger (about 80%) when cases are dollar-weighted.
As Denmark has a moderate corporate tax rate (22% in 2015), this finding implies that the
majority of transfer price corrections initiated by Denmark involve countries with higher rates.
Because most transfer price corrections initiated by Denmark are followed by successful mutual
agreement procedures, these corrections ultimately lower the taxes paid by the targeted multi-
nationals. This result is at odds with the popular perception that the enforcement activities of
tax authorities increase the taxes paid by multinationals.
Do these findings apply to other countries? In 2014, the audit firm EY conducted a transfer
price authority survey in which they asked 26 major economies which countries were the main
focus of their transfer price correction efforts. As shown by the top panel of Figure 10, through-
out the world, countries most often targeted in transfer price disputes are high-tax countries.
The United States comes first, followed by Germany, and Japan. Among tax havens, only
Switzerland and the Netherlands show up as being sometimes targeted. Ireland (which accord-
ing to our estimates is the number one shifting destination in 2015) is never named among the
top 3 targets. Tax authorities also say they look at “low-tax jurisdictions” in the EY survey,
but with the exception of Switzerland and Netherlands prominent tax havens are almost never
named by tax authorities as being involved in actual disputes. Although tax authorities might
intend to go after tax havens, the fact is that actual transfer price corrections seem to mostly
involve non-havens.
Quite strikingly, if we re-do the figure in the top panel of Figure 10 but restricting the EY
sample to the countries that have working mutual agreement procedures in place, then tax
havens feature even more rarely as being targeted (Appendix Figure M.1). In that sample, the
Cayman Islands, Singapore, Hong Kong and the BVI are never named among the top 3 tar-
29

gets, and the Netherlands and Switzerland move further down the ranking. Mutual agreement
procedures that facilitate dispute settlements between high-tax countries appear to crowd-out
enforcement on tax havens. As shown by the bottom panel of Figure 10, in the European Union
90 percent of all mutual agreement procedures are between two high-tax countries; cases involv-
ing tax havens (Ireland, Luxembourg, Netherlands, Belgium, Cyprus, Malta) are exceptional.40
There are at least two ways to interpret these results. One is that tax authorities are not
really interested in fully enforcing taxes on multinationals. With territorial tax systems, lax
enforcement can encourage domestic investment by lowering effective marginal tax rates on
multinationals. The tax authorities of high-tax countries might perceive that profit shifting
and capital mobility are strongly substitutable—with less shifting there would be more outflows
of tangible capital, with potentially adverse effects on wages and employment—and rationally
choose to limit enforcement for that reason. Another possible interpretation is that tax author-
ities really are interested in increasing effective tax rates on multinationals when these rates
are below those mandated by the tax law, but that they fail to do so because enforcement on
non-havens crowds out enforcement on tax havens—a rational outcome in today’s international
tax system. With the data at our disposal, it is hard to precisely quantify which explanation is
likely to matter more, and we view both as complementary.
Could more information lead tax authorities to focus more of their resources on curbing
shifting to low-tax places? Our analysis suggests that more information is in itself not enough
to change the enforcement patterns uncovered in this paper. Even if the tax authorities had
access to perfect information on the amount of profits booked by each firm in each country,
multinational companies would still have incentives to fight tax authorities (e.g., by spending
substantial legal resources) when these authorities attempt to relocate profits booked in low-tax
places. Internalizing this, tax authorities would still have incentives to try to chase the profits
booked in high-tax places instead (see Appendix E.2 for a formal discussion). Better information
is necessary to address the enforcement issues discussed in this paper, but not sufficient. The
enforcement problem is inherent to the way governments currently tax multinational companies
(i.e., inherent to the use of transfer prices to allocate taxable income across countries). It
would, however, disappear if governments taxed the consolidated profits of multinationals and
used an apportionment formula to allocate profits across countries (similar to the way U.S.
40One caveat here is that firms might not care to initiate a mutual agreement procedure with a tax havenif they are not paying any tax in that haven. The evidence discussed above for Denmark does not suffer fromthis limitation, as it encompasses all transfer price corrections initiated by the tax authority, not only those forwhich firms then ask for a mutual agreement procedure.
30

States tax U.S. profits). In such a system, intra-group exports, imports, and interest payments
are irrelevant, hence profit shifting as it currently exists is not possible.
7 Macro Statistics Corrected for Profit Shifting
The flip side of the high profits recorded in tax havens is that profits recorded in non-haven
countries are too low. In both cases, core macroeconomic statistics are distorted. In the coun-
tries where shifted profits are booked (i.e., tax havens), GDP, corporate profits, the capital
share of corporate value-added, and trade balances are over-estimated. In non-haven countries,
by contrast, these indicators are under-estimated. In this section, we present macroeconomic
statistics corrected for the effect of profit shifting for all OECD countries, all tax havens, and
the main emerging economies. All our estimates are available online in Appendix Tables C.5
and C.5b; in this section we focus on discussing the methodology and main results.41
Not all forms of profit shifting affect the data in the same way. The manipulation of intra-
group transfer prices and the offshoring of intangibles affect GDP, corporate operating surplus,
factor shares, and trade balance. But profit shifting through the use of intra-group interest
payments does not. According to our estimates, about 1/7 of the profits globally shifted to tax
havens are shifted via interest payments (intra-group interest received by tax havens are about
1/7 the size of the exports of services most conducive of profit shifting recorded by tax havens).
Our corrected macroeconomic statistics take this fact into account.
Table 3 presents our estimates of capital shares and trade balances corrected for profit
shifting. A number of results are worth noting. First, accounting for profit shifting significantly
increases the capital share of corporate value-added in non-haven countries.42 Consistent with
our earlier results that showed that European countries are particularly affected, we find that
the capital share is under-estimated by about 2% to 2.5% points in the main E.U. countries
(Germany, United Kingdom, France, Italy), which is more than in the United States (1.1 point).
Because there was almost no profit shifting before the 1980s (see, e.g., Figure 5) the higher level
41Bruner, Rassier, and Ruhl (2018) present US macroeconomic statistics corrected for profit shifting anddiscuss how the effect of profit shifting cascades through the economic accounts; see also Avdjiev et al. (2018).Compared to these studies, our contribution is to offer a set of correction for all countries (not only the UnitedStates), and in such a way that global accounts balance (i.e., that the global direct investment income balanceadds up to zero). Our results for the United States are broadly consistent with the results of Bruner, Rassier,and Ruhl (2018) who find that accounting for profit shifting increases U.S. GDP by 1.5 percent.
42Note that it does not necessarily increase the capital share of national income, as the profits of the offshoresubsidiaries that belong to domestic shareholders enter national income in the form of direct investment incomereceived from the rest of the world. We focus here on correcting domestic corporate value-added, corporateoperating surplus, and corporate factor shares (which are the factor shares used in most of the literature on thedecline of the labor share, e.g., Karabarbounis and Neiman, 2014).
31

of the capital share implies a higher rise in the capital share over the last few decades. By our
estimates, the rise in the European corporate capital share since the early 1990s is twice as large
as recorded in the national account data used, e.g., by Karabarbounis and Neiman (2014).
Profit shifting also has significant effect on trade balances. For instance, after accounting for
profit shifting, Japan, the U.K., France, and Greece turn out to have trade surpluses in 2015,
in contrast to the published data that record trade deficits. According to our estimates, the
true trade deficit of the United States was 2.1% of GDP in 2015, instead of 2.8% in the official
statistics—that is, a quarter of the recorded trade deficit of the United States is an illusion of
multinational corporate tax avoidance.43
8 Conclusion
What have we learned from this paper? In our view the main finding is that one can obtain a
clear picture of global profit shifting by exploiting the foreign affiliates statistics recently made
available by many countries. These data show that the capital share of corporate value-added
is extremely high in the foreign firms of tax havens, while it is low in the foreign firms of other
countries compared to the capital share of local firms. By exploiting this pattern of differential
profitability as well as new bilateral balance of payments data recently made available by tax
havens, our paper estimates how much each tax haven, each OECD country, and the main
emerging economies gain or lose in profits compared to a benchmark of global tax coordination.
We find that the redistributive effects of financial globalization with unequal rates are large: by
our estimates, close to 40% of multinational profits are shifted to tax havens in 2015. Non-haven
European Union countries appear to be the largest losers from this phenomenon, while very-low
tax countries (and the shareholders of multinational firms) appear to be the main beneficiaries.
Quite counter-intuitively, the fiscal authorities of high-tax countries seem to focus most of their
limited enforcement resources not on tax havens, but on other high-tax countries—a rational
move for them given the incentives they face, and one that can help explain why profit shifting
to tax havens persists despite its sizable cost for many countries.
Our findings have implications for policy. First, they suggest that cutting corporate tax
rates, as the United States has done at the end of 2017, is less likely to generate quick positive
effects on wages than textbook economic models suggest. For wages to rise, factors of production
that complement labor need to increase, which can happen fast if tangible capital flows from
abroad, less so if it is mostly paper profits that move across borders. Second, profit shifting
43See Sandholtz (2018) for an estimation based on U.S. bilateral trade data.
32

raises challenges in a number of policy areas. It reduces the effective rates paid by multinationals
corporations compared to what local firms pays, which could adversely affect competition. It
reduces the taxes paid by the wealthy—as ownership of these firms is concentrated—which might
call for offsetting changes in individual income taxation, or changes in the way multinational
companies are taxed. Moreover, while the OECD and the European Union are currently trying
to facilitate dispute resolution between countries, we point out that this may come with the
adverse effect of crowding out corrections involving tax havens, hence ultimately result in more
profit shifting—the opposite outcome of the stated goal of these policy initiatives.
We stress that our estimates of the amount of profits shifted by multinationals globally is
conservative. Our investigation has uncovered important statistical gaps that limit our ability
to monitor global economic activity and constrain tax enforcement. Statistical improvements
are necessary. To solve the asymmetries in bilateral foreign affiliates and direct investment
statistics (in particular between the United States and European tax havens), national statistical
authorities need to be authorized to exchange micro-data. The foreign affiliates statistics that
we exploited in this paper need to be compiled by more countries and expanded to include
more information, such as interest payments, corporate income taxes paid, and capital stocks
(as the United States already does). A number of Caribbean tax havens do not currently
publish comprehensive enough national account (for instance, they set profits to zero in the
offshore sector). Last and maybe most importantly, many countries—including the United
States and a number of tax havens—could improve their public corporate registries so that
all firms are included and profit information is made publicly available at the subsidiary level.
Altogether, these improvements would significantly improve our ability to study globalization
and its distributional effects.
Our analysis has focused on how financial globalization with unequal rates has redistributed
tax bases across countries. In future research, it would be good to introduce the inequality
dimension in the analysis, i.e., to quantify how much the various income and wealth groups
in each country have gained or lost from this phenomenon. It would also be good to include
non-tax driven capital flows. We have found that overall, capital intensities do not seem to
be markedly higher in low-tax places, but this does not imply that capital is not mobile in-
ternationally. Including in the analysis the non-tax determinants of firm location along with
the redistributive consequences across income groups would make it possible to offer a full-
fledged macro-distributional analysis of financial globalization. This raises major conceptual
and empirical challenges for future research.
References
Alstadsæter, Annette, Niels Johannesen, and Gabriel Zucman. 2018. “Who Owns the
Wealth in Tax Havens? Macro Evidence and Implications for Global Inequality”. Journal of
Public Economics, forthcoming.
Altshuler, Rosanne and Grubert, Harry. 2005. “The Three Parties in the Race to the Bot-
tom: Host Governments, Home Governments and Multinational Companies”. CESifo Working
Paper Series No. 1613
Angulo, Emma and Alicia Hierro. 2014. “Asymmetries in the Coordinated Direct Invest-
ment Survey: What Lies Behind?”. IMF working paper.
Auerbach, Alan J. 2010. “A Modern Corporate Tax.” The Hamilton Project/Center for
American Progress, December.
Avdjiev Stefan, Mary Everett, Philip R. Lane, and Hyun Song Shin. 2018. “Tracking
the international footprints of global firms”, BIS Quarterly Review, March, p. 47-66.
Avi-Yonah, Reuven S., and Kimberly A. Clausing. 2007. “Reforming Corporate Taxa-
tion in a Global Economy: A Proposal to Adopt Formulary Apportionment”, Hamilton Paper
Discussion project 2007-08.
Becker, Johannes and Ronald B. Davies. 2014. “A Negotiation-Based Model of Tax-
Induced Transfer Pricing”. CESifo working paper #4892.
Bernard, Andrew B., J. Bradford Jensen, and Peter K. Schott. 2006. “Transfer
Pricing by U.S. Based Multinational Firms”. NBER working paper #12493.
Bruner, Jennifer, Dylan G. Rassier, and Kim J. Ruhl. 2018. “Multinational Profit
Shifting and Measures throughout Economic Accounts”, working paper.
Clausing, Kimberly A. 2003. “Tax-motivated transfer pricing and US intrafirm trade prices”.
Journal of Public Economics, 87: 2207–2223.
Clausing, Kimberly A. 2009. “Multinational firm tax avoidance and tax policy”. National
Tax Journal, 62 (4): 703–725.
Clausing, Kimberly A. 2011. “The revenue effects of multinational firm income shifting.”
Tax Notes, p.1580–1586.
Clausing, Kimberly A. 2016. “The Effect of Profit Shifting on the Corporate Tax Base in
the United States and Beyond.” National Tax Journal, 69(4), 905–934.
Cobham, Alex and Petr Jansky. 2018. “Global distribution of revenue loss from corporate
tax avoidance: reestimation and country results.” Journal of International Development, 30(2),
206–232.
Cobham, Alex and Simon Loretz. 2014. “International Distribution of the Corporate Tax
Base: Implications of Different Apportionment Factors under Unitary Taxation.” ICTD working
paper #27.
Cristea, Anca D. and Daniel X. Nguyen. 2016. “Transfer Pricing by Multinational Firms:
New Evidence from Foreign Firm Ownerships.” American Economic Journal: Economic Policy,
8(3): 170–202.
Crivelli, Ernesto, Ruud de Mooij, and Michael Keen. 2015. “ Base Erosion, Profit
Shifting and Developing Countries,” IMF working paper 15/118.
34

Damgaard Jannick, and Thomas Elkjaer. 2017. “The Global FDI Network: Searching for
Ultimate Investors”, working paper, Danmarks Nationalbank.
De Simone, Lisa, Lillian F. Mills, and Bridget Stomberg. 2017. “Using IRS Data to
Identify Income Shifting to Foreign Affiliates.” Working paper.
Desai, Mihir A., C. Fritz Foley, and James R. Hines Jr.. 2003. “Chains of Ownership,
Regional Tax Competition, and Foreign Direct Investment.” in Herrmann, Heinz and Robert
Lipsey (eds.) Foreign Direct Investment in the Real and Financial Sector of Industrial Countries.
Springer Verlag: Heidelberg.
Desai, Mihir A., C. Fritz Foley, and James R. Hines Jr. 2016. “Trade Credit and
Taxes.” Review of Economics and Statistics, 98(1): 132–139.
Devereux, Michael P. and John Vella. 2017. “Implications of digitalization for interna-
tional corporate tax reform.” Oxford University Center for Business Taxation Working paper
17/07.
Dharmapala, Dhammika. 2014. “What Do We Know About Base Erosion and Profit Shift-
ing? A Review of the Empirical Literature.”” CESIFO Working Paper #4612.
Dharmapala, Dhammika, and Nadine Riedel. 2013. “Earnings shocks and tax-motivated
income-shifting: evidence from European multinationals.” Journal of Public Economics 97:
95–107.
Dowd, Tim, Paul Landefeld, and Anne Moore. 2017. “Profit Shifting of U.S. Multina-
tionals.” Journal of Public Economics, 148: 1–13
Eurostat. 2012. “Foreign AffiliaTes Statistics (FATS) Recommendations Manual.”
Faulkender, Michael W., Kristine W. Hankins, and Mitchell A. Peterson. 2017.
“Understanding the Rise in Corporate Cash: Precautionary Savings or Foreign Taxes, NBER
working paper No. 23799
Gravelle, Jane G. 2009. “Tax Havens: International Tax Avoidance and Evasion .” National
Tax Journal, 62(4): 727–753.
Grubert, Harry. 2013. “Foreign taxes and the growing share of U.S. multinational company
income abroad: profits, not sales, are being globalized.” National Tax Journal, 65(2): 247–281.
Guvenen, Fatih, Raymond J. Mataloni Jr., Dylan G. Rassier, and Kim J. Ruhl.
2018. “Offshore Profit Shifting and Domestic Productivity Measurement”, Federal Reserve
Bank of Minneapolis working paper #751.
Heckemeyer, Jost H., and Michael Overesch. 2013. “Multinationals? Profit Response to
Tax Differentials: Effect Size and Shifting Channels.” ZEW Discussion Papers 13-045.
Hong, Qing, and Michael Smart. 2010. “In Praise of Tax Havens: International Tax
Planning and Foreign Direct Investment.” European Economic Review, 54(1): 82–95.
Huizinga, Harry, and Luc Laeven. 2008. “International profit shifting within multination-
als: a multi- country perspective.” Journal of Public Economics, vol. 92, 1164–1182.
Huizinga, Harry, Luc Laeven, and Gaetan Nicodeme. 2008. “Capital Structure and
International Debt Shifting,” Journal of Financial Economics, 88 (1), 80–118
International Monetary Fund. 2009. “Balance of Payments Manual,” 6th Edition.
Jansky, Peter and Miroslav Palansky. 2017. “Estimating the scale of profit shifting and
tax revenue losses related to foreign direct investment,” IES Working Paper No. 25/2017.
35

Johannesen, Niels. 2010. “Imperfect Tax Competition for Profits, Asymmetric Equilibrium
and Beneficial Tax Havens.” Journal of International Economics, 81(2): 253–64.
Johansson, Asa, Øystein Bieltvedt Skeie, Stephane Sorbe, and Carlo Menon. 2017.
“Tax Planning by Multinational Firms: Firm-Level Evidence from a Cross-Country Database”,
OECD Economics Department working paper 1355.
Kalemli-Ozcan, Sebnem, Bent Sørensen, Carolina Villegas-Sanchez, Vadym Volosovych,
and Sevcan Yesiltas. 2015. “How to Construct Nationally Representative Firm Level Data
from the ORBIS Global Database.” NBER Working Paper No. 21558.
Kanbur, Ravi and Keen, Michael. 1993. “Jeux Sans Frontieres: Tax Competition and Tax
Coordination When Countries Differ in Size.” American Economic Review, 83(4): 877–892
Karabarbounis, Loukas and Brent Neiman. 2014. “The Global Decline of the Labor
Share.” Quarterly Journal of Economics 129(1), 61-103.
Keen, Michael, and Kai Konrad. 2013. “The Theory of International Tax Competition
and Coordination,” Handbook of Public Economics, vol. 5.
Lane, Philip R. and Gian Maria Milesi-Ferretti. 2018. “The External Wealth of Nations
Revisited: International Financial Integration in the Aftermath of the Global Financial Crisis,”
IMF Economic Review, 66:189–222.
Lohse, Theresa, and Nadine Riedel. 2013. “Do Transfer Pricing Laws Limit International
Income Shifting? Evidence from European Multinationals”, working paper.
Markle, Kevin S. 2012. “A Comparison of Tax Motivated Income Shifting of Multinationals
in Territorial and Worldwide Countries.” Contemporary Accounting Research, 33(1): 7–43.
Organization for Economic Co-operation and Development.. 2015. “Base Erosion and
Profit Shifting, Final Report”,
Organization for Economic Co-operation and Development. 2016. “Irish GDP up by
26.3% in 2015?”, available online at http://www.oecd.org/sdd/na/Irish-GDP-up-in-2015-OECD.
pdf.
Piketty, Thomas, and Gabriel Zucman. 2014. “Capital is Back: Wealth-Income Ratios in
Rich Countries, 1700–2010,” Quarterly Journal of Economics, 129(3), 1255–1310.
Pomeroy, James. 2016. “The Rise of the Digital Natives.” HSBC report, September.
Saez, Emmanuel and Gabriel Zucman. 2016. “Wealth Inequality in the United States
since 1913: Evidence from Capitalized Income Tax Data,” Quarterly Journal of Economics,
131(2), 519–578.
Sandholtz, William H. 2018. “Corporate Tax Rate Differentials and Transfer Mispricing:
Evidence from Bilateral Trade Data”, working paper.
Slemrod, Joel and John D. Wilson. 2009. “Tax competition with parasitic tax havens.”
Journal of Public Economics, 93, 1261–1270.
Suarez Serrato, Juan Carlos. 2018. “Unintended Consequences of Eliminating Tax Havens,”
working paper.
United Nations. 2009. “System of National Accounts 2008.”
Wang, Zi. 2018. “Multinational Production and Corporate Taxes: A Quantitative Assess-
ment”, working paper.
Wier, Ludvig. 2018. “Big and Unprofitable: How 10% of Multinational Firms Do 98% of
Profit Shifting”, working paper.
36

Wier, Ludvig and Hayley Reynolds. 2018. “Big and “Unprofitable”: How 10% of Multi-
national Firms Do 98% of Profit Shifting”, working paper.
Wright, Thomas, and Gabriel Zucman. 2018. ‘The Exorbitant Tax Privilege”, working
paper.
Zucman, Gabriel. 2013. “The Missing Wealth of Nations: Are Europe and the US net
Debtors or net Creditors?” Quarterly Journal of Economics, 128(3), 1321–1364.
Zucman, Gabriel. 2014. “Taxing Across Borders: Tracking Personal Wealth and Corporate
Profits,” Journal of Economic Perspectives, 28(4), 121–148.
Zucman, Gabriel. 2015. The Hidden Wealth of Nations: The Scourge of Tax Havens, Chicago:
University of Chicago Press.
37

Table 1: Global Output, Corporate Output, and Corporate Taxes Paid (2015)
Billions of current US$
% of net corporate
profitsGlobal gross output (GDP) 75,038
Depreciation 11,940
Net output 63,098
Net corporate output 34,083 296%
Net corporate profits 11,515 100%
Net profits of foreign-controlled corp. 1,703 15%
Of which: shifted to tax havens 616 5%
Net profits of local corporations 9,812 85%
Corporate income taxes paid 2,154 19%
Notes: Profits of foreign corporations include all the profits made by companies more than 50% owned by a foreign country; profits of local
corporations equal all corporate profits minus the profits of foreign corporations. Source: Appendix Tables C.5 and A.3.

Table 2: Shifted Profits: Country-by-Country Estimates (2015)
Reported pre-tax profits
Of which: Local firms
Of which: Foreign firms
Shifted profits
Effective corporate tax rate
Corp. tax revenue
loss/gain (% collected)
Australia 179 151 28 12 30% 7%Austria 48 37 11 4 18% 11%Canada 143 96 47 17 35% 9%Chile 68 58 10 5 15% 11%Czech Republic 34 16 17 2 20% 5%Denmark 52 47 5 3 15% 8%Estonia 4 3 1 0 12% 10%Finland 25 21 4 3 20% 11%France 188 156 32 32 27% 21%Germany 553 510 43 55 11% 28%Greece 23 21 1 1 19% 7%Hungary 21 11 10 2 11% 21%Iceland 2 2 0 0 19% 22%Israel 54 48 6 1 17% 2%Italy 212 199 13 23 18% 19%Japan 634 602 32 28 26% 6%Korea 248 246 3 4 18% 2%Latvia 4 3 1 0 10% 7%Mexico 325 302 23 12 12% 10%New Zealand 44 37 6 1 18% 5%Norway 76 69 7 5 22% 8%Poland 88 68 19 4 10% 8%Portugal 27 22 5 3 23% 9%Slovakia 12 6 5 1 25% 5%Slovenia 3 2 1 0 18% 6%Spain 159 138 21 14 18% 14%Sweden 63 39 24 9 23% 13%Turkey 213 209 4 5 6% 8%United Kingdom 425 353 72 61 17% 18%United States 1,889 1,737 153 142 21% 14%
Brazil 274 245 30 13 20% 8%China 2,069 1,906 162 55 20% 3%Colombia 59 52 7 1 29% 2%Costa Rica 13 12 1 1 12% 19%India 376 368 8 9 10% 8%Russia 290 253 37 11 14% 5%South Africa 76 68 9 4 25% 6%
Belgium 80 48 32 -13 19% 16%Ireland 174 58 116 -106 4% 58%Luxembourg 91 40 51 -47 3% 50%Malta 14 1 13 -12 5% 90%Netherlands 195 106 89 -57 10% 32%Caribbean 102 4 98 -97 2%` 100%Bermuda 25 1 25 -24 0%Singapore 120 30 90 -70 8% 41%Puerto Rico 53 10 43 -42 3% 79%Hong Kong 95 45 50 -39 18% 33%Switzerland 95 35 60 -58 21% 20%Other -51
OECD countries
Main developing countries
Tax havens
Notes: amounts are in current billion US$. All data are for 2015. Source: Appendix Tables A.6., A.7,
C.4d, and C.4.

Table 3: Macro Statistics Corrected for Profit Shifting (2015)
Corrected capital share
Difference with published data
Corrected trade balance
Difference with published data
Australia 26% +1.1% -1.4% +0.8%Austria 29% +1.3% 4.1% +0.8%Canada 24% +1.4% -1.4% +0.9%Chile 51% +1.5% 1.8% +1.8%Czech Republic 39% +1.0% 6.5% +0.7%Denmark 31% +1.2% 8.2% +0.8%Estonia 35% +1.1% 5.0% +0.9%Finland 28% +1.6% 0.9% +1.0%France 19% +2.1% 0.4% +1.1%Germany 31% +1.8% 9.2% +1.2%Greece 43% +1.1% 0.3% +0.5%Hungary 39% +2.3% 10.4% +1.5%Iceland 33% +3.4% 9.5% +2.0%Israel 37% +0.2% 3.2% +0.2%Italy 30% +1.9% 3.9% +1.0%Japan 28% +0.8% 0.0% +0.5%Korea 37% +0.4% 8.0% +0.2%Latvia 31% +0.9% -0.5% +0.6%Mexico 71% +0.6% -1.2% +0.9%New Zealand 44% +0.7% 1.4% +0.7%Norway 41% +1.2% 6.5% +1.0%Poland 45% +0.9% 3.7% +0.6%Portugal 33% +1.8% 2.8% +1.1%Slovakia 35% +1.1% 3.4% +0.6%Slovenia 18% +0.9% 9.1% +0.4%Spain 29% +1.6% 3.4% +1.0%Sweden 31% +2.2% 6.3% +1.4%Turkey 55% +0.4% -2.3% +0.5%United Kingdom 31% +2.5% 0.2% +1.8%United States 27% +1.1% -2.1% +0.7%
Brazil 26% +1.0% -0.3% +0.5%China 44% +0.5% 3.7% +0.4%Colombia 54% +0.5% -5.9% +0.4%Costa Rica 45% +1.9% 1.6% +1.7%India 56% +0.5% -2.6% +0.4%Russia 40% +0.8% 8.9% +0.7%South Africa 39% +1.4% 0.0% +1.0%
OECD countries
Main developing countries
Source: Appendix Tables C.5 and C.5b.
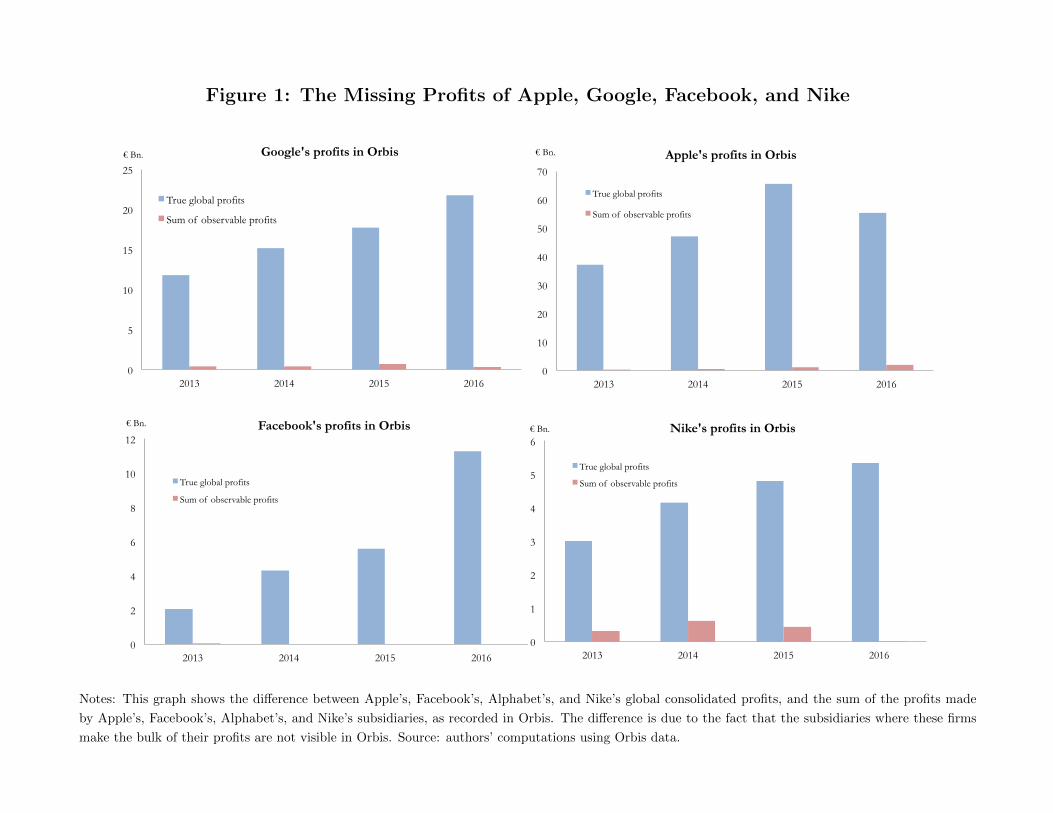
Figure 1: The Missing Profits of Apple, Google, Facebook, and Nike
0
5
10
15
20
25
2013 2014 2015 2016
€ Bn. Google's profits in Orbis
True global profits
Sum of observable profits
Note: This graph shows Google's global consolidated profits, and the sum of the profits made by Google's subsidiaries, as recorded in Orbis. The difference is due to the fact that the subsidiaries where Google makes the bulk of its profits are not visible in Orbis.
0
10
20
30
40
50
60
70
2013 2014 2015 2016
€ Bn. Apple's profits in Orbis
True global profits
Sum of observable profits
Note: This graph shows Apple's global consolidated profits, and the sum of the profits made by Apple's subsidiaries, as recorded in Orbis. The difference is due to the fact that the subsidiaries where Apple makes the bulk of its profits are not visible in Orbis.
0
2
4
6
8
10
12
2013 2014 2015 2016
€ Bn. Facebook's profits in Orbis
True global profits
Sum of observable profits
Note: This graph shows Facebook's global consolidated profits, and the sum of the profits made by Facebook's subsidiaries, as recorded in Orbis. The difference is due to the fact that the subsidiaries where Facebook makes the bulk of its profits are not visible in Orbis.
0
1
2
3
4
5
6
2013 2014 2015 2016
€ Bn. Nike's profits in Orbis
True global profits
Sum of observable profits
Note: This graph shows Nike's global consolidated profits, and the sum of the profits made by Nike's subsidiaries, as recorded in Orbis. The difference is due to the fact that the subsidiaries where Nike makes the bulk of its profits are not visible in Orbis.
Notes: This graph shows the difference between Apple’s, Facebook’s, Alphabet’s, and Nike’s global consolidated profits, and the sum of the profits made
by Apple’s, Facebook’s, Alphabet’s, and Nike’s subsidiaries, as recorded in Orbis. The difference is due to the fact that the subsidiaries where these firms
make the bulk of their profits are not visible in Orbis. Source: authors’ computations using Orbis data.

Figure 2: The Missing Profits in Orbis
Note: This graph shows the imperfect coverage in Orbis. For each multinational firm we take the sum of profits made by all subsidiaries registered in
Orbis and divide by the global profits of the same multinal firm. Whenever the share is lower than 1 this means that we only see part of the global
profits in Orbis. .
Weighted average = 0.172
0.1
.2.3
0 .2 .4 .6 .8 1Share of profits found in 2012
Fraction of firms
Weighted average: 0.17
Share of global profits found in 2012
The missing profits in Orbis
0% 20% 40% 60% 80% 100%
30%
20%
10%
0%
Weighted average: 17%
Notes: This graph shows the density of the following ratio. For each multinational firm in Orbis, we compute the sum of the unconsolidated pre-tax profits
of all subsidiaries (code U1), and we divide this sum by the consolidated global profits of the firm (code C1). Whenever the ratio is less than 1, this means
that only part of the global profits of the firm are visible at the subsidiary level in Orbis. In 28% of the cases, no profits are visible at the subsidiary level.
The weighted average of 17% is weighed by profit. Source: authors’ computations using Orbis data.

Figure 3: Pre-tax Corporate Profits (% Compensation of Employees)
0%
50%
100%
150%
200%
250%
300%
Luxem
bourg
Ire
land
Puerto
Rico
Sin
gapo
re Hon
g Kon
g Neth
erlan
ds
Belgium
Germ
any
Italy
United
King
dom
Japan
Sp
ain
Austra
lia
United
State
s Sw
itzerl
and
Canad
a Fran
ce
Pre-tax corporate profits (% of compensation of employees )
Average among non-havens: 36%
Notes: the bar shows the ratio of pre-tax corporate profits (net of interest and depreciation) to compensation of employees in 2015, as recorded in national
accounts data. Source: Appendix Table A.7.
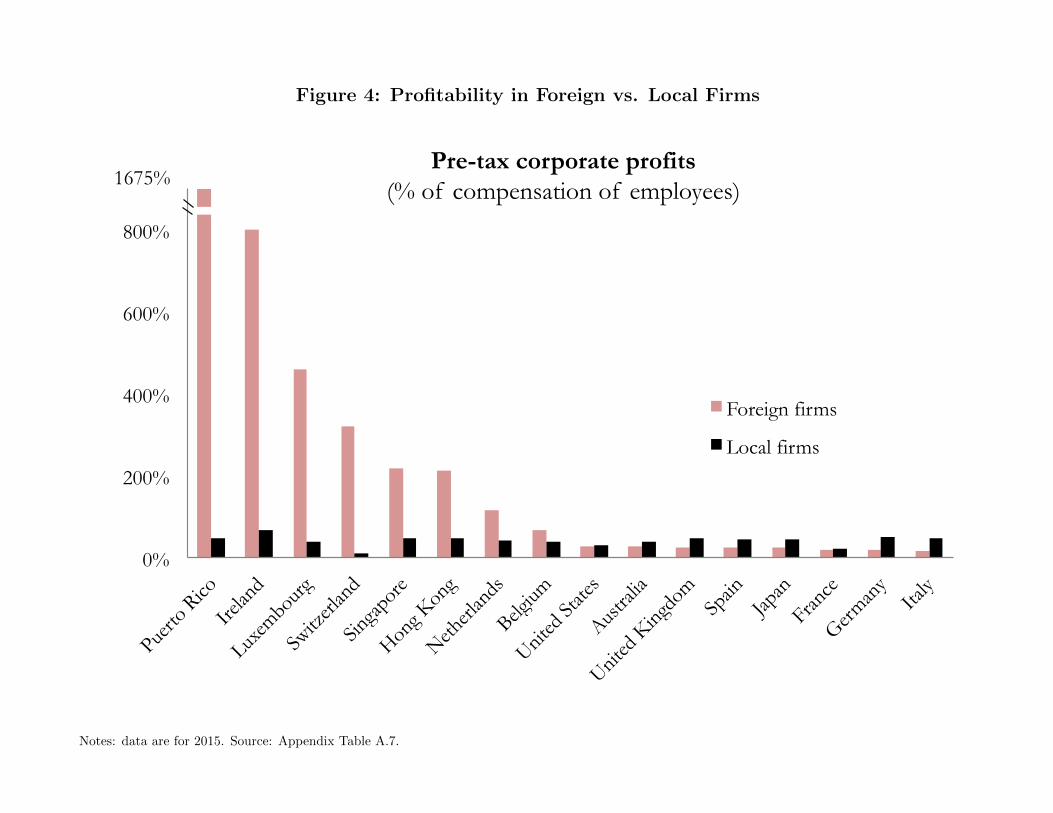
Figure 4: Profitability in Foreign vs. Local Firms
1675%
0%
200%
400%
600%
800%
Puerto
Rico
Ire
land
Luxem
bourg
Sw
itzerl
and
Singa
pore
Hong K
ong
Netherl
ands
Belg
ium
United
State
s Aus
tralia
United
King
dom
Spain
Jap
an
France
Germ
any
Italy
Pre-tax corporate profits (% of compensation of employees)
Foreign firms
Local firms
Notes: data are for 2015. Source: Appendix Table A.7.
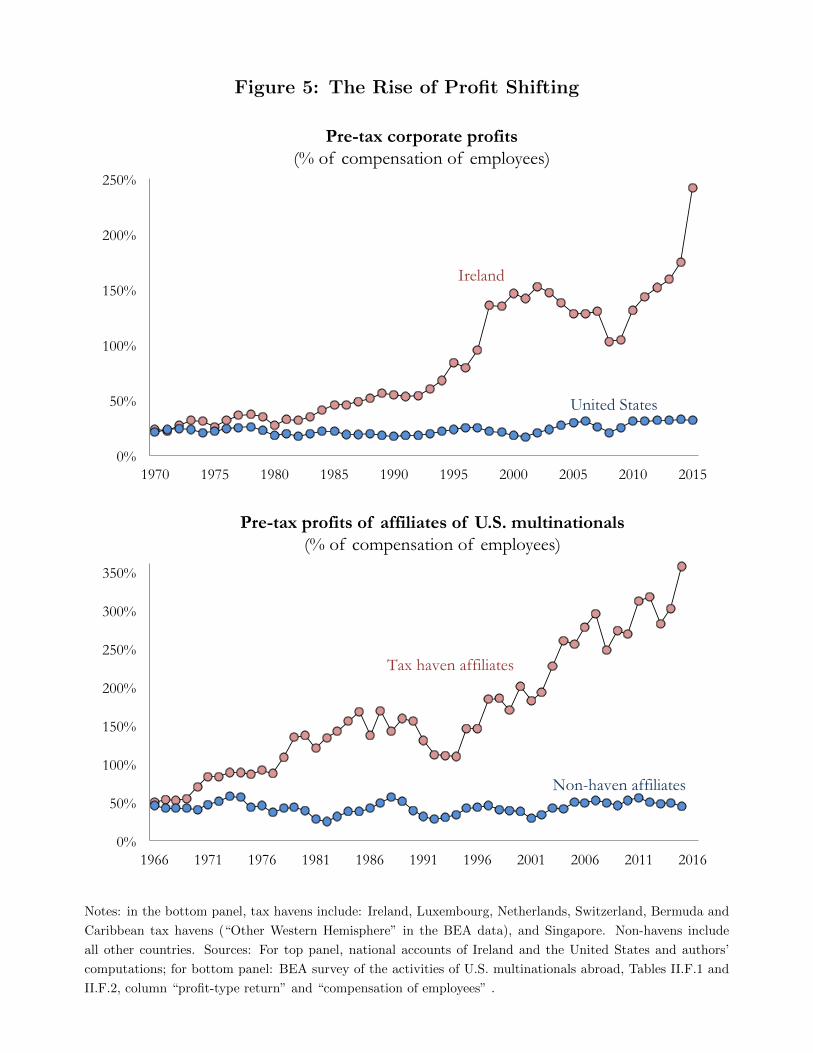
Figure 5: The Rise of Profit Shifting
0%
50%
100%
150%
200%
250%
1970 1975 1980 1985 1990 1995 2000 2005 2010 2015
Pre-tax corporate profits (% of compensation of employees)
Ireland
United States
0%
50%
100%
150%
200%
250%
300%
350%
1966 1971 1976 1981 1986 1991 1996 2001 2006 2011 2016
Pre-tax profits of affiliates of U.S. multinationals (% of compensation of employees)
Tax haven affiliates
Non-haven affiliates
Notes: in the bottom panel, tax havens include: Ireland, Luxembourg, Netherlands, Switzerland, Bermuda and
Caribbean tax havens (“Other Western Hemisphere” in the BEA data), and Singapore. Non-havens include
all other countries. Sources: For top panel, national accounts of Ireland and the United States and authors’
computations; for bottom panel: BEA survey of the activities of U.S. multinationals abroad, Tables II.F.1 and
II.F.2, column “profit-type return” and “compensation of employees” .

Figure 6: The Profits of US Firms: Havens vs. Non-Haven Affiliates
0%
100%
200%
300%
400%
500%
600%
700%
800%
Irelan
d
Bermud
a & C
ar.
Luxem
bourg
Switz
erlan
d
Singa
pore
Netherl
ands
China
Japan
Mex
ico
Belgium
Canad
a In
dia
United
King
dom
Italy
German
y
France
Brazil
Pre-tax profits of affiliates of U.S. multinationals in 2015 (% of compensation of employees)
Average among non-haven affiliates: 49%
0%
100%
200%
300%
400%
500%
1966 1971 1976 1981 1986 1991 1996 2001 2006 2011 2016
The profitability of the affiliates of US multinationals (ratio of Haven affiliates / Non-haven affiliates)
Physical capital / wage (K/wL)
Operating surplus / physical capital (r)
Net interest received (1-p)
Notes: see notes to Figure 5. Source: BEA survey of the activities of U.S. multinationals abroad, Tables II.B
1-2 (column “Plant, property, and equipment (net)” and II.F.1.

Figure 7: Allocating the Shifted Profits
0%
10%
20%
30%
40%
50%
EU US Developing countries Rest of OECD
% o
f to
tal p
rofit
s sh
ifted
to ta
x ha
vens
Allocating the profits shifted to tax havens
Where the shifted profits come from
To whom the shifted profits accrue
0%
2%
4%
6%
8%
10%
12%
14%
16%
18%
20%
EU US Developing countries Rest of OECD
Tax revenue lost due to profit shifting (% of corporate tax revenue collected)
Global average: 10%
Note: Estimates are for 2015. Source: Appendix Tables C.4b, C.4c, and C.4d.

Figure 8: Corporate Tax Revenue in Tax Havens
0%
1%
2%
3%
4%
5%
6%
7%
8%
Malt
a
Luxem
bourg
Cypru
s
Hong K
ong
Japan
Austra
lia
Irelan
d
Canad
a
Belgium
Switz
erlan
d
Korea
Singa
pore
Mex
ico
United
King
dom
Netherl
ands
France
Puerto
Rico
Spain
German
y
United
State
s Ita
ly
Polan
d
Corporate income tax revenue (% of national income)
Average among non-havens: 3.5%
0%
20%
40%
60%
80%
100%
Malt
a
Puerto
Rico
Irelan
d
Luxem
bourg
Cypru
s
Singa
pore
Hong K
ong
Netherl
ands
Switz
erlan
d
Corporate tax revenue collected & tax rate on shifted profits
Revenue collected on shifted profits, % of total revenue
Tax rate on shifted profits
Notes: data are for 2015. Source: Appendix Tables A.3., A.6., A.7, and A.11.
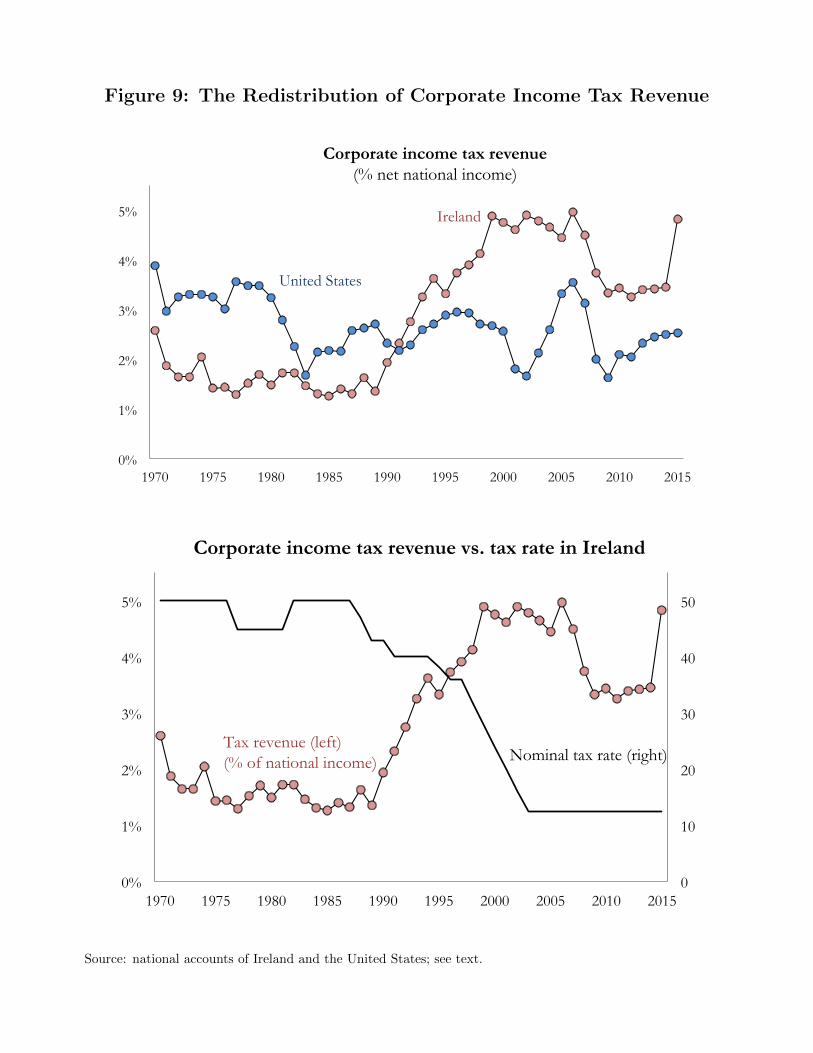
Figure 9: The Redistribution of Corporate Income Tax Revenue
0%
1%
2%
3%
4%
5%
1970 1975 1980 1985 1990 1995 2000 2005 2010 2015
Corporate income tax revenue (% net national income)
Ireland
United States
0
10
20
30
40
50
0%
1%
2%
3%
4%
5%
1970 1975 1980 1985 1990 1995 2000 2005 2010 2015
Corporate income tax revenue vs. tax rate in Ireland
Tax revenue (left) (% of national income) Nominal tax rate (right)
Source: national accounts of Ireland and the United States; see text.
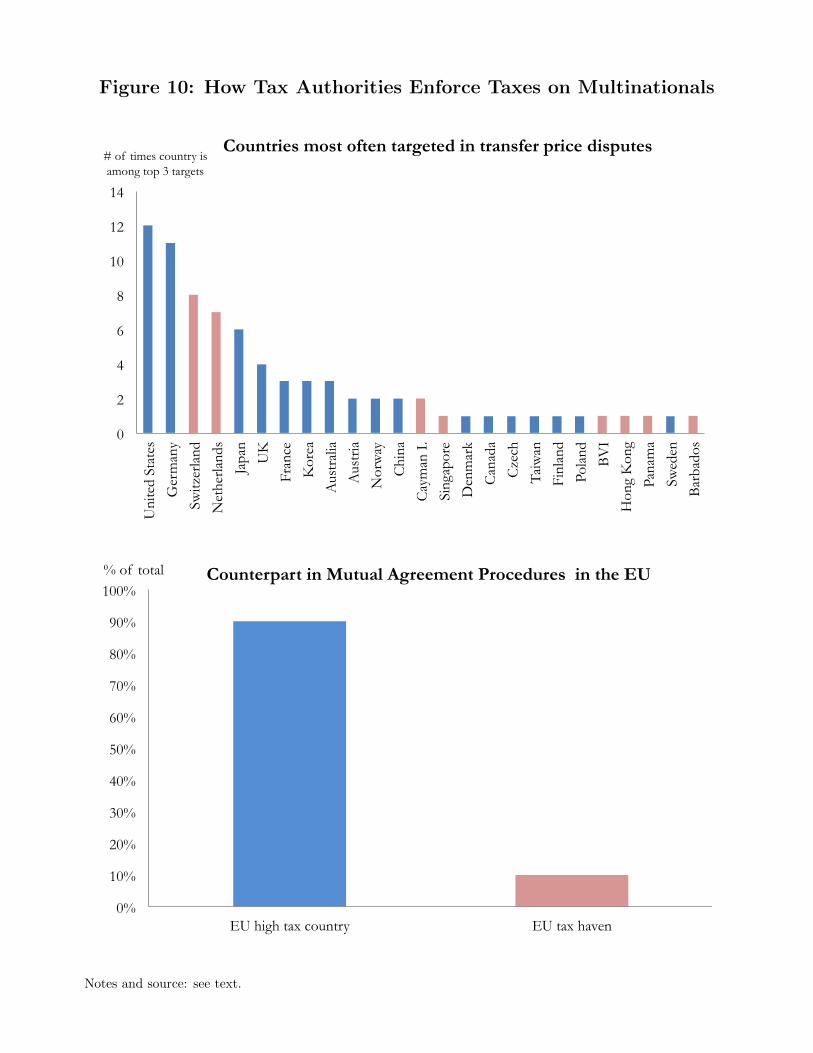
Figure 10: How Tax Authorities Enforce Taxes on Multinationals
0
2
4
6
8
10
12
14
Uni
ted
Stat
es
Ger
man
y
Switz
erla
nd
Net
herla
nds
Japa
n
UK
Fran
ce
Kor
ea
Aus
tral
ia
Aus
tria
Nor
way
Chi
na
Cay
man
I.
Sing
apor
e
Den
mar
k
Can
ada
Cze
ch
Taiw
an
Finl
and
Pola
nd
BV
I
Hon
g K
ong
Pana
ma
Swed
en
Bar
bado
s
# of times country is among top 3 targets
Countries most often targeted in transfer price disputes
0%
10%
20%
30%
40%
50%
60%
70%
80%
90%
100%
EU high tax country EU tax haven
% of total Counterpart in Mutual Agreement Procedures in the EU
Notes and source: see text.