Embed Size (px)
Citation preview

A technical report towards reclaiminguranium mill tailings along the ColoradoRiver in Grand County, Utah
The Moab Mill Project

Suporrted by a grant from: The Citizens’ Monitoring and Technical Assessment Fund • www.mtafund.org
Acknowledgements: Sarah M. Fields, Victoria Woodard, Bill Love, Ken Sleight, David Orr, John Weisheit, Owen Lammers, John Dohrenwend,Noam Greenbaum, Victor Baker, Tess Harden, Kealan Partlow, Lara Derasary, Janet Ezekiel, Naomi Porat, Rafi Halevi, Tag-A-Long Expeditions,Canyon Voyages, World Wide River Expeditions, Wildland Scapes, University of Arizona, University of Haifa, Bureau of Land Management, andNational Park Service.
This report is available on the World Wide Web: http://www.livingrivers.org/MoabMillProject.pdf
Citation: Weisheit, J. S., and S. M. Fields, editors, 2006, The Moab Mill Project: A technical report towards reclaiming uranium mill tailings along the Colorado Riverin Grand County, Utah. Living Rivers, Moab, Utah.

Purpose: This study evaluates the analyses by the Department of Energy(DOE) concerning flood flows on the Colorado River in the vicinity of theMoab Mill Project Site at Moab, Utah (former Atlas Uranium Mill), and otherrelevant information regarding the erosional potential of the Colorado Riverduring an extreme flood event. Specifically, the evaluations address probablemaximum floods by investigating paleoflood deposits upstream of theuranium mill tailings pile, in addition to historic river channel migration inthe vicinity of the pile.
Need: Concerned citizens of Moab and Grand County understood theuranium tailings pile (12 million tons) adjacent to the Colorado River posed aserious health hazard for residents, visitors, downstream water consumers,and endangered species. In 2004 it appeared certain that the DOE wouldmitigate this hazardous material by stabilizing and armoring the tailings pilein place alongside the Colorado River.
To these citizens, knowing the variable extremes in the natural flow of theColorado River, such a decision seemed irresponsible. There seemed to be nosound basis for a DOE determination that the integrity of the tailings from200 to 1,000 years could be reasonably guaranteed; such a determination isrequired by federal regulation. Funding was sought to retain experts toevaluate the scientific assumptions related to the historic flood and channelmigration behavior of the Colorado River in the vicinity of Moab. Furtherscientific study, including fieldwork, was required to address some of themany uncertainties associated with the historic flood potential and, thus, thefuture flood potential of the river in the vicinity of the site.
Results: Two reports were commissioned and are contained herein.
The first, prepared by Dr. John C. Dohrenwend (University of Arizona), is anevaluation of the scientific investigations as presented in the 2004 DOE DraftEnvironmental Impact Statement (DEIS). Though the DEIS did notspecifically include a preferred alternative for tailings reclamation, thefindings suggested that capping the waste pile in place along the Colorado
PO Box 466
Moab, UT 84532
(435) 259-1063
www.livingrivers.org
River remained a viable consideration. Dr. Dohrenwend's findings chal-lenged the assumptions of the DOE relating to floodplain meanders of theColorado River adjacent to the Moab site. In the context of the NationalEnvironmental Policy Act (NEPA) process, the DOE responded to Dr.Dohrenwend’s findings and additional new information relating to thebehavior of the Colorado River. The DOE finally concluded that, indeed, toomany uncertainties were associated with the long-term stability of thetailings on the floodplain and chose an off-site disposal alternative.
The second, prepared by Dr. Noam Greenbaum (University of Haifa),represents the first-ever professional paleoflood study on the main stemColorado River above Lee's Ferry, Arizona. His findings bring forth newscientific data that challenge assumptions regarding the probable maximumflood and the number and intensity of floods over the past several thousandyears. The results of his study provide further justification for the DOEdecision to relocate the tailings to an off-site location. The paleoflood studyalso has important implications for research on of the long-term hazardsassociated with potential floods in the upper Colorado River and itstributaries.
Recommendation: Continue paleoflood research on the Colorado River,Green River, and San Juan River above Lake Powell for future resourcemanagement planning.
Editors: John S. Weisheit and Sarah M. Fields (July, 2006)
Cover photo: Floodplain before development of the Moab Uranium Mill.Whitman Cross, 1905. USGS Library, Denver.
Inside cover photo: Tailings pile at Moab Project Site from the ColoradoRiver. John Weisheit, 2005.

Table of Contents
A Review: Department of Energy’s Assessment of Potential Flood Hazards at the Moab Project SiteJohn C. Dohrenwend.............................................................................................................................................................................. 1
Paleofloods in the Upper Colorado River near Moab, UtahNoam Greenbaum, John S. Weisheit, Tess Harden, and John C. Dohrenwend.............................................................................. 13
List of Figures, Photos, and Tables
A Review: Department of Energy’s Assessment of Potential Flood Hazards at the Moab Project Site
Fiqures 1a and 1b: Locations of the Moab Project Site...................................................................................................................... 2Figure 2: Channel positions of the Colorado River.............................................................................................................................3Figure 3a. Vertical aerial photograph of the Moab Project Site in 1962............................................................................................4Figure 3b. Vertical aerial photograph of the Moab Project Site in 1983............................................................................................5Figure 4a: Locations and ages of Colorado River gravels..................................................................................................................6Figure 4b: Schematic diagram of river gravel locations.....................................................................................................................7Figure 5: Vertical aerial photograph showing the minimum extent of the Colorado River gravels............................................8Fiqure 6: NESW diagrammatic cross-section showing approximate thickness of the valley fill................................................. 9
Paleofloods in the Upper Colorado River near Moab, Utah
Figure 1: Locations of the study area, gauging stations, and tributaries.........................................................................................13Figure 2: Annual maximum peak discharges of the Colorado River at Cisco gauging station....................................................14Figure 3: Satellite photo of the region and the study area................................................................................................................. 15Figure 4: The study reach of the main SWD accumulations and cross-sections of the survey..................................................... 16Figure 5: A map showing the location of the pits at the study site.................................................................................................. 16Picture 1: Photo of the study site and pits........................................................................................................................................... 17Picture 2: Photo of the study site and pits........................................................................................................................................... 18Figure 6: Vertical and horizontal locations of the pits........................................................................................................................19Figure 7: Stratigraphic sections of the pits at the upper depression................................................................................................ 20Figure 8: Stratigraphic sections of the pits at the lower depression.................................................................................................21Figure 9: Stratigraphic section at the floodplain................................................................................................................................. 22Figure 10: Proposed correlation between flood units at the upper depression.............................................................................. 22Figure 11: Proposed correlation between flood units at the lower depression............................................................................... 23Figure 12: Cross-section No. 9 through the Colorado River at the study site.................................................................................24Tables 1 and 2: Properties of the SWDs at the pits and results of radiocarbon dating.................................................................. 25Tables 3 and 4: Results of luminescence dating and summary of paleoflood deposits.................................................................26Table 5 (Appendix): Results of luminescence dating of paleoflood deposits..................................................................................29Conversion Table: Metric to U. S. Customary......................................................................................................................................29

1
A Review: Department of Energy’s Assessment ofPotential Flood Hazards at the Moab Project Site
(Atlas Tailings Pile), January 2005
John C. Dohrenwend, Ph.D.Adjunct Professor of Geosciences
University of ArizonaSouthwest Satellite Imaging
PO Box 1467Moab, Utah 84532
Introduction
For almost 25 years, the City of Moab, Grand County, and the State of Utahhave all been faced with a difficult and contentious problem: what to dowith the former Atlas Uranium Mill tailings pile located on the ColoradoRiver floodplain just north of town? On the one hand, an impressive num-ber of scientists and engineers working for Atlas Minerals Corporation, theNuclear Regulatory Commission, and the Department of Energy (DOE)have written reports suggesting that the pile is safe and will not be compro-mised by even the largest of floods that could possibly occur in the area.Common sense suggests that the location of the pile isn’t safe, because theColorado River is notorious for the extreme variability of its flows.
Flows in historic times have ranged from base flows of 2,500 to 4,000 cubicfeet per second (cfs) during the dry months of late summer, fall, and winterto as much as 125,000 cfs during the snowmelt floods of late spring andearly summer. Moreover, the site of the mill and tailings pile is located onthe Colorado River floodplain on the outside of a large bend in the riverchannel.
The potential impact of an extreme flood is considered by many people to beone of the key issues relating to the safety of the mill site. However, thispossibility is not adequately considered in the Draft Environmental ImpactStatement (DEIS) on “Remediation of the Moab Uranium Mill Tailings”released by the DOE on November 3, 2004. Instead, limited references aremade to four previous reports that discount flooding as a serious problem.These reports are:
Harvey, M. D., and S. A. Schumm, 1982, Geomorphic evaluation of the longterm stability of the below grade disposal system site, Atlas MineralsUranium Extraction Facilities, Moab, Utah: Water Engineering andTechnology, Inc., Shreveport, Louisiana, unpublished report, 30 p.
Mussetter, R. A., and M. D. Harvey, 1994, Geomorphic, hydraulic and lateralmigration characteristics of the Colorado River, Moab, Utah, Final Report:Mussetter Engineering, Inc., Ft. Collins, Colorado, unpublished report toCanonie Environmental and Atlas Corporation (MEI Ref. No, 9402), 102 p.
U. S. Department of Energy (Grand Junction Office), 2002, Lithologic, wellconstruction and field sampling results from the 2002 field investigation:Report, October 2002, 60 p.
U. S. Department of Energy (Grand Junction Office), 2003, Migration poten-tial of the Colorado River channel adjacent to the Moab Project site: LetterReport, November 2003, Revision 2, 11 p. + Figures
The last of these reports draws heavily from the data and interpretationspresented in the previous reports and summarizes the position of the DOEregarding the flood hazard potential at the Moab Mill site. This 19-pagedocument claims that,
Although a conclusive prediction of future river movement is notpossible, evidence suggests that the river is and will continuemigrating to the south and east away from the existing tailings pile.
In support of this claim, the November 2003 letter report presents severaltechnical arguments. These arguments include consideration of:
1) Historical evidence of river migration,
2) Sediment input from Courthouse Wash and Moab Wash,
3) Location and age of river terrace gravels at the north end of Moab Valley,
4) Thickness and distribution of basin fill sediments in the Moab Valley,
5) Rate and character of salt dissolution in the Moab Valley area, and
6) Absence of a cobble gravel bedload downstream of the Portal.
Historical evidence of river migration
Because of the potential impact of an extreme flood on the stability ofthe Atlas tailings pile, the Colorado River and its floodplain between the US191 bridge and the Portal (Figures 1a and 1b) have become one of the mostintensively studied areas in the upper Colorado River basin. This area hasbeen measured, modeled, drilled, and sampled throughout the past twodecades in an effort to predict future changes in the river’s channel.

2
Historic maps, aerial photos, and satellite images have been examined todocument changes in channel form and position over the past 80 years.
According to the analysis included in the November 2003 report, theColorado River is moving south and east towards Moab. However, this ishighly unlikely, because Moab is on the inside of a river bend aimed awayfrom town. In fact, the historical analysis presented in this DOE report isseriously flawed. Several of the maps and aerial photographs used in thisanalysis were not accurately registered to each other. These inaccuracies aremost conspicuous for the DOE interpreted positions of the channel in 1944and 1953. Downriver from the pile, the southwest bank of the river is shownin the DOE analysis to be located in 1944 and in 1953 near the presentposition of the river’s northeast bank. Also, conspicuously inconsistent are
Fiqure 1a. Generalized regional map showing the location of the MoabProject Site (Atlas Site) in east-central Utah. Department of Energy, 2003.
Fiqure 1b. Aerial photograph showing the location of the Moab Project Siteat the north end of the Moab Valley. Department of Energy, 2003.

3
the different channel positions attributed to 1953 (basedon aerial photos) and 1959 (based on the 1959 US Geologi-cal Survey topographic map). This is particularly reveal-ing because the 1959 topographic map was produced fromthe 1953 photos.
By accurately registering all the historic maps and photo-graphs, reliable comparisons between one time andanother can be made, and the picture summarized inFigure 2 emerges clearly. Since 1924 (historic map notshown), the south and east bank (river left, lookingdownstream) has moved progressively north, west, andsouthwest away from Moab. From the bridge to the pile,the south bank has moved north and northwest anaverage of 320 feet since 1944. Downstream from the pile,this bank has moved west and southwest an average of175 feet during this same period. In contrast, most of thenorth and west bank (river right) has remained in essen-tially the same position since 1914. The only significantexception is the area immediately adjacent to the pilewhere the channel appears relatively unstable. In thisarea, the west bank shifted rapidly eastward between 1962and 1983, only to shift westward again sometime before2001. The net result of all of these changes has been aconspicuous 37% narrowing of the channel that occurredmostly between 1962 and 1983. These findings are directlycontrary to the statement in the November 2003 letterreport that “the river is and will continue migrating to thesouth and east away from the existing tailings pile,” andthey cast considerable doubt on the overall integrity of theDOE report. Moreover, the progressive narrowing of thechannel between 1944 and the present implies that theriver’s past behavior may not be a reliable predictor offuture channel changes.
Sediment input from Courthouse Wash and Moab Wash
According to the November 2003 letter report: (a) thetailings pile and former mill site are sited on an alluvialfan developed from Moab Wash and Courthouse Wash;(b) both washes have delivered significant quantities of
Figure 2: Channel positions of the Colorado River in the vicinityof the Moab Project Site in 1944, 1962, 1983, and 2001.John C. Dohrenwend, 2005.
Figure 1

4
sediment to the area in the past, and deposition will continue unless signifi-cant changes occur in the upstream watersheds; and (c) sediment input fromCourthouse Wash and Moab Wash tends to push the river south andprevents lateral migration to the north.
However, as inspection of historical aerial photographs clearly shows theColorado River channel has, in fact, moved more than 300 feet north andnorthwestward between 1944 and the present time (Figures 3a and 3b). Indirect contradiction to DOE’s argument, most of this movement occurreddirectly opposite and immediately downstream from the mouth ofCourthouse Wash.
It has long been recognized that the alluvial fans of desert streams typicallybuild outwards from their valley (or canyon) mouths. However, in someimportant ways, Courthouse Wash is not a typical desert stream. It joins theColorado River less than a quarter mile after leaving the mouth of itsnarrow, steep-walled canyon. During low flows, the much larger flow of theColorado quickly carries away most of the sediment that might otherwise bedeposited at the mouth of the wash. During high flows a very differentsituation may occur.
Like many of the washes that drain the slickrock country in the Moab area,Courthouse Wash is ephemeral, and its flow is highly variable. The washseldom flows with any volume for more than a few days, even after a heavyrain. Flash flooding is common and typically occurs during the southwestmonsoon in mid to late summer. During flash floods, flows down the washmay exceed several thousand cfs and, in extreme cases, may peak at flowsgreater than 10,000 cfs.
Most of the water flowing down the Colorado River comes from the snow-fields of the southern Rocky Mountains. Consequently, the highest flows onthe river almost always occur during the snowmelt floods of late spring. Bymid summer, flow in the river typically drops to somewhere between 2,500and 4,000 cfs. Therefore, whenever a large flash flood occurs on a tributarywash, the result is that for a short time the flow of the tributary exceeds theflow of the main stream. When this happens, the tributary flow may jet allthe way across the main stream channel to the opposite bank.
This unusual role reversal between tributary and main stream can be trulyspectacular. For example, consider this eyewitness account of an event thatoccurred near the downstream end of Westwater Canyon in the late summerof 2002, when washes started running red over the black rocks of thecanyon’s walls: “At the end of the rapids and around the corner, a sidecanyon at Big Hole was spewing water, rocks, and debris across the riverand effectively preventing the rafts from passing the side canyon. The flow
Figure 3a. Vertical aerial photograph of the Colorado River in the vicinity ofthe Moab Project Site in 1962. Department of Energy, 2003.

5
Figure 3b. Vertical aerial photograph of the Colorado River in the vicinityof the Moab Project Site in 1983. Department of Energy, 2003.
Supplemental photograph of Courthouse Wash before the development ofmain stem reservoirs. Dan O’Laurie Museum of Moab. Photographerunknown.
Supplemental photograph of Courthouse Wash as it appears today.Photographer unknown.

Figure 4a: Locations and ages of Colorado River gravels adjacent to the Moab ProjectSite at north end of Moab Valley. A vertical aerial photograph of the area between theAtlas tailings pile and the mouth of Courthouse Wash showing the locations of rivergravels cited in the DOE 2003 letter report. John C. Dohrenwend, 2005.
Assuming the age estimate based on relative soil development is correct, theheight of this terrace would suggest that the Colorado River has beendowncutting at a rate somewhere between 1.8 and 4.5 feet per thousandyears during the past 12,000 to 30,000 years. This is the only terrace on theColorado River that is preserved in Moab Valley. However, preliminary ageestimates based on exposure age dating techniques upstream from MoabValley indicate downcutting rates more on the order of 0.7 feet per thousandyears. If this estimate is correct, then the age of the Courthouse Wash terracewould be closer to 75,000 years.
(2) A wood sample was recovered from DOE bore hole 435 at an elevation ofabout 3,853 feet, approximately 105 feet below the level of the present river
from the side canyon had enough force to shower the rafters upstream witha rain of mud.”
Courthouse Wash has been witnessed to behave in a similar fashion duringlate summer floods, shooting water and debris across the Colorado andsometimes into the sloughs. Firsthand observations of the effects of apowerful flash flood on Courthouse Wash in the mid-1960s provide insightinto the effect of such floods: “The alluvial fan deposited by this flood waslarge enough to temporarily block and divert the flow of the ColoradoRiver.” This incident is a compelling demonstration of the possible short-term dominance of the wash during the summer monsoon season, when theriver is low.
This role reversal has contributed to the accumulation of largequantities of sediment along the south bank of the Colorado Riverdirectly opposite and immediately downstream from the mouth ofthe wash. This, in turn, has contributed to the northward migration ofthe south bank and a significant narrowing of the river channel.
Location and age of river terrace gravels at the north end of MoabValley
River gravels are exposed on a strath terrace surface at the mouth ofCourtwash Wash. This terrace surface is an erosional feature cut inbedrock. The elevation of this terrace is about 4,012 feet, approxi-mately 54 feet above the present level of the Colorado River channel(Figure 4a). The age of this terrace has been estimated to be about12,000 to 30,000 years old. This age estimate is based on a compara-tive analysis of soil development. However, the terrace surface issignificantly degraded. Therefore, this age estimate should be consid-ered as very imprecise and is probably much too young.
The November 2003 letter report argues that the location and esti-mated age of this terrace suggests that the river has migrated south-ward over the last 12,000 to 30,000 years. However, there are twosignificant problems with this suggestion:
(1) This terrace is located within the mouth of Courthouse Wash and,therefore, is more a product of Courthouse Wash than the ColoradoRiver. Colorado River gravels are preserved on the terrace surface.However, these gravels could have been deposited during a largeflood on the Colorado River, and, therefore, they do not necessarilyindicate the exact position of the Colorado River channel at the timeof deposition.
6
7
has flowed through the site in the past, and they suggest the possibility ofeither significant subsurface instability or extreme channel scour in thevicinity of the Moab Project site at sometime during the recent geologic past.
Thickness and distribution of basin fill sediments in the Moab Valley
The reports cited in the DEIS to substantiate the contention that theColorado River is moving away from the tailings pile have not reported orconsidered all available data regarding the thickness and distribution ofvalley filling deposits in the Moab Valley.
For example, the data developed by the groundwater studies of Gardnerand Solomon and the results of subsurface investigations conducted by theDOE in 2002 have not been consistently or carefully considered in DOE’ssubsequent reports. Specifically, the thickness and distribution of valley filldeposits beneath the tailings pile and mill site are certainly much morecomplex than reported in the November 2003 letter report. Figure 8 of thisreport (NESW diagrammatic cross-section, copied from Doelling et. al.,2002) does not include any of these data and shows only a very simplisticinterpretation of the thickness and distribution of the valley fill. Yet noattempt has been made to correct this interpretation to show the implica-tions of the additional bore hole data. Also, the November 2003 letter reportneglected to mention Doelling’s cautionary note regarding his cross-section:“The exact position or trend of this fault (?) is unknown. In fact it may notbe a fault at all, but a dramatic thinning of units northwest of the bend inthe Colorado River.” Moreover, Gardner and Solomon’s bore hole data forareas south and east of the river also are not included in 2003 letter report.
When all of the data are compiled, what they actually show is that thesubsurface conditions directly beneath the tailings pile are much morecomplex than the highly simplistic and relatively benign picture presentedby the November 2003 letter report. Indeed, these data indicate that local-ized subsidence of the valley floor directly beneath the tailings pile must beconsidered as a possible and potentially serious geologic hazard (Figure 6).
Moreover, available well log and bore hole data indicate that the valley fill isnot thickest and deepest south of the present location of the river channel.Rather, these data show that the valley fill is thickest and deepest beneathor, perhaps, as much as several hundred feet north of the present riverchannel. Consequently, the position of the sloughs in the MathesonWetlands is not directly related to salt-induced subsidence of the valleyfilling sediments. Instead, the sloughs merely mark the lowland boundarybetween the Mill Creek fan and the Colorado River fan. Therefore, even ifthe relatively slow subsurface subsidence of Moab Valley were to affect thevalley’s surface, there is no reason to suppose that continuing subsidence of
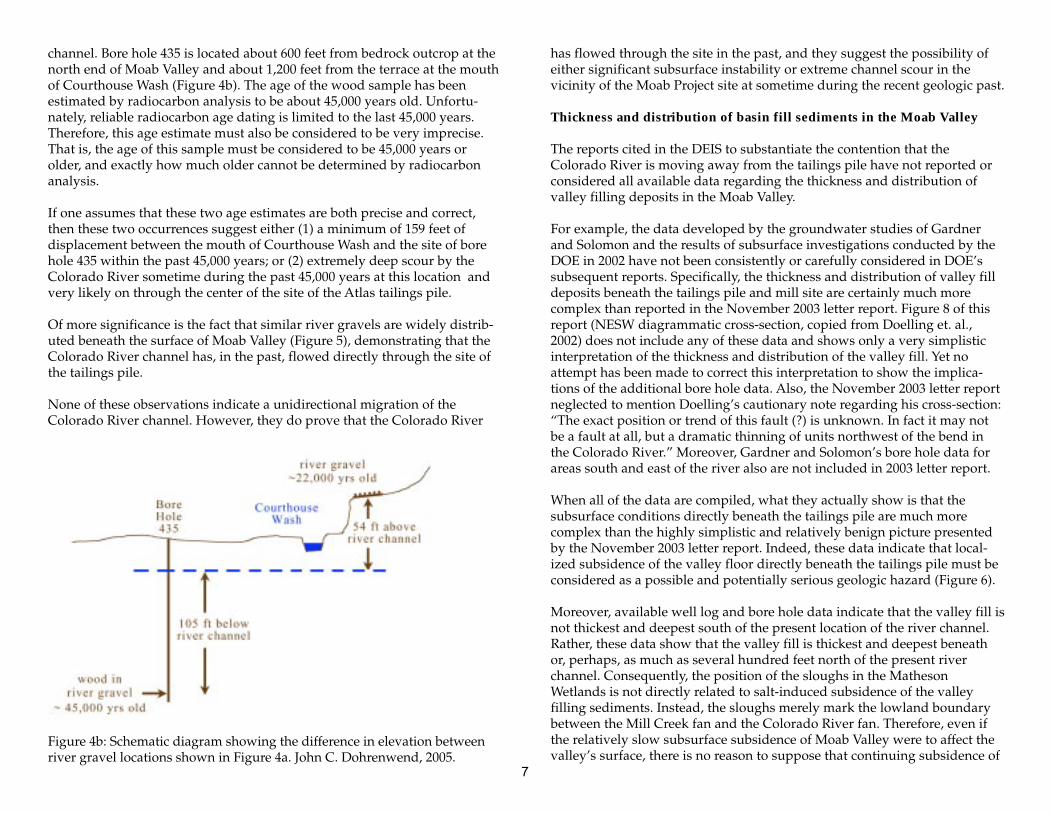
channel. Bore hole 435 is located about 600 feet from bedrock outcrop at thenorth end of Moab Valley and about 1,200 feet from the terrace at the mouthof Courthouse Wash (Figure 4b). The age of the wood sample has beenestimated by radiocarbon analysis to be about 45,000 years old. Unfortu-nately, reliable radiocarbon age dating is limited to the last 45,000 years.Therefore, this age estimate must also be considered to be very imprecise.That is, the age of this sample must be considered to be 45,000 years orolder, and exactly how much older cannot be determined by radiocarbonanalysis.
If one assumes that these two age estimates are both precise and correct,then these two occurrences suggest either (1) a minimum of 159 feet ofdisplacement between the mouth of Courthouse Wash and the site of borehole 435 within the past 45,000 years; or (2) extremely deep scour by theColorado River sometime during the past 45,000 years at this location andvery likely on through the center of the site of the Atlas tailings pile.
Of more significance is the fact that similar river gravels are widely distrib-uted beneath the surface of Moab Valley (Figure 5), demonstrating that theColorado River channel has, in the past, flowed directly through the site ofthe tailings pile.
None of these observations indicate a unidirectional migration of theColorado River channel. However, they do prove that the Colorado River
Figure 4b: Schematic diagram showing the difference in elevation betweenriver gravel locations shown in Figure 4a. John C. Dohrenwend, 2005.

8
the valley floor would cause the river channel to migrate away from thetailings pile. Indeed, if one assumes that the thickest and deepest valley filldeposits mark the position of maximum valley subsidence, then therewould be, in actual fact, strong reason to suppose that continuing subsur-face subsidence could cause the river to move closer to the pile.
Rate and character of salt dissolution in the Moab Valley area
Recent measurements of the ages of the isolated remnants of multiplepaleosurfaces, using cosmogenic isotopic dating techniques, have deter-mined that even some of the highest mesa surfaces between Capitol Reefand Caineville Reef (west of Moab Valley and south of the San Rafael Swell)
are little more than one million years old. All of the buttes, monuments,ridges, and canyons below these mesa tops have been formed by erosionalprocesses during the past one million years. When this information is putinto the context of the results of other geologic research, including radiomet-ric age measurements of the volcanic caprock on Grand Mesa (about 6million years old) and the igneous dikes in Cathedral Valley (about 4 millionyears old), these findings enable the compilation of a much more precisedescription of the erosional history of the Colorado Plateau.
The area of the central Colorado Plateau (and Moab Valley) has been sub-jected to more or less continuous erosion during the past 5 to 6 millionyears. During this time, the rocks and sediments that once covered the
region to the tops of today’s highest mountains have been eroding awayat an average rate approaching one foot per thousand years. By compari-son, average erosion rates in many areas of the American Southwest areonly one or two inches per thousand years. The Colorado Plateau is,therefore, one of the youngest, most rapidly changing landscapes in all ofNorth America, and the principal agent of all of this erosion is, of course,the Colorado River system.
The Moab Valley is the surface expression of a collapsing salt-coredanticline. The salt beds beneath the valley’s subsiding floor are almost 2miles thick. As the Colorado River and its tributaries cut down throughthe thousands of feet of rock that once covered this salt-cored anticline,tremendous volumes of rock were removed and the land surface gradu-ally lowered. Eventually, probably about two million years ago, circulat-ing groundwater reached the level of the uppermost salt beds. As the saltdissolved, the crest of the anticline began to collapse forming the MoabValley. As the river continues to cut down through the plateau, the valleycontinues to subside.
The rates of valley subsidence and river downcutting are closely related.Most of the groundwater beneath the valley surface is a dense salt brine.As the river continues to downcut, fresh near-surface groundwatercontinues to mix with the brine, promoting continued dissolution of thesalt. Thus, it is the river’s downcutting that controls the erosional evolu-tion of the Colorado Plateau and all of its component parts, includingMoab Valley and the site of the Atlas tailings pile.
Absence of a cobble gravel bedload downstream of the Portal
The November 2003 letter report regarding the potential flood hazard atthe Atlas tailings pile observes that large gravels and cobbles are notfound in the active river channel downstream of the Portal, except nearside canyons. This report also maintains that the surface of Moab Valley is
Figure 5: Vertical aerial photograph of the northern end of Moab Valley showing theminimum extent of the Colorado River gravels beneath the valley floor. Modifiedfrom Gardner and Solomon, 2003.
9
The sequence of fine-grained deposits overlying coarse grained deposits istypical of many late Quaternary (less than 50,000 year old) valley fill se-quences in the Southwest. Generally speaking, the gravels were mostlydeposited during late glacial times when precipitation was greater and riverflows were larger (and/or very large floods were more frequent). The finer-grained sediments were deposited during postglacial (Holocene) timeswhen precipitation was less (and/or very large floods were less frequent).This change in the grain size of alluvial deposits is typically most pro-nounced in those areas where river gradients are relatively low. Other thingsbeing equal, alluvial deposits in low gradient areas are a more sensitiveindicator of changes in river flow. This is because declining river flows willfirst lose their ability to carry larger, heavier bed load materials in lowgradient (low energy) river reaches. The result is the typical alluvial fillsequence where glacial age river gravels are overlain by post glacial ageriver sands.
Summary
The suitability of the Atlas mill and tailings site for the long-term disposal ofradioactive waste has not been established by the November 2004 DEIS. Thesite was not originally selected out of concerns for human health and safetyor for the preservation of environmental quality. Rather, it was selected as aconvenient place for the milling of uranium ore and a cheap place fordumping the enormous quantities of chemical and radioactive wastegenerated by that milling process. Therefore, there is no a priori reason tosuppose that the site is suitable for long-term waste disposal.
Analyses of the DEIS and supporting reports clearly show that these docu-ments do not present a realistic picture of the geologic and hydrologicconditions at the Atlas mill and tailings site. Careful and consistent analysesof available scientific data concerning the suitability of the site must bemade within the context of accurate perceptions of how the Colorado Riverreally interacts with the Moab Valley. Such analyses clearly show that theflood hazard potential at the Atlas tailings site is not diminishing, as thereports cited by the DEIS claim, due to a theorized southward and eastwardmigration of the Colorado River. Rather, the river has flowed across thetailings site in the past and very possibly could return to that course in thefuture. Furthermore, because the river’s inner channel has, over the past 80years, shifted closer to the pile and has become narrower and deeper, thepotential for deep channel scour, sudden channel shifting, and catastrophicfailure of the pile during large floods may well have increased significantly.
Contrary to the claims and speculations contained in the reports used by theDOE to support the inferences and conclusions presented in the DEIS, thefollowing points are clear:
subsiding and that, because of this subsidence, coarse river sediments arebeing trapped in the valley. This reasoning is used to suggest that continu-ing subsidence will force the Colorado River channel to migrate south andeast, away from the Atlas tailings pile and towards Moab.
Groundwater dissolving the massive salt layers far beneath the valley flooris, in fact, causing the slow subsidence of the valley’s alluvial fill. But, thesurface of Moab Valley is not dropping because of this subsidence. TheColorado River and its local tributaries deliver far more sediment to thevalley floor than could ever be accommodated by the valley’s slow subsid-ence. Therefore, ongoing deposition by the Colorado River and by MillCreek and Pack Creek are the principal processes controlling the surficialgeology and geomorphology of Moab Valley. The correct explanation for thelack of cobbles and gravels in the active channel downstream from thePortal is quite different.
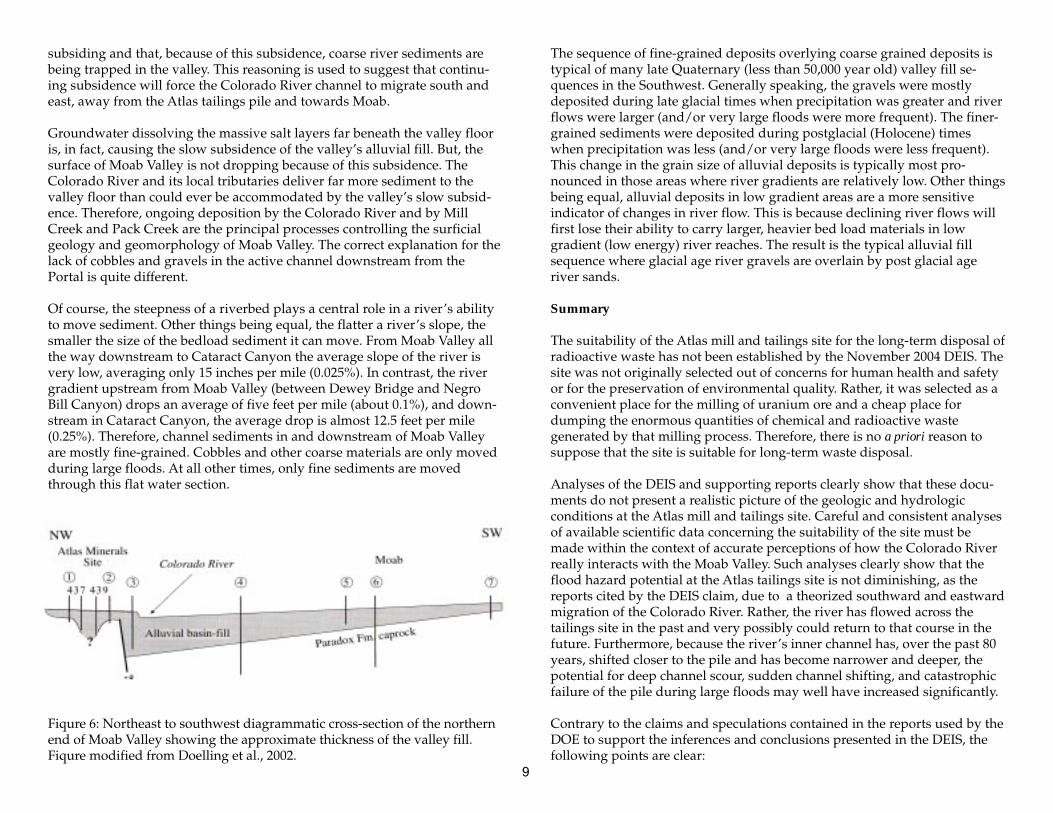
Of course, the steepness of a riverbed plays a central role in a river’s abilityto move sediment. Other things being equal, the flatter a river’s slope, thesmaller the size of the bedload sediment it can move. From Moab Valley allthe way downstream to Cataract Canyon the average slope of the river isvery low, averaging only 15 inches per mile (0.025%). In contrast, the rivergradient upstream from Moab Valley (between Dewey Bridge and NegroBill Canyon) drops an average of five feet per mile (about 0.1%), and down-stream in Cataract Canyon, the average drop is almost 12.5 feet per mile(0.25%). Therefore, channel sediments in and downstream of Moab Valleyare mostly fine-grained. Cobbles and other coarse materials are only movedduring large floods. At all other times, only fine sediments are movedthrough this flat water section.
Fiqure 6: Northeast to southwest diagrammatic cross-section of the northernend of Moab Valley showing the approximate thickness of the valley fill.Fiqure modified from Doelling et al., 2002.

(1) An 80-year history documented by accurate registration of historic mapsand aerial photographs clearly shows that the Colorado River is not migrat-ing south and east away from the tailings pile. The high flood levees border-ing the main channel have not shifted measurably. However, the south andeast bank of the active channel between these levees have moved north andwest. It is now 150 to 300 feet closer to the mill site, and the channel hasnarrowed and deepened in its new position.
(2) Courthouse Wash and Moab Wash have not caused the Colorado Riverchannel to migrate away from the mill site. Rather, analysis and directobservation of high energy flows from Courthouse Wash demonstrateunquestionably that these floods have deposited sediments on the southside of the Colorado River channel and, therefore, have actively contributedto the northward migration of the river channel.
(3) Available well log and bore hole data indicate that the valley fill is notthickest and deepest south of the present location of the river channel.Rather, these data show that the valley fill is thickest and deepest beneathor, perhaps, as much as several hundred feet north of the present riverchannel. Therefore, there is no reason to suppose that continuing subsidenceof the valley floor would cause the river channel to migrate away from thetailings pile. Indeed, if the thickest and deepest valley fill deposits mark theposition of maximum valley subsidence, there would, instead, be strongreason to suppose that continuing subsidence could cause the river to movecloser to the pile.
(4) Available subsurface data also show that conditions directly beneath thetailings pile are much more complex than the highly simplistic and rela-tively benign picture presented by the DOE. Indeed, these data indicate thatlocalized subsidence of the valley floor directly beneath the tailings pilemust be considered as a possible and potentially serious geologic hazard.Moreover, comparison of surface and subsurface data along the northernmargin of Moab Valley between Courthouse Wash and the mill site suggestthe possibility that localized subsidence or extremely deep channel scourhas occurred in this area sometime during the past 45,000 years.
(5) Although dissolution of the massive salt layers beneath Moab Valley iscausing the slow subsidence of the alluvial fill within the valley, the valley’ssurface is not dropping because of this subsurface subsidence. The ColoradoRiver and its local tributaries deliver far more sediment to the valley floorthan could ever be accommodated by the valley’s slow subsidence. There-fore, ongoing deposition by the Colorado River and by Mill Creek and PackCreek are the principal processes controlling the surficial geology andgeomorphology of Moab Valley.
(6) Finally, the geometry and position of ancient Colorado River gravelsburied beneath the surface of Moab Valley clearly show that the ColoradoRiver has, in fact, shifted back and forth across mill and tailings site in therecent geologic past.
In summary, there is considerable scientific evidence that important flawsexist in those studies indicating suitability of the Moab Mill site for the long-term storage of radioactive waste. Particularly flawed is the contention thatthe Colorado River is presently migrating and will continue to migrate awayfrom the site. This contention is completely incorrect. The Colorado Riverchannel has not migrated south and east away from the Moab Mill site atany time in the past 80 years, and there is no reason to suppose that it willstart to do so at any time in the immediate future.
Additional scientific study
Additional scientific studies focused on the potential flood hazard at theMoab Mill are needed to determine whether the site is a suitable place forthe long-term disposal of uranium mill waste. To be useful, additionalstudies must significantly reduce the uncertainties that surround andconfound our understanding of the complex relationship between theColorado River and the Atlas tailings site. Specifically, such studies shoulddetermine whether or not there is significant potential for catastrophicflooding that could compromise the stability and integrity of the tailingspile. They should also address the uncertainties related to the downstreamimpacts of such an event.
The Moab Valley is a very unusual place, essentially one-of-a-kind on theColorado Plateau, in North America, and perhaps anywhere in the world.The formation of the Moab Valley is in large part the result of salt tectonics.The folding, flow, and diapiric rise of massive salt deposits from far beneaththe earth’s surface and the dissolution of these deposits as the earth’ssurface is eroded down to the level of the rising salt are the principalprocesses that have shaped most of the large valleys of the Paradox Basin.Of all these breached anticlinal valleys, the Moab Valley appears to be theonly one where the Colorado River or any of its tributaries are downcuttingmore slowly than the valley is subsiding. This, in and of itself, makes theMoab Valley practically unique.
Moreover, the valley is located in the east central part of the ColoradoPlateau, a region of very rapid erosion and landscape change. This part ofthe Plateau is one of the youngest landscapes in North America. As theprincipal agent of this rapid erosion, the Colorado River is, quite literally,one of the dirtiest rivers in the world. That is to say, it carries more dirt orsediment per unit of flow than all but a few of the world’s major rivers.
10

11
Supplemental photo of Moab Valley, May 26, 1984. Landsat 5 satellite image showing the extent of the secondlargest flood of record on the Colorado River in Moab Valley. This satellite image was acquired one day priorto the flood peak when the flow rate was approximately 66,500 cfs. The 1984 flood inundated the toe of theAtlas tailings pile to a depth of about four feet.
There is probably no other place on earth that is truly comparable to theMoab Valley. This makes the scientific study of this very unusual place allthe more difficult. Earth science works best when there are many placeswhere similar phenomena and relationships can be used for comparisonwith the area being studied. Without the ability to make such comparisons,it is very difficult to test or verify the results and conclusions of the study.
Further complicating the issue is the fact that recent geologic times havebeen and continue to be times of changing climate. Since the waning stagesof the last great ice age to the present time, climate change has been the
norm. Generally speaking, climatic conditions on the Colorado Plateau havebecome progressively warmer and drier throughout this time. However,conditions have also fluctuated dramatically between periods of relativemoisture and extended drought. These changes and fluctuations havestrongly influenced extremes of river flow and rates of landscape changethroughout the region. Continuous measurements of river flow on theColorado River have only been made for the past 91 years, and this limitedrecord does not provide a sufficient base for predicting the future frequencyor magnitude of very large floods.
We also lack much of the basic scientificdata that is necessary to understand thecomplex relationship between the ColoradoRiver and the Moab Valley. We do not havea clear picture of the rate of downcutting ofthe Colorado River. The many well pre-served river terraces both upstream anddownstream from Moab Valley have not yetbeen carefully studied, and the ages of theseterraces have not been determined. We alsolack a clear understanding of the subsid-ence and filling of Moab Valley. The thick-ness and extent of the valley filling depositsare only approximately known, particularlyon the Moab side of the river. Moreover, thedepth of scour within these deposits duringvery large floods is not well established.More importantly, the ages of these depositsare only very imprecisely known, eventhough several attempts have been made todate them. Therefore, we do not have (andperhaps may never have) sufficient subsur-face data to understand anything more thanthe general details of the dissolution,subsidence, and valley filling processes.
Consequently, we do not know how rapidlythe river is eroding downward, how rapidlythe valley filling deposits are subsiding, orwhether downward erosion and valleysubsidence vary in time and space. In short,we have yet to learn very much at all aboutthe natural system that immediately sur-rounds, supports, and potentially threatensthe site of the Atlas tailings pile.

Studies Related to Potential for Catastrophic Flooding
Among the areas of uncertainty identified by the DEIS for on-site disposalof the mill tailings, that of “Catastrophic Floods” is of particular concernbecause of the possibility of channel migration into the tailings pile andflood erosion of the tailings. The assumption is made in the DEIS that acatastrophic discharge of 300,000 cubic feet per second will occur no morethan once in 500 years. It is also presumed in the DEIS that the muchsmaller, once-in-100-year flood will reach 3 to 4 feet above the base of thetailings pile. Because these are only estimates, based on extrapolations fromvery limited stream gauging data, we will be applying a technique over thenext few months to directly test these figures by documentation of actuallong-term flood behavior of the Colorado River at Moab.
During several days of field investigations in January of 2005 we identifiedmultiple study sites along the Colorado River that preserve sand and siltdeposited by the highest past flood stages of the river. The sites were locatedby an aerial survey on January 16. The sites include areas near DeweyBridge and Salt Wash, which are upstream of Moab, and Shafer, Buck andLathrop Canyons, all of which are downstream of Moab. Several sites werebriefly observed from the ground and determined to be appropriate for asubsequent slackwater deposit paleostage indicator (SWDPSI), paleofloodhydrology (PFH) investigation. The investigation at the chosen site willfollow this report and will include surveys of elevations, geometry of theadjacent flood channelways, stratigraphy of the flood deposits, geochronol-ogy, and hydraulic calculations of the associated paleoflood discharges. Theend result will be an estimate of the flood frequency hazard for the ColoradoRiver in the vicinity of Moab.
Data from the SWDPSI-PFH investigation will form the basis for estimatingthe potential for flood erosion and inundation of the tailings pile. Thispotential is critical because of the as-yet-unknown possibility for cata-strophic flooding to distribute eroded tailings over the entire inundatedregion, including much of the City of Moab.
12
Editor’s Epilogue: DOE Final Environmental Impact Statement
The above report was submitted to the DOE in January 2005 as part ofpublic comment on the DEIS. The Final Environmental Impact Statement(FEIS) for the Remediation of the Moab Uranium Mill Tailings (DOE/EIS-0355) was released in July 2005. The FEIS concluded that the preferredalternative for the reclamation of the former Atlas mill site was to removethe approximately 12 million tons of tailings and other contaminatedmaterials from the floodplain (now estimated by DOE to be 16 million tons)of the Colorado River to a new disposal cell near Crescent Junction, Utah, 30miles north. The FEIS discusses Responsible Opposing Views on RiverMigration in Section 2.6.4.1.
The DOE announced its final determination to relocate the tailings toCrescent Junction in the Moab Uranium Mill Tailings Remedial ActionProject Site Record of Decision (ROD) (70 Fed. Reg. 55358, September 21,2005). The ROD states that “DOE identified off-site disposal as its pre-ferred alternative for the disposal of tailings, primarily because of theuncertainties related to long-term performance of a capped pile at theMoab site. Issues, such as the potential for river migration and severeflooding, contribute to this uncertainty.”
The paleoflood study herein (next page) indicates that the FEIS and thestudy by the US Geological Survey (Kenny, 2005), have underestimated thenumber of large floods that can occur within the reclamation standard of200- to 1000-years. Hence, there continues to be significant risk that flooderosion at the tailings pile could occur in the time period between thepresent and the eventual removal of the pile.
The FEIS and ROD are available at:http://gj.em.doe.gov/moab/eis/eis_info.htm
The USGS Scientific Investigations Report, 2005-5022, is available at:http://pubs.usgs.gov/sir/2005/5022/pdf/SIR2005_5022.pdf
The Gardner and Solomon, Matheson Wetland Preserve Study, 2003 and2004, is available at: http://www.radiationcontrol.utah.gov/MILLS/ATLAS/mmgroundw_com.htm

13
Paleofloods in the Upper Colorado Rivernear Moab, Utah, May 2006
Noam Greenbaum, John S. Weisheit,Tess Harden, and John C. Dohrenwend
Noam Greenbaum, Ph.D.University of Haifa
Mt. Carmel, Haifa 31905, [email protected]
Introduction
Paleoflood hydrology was first applied in the late 1970s and beginning ofthe 1980s in the larger Colorado River tributaries: Verde River – with adrainage area of 14,240 km2 (Ely and Baker, 1985), Salt River – 11,150 km2
(Partridge and Baker, 1987), Salt River – 33,650 km2, (Fuller, 1987), VirginRiver – 10,306 km2 (Enzel et al., 1994), Escalante River – 820-4,430 km2 (Webbet al., 1988), and the entire Colorado River at the Grand Canyon – 279,350km2 (O’Connor et al., 1994). In the larger catchments the maximumpaleoflood discharges are usually larger than the maximum measuredvalues at gauging sites. Note: See metric conversion table on page 29.
The most detailed and relevant paleoflood study on the Colorado River tothe present study is the one by O’Connor et al. (1994). This study wascarried out in the Grand Canyon downstream of Glen Canyon Dam andclose to the US Geological Survey (USGS) Lee’s Ferry (Fig. 1) gaugingstation (1921-2005). At this site the largest historical flood, with an estimatedpeak discharge 8,500 m3 s-1, occurred in July 1884, and a larger flood, with anestimated peak discharge of about 11,300 m3 s-1, probably occurred in 1862(Dickinson, 1944). The largest flood on the measured record (6,250 m3 s-1)occurred in 1921. The paleoflood record provides evidence of at least 15large floods during the last 4,500 years. Ten floods during the last 2,000-2,300 years had discharges > 6,800 m3 s-1; one flood, which occurred betweenabout 1,600 and 1,200 years BP, was as high as 24 m above present waterlevel and had a discharge > 14,000 m3 s-1 (O’Connor et al., 1994).
Enzel et al. (1993) collected all measured, historical, and paleoflood peakdischarges for all tributaries of the Colorado River and generated an enve-lope curve for the Colorado River Basin. Specific peak discharges fordrainage basins with an area >10,000 km2 vary between 0.165 and 0.412 m3 s-
1 km-2. The only paleoflood data for a drainage area >100,000 km2 (0.05 m3 s-1
km-2) is based on O’Connor et al. (1994). Figure 1: The upper Colorado River Basin including the larger tributaries,USGS gauging stations, and the present study area.

Study Area
PrecipitationThe region is hyperarid: annual rainfall at the Moab gauging station
(1889-2005), at an elevation of about 1,280 m, ranges between 11 cm y-1 in1898 to 41.7 cm y-1 in 1983; mean annual rainfall for the period 1889-2000 is22.8 cm y-1. Precipitation is evenly distributed throughout the year, some ofwhich falls as snow during the winter. Maximum monthly rainfall (2.9 cm)occurs in October, whereas the minimum monthly amount (1.3 cm) occurs inFebruary. Some of the wettest years on record (1905, 1941, 1965, and 1983)are related to El Nino Southern Oscillation activity. Others are related topositive values of the Pacific Decadal Oscillation index (Webb et al., 2004).
HydrologyFloods in the upper Colorado River are caused mainly by: (a) melting of
the annual snowpack during the first waves of relatively high temperaturesin the spring. Therefore, the annual peak discharges occur usually betweenMay and June. These flows are characterized by a relatively moderate riseand similar moderate recession. And, (b) summer thunderstorms, which aretypical of July and August and produce localized intense rainstorms withrelatively steep rising climb and short recession. The largest floods are theproduct of spring rainstorms falling over the melting snowpack.
Hydrological dataThe relevant hydrological data for our study area are
derived from the USGS Cisco gaging station above DeweyBridge (30 km upstream of the study area) (Fig. 1). Thedrainage area of the Colorado River at the Cisco station is62,470 km2. The flood record in this station is 87-years long(1914-2005) and is almost continuous (Fig. 2). Maximumannual peak discharges range from 185 m3 s-1 (in 2002) to2,175 m3 s-1 (in 1917), with an average of 992 m3 s-1. Themaximal measured peak discharge (3,540 m3 s-1) is historicaland occurred on July 4, 1884. The daily mean flow rangesbetween 61 and 1,932 m3 s-1, with an average of 650 m3 s-1.About 50% of the maximal annual discharge occurs in Mayand another 44% in June.
In Cataract Canyon, where the upper Colorado River meetsthe Green River, the 1884 flood had an an estimated peakdischarge of about 6,370 m3 s-1. It is unclear how large thesefloods were in the upper Colorado River near Moab prior to1884, as Moab did not have an established post office until1879 and the first Moab newspaper was printed in 1896.
Figure 2: Annual maximum peak discharges for the Colorado River at Cisco, Utah, gaugingstation, 1914-2005.
The existing flood records in the upper Colorado River indicate thatnumerous large floods occurred between the 1880s and the 1930s and that ageneral trend of decrease is documented (Fig. 2). This trend was explainedmainly by the decrease in the frequency of large flood-producing rainstormssince the early 1940s and partly by the abrupt reduction in grazing since1932 (Webb et al., 2004). Large floods (>1,700 m3 s-1) (60,000 cfs) later thanthe 1930s occurred in 1941, 1957, 1983, and 1984 (Fig. 2). Mean annual flowvolume in the upper Colorado River at the Cisco gauging station is about6,660 106 m3.
Study ReachThe Colorado River canyon at the study area flows, in general, from
northeast to southwest. The northwestern bank is undisturbed and isalready a part of Arches National Park. The southeastern bank is Bureau ofLand Management (BLM) land disturbed only by the road along the riverand by a boat put-in and take-out site (Fig.4). The study area is locatedabout 17 km upstream of Moab at a large bend of the canyon. The elevationof the river bed at the study area is about 1,300 m above sea level (asl). Thecanyon is entrenched between 300-350 m (320 m on average) deep into thesandstones of the plateau. The width of the canyon at the top varies between600 and 800 m, whereas the width of the channel varies between 70 and
14

Paleoflood Hydrology
Paleoflood hydrology reconstructs the magnitude and frequency of pastfloods, provides long-term flood records for ungauged basins, and extendsshort systematic flood records to the past (Kochel and Baker, 1982; Baker,2003). The reconstruction of the paleofloods includes determination of theirpeak discharge and the time of occurrence, usually based on radiocarbondating. The paleoflood data reconstruct the largest floods that occurred in abasin and enhance the frequency analyses of the flood records by an im-proved fitting of the probability functions (e.g., Stedinger and Cohn, 1986;Webb et al., 1988; Thorndycraft et al., 2003). A review of various methods ofincorporating paleoflood data and other non-systematic information isprovided by Frances (2004).
Paleoflood hydrology can be applied in bedrock canyons where the cross-section and the course of the river are stable and, therefore, it is assumedthat their geometry has not changed much during the last several thousandyears. The paleoflood reconstruction uses fine-grained slackwater flooddeposits (SWDs) and other paleostage indicators (PSIs), such as driftwoodlines deposited rapidly from suspension in sites where flow velocities aresignificantly reduced (Patton et al., 1979; Kochel et al., 1982; Ely and Baker,1985; Baker, 1987; Baker and Kochel, 1988). These indicators represent thehigh stage of the flood and provide the best natural record of large floodmagnitude. Such sites include back-flooded tributary mouths, caves andalcoves in canyon walls, channel expansions where flow separation causeseddies, and overbank floodplain deposits. Ideal paleoflood sites preservemultiple flood stratigraphic records, which can be separated into individualflow events using sedimentological criteria (Baker, 1987; Benito et al., 2003).Paleodischarge estimates are obtained using the HEC-RAS (HydrologicEngineering Center, 1997) procedure, which generates water surface profilesfor various discharge values (O’Connor and Webb, 1988). Comparisonbetween the elevation of SWDs and driftwood lines to the elevations of thewater surface profiles provides a peak discharge value to the flood at thesite (Baker, 1987; O’Connor et al., 1986). Ages of paleofloods are obtainedusing radiocarbon dating of fine organic debris: wood and charcoal thatfloated over the floodwaters and were deposited over the flood SWDs or asa driftwood line.
Field Methods
Field reconnaissanceA field reconnaissance along the upper Colorado River upstream of
Moab was carried out during late March 2005. Three potential palefloodsites were located along a study reach of about 5 km between Sandy Beachand Big Bend (Fig. 4). The upper site, COL-1, is an overbank flood SWD
150 m, depending on the geometry of the cross-section and discharge. Theconstrictions in the channel are usually caused by very coarse debris flowdeposits from the steep slopes of the canyon, which also cause formation ofsmall rapids (Webb et al., 1988). Based on topographical maps in the scale of1:24,000, the general gradient along this section is about 0.0032. The drain-age area of the Colorado River at the Cisco gauging station, about 30 kmupstream, is 62,470 km2.
Figure 3: Satellite photo of the region including Moab, the Atlas Mill Tailings,and the study area.
15

Figure 4: The study reach of the present study including the main SWDaccumulations, the cross-section of the survey, and the paleoflood BLM-TOstudy site.
Figure 5: A map showing the location of the pits that were dug at the BLM-TO study site at the right bank of the Colorado River for studying the flooddeposit stratigraphy. Other paleostage indicators, such as driftwood linesand actual winter and summer water levels during the study period, areshown as well.
16

located at the left bank a few hundred meters downstream of Sandy Beach.The second site, BLM-TO, is located opposite to the BLM take-out site (a fewhundred meters upstream) at the right bank of the river in the area, which isa part of Arches National Park. It is also an overbank SWD site located overan alluvial terrace composed of coarse gravel – mainly cobbles and up tolarge boulders. The lower site, COL-3, is located at the right bank in a verysmall tributary mouth. The tops of sites COL-1 and COL-3 are covered by athick layer of eolian sand, which is probably derived from flood depositsreworked by the strong winds that flow upstream within the Colorado Rivercanyon. Site COL-1 may also be disturbed by the road.
Therefore, we concluded that the best site, deserving minimum digging andtrenching, was the BLM-TO site, which finally served as our research site forthe detailed paleoflood study.
SurveyA detailed survey was conducted during the period May 23-31, 2005,
along the study reach of the Colorado River (Fig. 3). The study reach is 4.5km long and extends from Sandy Beach and down-stream almost to Big Bend (Fig. 4) (See also Appendix).The survey used an EDM total station with a laserrangefinder to form a series of 24 cross-sections every180-190 m in average along the study segment of theupper Colorado River. The measurements include allgeometric parameters of the channel and the entirecanyon of the Colorado River, such as width, depth,present water level, and gradient; hydraulic parameters,such as roughness coefficient, and sinuosity; and theelevations and locations of all PSIs, such as driftwoodlines, SWDs, and high imbricated boulders. Theseindicators serve as evidence for the actual or minimalwater stages of past floods. The measured water eleva-tions at the site can be transformed into discharge by thedaily or hourly discharges measured at the Ciscogauging station.
Sedimentological methodsDuring the period June 10-19, 2005, 14 pits were dug
in the flood deposits at the BLM-TO site (Fig. 5; Pictures1, 2). Arches National Park provided an official permitto dig theses pits and also arranged for an archaeologi-cal inspection by Pat Flanigan during the digging phase.The pits were dug with the help of the staff of WildlandScapes (Moab). The digging of each pit was down to theunderlying boulders of the alluvial terrace, and their Picture 1: Flood site at the BLM-TO site.
depth was up to 2 m (Fig. 6). The pits were dug close to each other, with avertical overlapping of the exposures. This enabled a staircase exposure ofthe entire section of the SWD relic from top to bottom, as well as correlationbetween sedimentary units in adjacent pits. The sequence of depositsexposed in each pit was separated into flood deposits associated with floodevents using well-established sedimentological criteria (Baker, 1987; Benitoet al., 2003) (Figs. 7, 8). This sedimentological separation enabled the recon-struction of the stratigraphy at each pit. Each of the deposits at each pit wasdocumented in detail and sampled for optional future laboratory analyses.For color determination we used the Munsel color chart.
Organic debris, wood and charcoal, which floated over the floodwaters andwere deposited over the flood SWDs, usually in the form of discontinuousthin layer at the top of the deposit, were sampled for radiocarbon dating.Because of the very limited amounts of organic matter, we initiated system-atic sampling for Optical Stimulation Luminescence (OSL) dating, whichuses fine, sandy samples unexposed to daylight. A 2 m exposure in the
17

floodplain sedimentary units located at a rill that cuts into the floodplainclose to the site (Fig. 5) was described and documented in detail (includingOSL samples) in order to reconstruct the floodplain stratigraphy (Fig. 9).
Photos of the site and the pits were taken before the pits were covered a fewdays after the field work was done.
Dating Methods
RadiocarbonAges of paleofloods that contained organic material were obtained
using radiocarbon dating. In most pits (pits 4, 10, and 13) the organicmaterial is usually in the form of a discontinuous thin layer at the top of thedeposit. The organic material in pit 14 was extracted from an incipient soil,which overtops the flood deposit.
The radiocarbon dating techniques, including conventional counting,Accelerator Mass Spectrometry (AMS) (Baker, 1987), and post-atomic-bomb
Picture 2: Flood site at the BLM-TO site.18
dating, were used for the modern floods, i.e., younger than 1950 AD (Bakeret al., 1985; Ely et al., 1992). The samples of organic material were submittedduring late June to the Radiocarbon and Isotope Laboratory at the Depart-ment of Geosciences, University of Arizona (2 samples), and to the AMSLaboratory, Department of Physics, University of Arizona (2 samples).
Luminescence datingWe found very little organic material for radiocarbon dating within the
slackwater deposits of the Colorado River at the BLM-TO site, whereas thefine, sandy sediments of the SWDs of the Colorado River are suitable forsystematic luminescence dating (Aitken, 1998). The luminescence methodsdate the last sunlight exposure episode in a mineral’s history and usesignals that are acquired by mineral grains, such as quartz or feldspar, fromthe natural environmental radiation. The magnitude of the OSL signal isrelated to the total radiation that the sample received. Since the OSL signalis sensitive to sunlight, exposure to the sun during transport and depositionof the sediment will reduce the previously acquired OSL signal to zero(“bleaching”) and, after burial, it will grow again.
Fine sand-size quartz was extracted using routine laboratoryprocedures (Porat, 2002). Briefly, after wet sieving to selectthe desired size fraction (125-150 µm), carbonates weredissolved using 8% hydrochloric acid, and the dried fractionwas passed through a Franz magnetic separator at a highcurrent (~1.5 Ampere) to remove heavy minerals and mostfeldspars. The non-magnetic fraction was then etched withconcentrated (42%) hydrofluoric acid for 40 minutes todissolve the remaining feldspars and etch the quartz.Subsequently, fluorides were removed with 16% hydrochlo-ric acid.
About 5 mg of the purified quartz was deposited on 10 mmaluminum discs using silicon spray as an adhesive. Mea-surements were done on Risø DA-12 and DA-20 TL/OSLreaders equipped with a calibrated 90Sr β source. Stimulationwas carried out with a green-filtered halogen bulb or blueLED diodes, and detection was through 7 mm U-340 filters.The equivalent dose (De) was measured using the OSLsignal and the single aliquot regenerative dose (SAR)protocol (Murray and Wintle, 2000) on 12 aliquots for eachsample. The signal was measured at 125°C to backgroundlevel. The test dose was roughly 4.5 Gy, and a cut heat of 5 s@ 180°C was used to remove unstable signals.

Figure 6: Vertical and horizontal locations of the pits in the SWDs at the BLM-TO study site in relation to the summer water levels of theColorado River channel in June 2005. Note that the SWD trap is composed of 2 separate depressions: an upper depression (pits 2-8) and alower depression (pits 9-14). Pit 1 is separated and located at the base of a rocky bench of the canyon wall.
19

20
Figure 7: Stratigraphic sections of the pits at the upper depression of the BLM-TO site, including radiocarbon and OSL ages.The sections include a separation of the sedimentary units into flood-related deposits. Reddish deposits of fine angular clastsrepresent local slope flows that cover Colorado River flood deposits.

Figure 8: Stratigraphic sections of the pits at the lower depression of the BLM-TO site, including radiocarbon and OSL ages.The lowest pit (pit 14) is probably composed of the oldest deposits. The young OSL ages below the much older radiocarbonage were not considered.
21

Figure 9: Stratigraphic section at the floodplain,including OSL ages.
Figure 10: Proposed correlation between flood units at the upper depression of theBLM-TO paleoflood site based on both radiocarbon and OSL ages and othersedimentological and morphometrical properties of the SWDs.
22

Preheat tests were carried out to evaluate the change of De as a function ofvarying preheat temperatures between 200° and 260° C. For some samplesthe De values increased with increasing temperature; more tests are neededto ascertain the cause for such behavior.
For dose rate evaluations, a representative sample of each sample wasanalyzed for the radioelements U, Th, and K, measured by ICP. Cosmic doserates were calculated from burial depths. Water contents were estimated at5%, except for the flood plain samples, for which a value of 10% was used.Table 5 (Appendix) lists the field and laboratory data.
The systematic sampling of the sandy units yielded, wherever possible, 1-2OSL samples per pit: at the base of the pit and > 0.5 m below the surface.The sampled pits include pits 2, 4, 5, 9, 10, 11, 12, 13, and 14, altogether 12samples (Figs. 7, 8). Also, 2 samples were taken from the floodplain expo-sure. Altogether, 14 samples were collected, shipped to Israel, and analyzedat the luminescence laboratory of the Geological Survey of Israel (GSI), inJerusalem, by Dr. Naomi Porat.
Hydraulic Methods
Paleodischarge estimates were obtained by the slope-area method and willbe compared to the results of HEC-RAS hydraulic computer model, whichgenerates water surface profiles using step-backwater calculations forvarious discharge values (O’Connor and Webb, 1988; Webb and Jarrett,2002). Comparing the elevations of the SWDs and PSIs to the computedelevations provides a minimal estimation of the peak discharge. A compari-son of SWD elevations with other field observations, such as the elevation ofdriftwood lines of the same floods, historical water levels, and gaugeddischarges, indicates that heights of the flood deposits commonly are lowerthan the actual peak stage (Kochel, 1980; Ely and Baker, 1985; Baker, 1987;Partridge and Baker, 1987; O’Connor et al., 1986; Greenbaum et al., 2000).For example, in Nahal Zin, a 1,400 km2 ephemeral stream channel in thehyperarid Central Negev, Israel, the observed differences between flooddeposits and peak stage for large floods are 50-70 cm (Greenbaum et al.,2000). This would lead to an underestimation of the peak discharge (Kochelet al., 1982; Baker, 1987), and they should, therefore, be treated as aminimum value.
The water surface profiles for the study reach, calculated by the HEC-RAS,are expected to indicate subcritical flow regime, typical of large floods inbedrock-controlled streams (e.g., Ely and Baker, 1985; Partridge and Baker,1987; O’Connor et al., 1986; Baker, 1987). Supercritical conditions arereached only rarely and at few locations where channel gradient increasesabruptly, such as large cataracts and rapids.
Figure 11: Proposed correlation between flood units at the lower depressionat the BLM-TO paleoflood site based mainly on radiocarbon ages and othersedimentological and morphometrical properties of the SWDs.
23

Other uncertainties in the discharge calculations are presented in detail byO’Connor et al. (1994): (a) flow conditions downstream of the study reachand their effect on the local surface profiles, (b) values of energy losscoefficient, and (c) channel geometry during peak flow stages.
Additional inaccuracies in the discharge estimations may result from theselected hydraulic parameters. Manning’s n is considered to be of lowsensitivity when calculating flow discharges of large floods (O’Connor andWebb, 1988). Enzel et al. (1994) show that for large floods a change of ±20%in n values produces a change of < ±5% in the corresponding discharge. Inthe present study a generalized estimated Manning’s n was adapted to thefollowing parts of the cross sections: (a) the channel, characterized by low nvalue typical of 0.025 due to the low roughness of the water surface; and (b)the banks and slopes, characterized by high roughness values of 0.06 due totheir ragged nature, since they consist of coarse cobbles and boulders andare rich with vegetation at the foot-slope and on the floodplain.
Since the channel bed topography and depth along the study reach isunknown, our discharge calculation uses the water surface during thesurvey as a smooth channel bed and the daily discharge, derived from theCisco gauging station, was added to the discharge provided by thehydraulic program.
The elevation of the water levels during the survey and the field work weredocumented in the field (Fig. 6, Pics. 1, 2), and the associated discharges areavailable from the Cisco gauging station upstream. These discharges willhelp to calibrate the water surface profiles generated by the HEC-RAShydraulic program.
Results
Sedimentological ResultsThe BLM-TO site composed of 2 depressions/traps, in which the SWDs
accumulated. The higher trap, represented by pits 2-8 (Pics. 1, 2), is9.6-13.5 m above summer water levels (SWL: water level on June 19, 2005)(Figs. 6, 7). This depression is relatively shallow, as indicated by the depthof the pits, which ranges between 0.3 and 1.4 m. The lower trap, representedby pits 9-14, is 3.5-9.7 m above SWL (Figs. 6, 8; Pics. 1, 2) and is deeper; thepits are 0.8-2.0 m deep. Pit 1 is located at the base of the rocky rim of thecanyon (Pic. 1); other thin SWD accumulations are scattered between pit 1and pit 2. The sediments in pits 1-3 are deposited over large bouldersoriginating from debris flow, while the deposits in the other pits overlieboulders of an alluvial terrace. Each of the pits in the higher depression (pits1-8; Fig. 7) include between 1 and 4 reddish, angular, clast-supported,gravelly deposits, which originate from the slope due to their proximity tothe contributing canyon wall. In the lower depression (Fig. 8) these unitsoccur only in pits 9 and 10, whereas, in lower pits they are absent. Some ofthe SWDs have reddish color, which may be related to: (a) different sourceof sediments, (b) fine sediments derive from the slope, or (c) development ofincipient soil.
The sedimentary units were separated into flood-related deposits, whichmay combine several sedimentary units. The 14 pits, their stratigraphy andtheir relative position in the site, are shown in Figure 6 and Table 1.
The common texture of the SWDs of the floods at the site is medium-finesand and up to silt. The structure of the sediments is usually finning up-ward, horizontally bedded or massive, but may also be cross-bedded orrippled. The typical color of the SWDs, as well as the present floods, isyellowish brown (10YR5/4), as documented in the flood deposits of pits 9-14. In the higher pits 1-8 the common color is somewhat darker brown(7.5YR5/4), possibly due to an increase in the amount of local reddish dust
Figure 12: Cross-section No. 9 through the Colorado River at the BLM-TOpaleoflood site, elevations of pits and associated peak discharges usingslope-area calculations.
24

The floodplain section (Fig. 9) includes the following types of sedimentaryunits: (a) flood deposits similar to those exposed in the pits; (b) reddish,angular clast-supported gravelly slope deposits similar to the other pits; and(c) reddish sandy and silty units that may originate either from the slope,but, more likely, are flood deposits derived from tributaries that drainreddish sandy rocks, such as the Dolores River.
Dating Results
(a) RadiocarbonThe results of the radiocarbon dating at the various pits are presented in
Table 2.
(b) Luminescence datingThe ages of the SWD range from several hundred years up to over 2,000
years before present (Figs. 7, 8; Table 2). The samples appear to cluster intotwo age groups: older than 1,300 years and younger than 660 years. Theages of the older samples, between 1,300 and 2,140 years, are well con-strained, with small uncertainties (sample error is only 5-10%). However,the samples younger than 660 years show large scatter of De values(samples error is 17-35%), indicating that the sediments are not homogenouswith respect to solar bleaching (Clarke, 1996). Ages for these samples werecalculated without obviously outlying old aliquots. Even so, the insufficientbleaching implies that the ages presented in Table 2 are maximum ages, andthe timing of SWD deposition could be more recent. Twelve samples from 11pits and 2 samples from the exposure in the floodplain were dated byluminescence. The results of the OSL dating are shown in Table 3. The fullresults are presented in the Appendix.
washed into the SWDs after their deposition. The common contacts thatseparate sedimentary units, are: (a) abrupt changes in texture, structure, orcolor; (b) presence of organic layer; and (c) presence of reddish, angular,clast-supported gravelly slope deposit. Pits 1-8 include 1-6 flood deposits,while pits 9-14 contain 6-15 deposits. Also, 3 driftwood lines, which presentthe actual stage of the flood, were documented and surveyed at the site, aswell as high imbricated boulders, which indicates minimal water stage only.A paleosol, radiocarbon dated to 7413-6994 BP, was exposed in pit 14,indicating a temporal gap in deposition of flood deposits at similar orhigher elevation.
25
Table 2: Results of radiocarbon dating of paleoflood deposits at the BLM-TOsite.
Table 1: Properties of the SWDs at the pits.
*SWL - Summer water level June 14, 2005
Floodplain

Comparison of Radiocarbon and OSL dating resultsThe older OSL ages (> 1000 years BP) characterize the higher deposits in
the upper depression (Fig. 10), whereas the younger ages (< 660 years BP)date the flood deposits at the lower depression and the floodplain (Fig. 11).This trend generally agrees with the radiocarbon ages (Figs. 7, 8, 10, 11). Thecertainty of the ages in the lower depression is lower and needs improve-ment and refinement. Nevertheless, the oldest radiocarbon age was found inthe lowest pit (pit 14) at the base of the entire SWD relict (Figs. 8, 11). Theunderlying OSL ages are much younger and also do not agree with theorder of the pit stratigraphy. Therefore, these ages were not taken into
consideration. At the upper depression, the ages from both dating methodsagree with each other. The stratigraphy based on the combination of theages agrees in general with the startigraphy in the pits. In the lower depres-sion (except for pit 14) the ages in each pit agree with the stratigraphy aswell. In spite of the higher uncertainty, both dating methods also agree witheach other. The large number of dates provides a higher chronologicalresolution, which indicates more insets of flood deposits aside of previousSWD accumulations and a more detailed flood stratigraphy, with a largernumber of reconstructed flood events.
The relative older ages of the floodplain, about 650 years BP (Fig. 9), maysuggest that it is relatively stable during the last several hundred years.
Number of paleofloodsThe transformation of sedimentary units into associated flood events
(Figs. 7, 8) is based on several sedimentological principles and criteriarelated to similarity/difference in sediment properties, such as structure,texture, color, contacts between units, and age. Presence of incipient soilovertopping flood deposits indicates a period of smaller floods that had notexceeded the elevation of the soil. Table 1, Column 3, presents an interpreta-tion of the sedimentary sections exposed in the pits and their separation intoflood-associated units that may combine several sedimentary units. Theupper pits were separated into 1-5 floods at each pit, while each of the lowerpits includes 3-8 reconstructed floods (Figs. 8, 9).
26
Table 4: Summary of paleofloods at the BLM-TO site, minimal peak stagesand slope-area calculations of peak discharges.
*SWL - Summer water level on June 14, 2005.
Table 3: Results of luminescence dating of paleoflood deposits at theBLM-TO site.
Floodplain
Floodplain

flood for Cisco gauging station in this USGS report is 120,000 cfs (about3,400 m3s-1), whereas the 100-year flood is 97,600 cfs (about 2,765 m3s-1). Thesimilarity between the 100- and 500-year floods was explained by the flowregulation during the past half a century, which slightly reduced the peakmagnitudes. The results of the present study indicate that the peak dis-charge of about 20 paleofloods during the last 2140±220 years exceeded3,400 m3s-1, and over 25 paleofloods exceeded peak discharges of 2,765 m3s-1.
These results suggest that a further and more accurate paleoflood study isdefinitely needed in the future in order to improve the risk assessment forMoab area and Moab Valley.
Note: The cross-sections of the EDM total station/laser rangefinder alongthe study reach of the upper Colorado River (see Fig. 4, page 17) and close-up photos of the pits can be viewed in the report archived on the web at:
http://www.livingrivers.org/MoabMillProject.pdf
Editor’s Epilogue:
It is clear that there are 2 undated flood deposits (pit 1) exceeding 350,000cfs over the past 2,000 plus years. The data also shows (including pit 2) thatat least 5 floods exceed the probable maximum flood of 300,000 cfs over thepast 2,000 plus years. A very large number of paleofloods (20 plus) exceededthe 500-year flood value for Cisco (120,000 cfs) over the last 2,000 plus years.This indicates that the nature of 100- and 500-year floods are not yet fullyunderstood in the Colorado River Basin. At a future time, the above datashould be put into a full-up flood-frequency analysis, so that the 100- and500-year magnitudes can be inferred directly from the paleoflood dataalone.
ReferencesAitken, M. J., 1998. An Introduction to Optical Dating. Oxford University
Press, Oxford.Baker, V. R., 1987. Paleoflood hydrology and extraordinary flood events.
J. Hydrol., 96, 79-99.Baker, V. R., 2003. A bright future for old flows: origins, status and
future of paleoflood hydrology, in Paleofloods, Historical Data and ClimaticVariabillity: Applications in Flood Risk Assessment, edited by V. R.Thorndycraft, G. Benito, M. Barriendos, and M. C. Llasat, Proceedings of thePHEFRA international workshop, October 2002, Barcelona, Spain.
Baker, V. R., and R. C. Kochel, 1988. Flood sedimentation in bedrockfluvial systems, in Flood Geomorphology, edited by V. R. Baker, R. C. Kochel,and P. C. Patton, 123-128. John Wiley & Sons, New York.
Correlation between floods in adjacent pits (Figs. 10, 11) is based on theproperties of the sediments, their thickness, lateral continuity, field relation-ships among the deposits, radiocarbon and OSL ages, and other principlesin SWD sedimentation (Figs. 10, 11).
The following interpretation of the flood stratigraphy is based on bothdating methods, which usually (except for pit 14) agree with each other. Theresults of the correlations (Table 4) provide a probable generalizedpaleoflood stratigraphy, which includes about 40 paleofloods at the BLM-TOsite: 15 at the upper depression and 25 at the lower depression. The resultsof the luminescence dating, which were incorporated later, provide a moredetailed and complicated stratigraphy and increase the number of floodsrelative to the stratigraphy, based on radiocarbon ages only.
Flood No. 4 in pit 11, which was correlated to flood No. 8 in pit 10, was OSLdated to 170±40. Its minimal age, then, is about 130 years. The peak dis-charge of this flood was calculated to about 3,800 m3s-1 and may becorrelated to the 1884 flood (3,540 m3s-1).
Magnitude of paleofloodsSlope-area calculations at the site indicate that the peak discharge
reconstructed for floods associated with deposits at the top of pit 1 (15 mabove SWL) is about 10,500 m3s-1 and about 8,700 m3s-1 for the top of pit 2(13.5 m above SWL) (Figs. 6, 10, 12). Calculated peak paleovelocities forthese floods are 5.1 and 5.3 m s-1, respectively. The peak discharge for the topof pit 6, the lowest pit at the upper depression (10.2 m above SWL), is about5,100 m3s-1 (calculated velocity of 4.3 m s-1) (Figs. 6, 11, 12). At the lowerdepression, peak discharges are from 4,600 m3s-1 for the top of the upper-most pit (pit 9, elevation of 9.5 m above SWL), with a calculated velocity of4.2 m s-1. For the top of the lowest pit (pit 14), peak discharge is about2,200 m3s-1 (elevation of 5.5 m above SWL), and the velocity is 4.2 m s-1
(Fig. 6, 12). These calculations will be compared to water surface profilesproduced by the HEC-RAS program.
Summary
Based on the slope-area method only, a gross estimation of the largest peakdischarges calculated in this study indicate at least 3 floods that exceedabout 8,500 m3s-1 (about 300,000 cfs) during the last 1410±110 years B.P. Thepaleoflood record probably includes another 2 undated larger floods, withpeak discharges exceeding 10,000 m3s-1 (about 350,000 cfs), which may haveoccurred during the last 2140±220 years B.P. The maximal peak dischargevalues need to be confirmed by the HEC-RAS procedure. If correct, thesevalues exceed the probable maximum flood (PMF) value of the USGS for theMoab Valley of 300,000 cfs (about 8,500 m3s-1) (Kenny, 2005). The 500-year
27

Baker, V. R., G. Pickup, and H. Polach, 1985. Radiocarbon dating of floodevents, Katherine Gorge, Northern Territory, Australia. Geology, 13, 344-347.
Benito, G., Y. Sanchez-Moya, and A. Sopena, 2003. Sedimentology ofhigh-stage flood deposits of the Tagus River, central Spain. SedimentaryGeology, 157, 107-132.
Clarke, M. 1996. IRSL dating of sands: bleaching characteristics atdeposition using single aliquots. Radiation Measurements, 26, 611-620.
Dickinson, W.E., 1944. Summary of records of surface waters at basestations in Colorado River Basin 1891-1938. U.S.Geological Survey WaterSupply Paper, 918, 274 p.
Ely, L. L., and V. R. Baker, 1985. Reconstructing paleoflood hydrologywith slackwater deposits, Verde River, Arizona. Phys. Geog., 6, 103-126.
Ely, L. L., R. H. Webb, and Y. Enzel, 1992. Accuracy of post-bomb 137Csand 14C in dating fluvial deposits. Quaternary Research, 38. 196-204.
Enzel, Y., L. L. Ely, P. Kyle House, and V. R. Baker, 1993. Paleofloodevidence for a natural upper bound to flood magnitudes in the ColoradoRiver Basin. Water Resour. Res., 29 (7), 2287-2297.
Enzel, Y., L. L. Ely, J. Martinez-Goytre, and R. Gwinn Vivian, 1994.Paleofloods and a dam-failure flood on the Virgin River, Utah and Arizona.J. Hydrol., 153, 291-315.
Frances, F., 2004. Flood frequency analysis using systematic and non-systematic information, in Systematic, paleoflood and historical data for improve-ment of flood risk estimation, edited by G. Benito and V. R. Thorndycraft, 55-70, The SPHERE Project, CSIC, Madrid, Spain.
Fuller, J.E., 1987. Paleoflood hydrology of the alluvial Salt River, Tempe,Arizona. M. Sc. thesis, Dept. of Geosciences, Univ. of Arizona, Tucson, 69 p.
Greenbaum, N., A. P. Schick, and V. R. Baker, 2000. The paleofloodrecord of a hyperarid catchment, Nahal Zin, Negev Desert, Israel. Earth Surf.Processes Landforms 25, 951-971.
Hydrologic Engineering Center, 1997. HEC-RAS. U.S. Army Corp. ofEngineers, Sacramento, California.
Kenny, T. A., 2005. Initial-phase investigation of multi-dimensionalstreamflow simulations in the Colorado River, Moab Valley, Grand County,Utah. USGS Scientific Investigations Report, 2005-5022.
Kochel, R. C., 1980. Interpretation of flood paleohydrology usingslackwater deposits, lower Pecos and Devils Rivers, southwestern Texas.Ph.D. dissertation, University of Texas, Austin, 364 p.
Kochel, R. C., V. R. Baker, and P. C. Patton, 1982. Paleohydrology ofsouthwestern Texas. Water Resour. Res., 18, 1165-1183.
Kochel, R. C., and V. R. Baker, 1982. Paleoflood hydrology. Science, 215,353-361.
Murray, A., and A. G. Wintle, 2000. Luminescence dating of quartz usingan improved single-aliquot regenerative-dose protocol. RadiationMeasurements, 32, 57-73.
O’Connor, J. E., and R. H. Webb, 1988. Hydraulic modelling forpaleoflood analysis, in Flood Geomorphology, edited by V. R. Baker, R. C.Kochel, and P. C. Patton, 383-402. John Wiley & Sons, New York.
O’Connor, J. E., V. R. Baker, and R. H. Webb, 1986. Paleohydrology ofpool and riffle pattern development, Boulder Creek, Utah. Geol. Soc. Am.Bull., 97, 410-420.
O’Connor, J. E., L. L. Ely, E. E. Wohl, L. E. Stevens, T. S. Melis, V. S. Kale,and V. R. Baker, 1994. A 4500-year record of large floods on the ColoradoRiver in the Grand Canyon, Arizona. J. Geol., 102, 1-9.
Partridge, J. B., and V. R. Baker, 1987. Paleoflood hydrology of the SaltRiver, central Arizona. Earth Surf. Processes Landforms, 12, 109-125.
Patton, P. C., V. R. Baker, and R.C. Kochel, 1979. Slack-water deposits: ageomorphic technique for the interpretation of fluvial paleohydrology, inAdjustment of the Fluvial System, edited by D. D. Rhodes and G. P. Williams,225-253. Kendall/Hunt, Dubuque, Iowa.
Porat, N., 2002. Analytical procedures in the luminescence datinglaboratory. Geological Survey of Israel. Technical Report TR-GSI/2/2002 (inHebrew), 44 p.
Stedinger, J. R., and T. A. Cohn, 1986. Flood frequency analysis withhistorical and paleoflood information. Water Resour. Res., 22, 785-793.
Thorndycraft, V. R., G. Benito, M. C. Llasat, and M. Barriendos, 2003.Paleofloods, historical data and climatic variability: applications in floodrisk assessment, in Paleofloods, Historical Data and Climatic Variabillity:Applications in Flood Risk Assessment, edited by V. R. Thorndycraft, G. Benito,M. Barriendos, and M. C. Llasat. Proceedings of the PHEFRA internationalworkshop, October 2002, Barcelona, Spain.
Webb, R. H., J. Belnap, and J. Weisheit (eds.), 2004. Cataract Canyon, TheUniversity of Utah Press, Salt Lake City, 268 p.
Webb, R. H., and R. D. Jarrett, 2002. One-dimensional estimation tech-niques for discharges of paleofloods and historical floods, in Ancient Floods,Modern Hazards: Principles and Applications of Paleoflood Hydrology, Water Sci.Appl. Ser. vol. 5, edited by P. K. House, V. R. Baker, R. H. Webb, and D. H.Levish, 111-126. AGU, Washington, D.C., 2002.
Webb, R. H., J. E. O’Connor, and V. R. Baker, 1988. Paleohydrologicreconstruction of flood frequency on the Escalante River, south central Utah,in Flood Geomorphology, edited by V. R. Baker, R. C. Kochel, and P. C. Patton,403-418. John Wiley & Sons, New York.
28
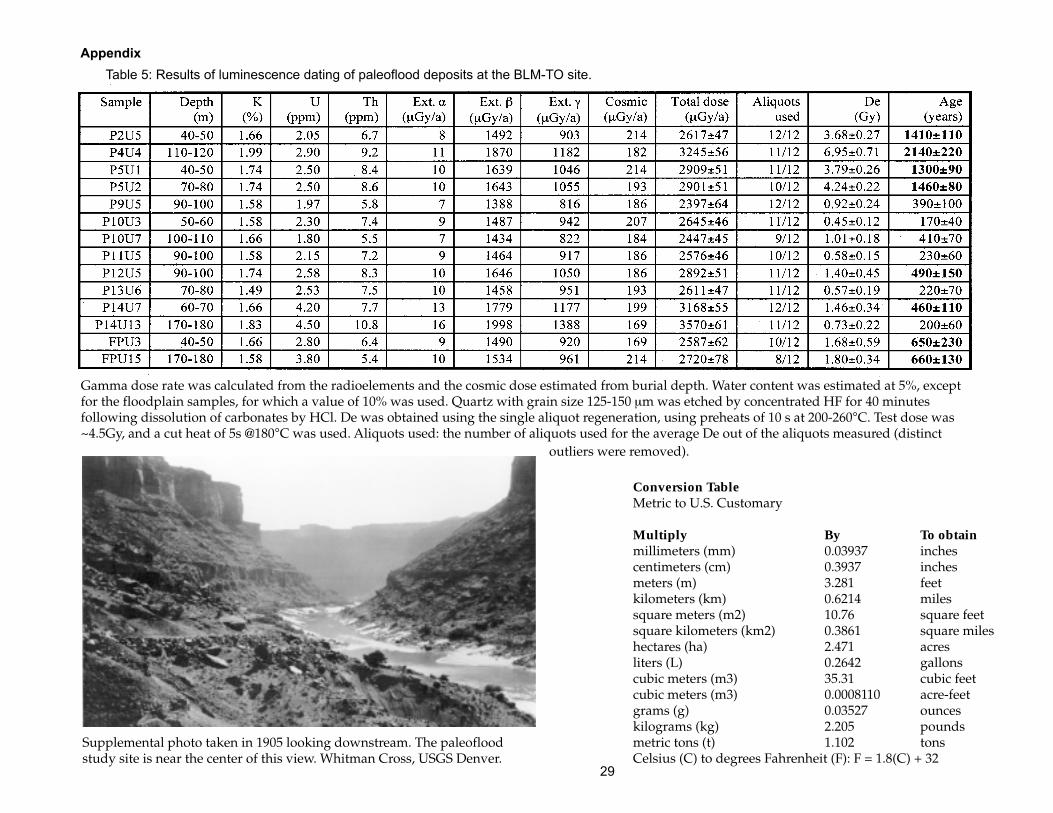
Appendix
29
Conversion TableMetric to U.S. Customary
Multiply By To obtainmillimeters (mm) 0.03937 inchescentimeters (cm) 0.3937 inchesmeters (m) 3.281 feetkilometers (km) 0.6214 milessquare meters (m2) 10.76 square feetsquare kilometers (km2) 0.3861 square mileshectares (ha) 2.471 acresliters (L) 0.2642 gallonscubic meters (m3) 35.31 cubic feetcubic meters (m3) 0.0008110 acre-feetgrams (g) 0.03527 ounceskilograms (kg) 2.205 poundsmetric tons (t) 1.102 tonsCelsius (C) to degrees Fahrenheit (F): F = 1.8(C) + 32
Table 5: Results of luminescence dating of paleoflood deposits at the BLM-TO site.
Gamma dose rate was calculated from the radioelements and the cosmic dose estimated from burial depth. Water content was estimated at 5%, exceptfor the floodplain samples, for which a value of 10% was used. Quartz with grain size 125-150 µm was etched by concentrated HF for 40 minutesfollowing dissolution of carbonates by HCl. De was obtained using the single aliquot regeneration, using preheats of 10 s at 200-260°C. Test dose was~4.5Gy, and a cut heat of 5s @180°C was used. Aliquots used: the number of aliquots used for the average De out of the aliquots measured (distinct
outliers were removed).
Supplemental photo taken in 1905 looking downstream. The paleofloodstudy site is near the center of this view. Whitman Cross, USGS Denver.

30
Photo page 30: Extent of a 300,000 cfs flood in the Moab Valley. John C. Dohrenwend.Photo inside back cover: Aerial photo of Moab Mill Site. John C. Dohrenwend.Photo back cover: Colorado River flood (circa 1920) taken near Courthouse Wash. Utah Historical Society. Photographer unknown.


The following pages include supplemental information not provided in the formal publication:
• The cross-sections using a EDM total station/laser rangefinder
• Color photos of the pits prior to burial
33

34

35

36

37
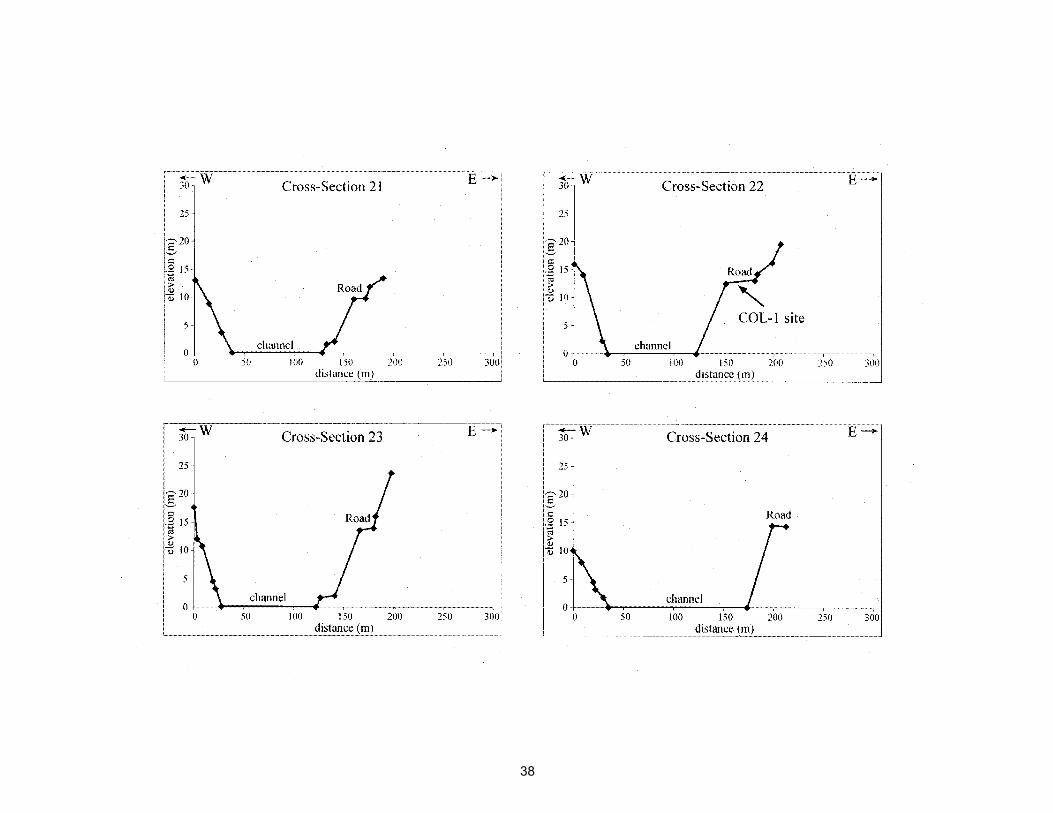
38

Pit 1 Pit 2
39
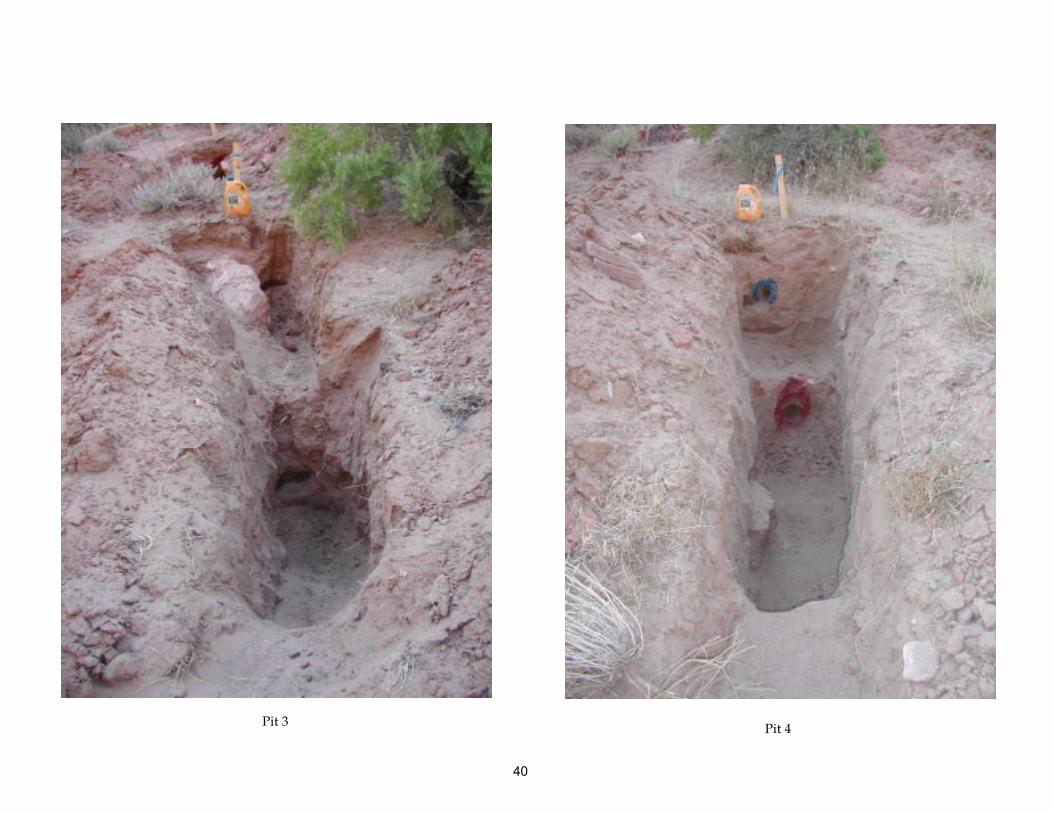
Pit 3 Pit 4
40

Pit 5 Pit 6
41

Pit 7 Pit 8
42

Pit 9 Pit 10
43

Pit 11 Pit 12
44

Pit 13 Pit 14
End45