Embed Size (px)
Citation preview


The model: Vehicle for Glory and Damage
About the place of infrastructure in society and the
influence of climate change on service life
Prof.Dr.Ir. K. van Breugel
Copyright @ 2021 by K. van Breugel
All rights reserved. No part of this publication protected by this copyright notice may be reproduced
or utilized in any form or by any means, electronic or mechanical, including photo-copying, recording,
or by any information storage and retrieval system, without permission from the author or Delft Uni-
versity of Technology.
ISBN: 9789082330410
Contact: [email protected]
Web: www.me.citg.tudelft.nl
Print: DMPlus
Cover photograph and graphic design: Iris Batterham

ii
The model: Vehicle for Glory and Damage
Valedictory address
Delivered at the farewell as professor in the field of
"Concrete Modelling and Material Behaviour"
at the Materials & Environment section of the Faculty of Civil Engineering and Geosci-
ences of Delft University of Technology,
on Friday, September 27, 2019
by
Prof.Dr.Ir. K. van Breugel

iii
Preface
On Friday, September 27, 2019, I had the pleasure of delivering my valedictory address
in the auditorium of Delft University of Technology. It was my intention to publish the
speech in book form as well. Many other things got priority, with the result that the
booklet*1only appears now.
The text of the speech is generally followed in this booklet. However, in this written
version extra attention is paid to the basic idea behind this speech. Briefly summarized,
this basic idea is that people strive to control reality. To this end they have put almost
all their bets on science and technology. To get a grip on reality, scientists and techni-
cians in turn have used models. Via models, acquired insights and knowledge are made
available to the manufacturing industry. The ability to control and shape reality is then
put at the service of the pursuit of growth. Growth figures are impressive. This is illus-
trated in this speech by the infrastructure that has been built up over the years. How-
ever, the downside of this growth is becoming increasingly apparent. The construction
of the infrastructure has an impact on the environment and on the climate. Climate
change in turn affects the lifespan of the infrastructure. The lack of direction (Dutch:
regie) is seen as one of the main causes of unbalanced, damaging growth. Direction is
crucial if, on the one hand, growth is pursued, but on the other hand, the growth-re-
lated environmental impact must remain limited. The government's task to act in a
directive manner is emphasized in this speech. The use of serious gaming is advocated
as an instrument to support direction and good governance.
The beginning and end of this speech are more reflective. The central section delves
deeper into the field of my chair. Both parts have models as the common and unifying
element. If the reader is able to notice the latter, then writing this speech was not only
a pleasure for myself, but I have also achieved at least one of my goals.
A word of thanks goes to my colleague prof. A.Q.C. van der Horst for reading through
the original manuscript, and to Iris Batterham for designing the cover of this booklet.
Delft, October 2020
*) The valedictory address has only been published in book form in Dutch. Digital versions are available both in
Dutch and English.

iv

v
Table of contents
Preface ....................................................................................................................................... iii
Introduction ................................................................................................................................ 1
Infrastructure as a product of science and technology ............................................................. 3
The Treasure ........................................................................................................................... 3
The control motive ................................................................................................................. 4
Reduction and fragmentation ................................................................................................ 5
Fragmentation in construction ............................................................................................... 6
Infrastructure in a global perspective ........................................................................................ 7
Growth of the gross national product .................................................................................... 7
Value of infrastructure ........................................................................................................... 9
Budgets for replacement and growth of infrastructure ......................................................... 9
Concrete under fire .................................................................................................................. 10
Building with concrete - An initial exploration *) .................................................................... 11
Concrete as a material .......................................................................................................... 11
Length scales and the role of models ................................................................................... 12
More about concrete ............................................................................................................... 14
The reaction of cement with water ...................................................................................... 14
Optimizing the mixture composition - Reduction of CO2 emission...................................... 15
Long-term behaviour of bridge decks with old and modern concrete mixtures ................. 17
Models for concrete ................................................................................................................. 18
Numerical models for hardening processes and microstructure development .................. 18
Models for cracking in hardening concrete structures ........................................................ 19
Effect of temperature on the length the construction phase .............................................. 20
Climate change and the service life of infrastructure .............................................................. 22
Effect of temperature on the service life of infrastructure .................................................. 22
Effect of temperature on infrastructure replacement costs ................................................ 25
Saving on infrastructure in the Netherlands - The ‘new natural gas’ ...................................... 26
Savings by extending the service life of infrastructure ........................................................ 26
Key figures for the construction sector ................................................................................ 28
Direction required ................................................................................................................ 29
Options for lifetime extension and reducing environmental impact ...................................... 29
Self-healing concrete ............................................................................................................ 29
Circularity .............................................................................................................................. 31
Serious gaming for interdisciplinary direction in construction ............................................ 33
On direction and leadership ..................................................................................................... 35
What if there is no direction? ............................................................................................... 35
Towards sustainable growth ................................................................................................ 36
The government as director ................................................................................................. 37
The Model: Vehicle for Glory and Damage .............................................................................. 39
Education .................................................................................................................................. 40
Word of thanks ......................................................................................................................... 41

vi
The Model: Vehicle for Glory and Damage
About the place of infrastructure in society and the
influence of climate change on service life

1
Mr. Rector,
members of the Executive Board,
fellow professors and other members of the university community,
esteemed listeners,
ladies and gentlemen,
Introduction
On September 15, 1979, I joined the Concrete Structures Section of the Faculty of Civil
Engineering1 at TU Delft. A gentlemen's agreement had been made with the section
head, Professor A.S.G. Bruggeling. Fifty percent of my time would be spent on teaching
and fifty percent on research. That research should culminate in a doctorate. After four
years I would leave the university and go to work. It all turned out differently. Not four,
but forty years later I am leaving university. If my father had still been here, he would
probably have said that it is nice that I am finally leaving the university, but that it is
really not worth going to work anymore.
Still, I don't feel that I have done nothing in the past forty years. A lot has happened.
Research has been done on bulk storage of hazardous bulk materials, behaviour of
storage structures under extreme loads, liquid tightness of reservoirs, structural be-
haviour under imposed deformations, temperature development and cracking in hard-
ening concrete, service life predictions and modelling of material and structural behav-
iour. Yet, to be fair, most of the research was done by others. And those others, fortu-
nately, were many! Ninety percent of all scientists who have ever been active in sci-
ence, or are still active, live today2. Enormous progress has been made in many areas.
What do we not know yet? What has not yet been explained or solved? In the past,
indeed, there used to be a lot of white spots and black holes in our knowledge. And
when observed phenomena could not be explained, then the 'concept of God' was
brought in to fill up the gaps in our knowledge. But that time is now really over. A
probably untrue anecdote3,4 tells us that emperor Napoleon once asked the scientist
Laplace why God did not appear in his book on cosmology. Laplace is said to have
1 After the Civil Engineering and Mining Engineering faculties were merged in 2007, the name of the faculty was
changed to Civil Engineering & Geosciences 2 E. Guestfriend (2015) 90% of All the Scientists That Ever Lived Are Alive Today.
https://futureoflife.org/2015/ 11/05/90-of-all-the-scientists-that-ever-lived-are-alive today /? 1 = cn-reloaded 3 In: A. van den Beukel (1994) . Met andere ogen (With different eyes. (in Dutch)) Ten Have/Baarn 227 p. 4 C. Jongeneel (2008) It's in a lab and it's right. (in Dutch) Veen Magazines BV 157 p

2
Fig. 1 Napoleon in conversation with Laplace (1749-1827) about his book on cosmology.
replied, "Sire, I did not need that hypothesis." The time when the concept of God was
still necessary to make a scientific theory conclusive was passé for Laplace.
With his statement, Laplace may have been a little far ahead of the troops. But now, a
few centuries later, we really do know much more. In their booklet A Barrel of Fun John
& Stibbe5 describe in a light-hearted way how a group of scientists had come to the
conviction that the cosmos had gradually given up all its secrets. In order to fill in the
gaps in knowledge, the concept of God had become definitively superfluous. For them
the moment had come to inform God of this. A delegation travelled to the divine palace
and knocked on the door. They were received with all respect and God listened atten-
tively to their story. He was very impressed by their achievements. At the end of their
talk, He suggested that they hold a contest. A ‘people making’ contest. That was right
up their alley. They were allowed to start. One of the delegates bent down and scooped
up a handful of soil. "No, no", God said, "you must bring your own soil." Then there
was silence. Disillusioned, the delegation left the heavenly realms to return to earth,
where they found themselves once again with both feet on the ground.
Scientists have to make do with what is available. They investigate what is. In this con-
text, Einstein says that science can determine what is, but not what it should be. For
the question why things are as they are, why there are things at all, for that you have
5 J. John, M. Stibbe (2009) Weer en wind. (in Dutch) Ark Media. 190 p. (Original: A Barrel of Fun) * Pictures: Wikipedia

3
to go to religion. The philosopher Wittgenstein6 would say: "What can be said at all can
be said clearly, and what we cannot talk about we must pass over in silence."
What John & Stibbe, Einstein and Wittgenstein have in common is, that they call for
modesty. We must make do with what is available. Why something is there, and why
we are there, are questions to which the answer cannot be found behind a carbon
atom or a distant celestial body. Carbon atoms and celestial bodies, and everything in
between, in short, for everything that is available, we have our hands more than full!
This also applies to concrete scientists. A handful of soil, if taken selectively, contains
all the ingredients for making concrete. From that concrete he builds locks, roads,
bridges, dams and skyscrapers. That looks glorious. But all these achievements also
have their shadow sides. In recent years, the shadow sides have increasingly come into
the spotlight. In the remainder of this speech we will look at this in more detail. We do
this based on the idea that anyone who is bothered by the shadow, and who wants to
change that, will have to focus on the object that causes the shadow. Running away
from the shadow does not change the shadow. Intervening on the shadow-giving ob-
ject, in order to change its shadow, does require knowledge of that object. The object
which is the subject of this speech is the infrastructure. How did it come about and
what determines its shadow. I would like to introduce further consideration of these
questions with a story, with which I have started many of my lectures in recent years.
The story of 'the treasure'.
Infrastructure as a product of science and technology
The Treasure
A father had three sons. Shortly before his death he called them to him. He told them
that in the piece of land by the sea a treasure was hidden. After saying this he died.
The sons went to the indicated location by the sea and began to dig. First, clearing
stones. After removing the stones, a layer of fertile soil remained. They began to grow
vegetables, and from the stones they built a shed. But they had not yet found the treas-
ure. They dug deeper. The layer of fertile soil was now thick enough to plant large
bushes and create a vineyard. From the stones they built a few houses where they
could stay. They no longer had to return to the village every day to spend the night
there. But they had not yet found the treasure. They dug deeper. They planted a forest
and built up a herd of cattle. From the stones they built a city. They built roads, bridges
and tunnels. Yes, it became a bustling city where it was good to live. Only the treasure
6 L. Wittgenstein (1921) Tractatus Logico-Philosophicus

4
they had still not found. But the value of everything they had built was many times
greater than the treasure they were looking for. Yes, all that was the treasure!
This story is based on a few short sentences from the book The mechanization of the
world picture by E.J. Dijksterhuis7, a great scientist from the last century. The story il-
lustrates how operating from a certain ideal can ultimately yield something that far
exceeds the value of the original ideal. Dijksterhuis refers in this context to the alche-
mists. For centuries they made frantic attempts to make gold, never succeeded, but
did make an enormous contribution to the development of modern chemistry!
The control motive
The treasure for which attention is called in this speech is that of the physical infra-
structure. We shall see in a moment that infrastructure represents enormous capital,
and may rightly be called a treasure. But before we deal with the value of this treasure,
let us first ask ourselves what ideal was ever envisioned that preceded the creation of
the modern infrastructure. Of the possible answers to this question I choose for the
motive 'control'. Control as an ideal and driving force behind developments in con-
struction and, in a more general sense, in science and technology. The theme of control
is addressed in a fascinating way by Staudinger and Behler8 in their book Chance und
Risiko der Gegenwart. There they outline how people have been trying to get a grip on
the world around them for centuries. Behind phenomena in the real world the actions
of ghosts and gods were assumed. That was their ‘model’ of reality. In order to influ-
ence the invisible world of ghosts and gods, people turned to shamans and witch doc-
tors. Those were supposed to be able to penetrate the invisible reality behind the vis-
ible world with special spells and rituals, in order to influence and control this reality.
Modern man has long since said goodbye to this old, metaphysical concept. There are
no ghosts or gods hidden behind every-day phenomena, but natural laws. Particularly
during the Enlightenment, important steps were taken in the demythologizing of our
world picture. The previously mentioned quote from Laplace, that for his cosmology
he no longer needed the hypothesis of God, marked a new era. Reality is not governed
by magic words and rituals, but follows laws of nature. Those who wanted to control
reality and bend it to their will, should turn to science. Knowledge of fundamental nat-
ural laws gives us the possibility of manipulating reality and creating a new world.
7 E.J. Dijksterhuis (1950) The mechanization of the world picture. (Dutch and English) Meulenhoff. 594 p. 8 H. Staudinger, W. Behler (1976) Chance und Risiko der Gegenwart. Deutsches Institut für Bildung und Wis-
sen. Paderborn. F. Schöningh, 385 p.

5
Reduction and fragmentation
The method, used in science to achieve total control of reality, is that of reduction,
decomposition and re-composition. The first stages of this method are shown sche-
matically in Fig. 2. In the first reduction step the complex reality is reduced to a reality
in which everything is measurable and weighable. This step is symbolized here by re-
placing a sphere with a cube. The cube now stands as a 'model' for the spherical reality.
In a metaphorical way, the claim that the model is a one-to-one representation of re-
ality is thus abandoned. The metaphorical element is in the special character of the
number , which is needed to determine the volume of a sphere. In his valedictory
address in 2010 Roos9 recalls that the number of known decimals of is now
5,000,000,000,000. He notes that this number is still relatively small if we consider that
the number of missing decimals is still infinitely large. Thus the number reminds us
of a world in which there was still room for the infinite and intangible, but which has
been lost with the adoption of a reduced reality. In the cube, everything is exact. Only
...... a cube is not a sphere! Those who forget this, and hold the model up to the reality
it represents, not only choose a form of voluntary poverty, but also overestimate the
scope of the concept of 'model'.
Fig. 2 Schematic of the method of reduction and fragmentation in science.
To penetrate deeper into the reduced reality, the cube is further divided into smaller
units (Fig. 2c). We speak of subject areas or disciplines. Within these subject areas,
further reduction takes place. Reality is peeled off to the level of molecules and atoms,
or even smaller. This is shown schematically in Fig. 3. The benefit of this method is that
within individual fields great depth can be achieved. However, this benefit does not
just fall to us easily. There is a hefty price to pay for it. The price is fragmentation of
reality and the creation of a large number of interfaces between disciplines and scale
9 C. Roos (2010) Does tireless work overcome everything? (in Dutch) TU Delft. Valedictory address. MailSupport,
56 p.
Reduction
Decomposition
and fragmentation
a. Real world b. Simplified world c. Scientific multidisciplinary approach

6
Fig. 3 Schematic representation of increasing reduction within one (mono) discipline.
levels. There is also the danger of absolutizing individual disciplines. This danger in-
creases the more a particular discipline is deemed suitable to serve as a vehicle for
realizing prosperity and growth. How excessive growth of individual disciplines can dis-
rupt the harmony within reality as a whole will be discussed in detail later.
Fragmentation in construction
The construction sector has not proved immune to the fragmentation process outlined
here. To illustrate this, we first look at an original definition of architecture:
'Architecture is the art and science of designing and constructing buildings
and other physical structures for human shelter or use'.
The strength of this definition lies in the connection between art and science on the
one hand, and a clearly defined purpose on the other. The purpose of building is to
provide facilities to protect people and make living together possible. Protection is
needed from wind and weather, heat and cold, rising water, wild animals and hostile
nations. Roads and bridges are needed for transportation of people and goods. In ad-
dition to knowledge, which is necessary for the realization of constructions, architec-
ture also includes art. When construction projects were still manageable in size, both
art and science were in the hands of one person, the builder. The builder knew every-
thing, designed everything and oversaw everything. But those days are long gone. Al-
ready around the year zero, Vitruvius, the compiler of a classic ten-volume work on the
art of building, sighed that structures had become so complex that it was impossible
for one person to master all the disciplines of construction10. Fragmentation of con-
struction came on the scene. The strong connection between art and science was in-
10 T. Peters (1999) Vitruvius , Handboek Bouwkunde. Anthenaeum – Polak & Van Gennip. 393 p.
7
creasingly lost. Interfaces arose between parties, with unavoidable obstacles and chal-
lenges for communication and collaboration. In spite of this development, which was
in fact unfavourable for the building industry, a great deal has been achieved over the
centuries. Construction, and the infrastructure it created, have often been crucial to
developments in numerous sectors and to the growth of regional and national econo-
mies.
Infrastructure in a global perspective
Growth of the gross national product
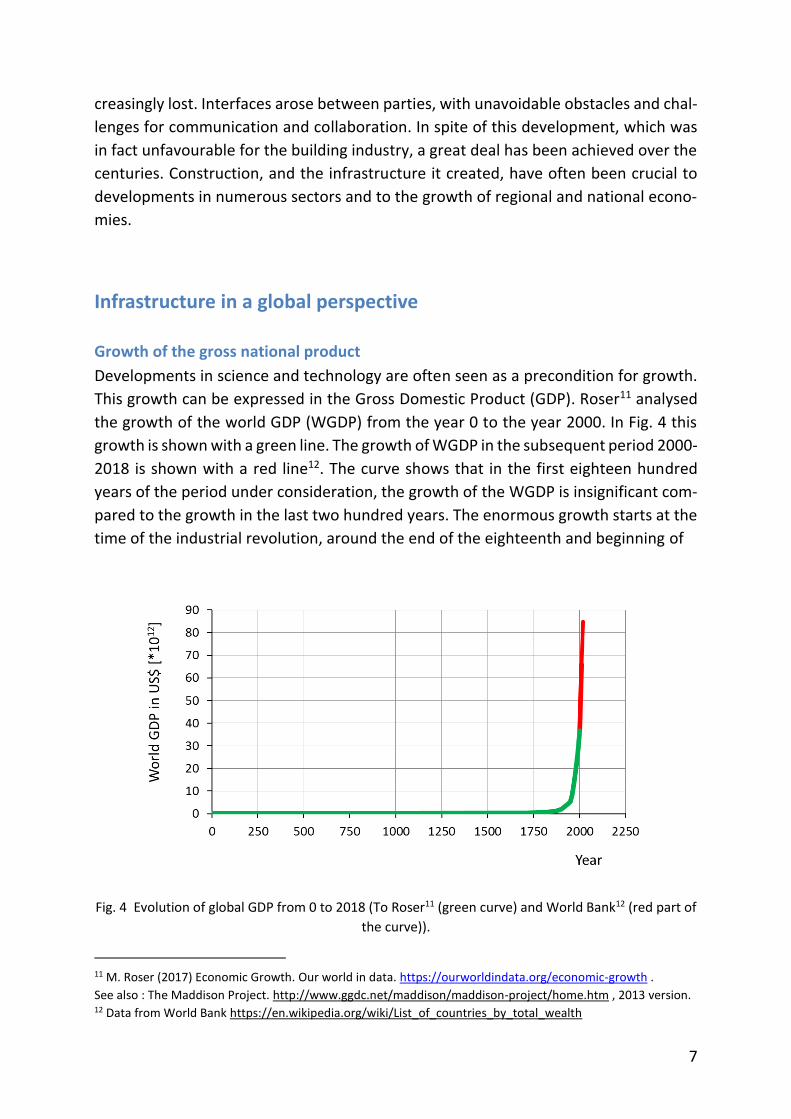
Developments in science and technology are often seen as a precondition for growth.
This growth can be expressed in the Gross Domestic Product (GDP). Roser11 analysed
the growth of the world GDP (WGDP) from the year 0 to the year 2000. In Fig. 4 this
growth is shown with a green line. The growth of WGDP in the subsequent period 2000-
2018 is shown with a red line12. The curve shows that in the first eighteen hundred
years of the period under consideration, the growth of the WGDP is insignificant com-
pared to the growth in the last two hundred years. The enormous growth starts at the
time of the industrial revolution, around the end of the eighteenth and beginning of
Fig. 4 Evolution of global GDP from 0 to 2018 (To Roser11 (green curve) and World Bank12 (red part of
the curve)).
11 M. Roser (2017) Economic Growth. Our world in data. https://ourworldindata.org/economic-growth .
See also : The Maddison Project. http://www.ggdc.net/maddison/maddison-project/home.htm , 2013 version. 12 Data from World Bank https://en.wikipedia.org/wiki/List_of_countries_by_total_wealth

8
the nineteenth century. In the sixties of the last century scientists started to worry
about whether the earth could cope with this enormous growth. Warnings came,
among others, from the Club of Rome with their well-known report "Limits to
Growth13". There has certainly been reacted to that report, but it has not led to a slow-
down in growth. On the contrary! As the curve in Fig. 4 shows, growth has continued
unabated in recent decades.
Fig. 5 zooms in on the growth of the WGDP since 1950. This growth, indicated by the
red line, can be explained by the growth of the world population (blue line), and an
even stronger increase in per capita consumption (green line). In addition to the
growth of the WGDP, the figure also shows the increase in cement production. We see
that during the period under consideration, cement production grew even faster than
the WGDP. This should not surprise us either. Growth of the WGDP requires good in-
frastructure, and for that a lot of concrete is needed. We can safely say that when it
comes to prosperity and growth, the material concrete has mattered and still matters!
Fig. 5 Percentage growth of the World GDP, world population, GDP per person and cement produc-
tion in the period 1950-2018 (see also Van Breugel50).
13 Club of Rome (1972 ). Limits to Growth (The Limits to Growth )

9
Value of infrastructure
The growth of the WGDP has been accompanied by an increase in national capital, i.e.
wealth. Global Gross National Wealth (GNW) in 2018 has been estimated at US$ 320
trillion12. Of this, physical infrastructure makes up about half14, i.e. US$ 160 trillion. Of
this, US$ 90 trillion is in houses and US$ 70 trillion in civil infrastructure. By way of
comparison: the total value of the infrastructure is about twenty times that of all the
gold - about 190,000 tons - ever mined (price level 2019). Therefore, it is really not an
exaggeration to see infrastructure as a treasure! A treasure that represents enormous
capital. The latter determines us in our responsibility to handle this treasure with care.
This care is especially necessary when we realize that this treasure is continuously sub-
ject to ageing.
Budgets for replacement and growth of infrastructure
As a result of ageing, the lifespan of infrastructure is limited. The design life of struc-
tures is between 50 and 100 years, with outliers to 150 and 200 years. In exceptional
cases, a lifespan of up to 1000 years is required, for example for structures for the
storage of radioactive waste. To maintain this infrastructure, assuming a value of US$
160 trillion and an average lifespan of 50 years, an annual replacement budget of US$
3.2 trillion will be required.
The replacement task is particularly important in industrialized countries with a more
or less mature infrastructure. In emerging economies, investments are mainly made in
infrastructure that is needed to realize growth. Over the period 2013-2030, global
growth will require US$ 57 trillion15. That comes down to US$ 3.2 trillion per year. We
saw earlier that an equally large amount is required annually to replace existing infra-
structure. In the period up to 2030, therefore, growth and maintenance of global in-
frastructure will require US$ 6.4 trillion annually. To reduce this large sum to a human
scale, we can divide it by the world population of 7.7 billion (2019). Then we see that
a world citizen has to spend US$ 830 annually on maintenance and growth of the in-
frastructure. At first glance, this does not seem too bad. However, a few caveats are in
order. First, an annual amount of US$ 830 per capita is indeed relatively small when
compared to the gross national product per capita in the rich countries. In the world's
ten richest countries, GDP per capita ranges between US$ 54000 and US$ 114000 per
year16,17 (Table 1). This is substantially more than in the ten poorest countries. There,
GDP per capita ranges from US$ 303 to US$ 544 per year. It is clear that in the latter
14 AE Long, Sustainable bridges through innovative advances. Institution of Civil Engineers, presented at Joint
ICE and TRF Fellows Lecture. 23, 2007. 15 R. Dobbs, et al. (2013) Infrastructure productivity: How to save $1 trillion a year. McKinsey Global Inst. , 88 p. 16 World Bank data. 2018 17 The amounts shown here are mainly to illustrate the differences between poor and rich countries

10
Table 1 Gross Domestic Product (GDP) per capita in rich and poor countries16
Nations
Population
GDP/inhabitant/year
US$
10 richest countries
10 poorest countries
49 billion
210 billion
54000 – 114000
303 - 544
countries an annual amount of US$830 per capita for infrastructure cannot be raised.
However, it should be noted - and this is the second observation - that the per capita
value of infrastructure in rich countries is many times greater than in poor countries.
In the rich countries the amount that has to be paid annually to maintain the infra-
structure is, therefore, a multiple of US$ 830 per capita.
The numbers and amounts mentioned here give us an impression of the value of our
infrastructure. But they also confront us with the - worldwide - unequal distribution of
capital assets. This, of course, is not a new fact. It does show that a consideration of
infrastructure, and the associated budgets for replacement and growth, is not possible
without facing the issue of equitable distribution of goods and property. In what fol-
lows, it will become apparent that this is a recurring theme as soon as the aspect of
sustainability comes up for discussion.
Concrete under fire
Concrete is the most widely used building material on earth. Per capita, approximately
1.0 m3 of concrete is produced annually18. Without concrete there is no infrastructure,
and without a good infrastructure there is no flourishing economy. Yet the image of
the material concrete is not good. Watts19 even calls concrete the most destructive
material on earth. Vidal20 adds that concrete is plunging us into climate catastrophe.
"Concrete fills our rubbish dumps, overheats our cities, causes floods that kills thou-
sands of people - and fundamentally changes our relationship to the planet." Now it is
known that there are people who do not like concrete. But what Vidal is saying here
goes a long way. Nevertheless, we cannot simply ignore these statements. They were
18 Meyer, C. (2020) Concrete Materials and Sustainable Development in the United States 19 J. Watts (2019) Concrete: the most destructive material on earth. The Guardian Concrete Week.
https://www.theguardian.com/cities/2019/feb/25/concrete-the-most-destructive-material-on-earth 20 J. Vidal (2019) Concrete is tipping us into climate catastrophe. It's payback time. The Guardian
https://www.theguardian.com/cities/2019/feb/25/concrete-is-tipping-us-into-climate-catastrophe-its-pay-
back-time-cement-tax

11
not made by professional complainers in some corner of the world. These statements
were made during Guardian Concrete Week, a platform where people come together
who really know what is going on. What Watts and Vidal claim, therefore, deserves a
thorough evaluation. This involves both the content of their statements and the con-
text in which they made them. Regarding the latter: the context was that of the current
climate issue.
The negative image of concrete is mainly due to the CO2 emissions associated with the
production of cement. Cement production accounts for 5 to 8 percent of global CO2
emissions. CO2 emissions from the entire concrete sector amount to about 10% of
global CO2 emissions. Steel production is associated with similar emissions. Together,
the production and application of concrete and steel account for the emission of 6.7
billion tons CO2 per year21. The question now is what options the construction sector
has to reduce CO2 emissions and, more generally, to mitigate the environmental im-
pact of the construction sector. In this speech I will limit myself to the options available
to the concrete sector. We first look at the material concrete itself. How is it made?
What is cement made of and how does concrete get its strength? Then we focus on
the construction process. Where are the opportunities to reduce the environmental
impact of construction, what does that bring us, and what is the role of models in all
of this.
Building with concrete - An initial exploration *)
Concrete as a material
Concrete is a complex, heterogeneous material. The main constituents of concrete are
cement, sand, gravel and water. Cement is a fine powder, with a grain size of 0.5 to
100 m. When cement reacts with water, reaction products are formed. Together with
unreacted cement grains, these reaction products form cement paste, with which sand
and gravel particles are "cemented" together. During the reaction of cement with wa-
ter, heat is released and the temperature of the concrete rises. Gradually, as the reac-
tion proceeds, the concrete becomes stiffer and stronger. The strength class of con-
crete is characterized by its compressive strength after 28 days, reached after harden-
ing at a temperature of about 20C. Eighty to ninety percent of the concrete used in
21 K. van Breugel (2017) Aging infrastructure and circular economy: challenges and risks Proceedings of the
2nd World Congress on Civil, Structural, and Environmental Engineering (CSEE'17) , Barcelona, 12p.
*) The following text is more technical in nature. The more contemplative part of this lecture will be resumed
with the paragraph "Saving on infrastructure in the Netherlands - The new natural gas" on p. 26.

12
The Netherlands falls in the strength class 25 to 45 N/mm2. The tensile strength of
concrete is much lower than the compressive strength, usually only 10% of it. Because
of the relatively low tensile strength, concrete elements are provided with reinforce-
ment. If the tensile strength of the concrete is locally exceeded upon loading, the rein-
forcement takes over the role of the concrete. The concrete is then cracked. The trick
of designing reinforced concrete structures is to dimension the reinforcement so that
the crack width remains within acceptable limits. As long as crack width criteria can be
met, cracks are not seen as damage, but are part of a sound design in reinforced con-
crete.
Large-scale application of concrete dates back to the early twentieth century. Impres-
sive structures were built such as dams, bridges and viaducts. This type of construction
often involved large sizes and large volumes. We then speak of mass concrete. In these
large concrete volumes, the temperature can rise considerably during the hardening
process. When cooling down later, this can lead to crack formation. Severe cracking is
undesirable from a durability point of view and for decades an important reason for
intensive research into factors that influence the curing process and the probability of
cracking. To get a good picture of these factors, we have to descend to the level of
atoms and molecules. Then we can make the figurative bridge to the behaviour of con-
crete structures, with dimensions from tens to hundreds of meters.
Length scales and the role of models
Fig. 6 shows the length scales that come into the picture when studying and making
concrete and concrete structures. Materials scientists and concrete technologists
study the behaviour of concrete at length scales from 10-10 m (1 Angstrom) to 10-2 m
(1 cm). That is a range of eight orders of magnitude. Structural engineers focus on the
behaviour of concrete structures with dimensions up to hundreds of meters, while
looking at crack widths down to tenths of millimetres. That is a range of six orders of
magnitude. Over the years, an enormous amount of knowledge has been developed at
all these scale levels and is incorporated into the design and construction process.
Models played a crucial role in this. Models make it possible to link knowledge on suc-
cessive scales and to make all this accessible for practice. Practical applications include
constructions for 'human shelter or use', but also many other structures. These struc-
tures will appeal more to the imagination if they are the result of a harmonious inter-
action of scientific knowledge and art. An example of a constructively and architectur-
ally challenging creation is the apartment complex Habitat 67 in Montreal (Fig. 7a). This
complex was built in the 1970s. It is appealing because of its architecture and the
choice to keep the concrete completely in view. The apartments are placed as separate
units and then connected to each other. From a constructive point of view, the con-
nections between the cubic units are a major challenge. It would have been have much

13
Fig. 6 Schematic representation of multiscale approach in materials and construction domain.
easier to place the units in a regular grid, as outlined in Fig. 7b. But that is emphatically
not chosen in this complex. In a figurative sense, you could see the whole apartment
complex as the result of decomposition of a composite cube, followed by a creative
process of re-composing and connecting the individual units. The strong deviation
a. Architecture = Science + Art b. Only science
Fig. 7 Apartment complex Habitat 67, Montreal, Canada.

14
from a simple composite cube has resulted in an appealing structure. But a high price
has been paid for this! The connections, i.e. interfaces, between the cubic units are
complicated. Consider that this complex is exposed to large temperature differences:
in winter to -30C and in summer +30C. Large temperature differences lead to large
forces in the construction. All in all, it is an enormous task for structural engineers to
control cracking as a result of the imposed temperature and shrinkage differences!
More about concrete
The reaction of cement with water
The hardening process of concrete is a complex physicochemical process. It has already
been mentioned that the reaction of cement with water, called hydration, releases
heat. The amount of heat produced and the rate of heat release depend on the chem-
ical composition and fineness of the cement. These are also the factors that the con-
crete technologist can play with to control the curing process. To make this clear, we
will look in more detail at the composition of a classic Portland cement. Fig. 8a shows
- schematically - a cement particle with the four main constituents of cement: di- and
tricalcium silicate (C2S and C3S), tricalcium alumunate (C3A) and tetracalcium aluminate
ferrite (C4AF). The main reaction products formed when cement reacts with water are
calcium silicate hydrate (CSH) and calcium hydroxide (CH). The volume of the reaction
products is larger than that of the original cement. This means that a reacting cement
particle ‘grows’, as it were. An outward growing shell of reaction products forms
around the cement particle (Fig. 8b). Reaction products that are formed within the
original contours of the cement particle are called ‘inner product’ (Fig. 8b, red shell).
Reaction products outside these contours are referred to as 'outer product' (Fig. 8b,
yellow shell).
a. Cement grain in water b. Hydrating cement grain c. Rate of heat liberation
Fig. 8 Schematic representation of a stages in the reaction process and rate of heat liberation.

15
The rate at which individual cement constituents react with water is different. C3A and
C3S react relatively quickly. The rate of heat release, dQ/dt, is shown graphically in Fig.
8c. The fineness of the cement also affects the reaction rate. A finely ground cement
has a large surface area that can react with water. The reaction then proceeds rapidly,
and the rate of heat release and development of concrete properties also increases.
Optimizing the mixture composition - Reduction of CO2 emission
When choosing a particular chemical composition and fineness of cement, the con-
crete technologist may have several goals in mind. He may want to keep the tempera-
ture of the concrete low during curing. He can then opt for a coarse cement with a low
C3S and C3A content. This will result in a slow strength development. It is also possible
that he wants a fast strength development. In that case he will choose a fine cement
with a high C3S and C3A content. Today he would probably also strive for the lowest
possible CO2 emission per cubic meter of concrete. How this can be achieved will be
illustrated by examining three mixtures in more detail. The mixtures are shown sche-
matically in Fig. 9. Mixture A is made with a coarse cement, mixture B with a fine ce-
ment, and mixture C with a fine cement, part of which is replaced with an inert filler.
The coarse mixture A, because of the small specific surface area of the cement, will
react slowly. Slowly, sand grains will be cemented together by the ‘growing’ cement
particle. The coarse cement particle will be left partially unhydrated (Fig. 9d).
The fine cement B has a large specific surface area and will react quickly, which results
in rapid strength development. All the cement reacts (Fig. 9e), which will lead to a sig-
nificant heat release. The release of a lot of heat means a high temperature of the
concrete and, on subsequent cooling, a significant probability of cracking. Moreover, a
high reaction temperature will produce a cement paste with a relatively coarse pore
system and lower final strength. A somewhat lower final strength is usually not a prob-
lem, but a coarse pore system can certainly cause problems. The resistance of the con-
crete to penetration of aggressive substances then decreases, and the structure will be
less durable. So there is a price to pay if we want rapid strength development in order
to build quickly!
From the concrete technology point of view the answer to the disadvantages of mix-
ture B is, at least in part, to optimize the particle packing of the cement and aggregate.
With a high packing density of the aggregate, a smaller volume remains that still needs
to be filled with cement paste. Consequently, a lower cement content will suffice (mix-
ture C, Fig. 9c). Good strength can still be achieved with less cement because the ‘grow-
ing’ cement particles have to bridge shorter distances between the aggregate particles
(Fig. 9f). Thus, two birds with one stone are killed. Less cement means less CO2 emis-

16
Mixture A Mixture B Mixture C
Fig. 9 Characteristics of concrete mixtures. A) Mixture with coarse cement; B) Mixture with fine ce-
ment; C) Fine cement with dense granular packing of aggregate and/or inert filler (e.g. very fine
sand). ( cement; inner product; outer product; crack)
sions per cubic meter of concrete, and thus a lower environmental impact. At the same
time, less cement also means less heat generation and a lower probability of cracking
in the cooling phase of the hardening process.
If we now compare the mixtures A, B and C, mixture C tends towards the ideal mixture.
Less cement, less heat development, a relatively fast strength development and also a
good, sometimes even very high final strength. Because cement is much more expen-
sive than sand and gravel, a high packing density also provides an economic advantage.
But still a side note. Concrete is a brittle material and is, therefore, susceptible to crack-
ing. If a crack develops in the concrete, mixture A has an advantage over mixtures B
and C. After all, in the coarse mixture A there is still an amount of non-hydrated cement
Sand particle Cement grain Inert filler Reinforcement

17
present (Fig. 9d). When water penetrates a crack, it can react with the remaining ce-
ment and the crack can close again (Fig. 9g). The concrete repairs itself! Mixtures B and
C no longer have this self-healing ability (Figs. 9h and 9i). In other words, the slow mix-
ture A is more robust than the faster mixtures B and C.
Long-term behaviour of bridge decks with old and modern concrete mixtures
The suspicion that the coarse and slow mixture A is more robust than the faster mix-
tures B and C finds support in an extensive study in the United States on the behaviour
of concrete bridge decks. Mehta et al.22 examined the long-term behaviour of bridge
decks manufactured during four consecutive periods in the last century. The periods
are shown in Fig. 10 on the horizontal axis. Mehta found that old bridge decks made
before 1930 exhibited fewer problems than bridge decks made with more modern con-
crete mixtures. The durability problems increased with increasing cement fineness,
higher contents of the more rapidly reacting C3A and C3S, and a low water-cement fac-
tor (applied to achieve high strengths). This development in concrete mixtures was the
answer to the desire to build faster, bigger, stronger and higher. Or in other words, the
driving force behind this development was the economy! Today, the environmental
requirement to reduce CO2 emissions is added to this wish list. Reducing the amount
of cement in the concrete seems a logic shortcut to meet both the economic and en-
Fig. 10 Ranking of long-term behaviour of concrete bridge decks built in the period before 1930 up to
the early 21st century. Vertical axis: performance (after Mehta et al22).
22 K. Mehta et al. (2001) Building Durable Structures in the 21st Century. Concrete Int., Vol. 23 (3) pp. 57-63

18
vironmental requirements. But when this short stroke leads to crack-prone structure
with less self-healing capacity, and therefore a shorter life span, the intended eco-
nomic and environmental benefit can eventually evaporate completely and even, as
shown in the example of the bridge decks, turn into its opposite!
Models for concrete
Numerical models for hardening processes and microstructure development
In the foregoing we dwelt on the reaction of only a few individual cement particles with
water. In reality, concrete contains millions of cement particles. When they all start to
react, they come into contact with each other and together they form hardened ce-
ment paste. A number of numerical models have been proposed in the past to simulate
the formation of cement paste. One of these models is the so-called pixel model23,
shown in Fig. 11a. In that model, cement particles are considered to consist of small
cubes, called voxels, with a typical size of 1 m3. To these voxels certain properties are
assigned. They make random walks through the cement paste, react with other voxels
and thus form a microstructure. Another model is known as HYMOSTRUC24, and was
developed at Delft University of Technology. In that model, cement particles are rep-
resented as small spheres that grow slowly and thus come into contact with each other.
This model dates back from the early 1980s, and was further developed by Koenders25,
Ye26 and Peng27. Fig. 11b shows a virtual microstructure generated with the program
HYMOSTRUC3D.EXD27. Such a virtual microstructure can be used to describe, for ex-
ample, the development of material properties of hardening concrete24, or for investi-
gating microcracking in cement paste loaded by an external tensile force or an imposed
strain28 (Fig. 11c). Advanced hydration and microstructure models are also used as the
basis for computer programs used to simulate the behaviour of complete concrete
structures in the curing phase. Let’s have a look at those programs in the next para-
graph.
23 Bentz, D.P., Garboczi E.J. (1989) A digitized simulation model for microstructural development. Advances in
Cementitious Materials, Ed. S. Mindess, Westerville, Ohio, USA, Am. Ceramic Society, pp. 211-226. 24 K. van Breugel (1991) Simulation of hydration and formation of microstructure in hardening cement-based materials. PhD Thesis, TU Delft, 305 p. 25 E.A.B. Koenders (1997) Simulation of volume changes in hardening cement-based materials. PhD Thesis, TU Delft, 171 p. 26 G. Ye. (2003) The Microstructure and Permeability of Cementitious Materials. PhD Thesis, TU Delft, 186 p. 27 G. Peng (2018) Simulation of hydration and microstructure development of blended cement. PhD Thesis, TU Delft,
223 p. 28 Z. Qian (2012) Multiscale modelling of fracture processes in cementitious materials. PhD Thesis. TU Delft, 151 p.

19
a. NIST model23 b. HYMOSTRUC3D-EXD27 c. Testing virtual microstructure28
Fig. 11 Examples of numerically generated virtual microstructures of cement paste.
Models for cracking in hardening concrete structures
Advanced numerical models for describing the hardening process in concrete find their
way to the practice through so-called Concrete Curing Control Systems. These systems
are used to simulate the curing process in concrete structures as a function of the con-
crete mixture composition, structure dimensions, formwork type, pouring sequence
and weather conditions. An example of a practical application of a Concrete Curing
Control System concerns the simulation of the temperature and stress development in
a hardening concrete wall that is poured on a rigid foundation slab. Such a situation is
shown schematically in Fig. 12. In the wall cracks may occur at the surface when the
wall cools down at the outside while the core of the wall is still warm. These surface
cracks can be detrimental to the durability of the structure. In addition to surface
cracks, so-called through-cracks can occur. These cracks are undesirable because they
jeopardize the water tightness of the structure. Through-cracks occur when the core
of the wall cools down over time. The wall as a whole then wants to shrink, but the
rigid foundation slab will prevent this and the concrete wall might crack. By using a
Concrete Curing Control System the hardening process can be controlled in such a way

20
Fig. 12 Concrete wall poured on rigid foundation slab. Probability of formation of surface cracks and
through-cracks (after Sule29).
that the probability of cracking is minimal. The concrete temperature plays a crucial
role in this analysis. In view of what follows we shall have to dwell a little longer on the
influence of temperature on the curing process. In particular, the rate at which the
curing process takes place deserves our attention.
Effect of temperature on the length the construction phase
The rate of the hardening process determines, at least in part, the duration of the
construction phase of a concrete structure. The construction phase includes making
the formwork, placing the reinforcement, making and pouring the concrete, the
hardening process, demoulding of the structure and finishing of the concrete surface.
The upper part of Fig. 13 shows some illustrations of these operations. The lower part
of the figure shows the so-called ‘performance curve’ of a structure. This curve shows,
in addition to the construction phase, also the subsequent operation phase and the
degradation phase. For economic reasons the construction phase should be kept as
short as possible. The rate at which the concrete hardens plays an important role in
this. The rate of hardening depends on the reaction temperature. The effect of
temperature on the rate of hardening can be described by an Arrhenius function30. This
formula describes the rate S(T) of physicochemical processes as a function of an
experimentally determinable constant A, the temperature T [K], the activation energy
EA [J/mol] and the universal gas constant R [J/mol.K]. In formula form:
S(T) = A ∙ e- EA RT
29 M. Sule (2003) Effect of reinforcement on early-age cracking in high strength concrete, PhD Thesis, TU Delft, 143 p. 30 S. Glasstone et al. (1941) The theory of rate processes. McGraw Hill Book Comp. NY.

21
Fig. 13 Performance curve of a concrete structure, showing successive stages in the lifetime of a
structure, with focus on the construction phase.
For the duration of the hardening process tconstr , counted from the time of pouring
the concrete until reaching the required strength, it can be derived based on the Ar-
rhenius function:
∆tconstr(Treal) = ∆tconstr(Tref) ∙ e-
EAR
∙ (Treal - TrefTreal ∙ Tref
)
where tconstr (Treal) is the hardening time at the real temperature of the concrete Treal
[K], and tconstr (Tref) is the hardening time at a reference temperature Tref [K] (often
20C, 293 K)31. Values for the activation energy EA depend on the type of cement and
the concrete composition. Common values are between 20 and 60 kJ/mol.
Although the hardening of concrete is an extremely complex process, the effect of tem-
perature on the hardening time appears to be well described with this relatively simple
Arrhenius formula. For common values of the activation energy a 10C higher reaction
temperature will almost halve the hardening time, resulting in a much shorter con-
struction time. Economically this is beneficial, at least in the short term. However, as
31 The actual temperature Treal , and the reference temperature Tref may also be functions of time, i.e. Treal (t) and
Tref (t)

22
we have seen before, a high concrete temperature during hardening will result in a
more porous concrete, while also increasing the probability of cracking on cooling,
which in turn is unfavourable for the quality of the concrete. With the help of an ad-
vanced Concrete Curing Control System the hardening process can be controlled in
such a way that an optimum is achieved between the construction speed on the one
hand and the quality of the structure on the other. To achieve a high initial quality, a
relatively low hardening temperature is often advantageous. The construction time will
then be slightly longer (in the order of days), but the increase in life span can be many
years! So the builder really has something to choose from!
Climate change and the service life of infrastructure
Effect of temperature on the service life of infrastructure
We have just seen that the length of the construction phase of a structure is partly
determined by the temperature of the concrete during hardening. We now wonder
whether there is also something to be said about the effect of temperature on the
duration of the phase that follows the construction phase, namely the service life of a
structure. In the past, this was almost never considered. However, the current discus-
sion on climate change and global warming makes this question topical.
To be able to say something about the effect of temperature on the structure’s service
life, we must first know which factors determine the end of this phase. Processes and
mechanisms that should be mentioned in this context are penetration of chloride into
the concrete, carbonation of concrete and degradation due to micro-cracking caused
by temperature and moisture changes. Schematically, this is shown with the cartoons
in the upper part of Fig. 14. When chloride ions, originating from, for example, de-icing
salts or seawater, reach the reinforcement it can start to corrode. Corrosion of the
reinforcement can also result from carbonation of the concrete. Carbonation is the re-
action of CO2 from the air with reaction products in the concrete. This increases the
acidity of the concrete and lowers the pH from about 13 to values below 9. At a pH
below 9, the risk of corrosion of the reinforcement increases significantly. With a high
CO2 content in the air – an issue today! - , the carbonation process proceeds more
quickly, and the critical pH value at the location of the reinforcement will be reached
sooner. Often, the onset of corrosion of the reinforcement is referred to as "end of
service life".
The deterioration mechanisms of concrete mentioned here all concern physicochemi-
cal processes. With an increase in temperature, the rate of these processes will in-

23
Fig. 14 Performance curve of a concrete structure, showing various degradation mechanisms which
determine the service life of a structure.
crease. In principle, the Arrhenius function can also be applied here. For the service life
of a structure as function of the average temperature it then holds:
∆tSL(Tclimate) = ∆tSL(Tref) ∙ e-
EAR
∙ (Tclimate - TrefTclimate ∙ Tref
)
where tSL(Tclimate) is the lifetime at the actual average ambient temperature Tclimate,
and tSL(TRef) is the lifetime at the reference temperature TRef. As a reference temper-
ature the average annual temperature can be used32.
The question now is what the increase of the average temperature due to global warm-
ing means for the service life of our infrastructure. The IPCC (International Panel on
Climate Change) calculates an expected temperature increase of 2.5C. In addition, it
also considers a pessimistic scenario with a temperature increase of 6.5C. Fig. 15
graphically depicts the effect of temperature rise on the infrastructure’s lifetime. The
32 The average annual temperature in the Netherlands is between 10C and 12C. In the period 2010-2018, the
average temperature by continent was: Europe 8.6C; North America 12.2C; Asia 16.6C; Africa 21.9C; Australia
14.9C; Oceania 23.9C. Source: World Data Info - https://www.worlddata.info/global-warming.php

24
Fig. 15 Decrease in lifetime of (global) infrastructure with increase in average temperature.
horizontal axis shows the temperature, and the vertical axis the lifetime as percentage
of the lifetime at the reference temperature. Calculations have been performed for a
reference temperature of 15C and activation energies of 25, 35 and 45 kJ/mol. A tem-
perature increase of 2.5C will cause a decrease of the lifetime by 9% to 15%. In a pes-
simistic scenario the decrease of service life will be 20% to as much as 30%. For com-
parison the figure also shows results from other researchers. They examined the effect
of a temperature increase and an increase in the CO2 content in the air on the lifespan
of specific concrete structures. Their results differ slightly from the values calculated
with the formula used here, but the trend is the same. This is not surprising. The basis
for these calculations are formulas from reaction kinetics. These formulas have proven
to be applicable thousands of times for describing temperature effects on the rate of
physicochemical processes. The shortening of the lifespan of infrastructure as a result
of global warming calculated here is, therefore, not the result of doom-mongering, but
of the application of basic principles of reaction kinetics!
It should be noted that Fig. 15 shows the effect of the average global temperature rise
on the lifetime of global infrastructure. It is quite possible that the effect will be differ-
ent locally. For example, an average global temperature rise will cause zones with a lot
of frost-thaw cycles to move north and south. This means that there will be areas
where frost damage will decrease and the lifespan of structures will increase rather
than decrease. On the other hand, there will also be areas where frost damage will
increase. Here we see the importance of considering phenomena at different scales

25
and defining suitable boundary conditions. At different scales the response to one and
the same cause, i.e. a rise in temperature, may show opposite trends!
Effect of temperature on infrastructure replacement costs
As temperatures rise, as we have seen, the lifespan of infrastructure will decrease.
Shortening the lifespan will lead to an increase in annual replacement costs. In Fig. 16
the additional replacement costs are plotted against the average temperature in-
crease. The starting points for the calculation of the extra replacement costs are the
value of the global infrastructure of US$ 160 trillion, a reference lifetime of 50 years
and an activation energy of 35 kJ/mol. An increase in the average temperature of 2.5C
results in an increase in replacement costs of US$ 430 billion per year. In the extreme
scenario, with a temperature increase of 6.5C, this increase amounts to US$ 1220 bil-
lion per year. By way of comparison: in the period 2010-2015 natural disaster damages
due to climate change ranged between US$ 100 and US$ 300 billion per year33. Thus,
the projected additional infrastructure replacement costs from a 2.5C temperature
increase are significantly higher than the damages from climate-related natural disas-
ters!
Fig. 16 Increase in annual replacement costs of global infrastructure as a function of increase of the
mean global temperature.
33 W.J.J. Botzen (2017) Economics of Climate Change and Natural Disasters. Inaugural lecture Free University,
Amsterdam, 28p.

26
Table 2 Additional replacement costs as a percentage of GDP**)/cap. in rich and poor countries.
Extra replacement costs/cap. for IPCC climate scenarios
Temperature rise (expected)
2.5 C
Temperature rise (pessimistic)
6.5 C
Costs: 56 US$/cap/yr Costs: 158 US$/cap/yr
Category GDP/cap/yr Percentage of GDP/cap/yr
Rich countries*) 114,000 0.05% 0.14%
54,000 0.10% 0.29%
Poor countries*) 544 10.1% 29.0%
303 18.5% 52.2%
*) 10 rich and 10 poor countries, according to World Bank (2018) **) GPD: Gross Domestic Product
For a world population of 7.7 billion people and a projected temperature increase of
2.5C, the additional per capita replacement costs amount to US$ 56 per year. In the
ten richest countries this corresponds to 0.05% to 0.10% of GDP per capita (Table 2).
For residents of the ten poorest countries this is 10.1% to 18.5% of GDP per capita.
Looking at these figures, it is clear that the impact of climate change on the lifespan of
the infrastructure cannot be borne by inhabitants of the poor countries. It is mainly the
rich countries that will have to pay for these extra replacement costs.
Saving on infrastructure in the Netherlands - The ‘new natural gas’
Savings by extending the service life of infrastructure
We have just seen that global warming will inevitably lead to a shortening of the service
life of infrastructure and an increase in replacement costs. This is for sure a realistic,
but also a somewhat gloomy way of looking at reality. We can also reason the other
way round. We then ask ourselves what we could save on replacement costs if we suc-
ceeded in extending the service life of infrastructure. To illustrate this approach, we
will now focus on the Dutch situation.
We saw earlier that the physical infrastructure makes up about 50% of a country's na-
tional capital. For the Netherlands, this rule of thumb holds quite true as well. Table 3
shows for various infrastructure components what proportion they make up of the na-
tional capital. The figures in the table relate to the situation in 2009. According to the
Dutch Central Agency for Statistics, the national wealth at that time was € 3800 bil-
lion34. The value of infrastructure was € 1825 billion35. That is 47% of the Dutch national
34 Source: CBS, 2009 Centraal Bureau voor de Statistiek (Central Agency for Statistics) 35 Note: For 2015, Statistics Netherlands estimates a value for the infrastructure of € 2001 billion.

27
Table 3 Value infrastructure of The Netherlands36
Fixed capital goods Value
[ € 1.000.000.000]
Percentage of national wealth
[%]
Infrastructure
Houses
Industrial building
Permanent capital goods
312
975
382
156
8
25
10
4
Total 1825 47
capital. Now suppose that the design reference lifetime of our infrastructure is on av-
erage 50 years, and that we can extend it by 10% or 20% to 55 or 60 years, respectively.
Fig. 17 shows how extending the lifespan will reduce the annual replacement costs.
Extending the life span from 50 to 55 or 60 years results in annual savings of € 3.3
billion and € 6.1 billion, respectively. An amount of € 3.3 billion per year corresponds
to the Dutch natural gas revenues in the 1990s37. The Dutch infrastructure could, there-
fore, be regarded as an enormous gas field, that could save us billions of euros if we
would handle it more carefully!
It must be emphasized that it is certainly not easy to extend the average lifespan of
infrastructure by, say, 10%. The billions that can be saved here are really not to be
Fig. 17 Replacement costs of the Dutch infrastructure as function of service life.
36 De Haan, M. et al. (2009) Het nationaal vermogen van Nederland. In De Nederlandse economie 2009, pp. 129-140 (in Dutch). 37 Natural gas revenues in the 1990s : €2 - €4 billion per year. Source :
https://nl.wikipedia.org/wiki/-Aardgasbaten

28
picked as low-hanging fruit. The Dutch natural gas didn't just come out of the ground
either. For that, there had to be a firm investment first. Similarly, achieving savings on
replacement costs will also require a substantial investment. An investment of 20% to
30% of the intended savings seems realistic38. For annual savings of € 3.3 billion, this
means an investment of € 0.7 to € 1.0 billion per year. That in itself is a large sum. But
this amount must be judged against the background of the value of the infrastructure
and the budgets involved in construction sector. We already mentioned the value of
the Dutch infrastructure above. A number of key figures for the construction sector are
given below.
Key figures for the construction sector
The turnover in the Dutch construction sector is approximately € 60 billion per year39.
This turnover is realized with approximately 300,000 employees40. For the coming
years a labour shortage of 30,000 employees is foreseen. That is 10% of the available
potential. Almost 20% of the workers come from abroad41. Failure costs in construction
sector amount to € 3 to € 6 billion per year42. That is 5% to 10% of the turnover in the
sector. The number of companies active in the construction sector is 169,00040.
Let us now look at these key figures against the background of the desire to save on
replacement costs by extending the service life of the infrastructure by 10%. We then
note a few things.
Extending the service life of the infrastructure by 10% will not only lead to a reduc-
tion in replacement costs, but also to a reduction in the number of employees
needed to carry out the replacement. Part of the anticipated shortage of workers
can be met in this way.
In addition to extending the service life, reducing failure costs is also an option for
realizing savings. Failure costs often have a non-technical cause. These include poor
communication, insufficient supervision during construction and inadequate exe-
cution. The increase in the number of employees who don’t speak Dutch increases
the communication problem and the probability of failures. The human factor plays
a key-role here.
38 K. van Breugel (2016) Societal burden and engineering challenges of ageing infrastructure. Proc. SCESCM
2016, Bali, 12 p. 39 Average: €60 billion/year. In 2018: €70 billion. https : //www. bouwdnederland.nl/service/feiten-en-waarden 40 Construction Fact sheet Labor Market. https://www.cdho.nl/assets/uploads/2018/02/UWV-Factsheet-Bouw-
april-017.pdf 41 C. Molijn (2019) One in five construction workers comes from abroad. NRC, 11.6.2019. 42 P. van Heel et al. (2019) Failure costs in construction amount to billions of euros annually.
https://insights.abnamro.nl/ 2019/04/faalkosten-in-de-bouw-lopen-jaarlijks-op-tot-miljarden-euros/

29
A large number of companies are often involved in the realization of construction
projects. In this respect the construction industry is clearly different from other in-
dustries. The turnover in the chemical industry is comparable in size to that in the
construction industry: € 50 billion in the chemical industry compared with € 60 bil-
lion in the construction industry. But in the chemical sector the turnover is realized
by 400 companies43, compared to 169,000 companies in the construction industry.
The involvement of many companies in the realization of construction projects im-
plies many ‘interfaces’, and a great deal of pressure on communication and project
management. On balance, this places a heavy burden on the quality and lifespan of
the infrastructure.
Direction required
This brief overview shows that when looking for possibilities to extend the lifetime of
the infrastructure and realize savings, both technical and non-technical aspects of the
construction process must be taken into account. This calls for interdisciplinary direc-
tion* of the construction process. In a moment we will discuss the question of how to
meet the need for interdisciplinary direction. First, we will look at two more engineer-
ing and technology-oriented options to extend the service life of infrastructure and
reduce its environmental impact. These two options are the use of self-healing con-
crete and circularity. After that, the subject direction will be discussed in detail.
Options for lifetime extension and reducing environmental impact
Self-healing concrete
With the passage of time materials can crack, embrittle or degrade due to material-
inherent ageing processes. It would be nice if a material would repair itself at the first
sign of degradation. This would be in the interest of the service life of structures and
would reduce the impact of construction on the environment.
The search for self-healing materials is a form of treasure hunting. It is a search for
materials that probably never existed, and perhaps never will exist, but the search for
which can nevertheless provide us with a smart material that comes close to is. Now,
in a sense, concrete can already be called a smart material44. After all, we saw earlier
43 Chemical industry –7-9-2019 https://nl.wikipedia.org/wiki/Chemische_industrie
*) The term ‘direction’ is used here as the translation of the Dutch term ‘regie’. This Dutch term regie includes
aspects of coordination, control, management, leadership and governance. 44 K. van Breugel (2018) Smart materials for social infrastructure: Past, Present and Future. Int. Workshop on
Structural Life Management for Eco-Power Structures. Deajeon, Korea. 12 p.

30
that concrete has a certain self-healing capacity by nature. If water manages to reach
non-hydrated cement through a crack, then that cement can still start to react and the
crack can repair itself (Fig. 9g). However, we also saw that for various reasons the self-
healing capacity of modern concrete mixtures is under pressure. In recent years, this
has prompted intensive research into ways of significantly improving the self-healing
capacity of concrete. The research of Jonkers et al.45 into self-repairing 'bio-concrete'
is challenging and promising in this respect. Jonkers added specially selected bacteria
to the concrete that have the ability to seal cracks. Fig. 18 shows the result of water
permeability tests with cracked traditional concrete and bio-concrete. Cracks in speci-
mens to which bacteria had been added were found to be completely sealed after only
a few days. This in contrast to cracks in specimens to which no bacteria were added.
Good results in various pilot projects have shown that self-healing of bio-concrete
works not only in the laboratory but also in practice, and can thus contribute to ex-
tending the lifespan of the infrastructure.
Fig. 18 Self-healing bioconcrete. Top: reference concrete without bacteria. Bottom: concrete with
bacteria. Left samples at the beginning of a water permeability test and right after the test. The bot-
tom-right picture shows complete healing of the crack45.
45 H.M. Jonkers , A. Thijssen , G. Muyzer , O. Copuroglu , E. Schlangen (2010) Application of bacteria as self-
healing agent for the development of sustainable concrete. Ecological Engineering 36(2). pp 230-235 .

31
Circularity
A different route to reduce the environmental impact of construction activities is that
of circular construction. Professor Ch.F. Hendriks, former head of the Materials Science
Section at the TU-Delft, already had the theme of circularity firmly in mind. His book
The Building Cycle from 2000 bears witness to this46. Since 2006 the Materials & Envi-
ronment Section has embraced the materials cycle and adopted it as the starting point
for teaching and research. Meanwhile, thinking in terms of circularity has taken a big
flight.
How circularity works in the construction sector is illustrated by the diagram in Fig. 19.
In this diagram we distinguish two concepts. The first concept is represented by the
dark blue outer circle of the figure. This circle relates to the materials cycle in tradi-
tional construction. Raw materials and energy are required to produce building mate-
rials. These materials are then used for the realization of construction elements and
Fig. 19 The building and materials cycle in view of circularity21,47.
46 Ch. F. Hendriks (2000) The Building Cycle . Aeneas Technical Publications, 233 p. 47 K. v an Breugel K. (2017) Circularity: A new avenue for mitigating the footprint of ageing infrastructure ? The
9th International Symposium on Cement and Concrete (ISCC 2017), Wuhan . 12 p.m.

32
complete structures. This is followed by the operation phase. In this phase mainte-
nance of structures takes place and repairs are carried out, possibly followed by up-
grading and retrofitting. At a certain point, keeping a structure in operation will cost so
much money and energy that the decision is made to demolish it. All the material re-
leased in the demolition process is then recycled and reused. That completes and
closes the circle.
The light blue inner circle of Fig. 19 represents the precast construction. Prefabricated
building elements are manufactured in the factory under strictly controlled conditions
and are of high quality. At the end of a structure’s lifetime, the prefabricated building
elements can be disassembled and reused to create new buildings.
Much is expected of this circular concept. The pressure on scarce raw materials de-
creases and construction-related CO2 emissions are reduced. Those are the benefits.
But these benefits are not just there for the taking. Without being exhaustive, the fol-
lowing points are mentioned here for careful consideration when working out and
evaluating a circular concept47.
A fully circular concept assumes the availability of donor buildings, which can
provide a sufficient quantity of suitable material to realize the desired new
building. However, it is virtually inconceivable that a single donor building can
provide all the materials needed for a comparable new building. A regional pol-
icy is needed to set up a database in which all buildings in a region are registered
that qualify for recycling, including data on material quantities, nature and qual-
ity of the materials, age, repair records, etc. (so-called 'urban mining').
The inclusion of different materials in the material cycle requires careful regis-
tration of the characteristics of these materials. Alternative materials, applied
to replace traditional ingredients of concrete mixtures, often with the aim of
‘greening’ the concrete, should be tested for their effect on the short- and long-
term behaviour of the concrete. Any negative effect on the long-term behaviour
will by definition only manifest itself after years. Harmful ‘pollution’ of the ma-
terials chain can thus continue unnoticed for years. To prevent the latter, it is
important to keep track of materials on their way through the construction and
materials cycle. An electronic materials and/or elements passport (Fig. 19) of-
fers the possibility of monitoring and/or separating material flows. A materials
passport can be seen as a logical sequel to the 'birth certificate' for concrete
structures advocated by Rostam48 in the 1990s.
48 S. Rostam (2005) Service life design of concrete structures – A challenge to designers as well as to owners.
Asian Journal of Civil Engineering (Building and Housing) Vol. 6, no. 5, pp. 423-445.
33
Circularity in construction presupposes the presence and availability of struc-
tures that are eligible for recycling. It was pointed out earlier that, globally, half
of the construction task in the coming years will be dominated by growth.
Where construction is dominated by growth, circular construction can hardly be
an option, simply because there are not enough structures available that can
serve as donor buildings47,49. In areas where the absence of donor buildings im-
plies that urban mining is not yet an option, new construction will still have to
rely on new raw materials. In order to limit construction-related CO2 emissions
and reduce the environmental impact, consideration will then have to be given
to the application of new (smart) materials, smart use of materials and extend-
ing the lifespan of structures.
Even a superficial assessment of these points of interest reveals the need of direction!
Direction is needed to set up a database of donor buildings and to register and monitor
materials and material flows, respectively. All the more reason to return to the previ-
ously identified need for direction in the construction industry.
Serious gaming for interdisciplinary direction in construction
The earlier discussion of the possibilities to extend the service life of infrastructure and
to save on replacement costs ended with the question of disciplinary direction of the
construction process (p. 29). A tool that could facilitate and support this inter-discipli-
nary direction and coordination is serious gaming. A serious game offers a platform
where bridges can be built between different disciplines, communication can be opti-
mized, the balance between different sustainability parameters can be made visible
and which can subsequently be acted upon.
The playing field of a serious game is schematically shown in Fig. 20. As a platform, a
serious game can host advanced simulation models. For example, within a serious
game the previously discussed Concrete Curing Control Systems can be active for opti-
mizing the execution process. Research on the use of simulation models in the manu-
facturing industry has revealed that companies that use simulation models actively
perform significantly better than companies that do not50. This not only illustrates the
usefulness of simulation models in the manufacturing industry, but also challenges the
development of a serious game for the construction industry in which the entire design
and construction process is simulated integrally.
49 K. van Breugel (2018) Modelling in the service of sustainable construction. RILEM Pro. 126 Proc. of the Work-
shop on Modelling and Concrete Materials Behaviour. Ed. Guang Ye, pp. 3-14 . 50 M. Boucher (2010) Cost saving strategies for engineering: Using simulation to make better decisions.
Aberdeen Group. 24 p.
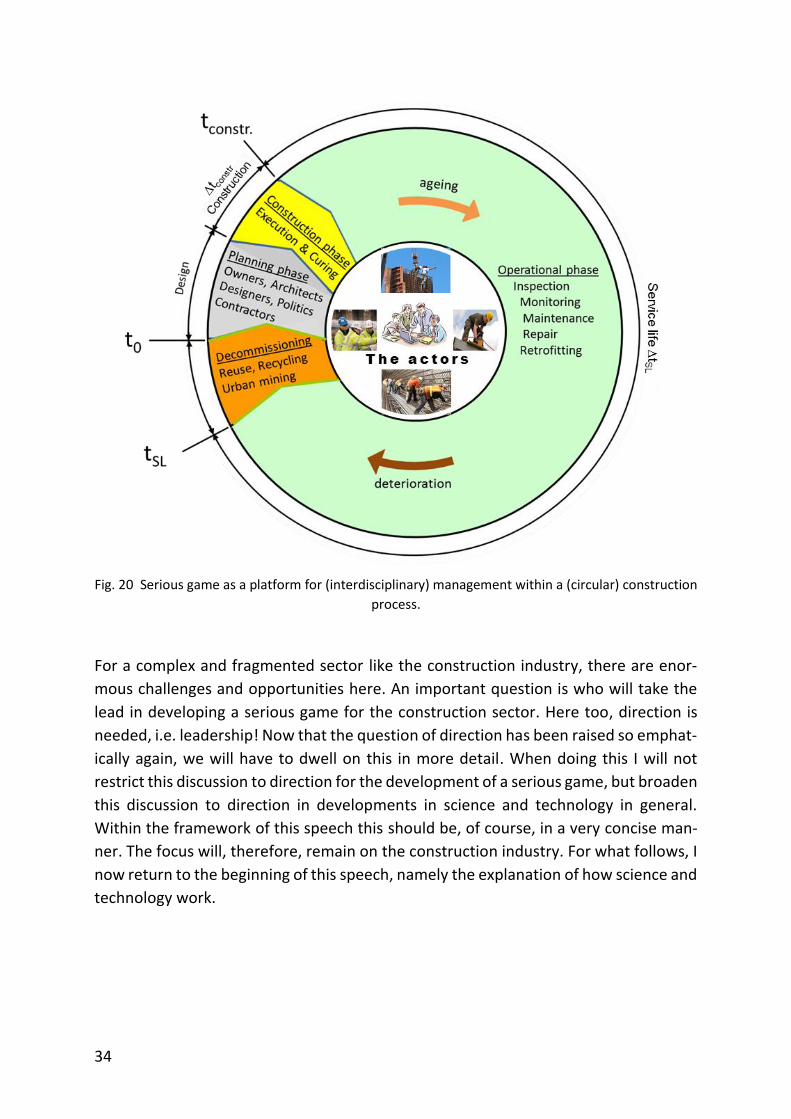
34
Fig. 20 Serious game as a platform for (interdisciplinary) management within a (circular) construction
process.
For a complex and fragmented sector like the construction industry, there are enor-
mous challenges and opportunities here. An important question is who will take the
lead in developing a serious game for the construction sector. Here too, direction is
needed, i.e. leadership! Now that the question of direction has been raised so emphat-
ically again, we will have to dwell on this in more detail. When doing this I will not
restrict this discussion to direction for the development of a serious game, but broaden
this discussion to direction in developments in science and technology in general.
Within the framework of this speech this should be, of course, in a very concise man-
ner. The focus will, therefore, remain on the construction industry. For what follows, I
now return to the beginning of this speech, namely the explanation of how science and
technology work.

35
On direction and leadership
What if there is no direction?
Great successes in science and technology are often due to far-reaching specialization.
Models play a key-role in this. Models are used to apply newly acquired insights and
knowledge to realize people's wishes and dreams. In industrialized countries, these
wishes and dreams have long since left the stage of 'providing shelter for people'. It is
now about consumption and growth. As long as consumption increases and the econ-
omy grows, all signs will be green. But if this growth has to be assessed in the light of
the Earth’s sustainability, the signs are red. Science and technology have enabled us to
consume the annual ration of raw materials and energy at an unprecedented rate*. In
2019, Earth Overshoot Day51 fell on July 29. On that day, the world's population had
used up its ration for 2019 and the cookie jar was empty for the rest of the year. Sche-
matically, this is shown in Fig. 21.
Fig. 21 Schematic representation of the rate at which the annual ration of raw material was con-
sumed in 2019. By July 29, 2019, the ration for that year was completely consumed.
Anyone who continued to consume or had something to hand out after the end of July
2019 could only do so if they had increased their share of the pie earlier that year at
the expense of others, or if they had advanced their share for next year. The former is
a form of injustice, and the latter is contrary to the sustainability principle as expressed
in the Brundtland report52 that underlies current sustainability thinking. In fact, for
years we have seen that mankind fails to balance consumption and growth on the one
hand with the possibilities that the earth - at the current state of science and technol-
ogy – offers us at the other. This also points to an imbalance between technical possi-
bilities and our ambitions on one hand, and responsible stewardship of the earth on
the other. Fig. 22 illustrates this unbalance. In Fig. 22a reality, reduced to a cube, is
*) Indicative for the increase in consumption of raw materials and energy is the growth curve in Fig. 4. 51 L. Mead (2019) 2019 Earth Overshoot Day Reaches Earliest Date Ever. SDG Knowledge Hub.
https://sdg.iisd. org/ news/2019-earth-overshoot-day-reaches-earliest-date-ever/ 52 Brundtland commission (1987) ‘Our Common Future’, Report World Commission on Environment and devel-
opment. Oxford University Press.
29 July 2019: Earth Overshoot Day

36
a. Decomposition and fragmentation b. Result of uncoordinated growth
Fig. 22 Schematic representation of growth of individual sectors without consideration of mutual co-
herence and harmony.
divided into twenty-seven sectors, all of equal weight. When especially sectors that
offer the prospect of great prosperity and pleasure are given the opportunity to grow,
a picture emerges as shown in Fig. 22b. Some sectors have grown enormously, while
others have remained the same. In no way these twenty-seven cubes can now be made
into something that has the contours of the original cube. Reality has been violated.
Disproportionate growth produces a monstrosity! This is not to say that growth should
always be avoided. But growth of individual sectors should be proportional, and aimed
at harmony and maturity. If after reaching the stage of maturity the growth does not
stop, a medically undesirable situation or a disease arises! To cure from such a disease
not only surgery is needed, but also and especially a change of behaviour. Without a
change in behaviour a harsh intervention will soon lose its effect. Nature teaches us
that.
Towards sustainable growth
If the purpose of construction is to provide "shelter for people", and if everyone is pro-
vided with shelter, then further growth will have to be preceded by the question of
what its purpose is. Engineering and technology will not provide an answer to this
question. Neither will science. In the words of Einstein, science and technology are
concerned with how things are, not how they ought to be. The question of how things
should be is beyond the scope of this speech. Here I limit myself to the comment that
sustainable growth requires a balance in growth of all sectors that together represent
Uncoordinated
growth
Fragmentation

37
a. Alfa’s, bèta’s and gamma’s ‘connected’ b. Balance as precondition for sustainable growth
Fig. 23 Sustainable growth: Balance between alpha, beta and gamma aspects.
reality. The three Ps, that are central to sustainability thinking, People–Planet–Profit,
presuppose mutual interaction, coordination and harmony. Harmonious growth as-
sumes that the growth of one sector is accompanied by a corresponding growth of
other sectors and of our ability to oversee the short- and long-term consequences of
implementing new techniques and technologies needed to achieve this growth. Sche-
matically, this is shown in Fig. 23. The composite cube in Fig. 23a is now divided into
alpha, beta and gamma sectors53. Horizontal and vertical connections between individ-
ual sectors should prevent unbridled growth of one sector from disrupting the balance
within the composite cube. Focusing on the construction sector, the question is how
alpha’s, beta’s and gamma’s can be brought to their full potential within the construc-
tion process, and how together they can ensure that the growth of the infrastructure
can take place in a responsible and sustainable manner. This will certainly not happen
automatically. Here too, there is a need for direction and an authority that can manage
this well and with authority.
The government as director
The reason for considering the theme 'direction' in detail was the question of who
should take the lead in developing a serious game for construction (p. 34). It is not
realistic to assume that one individual party in the construction industry will develop a
serious game for the entire sector. If sustainable development is the primary goal of
using a serious game here, then the direction for the development of a serious game
will also have to lie with the body that is responsible for this primary goal. The Dutch
53 In the Netherlands is discerned between alpha, beta and gamma sciences. Alpha refers to spiritual sciences,
beta to natural sciences and gamma to social sciences.
Source: https://www.arvindus.com/publications/201704162.html
Sustainable
growth

38
constitution shows us the way here. Article 21 of the Dutch constitution states this as
follows:
"The government’s concern is focused on the habitability of the country
and the protection and improvement of the living environment."
When it comes to the earth, and caring for the earth, the government is in charge. It is
fair to say here, that the Dutch government in particular is doing a great deal to make
and keep our country habitable. Guaranteeing that seventeen million people can live
and work safely in a delta area is a big challenge and requires a huge effort from the
government. In line with the Constitution, however, ensuring the habitability of the
country should also go hand in hand with protection and improvement of the environ-
ment. We see that this is increasingly becoming a problem, also in construction. The
previously mentioned quotes - however one-sided(!) - from Watts19 and Vidal20, but
also the discussions about particulate matter, nitrogen, pfas, etc., are illustrative in this
regard. We see ourselves faced with the consequences of unbalanced growth.
In 1987 the booklet Can we manage the earth was published by the Dutch economist
and Nobel Prize winner Jan Tinbergen54. The title of his booklet is already revealing.
Tinbergen does not speak of controlling, but managing. He is sharp when he says that
the gluttony of our generation can mean lack for future generations. He continues by
saying that creativity and frugality together will have to become our life's advice. For
responsible stewardship of the earth, Tinbergen advocated direction, c.q. manage-
ment and leadership, on a broad international level. Managing the earth requires
thinking big and then acting locally, i.e. nationally. Construction has the potential to
make a substantial contribution to the responsible stewardship of our planet. But with-
out direction, cashing in on this potential remains an illusion. The government must
make its appearance here. An advanced, multidisciplinary serious game can be an in-
strument that benefits the entire construction sector as well as Dutch society and the
environment.
Direction and leadership are crucial for the development of a serious game for the con-
struction sector. Not only because of the complexity of the construction sector, but
also in view of recruiting experts from all disciplines involved to design a serious game.
Direction is also indispensable for generating and managing the resources needed for
the development and implementation of a serious game for the construction industry.
It was indicated earlier that for realizing an annual saving on infrastructure of € 3.3
54 J. Tinbergen (1987) Can we manage the earth? (Dutch: Kunnen wij de aarde beheren?) Uitg. Kok/Agora. 172 p.

39
billion, an investment of about € 1 billion per year is needed. A substantial part of this
amount should be spent on developing a serious game for construction. Further break-
down and allocation of this budget is beyond the scope of this speech. What is im-
portant, however, is that the budget is distributed among all disciplines - alpha, beta,
gamma - that are involved in the initiation, realization and management of the infra-
structure.
The Model: Vehicle for Glory and Damage
The time has come to ask the question whether all of the foregoing has now given us
insight into the theme of this speech: 'The model: vehicle for glory and damage'. In
order to answer this question, we first briefly summarize the foregoing. We have seen
that science focuses on understanding reality, with the ultimate goal of being able to
control this reality. Then we saw that doing science is an activity characterized by a
continuous ‘reduction’ of reality. The path of reduction has been chosen because real-
ity is too complex to understand all its facets in their mutual coherence and to capture
all these facets in one all-encompassing model. Gradually, during the process of reduc-
tion, individual disciplines developed that focused on sub-areas of reality. The
knowledge acquired in these areas was then used to develop models to describe phe-
nomena within and interactions between sub-areas. The acquired knowledge is then
made operational in the manufacturing industry via models.
If we now look at the products that the manufacturing industry has produced, we see
impressive achievements. Much has been done, built and enjoyed. We also see that
science and technology, as well as models, have been and are used to achieve growth.
Economic growth and growth in prosperity. To make this growth possible, a reliable
infrastructure is essential. This infrastructure now accounts for about 50% of the
world's national capital. To refer to all this with the term glory is not out of place. But
for this glory and growth a high price is paid. Growth that continues after reaching
maturity is harmful growth. The generated damage can be very local, but can also man-
ifests itself as global environmental damage and climate change. The infrastructure
also suffers. Thus we see that science and engineering, and also models developed and
applied in science and engineering, are vehicles, that can lead to both glory and dam-
age. However, ..... they are and will remain vehicles! Nothing more than that. The driver
determines where the vehicle will take him! Neither science, nor technology, nor any
model will move society forward or sideways, if there is no driver setting the course
and operating the accelerator. It is not science and technology that leave their mark
on society, but it is people who leave the mark of science and technology on society.

40
Science and technology have no fixed domicile or residence, nor can they be sum-
moned when it comes to the question of who bears responsibility for the impact of
man's actions on his fellow man and the environment. It is always people who make
choices and set the course. People can choose to use science and technology for
growth. But they can also make a choice for sustainable growth. Sustainable growth is
growth that aims to develop and sustain a mature economy. For construction, this
means developing and realizing constructive concepts for ‘human shelter and use’, i.e.
an infrastructure necessary for a society to function safely and in harmony with its en-
vironment. For now and for the near future, defining what is really necessary - what
are really our 'needs' – should have top priority. New products or services that become
available today, possibly at the expense of other people or of the earth, should not
immediately be added to the list of 'needs', let alone that the access to these products
or services should immediately be given the status of a (human) right. Here too, neither
science, nor technology, nor scientific models will provide an answer to the question
of what our needs really are and what goes beyond them. It is people who make
choices here. In making those choices, models can, however, help us to assess whether
our choices will lead to glory or damage.
Education
I would like to briefly discuss one aspect of education. In the period 2005-2009 I had
the pleasure of serving as Program Director of the Faculty of Civil Engineering & Geo-
sciences. In that capacity I experienced the change culture in education up close. The
introduction of the BaMa-structure was just behind us, but the change virus was still
active. The reason for making changes was that - in my opinion - too often a stand still
was judged to be going backwards. Mathematically expressed: 0 = -1. A peculiar equa-
tion, which involuntarily reminds one of Escher's drawings in which water flows up-
wards instead of downwards. At first glance everything in his pictures seems to add up,
but on closer inspection nothing is right. Nevertheless, Escher became world famous
with it. In the same way, change agents almost always draw the longest straw. If a
proposed change works out well, then the official who proposed the change is soon
instructed to prepare the next change. If the change turns out to be wrong, then an-
other official is given the task of rectifying the failed change. In this way, the change
virus continues to run rampant.
I prefer to see education as a tree. For a tree, standstill = growth! Occasionally dead
wood has to be sawn away. But if see dead wood, you should not immediately pull the
entire tree out of the ground to see if the roots are still healthy. Then the tree will die!

41
Fig. 25 The tree as metaphor for development of education: Standstill = Growth!
If there is dead wood, then cut it down where necessary. Encourage where possible,
correct where necessary and have a bad-news interview if unavoidable, but don't
bother everyone with generic measures that cost a lot of money and cause a lot of
frustration, but which most likely leave the dead wood untouched.
Word of thanks
It has been more privilege than merit that I have been able to spend my entire active
career at TU Delft. I have enjoyed the freedom you have in this institution as a scientist,
lecturer and manager, and I am deeply indebted to this university. Thanks for the great
contacts with colleagues of the section, department, faculty and university. In particu-
lar, I would like to mention the cooperation with the Department of Education & Re-
search in the period 2005-2009, during which I was allowed to serve as Program Direc-
tor of the faculty. The contacts with colleagues from other departments and faculties
are among my best memories. Special thanks also go to colleagues with whom I was
able to contribute to the realization and implementation of the IOP program 'Self-Re-
pairing Materials' under the expert guidance of prof. Sybrand van der Zwaag. Thanks
are also due to the colleagues with whom the initial impetus was given for the for-
mation of an Expert Centre on the ageing of materials and structures.
Without exception the contacts with the industry, the Dutch Concrete Association,
CUR, CROW, NEN, KIVI, Rijkswaterstaat, the Concrete Repair Board of Experts, STW,
M2i, Stufib and Stutech were extremely valuable.
During the international farewell symposium in Delft in 2018, I already had the oppor-
tunity to reflect on the value of international contacts55. The collaboration with col-
55 G. Ye (Ed.) (2018) RILEM Workshop on Concrete Modelling and Materials Behaviour. RILEM PRO 126. Delft.

42
leagues from foreign universities in European research projects has brought me a lot
academically and socially, as well as lasting friendships. There were numerous contacts
with colleagues from universities outside Europe, i.c. Canada, USA, China, Vietnam,
South Korea, Indonesia, Russia, Israel, India, Japan, South Africa and Brazil, to mention
just a few. All these contacts with colleagues from universities, research institutes and
international organizations such as fib, IABSE, IALCCE and RILEM are oxygen for a sci-
entist. You can't do without it. Thank you all for that.
At the end of my inaugural lecture56 in 2000 I had ample opportunity to thank col-
leagues in the Concrete Structures Section for their collegiality and cooperation, not
least with the intention of continuing this fruitful cooperation. Of my professorship I
eventually spent only the initial period with that section. Even though it was much
shorter than planned, many thanks for the cooperation in that period and for its con-
tinuation in lectures and in the jointly conducted postgraduate courses on temperature
and shrinkage effects in concrete structures.
I owe a lot to colleagues with whom I had the pleasure to work from 2003 onwards on
the continuation and further design of the Microlab and the Materials & Environment
section. In doing so, I could count on the critical but benevolent support of the Dean,
prof. Louis de Quelerij, and the Department Chair, prof. Frans Bijlaard. Their support
was indispensable. Thank you for that! It was a challenge to position the section to-
gether with the scientific staff, the technicians, secretaries, students, student assis-
tants and researchers. Without their efforts it would have been impossible to get
where we are today. Many thanks for that.
I look back with great satisfaction at the international conferences, workshops and
courses which were initiated and organized by the section over the past years. Some
of these international events were organized in collaboration with colleagues from
Ghent University, Southeast University*) (Nanjing/Cn), Lehigh University (Bethlehem/
USA) and Tongji University (Shanghai/Cn). It was great to work on these co-produc-
tions. Thanks for that! I would like to thank Iris Batterham for her part in the design
and organization of these events. Without her efforts, not much would have happened.
The growth of the Section and the organization of events required a lot of secretarial
support. Iris Batterham, Marijke van der Veen, Claudia Baltussen, Melanie Holtzapfel,
Ingrid van Wingerden, Nynke Verhulst, Claire de Bruin and Jacqueline van Unen-Ber-
56 K. van Breugel (2000) From Vitruvius towards Virtual Lab (in Dutch). Inaugural speech TU Delft. 50 p.
*) The cooperation with Southeast University was expanded with the support of prof. Changwen Miao’s Sobute
New Materials Company, for which our gratitude.

43
genhenegouwen were never called upon in vain. Thank you for your dedication and
the pleasant manner in which you did your work.
Special mention should be made of Nynke Verhulst's support around my unexpected
stay in Daejeon hospital in Korea in October 2015. She took care of the communication
between me and the home front, maintained the contacts with the insurance com-
pany, arranged the repatriation and acted as non-medical escort on the return flight. I
will never forget her care and dedication. Thank you!
During my unplanned stay in Korea in 2015, and in the months that followed, col-
leagues in the Section showed that without me, the work could continue as usual. I did
not have any worries about that either. Erik Schlangen, Ye Guang, Ton van Beek and
René Braam, thank you for the extra efforts you made to take over the lectures. You
inadvertently showed then that I could work towards leaving the university without
worrying about the future of the Section.
This farewell speech was preceded by a special farewell symposium. I would like to
thank the organizers of this event, and in particular dr. Carola Edvardsen from COWI
Consult and prof. David Lange from the University of Illinois for their inspiring lectures.
A farewell address is the moment to reflect on all that I have been allowed to do over
the past four decades, the health I have enjoyed all those years and the people with
whom I have worked more or less intensively. Nothing about all that has been was
taken for granted. You don’t ask me, at least not today, but now is also the time for me
to give an account. To account for published articles and books, for lectures and com-
mittee work, for conferences and courses, for performance and appraisal interviews,
for policy decisions and management style, in short for everything I have done. All in
all, it's quite a lot. No, not everything was perfect, but it does represent something. I’m
not claiming that I can make life, or even that I know everything about concrete. But I
would still like to know if it was, broadly speaking, up to par. I update my resume and
submit it all to God. He takes it in hand. He looks. He browses. He weighs. I wait and
see. Maybe then He'll say, "Nice. Yes, that's a good way to go". Then He shoves my
resume aside and continues: "You could have left your CV at home. I already knew it.
But I have something better for you. And the best is yet to come!" I would like to echo
Laplace when he says that he does not need God as a hypothesis. Indeed, not as a
hypothesis, but as a Father.
I did say.