Embed Size (px)
Citation preview
Please, cite this paper as: Wang, Y., Susmel, L. The Modified Manson‐Coffin Curve Method to estimate fatigue lifetime under complex constant and variable amplitude multiaxial fatigue loading. International Journal of Fatigue 83 (2), pp. 135‐149, 2016.
The Modified Manson-Coffin Curve Method to estimate fatigue lifetime under complex constant and variable amplitude multiaxial fatigue loading
Yingyu Wang1, 2 and Luca Susmel2 1Key Laboratory of Fundamental Science for National Defense-Advanced Design Technology of Flight Vehicle, Nanjing
University of Aeronautics and Astronautics, Nanjing, 210016, China
2Department of Civil and Structural Engineering, the University of Sheffield, Sheffield S1 3JD, UK
Corresponding Author: Prof. Luca Susmel Department of Civil and Structural Engineering The University of Sheffield, Mappin Street, Sheffield, S1 3JD, UK Telephone: +44 (0) 114 222 5073 Fax: +44 (0) 114 222 5700 e-mail: [email protected]
ABSTRACT
This paper investigates the accuracy of the so-called Modified Manson-Coffin Curve Method
(MMCCM) in estimating fatigue lifetime of metallic materials subjected to complex constant and
variable amplitude multiaxial load histories. The MMCCM postulates that fatigue damage is
maximised on that material plane experiencing the maximum shear strain amplitude. In the
present investigation, the orientation of the critical plane was determined through that direction
along which the variance of the resolved shear strain reaches it maximum value. Under variable
amplitude complex load histories, this direction was also used to count the resolved shear strain
cycles via the classic Rain-Flow method. Further, the degree of multiaxiality and non-
proportionality of the time-variable stress states at the assumed critical locations was directly
quantified through a suitable stress ratio which accounts for (i) the mean value and the variance of
the stress perpendicular to the critical plane as well as for (ii) the variance of the shear stress
resolved along the direction experiencing the maximum variance of the resolved shear strain. The
accuracy and reliability of the proposed approach was checked against approximately 650
experimental data taken from the literature and generated by testing un-notched metallic materials
under complex constant and variable amplitude multiaxial load histories. The sound agreement
between estimates and experimental results which was obtained strongly supports the idea that the
proposed design technique is a powerful engineering tool allowing metallic materials to be
designed against constant and variable amplitude multiaxial fatigue by always reaching a
remarkable level of accuracy. This approach offers a complete solution to the strain based
multiaxial fatigue problem.
Keywords: Multiaxial fatigue, Variable amplitude loading, Critical plane

Please, cite this paper as: Wang, Y., Susmel, L. The Modified Manson‐Coffin Curve Method to estimate fatigue lifetime under complex constant and variable amplitude multiaxial fatigue loading. International Journal of Fatigue 83 (2), pp. 135‐149, 2016.
1. Introduction
In situations of practical interest, engineering components and structures are subjected to complex
time-variable load histories, the applied time-dependent systems of forces/moments resulting in
local variable amplitude (VA) multiaxial stress/strain states. Estimating fatigue strength of metallic
materials subjected to VA multiaxial load histories is a complex design problem which must be
addressed properly in order to avoid unwanted breakages during in-service operations. Owing to
the high costs associated with fatigue failures, since the beginning of the last century a tremendous
effort has been made by the international scientific community to devise appropriate engineering
tools suitable for estimating fatigue damage under complex loading paths. If attention is focused on
the low/medium-cycle fatigue regime, examination of the state of the art [1-7] suggests that, so far,
this intractable design problem has being addressed mainly by trying to extend the use of well-
known constant amplitude (CA) multiaxial fatigue criteria to those situations involving multiaxial
VA load histories. In this context, among the methods which have been employed so far, certainly
the SWT parameter [8, 9], Brown & Miller’s criterion [10, 11], and Fatemi & Socie’s critical plane
approach [12, 13] deserve to be mentioned explicitly.
As far as VA multiaxial load histories are concerned, accurately performing the cycle counting
certainly represents one of the trickiest aspects, the scientific community being still debating to
agree a commonly accepted strategy. As to the cycle counting issue, examination of the state of the
art suggests that the most successful methodologies [11, 13-15] which have been formalised and
validated so far are all based on the use of the classic Rain-Flow Method (this method being
originally developed to address simple uniaxial situations [16]).
When it comes to designing components and structures against VA multiaxial fatigue, another
tricky problem that must be addressed properly is the definition of an appropriate rule suitable for
estimating cumulative damage. Even though a variety of methods have been proposed so far [17],
certainly, in situations of practical interest, the most used rule is still the linear one devised by
Palmgren [18] and Miner [19]. According to this classic approach, fatigue failure takes place as
soon as the damage sum becomes equal to unity. However, accurate experimental investigations
have proven that the critical value of the damage sum, Dcr, vary in the range 0.02–5, its average
value being equal to 0.27 for steel and to 0.37 for aluminium [20]. Further, given the material, Dcr
is seen to vary as the geometry of the component, the degree of multiaxiality of the assessed VA
load history, and the profile of the considered load spectrum change [20-22]. Thus, systematically
taking the critical value of the damage sum equal to unity may lead, under particularly
unfavourable circumstances, to non-conservative estimates. This suggests that Dcr can be evaluated
accurately for the specific material/component/load history being assessed solely via expensive
and time-consuming experimental trials.
In this complex scenario, this paper reports on an attempt of extending the use of a multiaxial
fatigue criterion we have recently proposed [23-25] - here called the Modified Manson-Coffin

Please, cite this paper as: Wang, Y., Susmel, L. The Modified Manson‐Coffin Curve Method to estimate fatigue lifetime under complex constant and variable amplitude multiaxial fatigue loading. International Journal of Fatigue 83 (2), pp. 135‐149, 2016.
Curve Method (MMCCM) - to those situations involving complex CA and VA loading paths. In
more detail, such a strain based critical plane approach is attempted here to be applied along with
the Maximum Variance concept [26-28] in order to formalise a robust fatigue assessment
technique suitable for estimating fatigue lifetime of metallic materials subjected to complex CA and
VA multiaxial load histories.
2. Fundamentals of the MMCCM
As far as CA loading paths are concerned, the MMCCM [23-25] postulates that fatigue damage in
the low/medium-cycle fatigue regime can accurately be estimated via the stress and strain
components acting on that material plane (i.e., the so-called critical plane) experiencing the
maximum shear strain amplitude, a. The degree of multiaxiality and non-proportionality of the
applied load history as well as the presence of non-zero mean stresses are quantified by the
MMCCM via the shear stress amplitude, a, relative to the plane of maximum shear strain
amplitude and the amplitude, n,a, and the mean value, n,m, of the stress normal to the critical
plane. The definitions which are proposed here as being adopted to calculate the stress/strain
quantities of interest not only under CA, but also under VA multiaxial fatigue loading will be
discussed in the next section in great detail.
The fatigue damage model on which the MMCCM is based is shown in Figure 1a. According to this
schematisation, Stage I cracks are assumed to initiate on those crystallographic planes most closely
aligned with the maximum shear strain direction [29]. The subsequent propagation phenomenon
is strongly influenced by the stress perpendicular to the critical plane [9, 30]. In particular, the
amplitude of the stress normal to the critical plane, n,a, favours the growth process by cyclically
opening and closing the micro/meso fatigue cracks [31]. The propagation phase is also influenced
by the mean stress, n,m, normal to the plane of maximum shear strain amplitude. In fact, a tensile
superimposed static normal stress tends to keep the micro/meso fatigue cracks open by minimising
the interactions amongst the crack surfaces’ asperities [9, 30]. This favours the effect of the cyclic
shear stress which pushes the tips of the cracks themselves [32]. On the contrary, under
compressive mean normal stresses, the resulting additional frictional phenomena between the
crack surfaces [9, 30] mitigate the action of the cyclic shear stress [32], this resulting in a reduction
of the crack growth rate.
According to the fatigue damage model depicted in Figure 1a, the degree of multiaxiality and non-
proportionality of the stress state damaging the assumed crack initiation locations is quantified by
the MMCCM via the following critical plane stress ratio [23]:
a
max,n
a
a,nm,n
(1)
Please, cite this paper as: Wang, Y., Susmel, L. The Modified Manson‐Coffin Curve Method to estimate fatigue lifetime under complex constant and variable amplitude multiaxial fatigue loading. International Journal of Fatigue 83 (2), pp. 135‐149, 2016.
In definition (1) a is the shear stress amplitude relative to the critical plane, whilst n,m, n,a and
n,max are the mean value, the amplitude and the maximum value of the stress perpendicular to the
plane of maximum shear strain amplitude, respectively. Ratio is seen to be capable of modelling
not only the presence of superimposed static stresses, but also the degree of multiaxiality and non-
proportionality of the applied load history [23, 31]. In particular, as suggested by Socie [9, 30], the
effect of the stress components perpendicular to the critical plane can efficiently be modelled by
simply using the maximum normal stress, since n,max=n,m+n,a. This simple strategy was followed
by Socie himself to reformulate the SWT parameter to make it suitable for performing the
multiaxial fatigue assessment of those metals whose mesoscopic cracking behaviour is mainly
Mode I governed [9]. Similarly, the normal maximum stress, n,max, was employed by Fatemi and
Socie to devise their shear strain based critical plane approach [12]. The well-known accuracy and
reliability of these two criteria should fully support the idea that n,max is a stress quantity capable
of accurately taking into account the mean stress effect in multiaxial fatigue. This holds true
provided that n,max is consistently used with an appropriate fatigue damage model, the damage
model on which the MMCCM is based being shown in Figure 1a.
Turning back to definition (1), it is evident that under VA fatigue loading the value of ratio may
vary cycle by cycle. Accordingly, appropriate definitions for the stress quantities of interest are
required in order to consistently calculate the ratio also in the presence of complex VA multiaxial
load history. The strategy we propose to address the VA problem will be discussed in Section 3 in
detail.
Under fatigue loading, there are always at least two planes experiencing the maximum shear strain
amplitude, this holding true independently from the complexity of the assessed load history.
Therefore, amongst all the potential critical planes, the one which must be considered to estimate
fatigue lifetime is the one characterised by the largest value of ratio ρ [31].
To quantify the fatigue damage extent, the MMCCM makes use of non-conventional Manson-
Coffin curves, where the values of the required calibration constants vary as the critical plane stress
ratio, , changes [5]. The way this method works can be depicted in a log-log diagram where the
shear strain amplitude, a, relative to the critical plane is plotted against the number of reversals to
failure, 2Nf (Fig. 1b). As shown in Figure 1b, different modified Manson-Coffin curves are obtained
as ratio varies, each of these curves being described mathematically as follows:
cff
bf
fa N2)('N2
G
)(' (2)

Please, cite this paper as: Wang, Y., Susmel, L. The Modified Manson‐Coffin Curve Method to estimate fatigue lifetime under complex constant and variable amplitude multiaxial fatigue loading. International Journal of Fatigue 83 (2), pp. 135‐149, 2016.
Given the material, constants ’f(), ’f(), b() and c() can directly be derived from the fully-
reversed uniaxial and torsional Manson-Coffin fatigue curves re-written according to Tresca’s
hypotheses, i.e. [31]:
cffpb
ff
ea N2'1N2E
'1
(Uniaxial case, =1) (3)
00 cff
bf
fa N2'N2
G
'
(Torsional case, =0) (4)
where e and p are Poisson’s ratio for elastic and plastic strain, respectively. By manipulating Eqs
(3) and (4) under some simplifying hypotheses [23], the material constants in Eq. (1) can be
expressed explicitly as follows [23, 31]:
G
'1
E
'1
G
)(' ffe
f
(5)
ffpf '1'1' (6)
b)bb(
bbb
0
0
(7)
c)cc(
ccc
0
0
(8)
To conclude, it is worth observing that, according to the above definitions, the modified Manson-
Coffin curves move upwards as ratio decreases (see Figure 1b). In other words, the MMCCM
estimates fatigue lifetime by assuming that, for a given value of the shear strain amplitude acting
on the critical plane, the fatigue damage extent increases with increasing of ratio : this explains
why when selecting the critical plane amongst those experiencing the maximum shear strain
amplitude, the one to be used is that characterised by the largest value of ratio .
3. The Maximum Variance concept to determine the stress/strain quantities relative
to the critical plane
In order to apply the MMCCM to estimate fatigue lifetime of metallic materials subjected to
uniaxial/multiaxial fatigue loading, the first problem to be addressed is the determination of those
stress/strain quantities relative to the critical plane which are required to quantify the fatigue
damage extent. As discussed in what follows, in the present investigation such quantities are
suggested as being estimated by taking full advantage of the maximum variance concept [26].

Please, cite this paper as: Wang, Y., Susmel, L. The Modified Manson‐Coffin Curve Method to estimate fatigue lifetime under complex constant and variable amplitude multiaxial fatigue loading. International Journal of Fatigue 83 (2), pp. 135‐149, 2016.
From a statistical point of view, the variance of a time-variable signal is equal to the expected value
of the squared deviation from the mean. In other words, by definition, the variance quantifies the
amount of variation (within the two extremes delimiting the maximum range) associated, over the
time interval, T, of interest, with the signal being investigated. According to this definition, the
variance is a statistical quantity which is independent from the mean value of the considered
signal. If attention is focussed specifically on time-variable load histories, the variance of a
stress/strain signal is seen be related to the amount of damage caused by the signal itself [33, 34].
The variance approach assumes that the damage in the candidate plane can be estimated from a
root mean square calculation. It is well-known that the dependence between shear amplitudes and
damage may involve exponents having value different from two. Accordingly, under very specific
circumstances, more accurate estimates may be obtained by adopting higher central moments of
the resolved shear strain history, instead of the second central moment. However, much
experimental evidence (please, see Refs [26, 33, 34] and references reported therein) suggests that,
in situation of practical interest, the use of the variance concept allows VA load histories to be post-
processed by always reaching an adequate level of accuracy. Recently, this idea [27, 28] has
successfully been applied along with the stress based critical plane concept to estimate fatigue
lifetime under uniaxial/multiaxial VA multiaxial fatigue loading [35-40]. In light of the high level
of accuracy obtained in the long-life fatigue regime, the next logical step is then reformulating the
maximum variance idea to make it suitable for being applied in terms of cyclic strains. The
fundamental concepts on which the Shear Strain Maximum Variance Method (-MVM) is based are
summarised in what follows, whereas its mathematical formalisation is discussed in detail in
Appendix A.
The -MVM takes as a starting point the assumption that the critical plane is that material plane
containing the direction, MV, that experiences the maximum variance of the resolved shear strain,
MV(t) – see Figures 2a and 2b. If this direction as well as the orientation of the associated material
plane are known, direction MV together with the unit vector normal to the critical plane can
directly be used to calculate the stress/strain quantities of interest. In more detail, under CA fatigue
loading, the amplitudes and the mean values of the shear strain and shear stress component
relative to the critical plane can directly be calculated as follows (see also Figure 2c):
min,MVmax,MVa 2
1 (9)
min,MVmax,MVm 2
1 (10)
min,MVmax,MVa 2
1 (11)
Please, cite this paper as: Wang, Y., Susmel, L. The Modified Manson‐Coffin Curve Method to estimate fatigue lifetime under complex constant and variable amplitude multiaxial fatigue loading. International Journal of Fatigue 83 (2), pp. 135‐149, 2016.
min,MVmax,MVm 2
1 (12)
In definitions (9) and (10) MV,max and MV,min are the maximum and minimum value of MV(t),
respectively. Similarly, in definitions (11) and (12) MV,max and MV,min denote the maximum and
minimum value of the shear stress, MV(t), resolved along direction MV, respectively (Fig. 2c).
By following the same strategy as above, under CA fatigue loading the amplitude, n,a, and the
mean value, n,m, of the stress normal to the critical plane, n(t), can be calculated as follows:
min,nmax,na,n 2
1 (13)
min,nmax,nm,n 2
1 , (14)
where n,max and n,min are used to denote the maximum and minimum value of normal stress n(t),
respectively (Fig. 2c).
Turning to VA situations, assume now that the critical point O in the component being assessed
(Fig. 2a) is damaged by a stress/strain state whose components vary randomly in the time interval
of interest, i.e., time interval [0, T]. As soon as the orientation of the direction, MV, experiencing
the maximum variance of the resolved shear strain is known (Fig. 2b), the mean value and the
variance of the shear strain and shear stress component relative to the critical plane can directly be
determined as follows (see also Figure 2d):
T
0MVm dt)t(
T
1 (15)
T
0
2mMVMV dt)t(
T
1)t(Var (16)
T
0
MVm dt)t(T
1 (17)
T
0
2mMVMV dt)t(
T
1)t(Var (18)
The variance terms determined as above allow the equivalent amplitude of the shear stress and
shear strain resolved along direction MV to be determined according to the following trivial
relationships:

Please, cite this paper as: Wang, Y., Susmel, L. The Modified Manson‐Coffin Curve Method to estimate fatigue lifetime under complex constant and variable amplitude multiaxial fatigue loading. International Journal of Fatigue 83 (2), pp. 135‐149, 2016.
)t(Var2 MVa (19)
)t(Var2 MVa (20)
In a similar way, the equivalent amplitude and the mean value of the stress perpendicular to the
critical plane, n(t), can be determined as follows:
)t(Var2 na,n (21)
T
0nm,n dt)t(
T
1 (22)
where:
T
0
2m,nnn dt)t(
T
1)t(Var (23)
To conclude, it is worth observing that the -MVM has two key advantages over the other existing
methods. First, it is very efficient from a computational point of view. In fact, as soon as the
variance and covariance terms of the components of the strain tensor being post-processed are
known, the time required to determine the orientation of the critical plane is almost independent
from the length of the assessed load history. Second, since MV(t) and MV(t) are monodimensional
quantities, the cycle counting under multiaxial fatigue loading can be performed rigorously by
using one of those techniques specifically devised by considering uniaxial fatigue situations (and, in
particular, via the Rain-Flow counting method [16]).
4. The MMCCM to estimate fatigue lifetime under CA and VA multiaxial fatigue
loading
The last step in the formalisation of the proposed design technique is the definition of standard
procedures suitable for using this approach in situations of practical interest to estimate lifetime of
metallic materials subjected to in-service CA and VA load histories.
Consider then the component sketched in Figure 3a which is assumed to be subjected to a CA load
history. As soon as the direction experiencing the maximum variance of the resolved shear strain is
known (Fig. 3b), the amplitude of the shear strain relative to the critical plane, a, can easily be
determined according to definition (9) – see Figure 3c. Similarly, the shear stress amplitude, a,
and the maximum normal stress, n,max, relative to the critical plane (Figs 3d and 3e) can directly be
calculated through Eqs (11), (13) and (14). These stress quantities allow the critical plane stress

Please, cite this paper as: Wang, Y., Susmel, L. The Modified Manson‐Coffin Curve Method to estimate fatigue lifetime under complex constant and variable amplitude multiaxial fatigue loading. International Journal of Fatigue 83 (2), pp. 135‐149, 2016.
ratio, Eq. (1), characterising the load history being assessed to be determined unambiguously (Fig.
3f). Through the calculated value for , the constants in the MMCCM can now be estimated (Fig.
3g) from the fully-reversed uniaxial and torsional fatigue properties via relationships (5) to (8).
These constants can then be used to derive, for the calculated value of , the required Modified
Manson-Coffin curve (Fig. 3h). Finally, the shear strain amplitude relative to the critical plane, a,
together with Eq. (2) allows the number of cycles to failure to be estimated directly (Fig. 3h).
Turning to VA multiaxial fatigue situations, the first problem which has to be addressed is the
formalisation of a strategy allowing the cycle counting to be performed so that the fatigue damage
extent can be quantified accurately. As briefly discussed in Section 2, the MMCCM assumes that
the critical plane is the one containing the direction experiencing the maximum variance of the
resolved shear strain (Fig. 1a). According to Kanazawa, Miller and Brown [29], Stage I cracks form
on those slip planes most closely aligned to the macroscopic planes of maximum shear.
Accordingly, the hypothesis can be formed that, under VA fatigue loading, the resolved shear
strain, MV(t), is the strain quantity to be used to perform the cycle counting. Therefore, owing to
the fact that MV(t) is a monodimensional strain quantity, given a load history, the corresponding
cumulative shear strain spectrum can directly be determined by using the Rain-Flow method [16].
Having formed this initial hypothesis, consider now the component of Figure 4a which is assumed
to be subjected to a complex system of time variable forces and moments which result in a local VA
state of stress/strain at critical point O. As soon as the direction of maximum variance is known
(Fig. 4b), the equivalent amplitude of the shear stress relative to the critical plane, a, can be
determined according to definition (20), whereas the equivalent value of the maximum stress
perpendicular to the critical plane can directly be estimated via definitions (21) and (22), where
n,max=n,m+n,a (see Figures 4d and 4e). Stress quantities a and n,max allow then the critical plane
stress ratio, , to be determined under VA fatigue loading via definition (1) – see Figure 4f. This
ratio can now be used to estimate the constants in the MMCCM according to definitions (5) to (8) –
see Figures 4g and 4h. In parallel, by taking full advantage of the Rain-Flow Method (Fig. 4i),
signal MV(t) has to be post-processed in order to build the corresponding shear strain spectrum
(Fig. 4j). This spectrum along with the estimated modified Manson-Coffin curve, Eq. (2), allow the
damage content associated with any counted shear strain cycles to be quantified (see Figures 4h
and 4k). Finally, the number of cycles to failure can directly be estimated as follows:
j
1i i,f
itot N
nD
j
1ii
tot
cre,f n
D
DN . (24)
where Dtot is the total value of the damage sum. Dcr is instead the critical value of the damage sum,
i.e., the value of Dtot resulting in the initiation of a fatigue crack in the metallic material being

Please, cite this paper as: Wang, Y., Susmel, L. The Modified Manson‐Coffin Curve Method to estimate fatigue lifetime under complex constant and variable amplitude multiaxial fatigue loading. International Journal of Fatigue 83 (2), pp. 135‐149, 2016.
assessed. It is worth observing here that according to the classic theory due to Palmgren [18] and
Miner [19], Dcr should be invariably equal to unity. On the contrary, as observed by Sonsino [5], in
situations of practical interest its value is seen to range in the interval 0.02-5.
Under VA multiaxial fatigue loading, ratio is determined by post-processing the entire local load
history projected along the direction of maximum variance of the resolved shear strain as well as
along the direction perpendicular to the critical plane. The value for ratio calculated according to
this strategy is then used to estimate the specific modified Manson-Coffin curve that has to be used
to quantify the damage content associated with the counted cycles. This means that, given the
material, different VA multiaxial load histories are assessed by using the same modified Manson-
Coffin curve as long as they are characterised by the same value of ratio . However, even if is the
same, in the most general case, different VA load histories are expected to result in different values
of the estimated number of cycles to failure, this depending on the specific profile of the
corresponding shear strain spectrum (Fig. 4j). Another important aspect is that the shear strain
spectrum is built by post processing the actual strain history resolved along the direction
experiencing the maximum variance of the resolved shear strain. This allows the sequence effect to
be taken into account effectively. The above ideas represent the key concepts on which the
proposed approach is based, the validity of this modus operandi being checked in the next section
by post-processing a large number of experimental results taken from the literature.
To conclude, it is worth emphasising the fact that both under CA and VA fatigue loading the
MMCCM must be applied by post-processing the actual elasto-plastic time-variable stresses and
strains damaging the assumed critical location. This implies that appropriate techniques must be
employed in order to perform the stress/strain analysis by accurately quantifying/modelling
important phenomena such as strain hardening/softening, non-proportional hardening,
ratcheting, memory effect, mean stress relaxation, etc.
5. Validation by experimental data
In order to check the accuracy and reliability of the proposed design methodology, about 650
experimental results were selected from the technical literature. Table 1 summarises the static and
fatigue properties of the investigated metallic materials. For the majority of the considered data
sets, the required material properties were directly available in the original sources. In some cases,
even though the required fatigue constants were not listed explicitly, K’, n’, ’f, ’f, b, c, ’f, ’f, b0,
and c0 were directly calculated by post-processing the fully-reversed uniaxial and torsional
experimental results being provided. In particular, given the population of data, the required
parameters were determined, for a probability of survival equal to 50%, via a linear regression
model (in a log-log representation) optimised by using the least-squares method [58]. The material
parameters quantified according to this procedure are clearly indicated in Table 1. When solely the
constants of the fully-reversed torsional Manson-Coffin curves were not available, they were

Please, cite this paper as: Wang, Y., Susmel, L. The Modified Manson‐Coffin Curve Method to estimate fatigue lifetime under complex constant and variable amplitude multiaxial fatigue loading. International Journal of Fatigue 83 (2), pp. 135‐149, 2016.
estimated from the corresponding uniaxial fatigue constants by using von Mises’ criterion [7, 31],
i.e.:
3
'' ff
; ff '3' ; bb0 ; cc0 (25)
All the considered data were generated by controlling the local deformations during testing, so that
in the majority of the sources the corresponding stress histories were not given. In order to
calculate the stress components relative to the critical plane when the relevant time-variable stress
histories were not directly available, the required elasto-plastic stress states were estimated by
using Jiang and Sehitoglu’s method [59, 60]. Finally, in those cases in which the values of the non-
proportional cyclic strength coefficient, K’NP, and the non-proportional cyclic strain hardening
exponent, n’NP, were not determined experimentally, non-proportional hardening was modelled by
taking the constants in the corresponding Ramberg-Osgood type equation as follows [7]:
NPNP K25.1'K ; 'n'n NP (26)
Since a number of assumptions were made to make the selected experimental data suitable for
performing a systematic validation exercise, the first problem to address was the definition of a
reference error band allowing the accuracy of the proposed fatigue design approach to be assessed
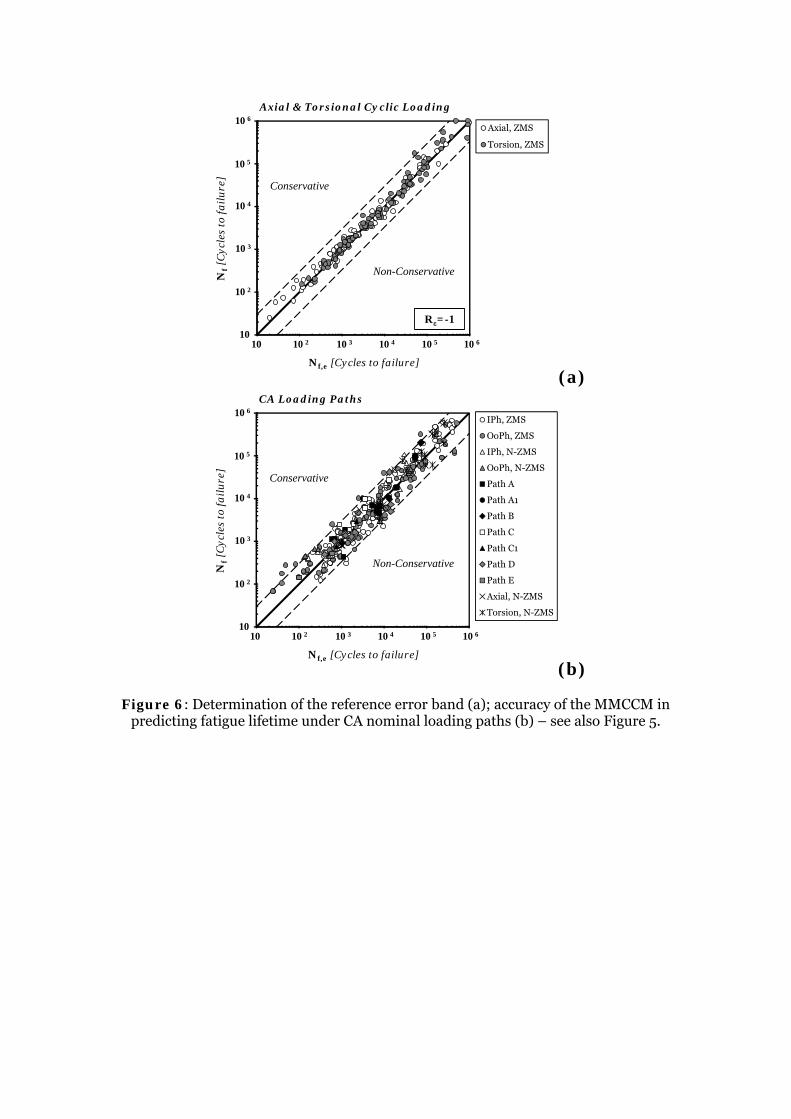
quantitatively. The estimated, Nf,e, vs. experimental, Nf, number of cycles to failure diagram
reported in Figure 6a shows the accuracy of the conventional approach due to Manson and Coffin
in estimating the fatigue lifetime of the considered materials under pure axial and pure torsional
fully-reversed loading, the corresponding loading paths being sketched in Figure 5. This chart
shows that the experimental points fall within an error band of 3. Accordingly, such an error band
will be used in what follows to quantify the accuracy of the proposed approach. This choice can be
justified by observing that, from a statistical viewpoint, the systematic usage of a predictive method
cannot obviously result in an accuracy level which is higher than the intrinsic scatter characterising
the information used to calibrate the method itself. Another important aspect which deserves to be
recalled here is that under non-proportional/complex loading paths the principal directions rotate
during the loading cycle. This results in the simultaneous activation of several slip systems so that
Stage I cracks tend to initiate on several material planes by subsequently propagating along certain
paths whose orientation depends not only on the characteristics of the applied stress/strain history,
but also on the local material morphology [29]. On the contrary, under proportional loading micro-
cracks are seen to initiate on preferential material planes, resulting in smaller deviations of the
propagation directions with respect to the one of maximum shear strain [29]. According to the

Please, cite this paper as: Wang, Y., Susmel, L. The Modified Manson‐Coffin Curve Method to estimate fatigue lifetime under complex constant and variable amplitude multiaxial fatigue loading. International Journal of Fatigue 83 (2), pp. 135‐149, 2016.
above considerations, complex/non-proportional load histories are expected to be characterised by
a larger degree of scattering compared with the corresponding proportional/simple cases.
In order to checked the accuracy of the MMCCM applied along with the -MVM, initially our
fatigue assessment methodology was used to estimate fatigue lifetime under CA fatigue loading, the
considered loading paths being shown in Figure 5. The error diagram reported in Figure 6b makes
it evident that our approach was highly accurate, its systematic usage resulting in predictions
failing mainly within the target error interval. It is worth observing that such a high level of
accuracy was reached not only in the presence of proportional and non-proportional
sinusoidal/triangular strain paths, but also under complex CA load histories. Further, the MMCCM
used in conjunction with the -MVM was seen to be capable of accurately taking into account the
effect of superimposed static strains as well (see Figure 6b).
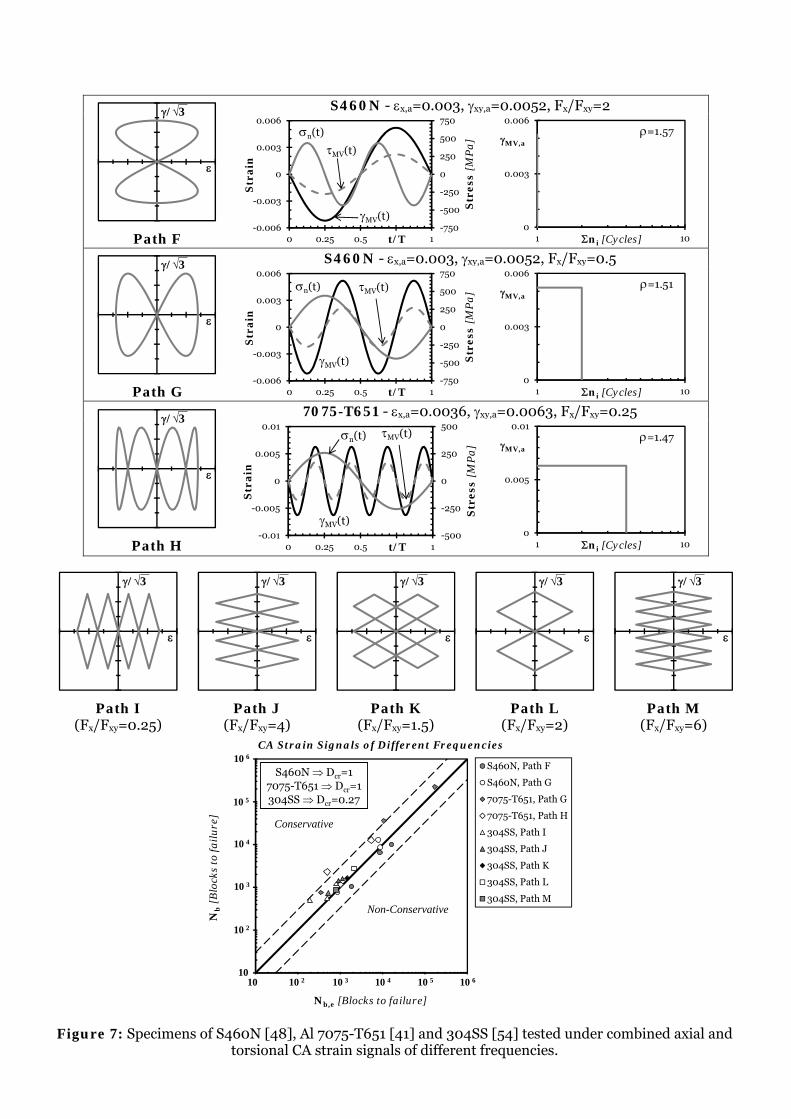
Subsequently, our fatigue assessment method was used to predict the fatigue lifetime of samples of
Al7075-T651 [41], S460N [48] and 304SS [55] tested under combined CA axial and torsional
sinusoidal/triangular strain signals of different frequencies. By focussing attention on the
considered sinusoidal load histories, it is possible to observe that under a ratio between the
frequency of the axial channel, Fx, and the frequency of the torsional channel, Fxy, equal to 2, the
resulting stress/strain history relative to the critical plane was composed of one shear stress/strain
cycle and two normal stress cycles (see Path F in Figure 7). On the contrary, the use of the proposed
method resulted in two shear stress/strain cycles under a Fx to Fxy ratio equal to 0.5 (Path G in
Figure 7) and in four shear stress/strain cycles under Fx/Fxy=0.25 (Path H in Figure 7). In other
words, for these two loading paths one nominal cycle was composed of two and four shear cycles
under a Fx to Fxy ratio equal to 0.5 and 0.25, respectively. Since a similar reasoning applies also to
the triangular strain paths sketched in Figure 7 (see Paths I to M), this explains the reason why the
error diagram in Figure 7 was plotted in terms of number of blocks to failure, one block
corresponding to one nominal cycle. The Nf,e vs. Nf chart of Figure 7 shows that the proposed
approach was highly accurate in modelling the damaging effect of combined CA axial and torsional
strain signals of different frequencies. As to the obtained level of accuracy, it is important to point
out that it was reached by taking the critical value of the damage sum, Dcr, equal to unity for
Al7075-T651 [41] and S460N [48], whereas, as suggested by Sonsino [20], it was set equal to 0.27
for 304SS [55].
Subsequently, attention was focussed on the accuracy of the proposed design approach in
modelling the sequence effect. In particular, our method was attempted to be used to estimate the
fatigue lifetime of specimens of 304SS [54], pure titanium [14], titanium BT9 [14], SNCM439 [55],
SNCM630 (A) [56] and SNCM630 (B) [55] tested under different combinations of axial (A), torsion
(T), in-phase (I) and 90° out-of-phase (O) axial/torsion cycles. Such load histories were built as a
sequence of fully-reversed CA loading blocks containing a predefined number of cycles. Sequences
AA and TT were formed of two axial and two torsional blocks characterised by different

Please, cite this paper as: Wang, Y., Susmel, L. The Modified Manson‐Coffin Curve Method to estimate fatigue lifetime under complex constant and variable amplitude multiaxial fatigue loading. International Journal of Fatigue 83 (2), pp. 135‐149, 2016.
amplitudes. The error diagram reported in Figure 8 confirms that the MMCCM applied along with
the -MVM was capable of accurately predicting the sequence effect in fatigue, the critical value of
the damage sum, Dcr, being taken equal to unity for all the investigated materials.
The next step in the performed validation exercise was considering short VA load histories. The
obtained results are summarised in the error diagram of Figure 9, whereas the profile of the
considered nominal loading paths are sketched in Figure 5. In order to show how our design
technique works in the presence of short VA loading blocks, the load histories re-calculated in
terms of stress/strain quantities relative to the critical plane are reported in Figure 9 for Paths R01,
R02 and R03. This figure makes it evident that, although Path R01 and R02 may appear very
similar, in the case of Path R01 the use of our approach resulted in four shear cycles, whereas for
Path R02 a nominal loading block contained one shear stress/strain cycle. The estimated vs.
experimental number of blocks to failure diagram of Figure 9 confirms that the MWCM applied
along with the -MVM was highly accurate also in estimating lifetime under short VA load
histories, with predictions falling within the target error band.
Subsequently, we focussed our attention on the results generated by Shamsaei, Fatemi and Socie
[15] by testing thin-walled tubular specimens of 1050 QT and 304L stainless steel under the
discriminating strain paths shown both in Figure 5 and in Figure 10. In more detail, Paths FR
contained a series of fully-reversed in-phase axial/torsion cycles applied by making angle vary
(see Figure 10). Both Path FRI and Path FRR were characterised by a step angle equal to 1°, with
ranging in the interval 0°-360°. Paths FRI were generated by gradually increasing angle from 0°
to 360°, whereas Paths FRR contained cycles applied in random order. Path FRI15 had =15° with
0°≤≤360°, whereas for Path FRI90 was equal to 90°, with gradually increasing from 0° to
270°. Paths PI contained pulsating axial/torsion in-phase cycles with =1° and 0°≤≤360°.
Similarly, Paths PI90 was formed of four (=90°) pulsating in-phase axial/torsion cycles with
0°≤≤270°. Some examples showing the resolved shear strain spectra determined by applying the
-MVM are reported in Figure 10. The error diagram of Figure 10 confirms that the MMCCM was
capable of estimates falling within the target error band. As to the made predictions, it is worth
observing that a higher degree of conservatism could have been obtained by simply setting, as
suggested by Sonsino [20], the critical value of the damage sum, Dcr, equal to 0.27.
Finally, the accuracy of the MMCCM applied along with the -MVM was checked against the results
generated by Vormwald and co-workers [49] by testing tubular samples of Al5083 and S460N
under the in-phase and 90° out-of-phase strain spectrum reported in Figure 11. This linear
spectrum with an omission level of 20% contained 4256 fully-reversed cycles, the ratio between the
amplitude of the axial strain, x,a, and the amplitude of the shear strain, xy,a, being constant and
equal to 0.577. In the strain spectrum reported in Figure 11 x,MAX, xy,MAX and MV,MAX are used to
denote, for any tests, the corresponding maximum value in the applied loading blocks. The error

Please, cite this paper as: Wang, Y., Susmel, L. The Modified Manson‐Coffin Curve Method to estimate fatigue lifetime under complex constant and variable amplitude multiaxial fatigue loading. International Journal of Fatigue 83 (2), pp. 135‐149, 2016.
diagram of Figure 11 proves that the use of our multiaxial fatigue lifetime estimation technique
resulted in estimates falling within the target error band. It is possible to conclude by observing
that, as recommended by Sonsino [20], the above predictions were made by taking Dcr equal to
0.27 for S460N and equal to 0.37 for Al5083.
6. Conclusions
The MMCCM applied along with the -MVM is seen to be highly successful in estimating
lifetime of metallic materials subjected to CA and VA multiaxial load histories.
The use of the -MVM allows the computational time required to calculate the stress/strain
quantities relative to the critical plane to be reduced remarkably: this can help to minimise
the costs associated with the design process, this being done by always reaching a
remarkable level of accuracy.
Under VA load histories, if the critical value of the damage sum cannot be determined
experimentally, the proposed approach should be applied by taking Dcr equal to (or lower
than) 0.27 for steel and 0.37 for aluminium.
As far as un-notched metallic materials are concerned, the MMCCM applied along with the
-MVM offers a complete solution to the strain based multiaxial fatigue problem.
More works need to be done in this area to extend the use of the proposed multiaxial fatigue
life estimation technique to metallic components containing notches.
Appendix A. Mathematical formalisation of the -MVM
The body of Figure 2a is subjected to a complex system of forces and moments resulting in tri-axial
time-variable states of stress and strain damaging internal reference point O. This point is used to
define also a suitable local system of coordinates, Oxyz. The following tensors are used to
summarise the states of stress and strain at point O (where Tt ):
)t()t()t(
)t()t()t(
)t()t()t(
)t(
zyzxz
yzyxy
xzxyx
(A1)
)t(2
)t(
2
)t(2
)t()t(
2
)t(2
)t(
2
)t()t(
)t(
zyzxz
yzy
xy
xzxyx
(A2)
Please, cite this paper as: Wang, Y., Susmel, L. The Modified Manson‐Coffin Curve Method to estimate fatigue lifetime under complex constant and variable amplitude multiaxial fatigue loading. International Journal of Fatigue 83 (2), pp. 135‐149, 2016.
In the above tensors i(t) and i(t) (i=x, y, x) are the normal stress and normal strain components,
whereas ij(t) and ij(t) (i, j=x, y, x) are the shear stress and shear strain components.
Angles and as shown in Figure A1 can be used to define the orientation of a generic material
plane, via its normal unit vector, n. According to the above schematisation, is the angle
between the projection of unit vector n on the x-y plane and the x-axis, whereas is the angle
between unit vector n and the z-axis. A second frame of reference, Oanb, can also be defined as
shown in Figure A2, where the unit vectors giving the orientation of the three axes are as follows:
cos
sinsin
cossin
n
n
n
n
z
y
x
;
0
cos
sin
a
a
a
a
z
y
x
;
sin
sincos
coscos
b
b
b
b
z
y
x
(A3)
Given a generic direction on the plane which passes through point O (Fig. A1), the associated unit
vector, q, is as follows:
sinsin
)sin(cossincoscos
)cos(cossinsincos
q
q
q
q
z
y
x
(A4)
In definition (A4) is the angle between direction q and the a-axis (Fig. A1).
The instantaneous values of the stress, n(t), and strain, n(t), normal to the plane can directly be
determined as:
z
y
x
zyzxz
yzyxy
xzxyx
zyxn
n
n
n
)t()t()t(
)t()t()t(
)t()t()t(
nnn)t( (A5)
z
y
x
zyzxz
yzy
xy
xzxyx
zyxn
n
n
n
)t(2
)t(
2
)t(2
)t()t(
2
)t(2
)t(
2
)t()t(
nnn)t( (A6)
The shear stress, q(t), and shear strain, q(t), resolved along direction q can instead be determined
via the components of unit vector q, i.e.:

Please, cite this paper as: Wang, Y., Susmel, L. The Modified Manson‐Coffin Curve Method to estimate fatigue lifetime under complex constant and variable amplitude multiaxial fatigue loading. International Journal of Fatigue 83 (2), pp. 135‐149, 2016.
z
y
x
zyzxz
yzyxy
xzxyx
zyxq
n
n
n
)t()t()t(
)t()t()t(
)t()t()t(
qqq)t( (A7)
z
y
x
zyzxz
yzy
xy
xzxyx
zyxq
n
n
n
)t(2
)t(
2
)t(2
)t()t(
2
)t(2
)t(
2
)t()t(
qqq2
)t( (A8)
Alternatively, shear strain q(t) can also be expressed via the following scalar product:
t2
tq ed
, (A9)
where d is the vector of direction cosines:
yzzyxzzxxyyxzzyyxx qnqnqnqnqnqnqnqnqn d , (A10)
and e(t) a six-dimensional vector process depending on the components of strain tensor [(t)], i.e.:
2
t
2
t
2
ttttt yzxzxy
zyxe . (A11)
Vector of direction cosines d can also be expressed through angles , and , as follows [27]:
)cos()cos()cos()2cos()sin()sin(
)cos()sin()cos()2cos()cos()sin(
)sin()2cos()cos()2sin()2sin()sin(2
1
)2sin()sin(2
1
)sin()2sin()sin()cos()2sin()sin(2
1
)cos()2sin()sin()cos()2sin()sin(2
1
d
d
d
d
d
d2
2
6
5
4
3
2
1
d . (A12)
Therefore, the variance of the shear strain resolved along generic direction q can be expressed in
the following simplified form:
Please, cite this paper as: Wang, Y., Susmel, L. The Modified Manson‐Coffin Curve Method to estimate fatigue lifetime under complex constant and variable amplitude multiaxial fatigue loading. International Journal of Fatigue 83 (2), pp. 135‐149, 2016.
i jjiji
kkk
q te,teCovddtedVar2
tVar (A13)
By defining symmetric matrix [C] as:
yzyz,xyyz,xyyz,zyz,yyz,x
yz,xzxzxz,xyxz,zxz,yxz,x
yz,xyxz,xyxyxy,zxy,yxy,x
yz,zxz,zxy,zzz,yz,x
yz,yxz,yxy,yz,yyy,x
yz,xxz,xxy,xz,xy,xx
VCCCCC
CVCCCC
CCVCCC
CCCVCC
CCCCVC
CCCCCV
]C[ (A14)
where (for i, j=x, y, z):
tVarV ii (A15)
2
tVarV ij
i (A16)
t,tCoVarC jij,i (A17)
t,
2
tCoVarC i
iji,ij (A18)
2
t,tCoVarC ij
iij,i (A19)
2
t,
2
tCoVarC ijij
ij,ij (A20)
Eq. (A13) can easily be rewritten as follows:
dd ]C[
2
tVar Tq
. (A21)
The global maxima of Eq. (A21) allow the directions experiencing the maximum variance of the
resolved shear stress to be determined directly. In particular, the problem to be solved is nothing
Please, cite this paper as: Wang, Y., Susmel, L. The Modified Manson‐Coffin Curve Method to estimate fatigue lifetime under complex constant and variable amplitude multiaxial fatigue loading. International Journal of Fatigue 83 (2), pp. 135‐149, 2016.
but a conventional optimisation problem which can easily be addressed by using standard
methodologies such as the gradient ascent technique [27].
Amongst all the selected planes containing a direction experiencing the maximum variance of the
resolved shear strain, according to the fatigue damage model depicted in Figure 1a, the critical
plane is then the one associated with the largest value of ratio , Eq. (1). Finally, if *, * and * are
used to denote the angles defining the orientation of this plane together with the associated critical
direction MV, the stress and strain components relative to the critical plane can directly be
determined via Eqs (A5) to (A8), where =*, =* and =*.
Acknowledgements
The Jiangsu Oversea Research & Training Program for University Prominent Young & Middle-aged
Teachers and the National Natural Science Foundation of China are acknowledged for supporting
the present research project (Project No.: 10702027).
References
[1] Langlais TE, Vogel JH, Chase TR. Multiaxial cycle counting for critical plane methods. Int J Fatigue 2003;25:641-647.
[2] Wang CH, Brown MW. Life prediction techniques for variable amplitude multiaxial fatigue – Part 1: Theories. Trans. ASME, J. Eng. Mat. Techn. 1996;118:367-370.
[3] Wang CH, Brown MW. Life prediction techniques for variable amplitude multiaxial fatigue – Part 2: Comparison with experimental results. Trans. ASME, J. Eng. Mat. Techn. 1996;118:371-374.
[4] Kim KS, Park JC, Lee JW. Multiaxial fatigue under variable amplitude loads. Trans. ASME, J. Eng. Mat. Techn. 1999;121:286-293.
[5] Kim KS, Park JC. Shear strain based multiaxial fatigue parameters applied to variable amplitude loading. Int J Fatigue 1999;21:475-483.
[6] Chen X, Jin D, Kim S. A weight function-critical plane approach for low-cycle fatigue under variable amplitude multiaxial loading. Fatigue Fract Engng Mater Struct 2006;29:331-339.
[7] Socie DF, Marquis GB. Multiaxial Fatigue, SAE, Warrendale, PA, 2000.
[8] Smith KN, Watson P, Topper TH. A stress-strain function for the fatigue of metals. J Mater. 1970;5:767-776.
[9] Socie DF. Fatigue damage models. Trans. ASME, J. Eng. Mat. Techn. 1987;109:293-298.
[10] Kandil FA, Brown MW, Miller KJ. Biaxial low-cycle fatigue fracture of 316 stainless steel at elevated temperature. Met. Soc. London 1982;280:203-210.
[11] Wang CH, Brown MW. A path-independent parameter for fatigue under proportional and non-proportional loading. Fatigue Fract Engng Mater Struct 1993;16:1285-1298.
[12] Fatemi A, Socie DF. A critical plane approach to multiaxial fatigue damage including out-of-phase loading. Fatigue Fract Engng Mater Struct 1988;11:149-165.
[13] Bannantine JA, Socie DF. A variable amplitude multiaxial life prediction method. In: Fatigue under Biaxial and Multiaxial Loading, Edited by K. Kussmaul, D. McDiarmid and D. Socie, ESIS 10, Mechanical Engineering Publications, London, pp. 35-51, 1991.

Please, cite this paper as: Wang, Y., Susmel, L. The Modified Manson‐Coffin Curve Method to estimate fatigue lifetime under complex constant and variable amplitude multiaxial fatigue loading. International Journal of Fatigue 83 (2), pp. 135‐149, 2016.
[14] Shamsaei N, Gladskyi M, Panasovskyi K, Shukaev S, Fatemi A. Multiaxial fatigue of titanium including step loading and load path alteration and sequence effects. Int J Fatigue 2010;32:1862–1874.
[15] Shamsaei N, Fatemi A, Socie DF. Multiaxial fatigue evaluation using discriminating strain paths. Int J Fatigue 2011;33:597–609.
[16] Matsuishi M, Endo T. Fatigue of metals subjected to varying stress. Presented to the Japan Society of Mechanical Engineers, Fukuoka, Japan; 1968.
[17] Fatemi A, Yang L. Cumulative fatigue damage and life prediction theories: a survey of the state of the art for homogeneous materials. Int J Fatigue 1998;20(1):9–34.
[18] Palmgren A. Die Lebensdauer von Kugellagern. vol. 68. Verfahrenstechnik, Berlin, 1924. p. 339–41.
[19] Miner MA. Cumulative damage in fatigue. J Appl Mech 1945;67:AI59–64.
[20] Sonsino CM. Fatigue testing under variable amplitude loading. Int J Fatigue 2007;29 6:1080–9.
[21] Sonsino CM, Kueppers M. Multiaxial fatigue of welded joints under constant and variable amplitude loadings. Fatigue Fract Eng Mater Struct 2001;24:309–27.
[22] Chen X, Jin D, Kim KS. Fatigue life prediction of type 304 stainless steel under sequential biaxial loading. Int J Fatigue 2006;28:289–299.
[23] Susmel L, Meneghetti G, Atzori B. A simple and efficient reformulation of the classical Manson-Coffin curve to predict lifetime under multiaxial fatigue loading. Part I: plain materials. Trans ASME, J Eng Mat Techn 2009;131(2):021009-1/9.
[24] Susmel L, Meneghetti G, Atzori B. A simple and efficient reformulation of the classical Manson-Coffin curve to predict lifetime under multiaxial fatigue loading. Part II: notches. Trans ASME, J Eng Mat Techn 2009;131(2):021010-1/8.
[25] Susmel L, Atzori B, Meneghetti G, Taylor D. Notch and Mean Stress Effect in Fatigue as Phenomena of Elasto-Plastic Inherent Multiaxiality. Engineering Fracture Mechanics 2011;78:1628-1643.
[26] Macha E. Simulation investigations of the position of fatigue fracture plane in materials with biaxial loads. Materialwiss Werkstofftech 1989;20(4):132–6.
[27] Susmel L. A simple and efficient numerical algorithm to determine the orientation of the critical plane in multiaxial fatigue problems. Int J Fatigue 2010;32:1875–1883.
[28] Susmel L, Tovo R, Socie DF. Estimating the orientation of Stage I crack paths through the direction of maximum variance of the resolved shear stress. Int J Fatigue 2014;58:94–101.
[29] Kanazawa K, Miller KJ, Brown MW. Low-cycle fatigue under out-of phase loading conditions. Trans ASME, J Eng Mat Techn 1977:222–228.
[30] Socie D, Bannantine J. Bulk Deformation Damage Models. Materials Science and Engineering 1988;A103:3-13.
[31] Susmel L. Multiaxial Notch Fatigue: from nominal to local stress-strain quantities. Woodhead & CRC, Cambridge, UK, 2009.
[32] Kaufman RP, Topper T. The influence of static mean stresses applied normal to the maximum shear planes in multiaxial fatigue. In: Biaxial and Multiaxial fatigue and Fracture, Edited by A. Carpinteri, M. de Freitas and A. Spagnoli, Elsevier and ESIS, 2003, pp. 123-143.
[33] Benasciutti D, Tovo R. Spectral methods for lifetime prediction under wide-band stationary random processes. Int J Fatigue 2005;27:867-877.

Please, cite this paper as: Wang, Y., Susmel, L. The Modified Manson‐Coffin Curve Method to estimate fatigue lifetime under complex constant and variable amplitude multiaxial fatigue loading. International Journal of Fatigue 83 (2), pp. 135‐149, 2016.
[34] Benasciutti D, Tovo R. Cycle distribution and fatigue damage assessment in broad-band non-Gaussian random processes. Probab Eng Mech 2005;20:115-127.
[35] Susmel L, Tovo R, Benasciutti D. A novel engineering method based on the critical plane concept to estimate lifetime of weldments subjected to variable amplitude multiaxial fatigue loading. Fatigue Fract Engng Mater Struct 2009;32:441–459.
[36] Susmel L. Estimating fatigue lifetime of steel weldments locally damaged by variable amplitude multiaxial stress fields. Int J Fatigue 2010;32:1057–1080.
[37] Susmel L, Tovo R. Estimating Fatigue Damage under Variable Amplitude Multiaxial Fatigue Loading. Fatigue Fract Engng Mater Struct 2011;34:1053-1077.
[38] Susmel L, Taylor D. A critical distance/plane method to estimate finite life of notched components under variable amplitude uniaxial/multiaxial fatigue loading. Int J Fatigue 2012;38:7-24.
[39] Louks R, Gerin B, Draper J, Askes H, Susmel L. On the multiaxial fatigue assessment of complex three-dimensional stress concentrators. Int J Fatigue 2014;63:12-24.
[40] Susmel L. Four stress analysis strategies to use the Modified Wöhler Curve Method to perform the fatigue assessment of weldments subjected to constant and variable amplitude multiaxial fatigue loading. Int J Fatigue 2014;64:38-54.
[41] Zhao T, Jiang Y. Fatigue of 7075-T651 aluminium alloy. Int J Fatigue 2008;30:834-849.
[42] Hoffmeyer J, Döring R, Seeger T, Vormwald M. Deformation behaviour, short crack growth and fatigue lives under multiaxial nonproportional loading. Int J Fatigue 2006;28:508–520.
[43] Lin H, Nayeb-Hashemi H, Pelloux RM. Constitutive relations and fatigue life prediction for anisotropic al-6061–t6 rods under biaxial proportional loadings. Int J Fatigue 1992;14:249–259.
[44] Shang DG, Sun GQ, Yan CL. Multiaxial fatigue damage parameter and life prediction for medium-carbon steel based on the critical plane approach. Int J Fatigue 2007;29:2200–2207.
[45] Hua CT, Socie DF. Fatigue damage in 1045 steel under constant amplitude biaxial loading. Fatigue Fract Eng Mater Struct 1984;7:165–179.
[46] Kurath P, Downing SD, Galliart DR. Summary of non-hardened notched shaft-round robin program. multiaxial fatigue-analysis and experiments. G. E. Leese and D. F. Socie, eds., SAE, Warrendale, PA, 1989:AE-14:13–32.
[47] Nelson DV, Rostami A. Biaxial fatigue of A533B pressure vessel steel. ASME J. Pressure Vessel Technol. 1997;119:325–331.
[48] Jiang Y, Hertel O, Vormwald M. An experimental evaluation of three critical plane multiaxial fatigue criteria. Int J Fatigue 2007;29:1490–1502.
[49] Hertel O, Vormwald M. Short-crack-growth-based fatigue assessment of notched components under multiaxial variable amplitude loading. Eng Frac Mech 2011;78: 1614–1627.
[50] Chen X, An K, Kim KS. Low-Cycle Fatigue of 1Cr-18Ni-9Ti Stainless Steel and Related Weld Metal Under Axial, Torsional and 90° Out-of-Phase-Loading. Fatigue Fract Eng Mater Struct 2004;27:439–448.
[51] Socie DF, Waill LA, Dittmer DF. Biaxial Fatigue of Inconel 718 Including Mean Stress Effects. In: Multiaxial Fatigue, ASTM STP 853, K. J. Miller and M. W. Brown, eds., American Society for Testing and Materials, Philadelphia, PA, 1985:463–481.
[52] Socie DF, Kurath P, Koch J. A multiaxial fatigue damage parameter. Biaxial and Multiaxial Fatigue, EGF 3, M. W. Brown and K. J. Miller, eds., Mechanical Engineering, London, 1989:535–550.

Please, cite this paper as: Wang, Y., Susmel, L. The Modified Manson‐Coffin Curve Method to estimate fatigue lifetime under complex constant and variable amplitude multiaxial fatigue loading. International Journal of Fatigue 83 (2), pp. 135‐149, 2016.
[53] Kim KS, Lee BL, Park JC. Biaxial Fatigue of Stainless Steel 304 under irregular loading. Fatigue and Fracture Mechanics: 31st Volume, ASTM STP 1389, G. R. Halford and J. P. Gallagher, Eds., ASTM, West Conshohocken, PA, 2000:79-93.
[54] Chen X, Jin D, Kim KS. Fatigue life prediction of type 304 stainless steel under sequential biaxial loading. Int J Fatigue 2006;28:289-299.
[55] Lee BL, Kim KS, Nam KM. Fatigue analysis under variable amplitude loading using an energy parameter. Int J Fatigue 2003;25:621-631.
[56] Han C, Chen X, Kim KS. Evaluation of multiaxial fatigue criteria under irregular loading. Int J Fatigue 2002;24:913-922.
[57] Shamsaei N, Fatemi A. Effect of hardness on multiaxial fatigue behaviour and some simple approximations for steels. Fatigue Fract Engng Mater Struct 2009;32:631–646.
[58] Lee Y-L, Pan J, Hathaway RB, Barkey ME. Fatigue Testing and Analysis. Elsevier Butterworth–Heinemann, Oxford, UK, 2005 (ISBN: ISBN 0-7506-7719-8).
[59] Jiang, Y., and Sehitoglu, H., 1996, “Modelling of Cyclic Ratchetting Plasticity—Part I: Development and Constitutive Relations,” ASME Trans. J. Appl. Mech., 63, pp. 720–725.
[60] Jiang, Y., and Sehitoglu, H., 1996, “Modelling of Cyclic Ratchetting Plasticity—Part II: Comparison of Model Simulations With Experiments,” ASME Trans. J. Appl. Mech., 63, pp. 726–733.

List of Captions
Table 1: Static and fatigue properties of the investigated materials Static and fatigue properties of the investigated materials (values in bold indicate the material constants being estimated; values in italic indicate the material constant being determined by post-processing the provided experimental results generated under fully-reversed axial loading and fully-reversed torsion).
Figure 1: Fatigue damage model (a) and modified Manson-Coffin diagram (b).
Figure 2: Adopted definitions to calculate the amplitude and the mean value of the stress components relative to the critical plane under both constant and variable amplitude fatigue loading.
Figure 3: In-field use of the MMCCM applied along with the -MVM to estimate fatigue lifetime under constant amplitude fatigue loading.
Figure 4: In-field use of the MMCCM applied along with the-MVM to estimate fatigue lifetime under variable amplitude fatigue loading.
Figure 5: Reference loading paths (IPh=in-phase; OoPh=out-of-phase, ZMS=zero mean strain; N-ZMS=non-zero mean strain).
Figure 6: Determination of the reference error band (a); accuracy of the MMCCM in predicting fatigue lifetime under CA nominal loading paths (b) – see also Figure 5.
Figure 7: Specimens of S460N [48], Al 7075-T651 [41] and 304SS [54] tested under combined axial and torsional CA strain signals of different frequencies.
Figure 8: Specimens of 304SS [48], pure titanium [14], titanium BT9 [14], SNCM439 [55], SNCM630 (A) [56] and SNCM630 (B) [55] tested under fully-reversed sequential loading (A=Axial cyclic loading; T=torsional cyclic loading: I=in-phase axial loading and torsion: O=90° out-of-phase axial loading and torsion).
Figure 9: Specimens of S45C [4], 304SS [53], SNCM439 [55], SNCM630 (A) [56] and SNCM630 (B) [55] subjected to short variable amplitude load histories.
Figure 10: Specimens of 1045 QT [15] and 304L [15] subjected to discriminating strain paths.
Figure 11: Specimens of Al5083 [49] and S460N [49] subjected to short variable amplitude load histories.
Figure A1: Definition of angles , , and .

Tables
Material Ref. E G K'
n' 'f
'f b c 'f
'f b0 c0 [GPa] [GPa] [MPa] [MPa] [MPa]
Al7075-T651 [41] 71.7 27.5 790 0.064 1104 0.519 -0.118 -0.87 687 1.346 -0.112 -0.993 Al5083 [42] 68 25.6 544 0.075 780 1.153 -0.114 -0.861 451 1.997 -0.114 -0.861
6061-T6 (A) [43] 71.5 28.2 436 0.069 369 0.09 -0.031 -0.45 285 0.3881 -0.05 -0.642 6061-T6 (B) [43] 71.5 28.2 436 0.069 373 0.104 -0.033 -0.473 245 1.4746 -0.048 -0.675
S45C [4] 186 70.6 1215 0.217 923 0.359 -0.099 -0.519 685 0.198 -0.12 -0.36 45 Steel [44] 190 79 1258 0.208 843 0.327 -0.105 -0.546 559 0.496 -0.108 -0.469
SAE 1045 [45, 46] 204 80.3 1258 0.208 930 0.298 -0.106 -0.49 505 0.413 -0.097 -0.445 A533B [47] 193 76.1 827 0.13 847 1.201 -0.083 -0.64 586 1.554 -0.115 -0.615 S460N [48, 49] 208.5 80.2 1115 0.161 834 0.1572 -0.079 -0.493 529 0.213 -0.096 -0.418
AISI 304 [9] 183 82.8 1660 0.287 1000 0.171 -0.114 -0.402 640 0.279 -0.124 -0.339 1Cr-18Ni-9Ti [50] 193 74.3 1115 0.1304 1124 0.8072 -0.091 -0.665 644 0.8118 -0.088 -0.533 Inconel 718 [51, 52] 208.5 77.8 1530 0.07 1640 2.67 -0.06 -0.82 1030 3.62 -0.074 -0.778
304SS [53-55] 171 66 812 0.125 760 0.0763 -0.079 -0.36 627 0.193 -0.078 -0.369 SNCM630 (A) [56] 196 77 1056 0.054 1272 1.54 -0.073 -0.823 858 1.51 -0.061 -0.706
1050 QT [15, 57] 203 81 - - 1346 2.01 -0.062 -0.725 777 3.481 -0.062 -0.725 SNCM439 [55] 208 80.2 1234 0.102 1050 1.426 -0.054 -0.786 606 2.47 -0.054 -0.786
SNCM630 (B) [55] 196 77 926 0.032 1008 1.168 -0.042 -0.792 582 2.023 -0.042 -0.792 304L Stainless Steel [15] 195 77 - - 1287 0.122 -0.145 -0.394 743 0.2113 -0.145 -0.394
Pure Titanium [14] 112 40 - - 647 0.548 -0.033 -0.646 485 0.417 -0.069 -0.523
Titanium BT9 [14] 118 43 - - 1180 0.278 -0.025 -0.665 881 0.18 -0.082 -0.47
Table 1: Static and fatigue properties of the investigated materials Static and fatigue properties of the investigated materials (values in bold indicate the material constants being estimated; values in italic indicate the material constant being determined by post-processing the
provided experimental results generated under fully-reversed axial loading and fully-reversed torsion).

Figures
Figure 1: Fatigue damage model (a) and modified Manson-Coffin diagram (b).
x(t) x(t)
y(t)
y(t)
xy(t)
xy(t)
xy(t)
xy(t)
a, a
a, a
n,a
n,a n,m
n,m
(a)
Critical plane
Increasing
2Nf
a
=0
=1
i
j
0<i<1<j Fully-Reversed
Torsional fatigue curve
Fully-reversed uniaxial fatigue curve
(b)

Fi(t)
Fj(t)
Fk(t)
x
y
z
O
(a) (b)
(t), (t)
Critical Plane
n(t)
O MV(t)MV(t)
MV
(c)
n(t)
t n,m
n,a
n,max
n,min
min,MVmax,MVa
min,MVmax,MVm
2
12
1
min,nmax,na,n
min,nmax,nm,n
2
12
1
T t
MV(t)
a
m
MV,max
MV,min
t
MV(t)
a
m
MV,max
MV,min
min,MVmax,MVa
min,MVmax,MVm
2
12
1
Constant Amplitude Variable Amplitude
)t(Var2
dt)t(T
1)t(Var
dt)t(T
1
MVa
T
0
2mMVMV
T
0MVm
)t(Var2
dt)t(T
1)t(Var
dt)t(T
1
MVa
T
0
2mMVMV
T
0MVm
)t(Var2
dt)t(T
1)t(Var
dt)t(T
1
na,n
T
0
2m,nnn
T
0nm,n
(d) MV(t)
a
m
T t
MV(t)
a
m
T t
n(t)
T t n,m
n,a
Figure 2: Adopted definitions to calculate the amplitude and the mean value of the stress components relative to the critical plane under both constant and variable amplitude fatigue loading.

(t), (t)
Critical Plane
n(t)
O MV(t)MV(t)
MV
n(t)
t n,m
n,a
n,max
n,min T t
MV(t)
a
m
MV,max
MV,min t
MV(t)
a
m
MV,max
MV,min
(a)
x
y
z
M(t)
F(t)
F(t)
M(t)
(b)
a, n,max,
'f(), 'f(), b(), c()
a
2Nf
Eq. (2)
'f()
'f()
G b() c()
1 1
a
2Nf,e
(c)
(d)
(e)
(f)
(g)
(h)
O
Figure 3: In-field use of the MMCCM applied along with the -MVM to estimate fatigue lifetime under constant amplitude fatigue loading.

(t), (t)
Critical Plane
n(t)
O MV(t)MV(t)
MV
(a)
x
y
z
M(t)
F(t)
F(t)
M(t)
(b)
a, n,max,
'f(), 'f(), b(), c()
a
2Nf
Eq. (2)
'f()
'f()
G b() c() 11
a,1
2Nf,1
(c)
(e)
(f)
(g)
(h)
O
n1 n2 …….. nj
a,1
a,2
a,j
Dtot=
a
2Nf,2 2Nf,3
a,2
a,3
MV(t) MV(t) n(t)
a m m
a n,a n,m
T t T t T t
(d)
Rain-Flow
j
i=1
ni
Nf,i
j
i=1
Dcr
Dtot
N
f,e= ni
ni
(i)
(j)
(k)
Figure 4: In-field use of the MMCCM applied along with the-MVM to estimate fatigue lifetime under variable amplitude fatigue loading.

Axial, ZMS
Torsion, ZMS
IPh, ZMS
OoPh, ZMS
Axial, N-ZMS
Axial, N-ZMS
Torsion, N-ZMS
Torsion, N-ZMS
Torsion, N-ZMS
IPh, N-ZMS
IPh, N-ZMS
IPh, N-ZMS
IPh, N-ZMS
IPh, N-ZMS
OoPh, N-ZMS
Path A
Path A1
Path B
Path C
Path C1
Path C2
Path D
Path E
Path E1
Path R01
Path R02 Path R03 Path FR
Path PI
/√3
/√3
/√3
/√3
/√3
/√3
/√3
/√3
/√3
/√3
/√3
/√3
/√3
/√3
/√3
/√3
/√3
/√3
/√3
/√3
/√3
/√3
/√3
/√3
/√3
/√3
/√3
/√3
/√3
Figure 5: Reference loading paths (IPh=in-phase; OoPh=out-of-phase, ZMS=zero mean strain; N-ZMS=non-zero mean strain).
(a)
(b)
Figure 6: Determination of the reference error band (a); accuracy of the MMCCM in predicting fatigue lifetime under CA nominal loading paths (b) – see also Figure 5.
10
100
1000
10000
100000
1000000
10 100 1000 10000 100000 1000000
Nf
[Cyc
les
to f
ail
ure
]
Nf,e [Cycles to failure]
Axial, ZMS
Torsion, ZMS
Non-Conservative
Conservative
Axial & Torsional Cyclic Loading
102
10 102 103 104 105 106
103
104
105
106
10
R=-1
10
100
1000
10000
100000
1000000
10 100 1000 10000 100000 1000000
Nf
[Cyc
les
to f
ail
ure
]
Nf,e [Cycles to failure]
IPh, ZMS
OoPh, ZMS
IPh, N-ZMS
OoPh, N-ZMS
Path A
Path A1
Path B
Path C
Path C1
Path D
Path E
Axial, N-ZMS
Torsion, N-ZMS
Non-Conservative
Conservative
CA Loading Paths
102
10 102 103 104 105 106
103
104
105
106
10
Path F
S460N - x,a=0.003, xy,a=0.0052, Fx/Fxy=2
Path G
S460N - x,a=0.003, xy,a=0.0052, Fx/Fxy=0.5
Path H
7075-T651 - x,a=0.0036, xy,a=0.0063, Fx/Fxy=0.25
Path I
(Fx/Fxy=0.25)
Path J
(Fx/Fxy=4) Path K
(Fx/Fxy=1.5)
Path L
(Fx/Fxy=2) Path M
(Fx/Fxy=6)
/√3
-750
-500
-250
0
250
500
750
-0.006
-0.003
0
0.003
0.006
0 0.25 0.5 0.75 1
Str
ess
[M
Pa
]
Str
ain
t/T
MV(t)
n(t)
MV(t)
0
0.003
0.006
1 10
MV,a
ni [Cycles]
=1.57
/√3
-750
-500
-250
0
250
500
750
-0.006
-0.003
0
0.003
0.006
0 0.25 0.5 0.75 1
Str
ess
[M
Pa
]
Str
ain
t/T
MV(t)
n(t) MV(t)
0
0.003
0.006
1 10
MV,a
ni [Cycles]
=1.51
/√3
-500
-250
0
250
500
-0.01
-0.005
0
0.005
0.01
0 0.25 0.5 0.75 1
Str
ess
[M
Pa
]
Str
ain
t/T
MV(t)
n(t) MV(t)
0
0.005
0.01
1 10
MV,a
ni [Cycles]
=1.47
/√3
/√3
/√3
/√3
/√3
10
100
1000
10000
100000
1000000
10 100 1000 10000 100000 1000000
Nb
[Blo
cks
to fa
ilu
re]
Nb,e [Blocks to failure]
S460N, Path F
S460N, Path G
7075-T651, Path G
7075-T651, Path H
304SS, Path I
304SS, Path J
304SS, Path K
304SS, Path L
304SS, Path MNon-Conservative
Conservative
CA Strain Signals of Different Frequencies
102
10 102 103 104 105 106
103
104
105
106
10
S460N Dcr=17075-T651 Dcr=1304SS Dcr=0.27
Figure 7: Specimens of S460N [48], Al 7075-T651 [41] and 304SS [54] tested under combined axial and torsional CA strain signals of different frequencies.

Figure 8: Specimens of 304SS [48], pure titanium [14], titanium BT9 [14], SNCM439 [55], SNCM630 (A) [56] and SNCM630 (B) [55] tested under fully-reversed sequential loading (A=Axial cyclic loading; T=torsional cyclic loading: I=in-phase axial loading and torsion:
O=90° out-of-phase axial loading and torsion).
10
100
1000
10000
100000
1000000
10 100 1000 10000 100000 1000000
Nf
[Nom
ina
l cyc
les
to fa
ilu
re]
Nf,e [Nominal cycles to failure]
AA
AO
AT
IO
OA
OI
OT
TA
TO
TT
ATAOAOTOTA
OATOTA
TAOTOA
TATOTOAO
Non-Conservative
Conservative
Sequence Effects
102
103
104
10
Dcr=1
10 102 103 104 105 106
105
106

Path R01
S45C
Path R02
S45C
Path R03
304SS
Figure 9: Specimens of S45C [4], 304SS [53], SNCM439 [55], SNCM630 (A) [56] and SNCM630 (B) [55] subjected to short variable amplitude load histories.
/√3
-500
-250
0
250
500
-0.015
-0.01
-0.005
0
0.005
0.01
0.015
0 0.25 0.5 0.75 1
Str
ess
[M
Pa
]
Str
ain
t/T
MV(t)
n(t)
MV(t)0
0.005
0.01
1 10
MV,a
ni [Cycles]
=1.7
/√3
-500
-250
0
250
500
-0.015
-0.01
-0.005
0
0.005
0.01
0.015
0 0.25 0.5 0.75 1
Str
ess
[M
Pa
]
Str
ain
t/T
MV(t)
n(t)
MV(t)0
0.005
0.01
1 10
MV,a
ni [Cycles]
=1.18
/√3
-500
-250
0
250
500
-0.015
-0.01
-0.005
0
0.005
0.01
0.015
0 0.25 0.5 0.75 1
Str
ess
[M
Pa
]
Str
ain
t/T
MV(t)
n(t) MV(t)
0
0.005
0.01
1 10
MV,a
ni [Cycles]
=1.35
10
100
1000
10000
100000
1000000
10 100 1000 10000 100000 1000000
Nf
[Blo
cks
to fa
ilu
re]
Nf,e [Blocks to failure]
Axial, ZMS
Torsion, ZMS
IPh, ZMS
Path C2
Path D
Path E
Path E1
Path R01
Path R02
Path R03
Non-Conservative
Conservative
Short VA load histories
102
103
104
10
Dcr=1
10 102 103 104 105 106
105
106

Path FR
FRI - 1050 QT (=1°; 0°≤≤360°)
FRR - 304L (=1°; 0°≤≤360°)
FRI15 - 304L
(=15°; 0°≤≤360°)
FRI90 - 1050 QT (=90°; 0°≤≤270°)
Path PI
PI - 304L (=1°; 0°≤≤360°)
PI90 - 1050 QT (=90°; 0°≤≤270°)
Figure 10: Specimens of 1045 QT [15] and 304L [15] subjected to discriminating strain paths.
/√3
0
0.005
0.01
0.015
1 10 100 1000
MV,a
ni [Cycles]
=1.76
0
0.005
0.01
0.015
1 10 100 1000
MV,a
ni [Cycles]
=1.71
0
0.005
0.01
0.015
1 10 100 1000
MV,a
ni [Cycles]
=1.81
0
0.005
0.01
0.015
1 10 100 1000
MV,a
ni [Cycles]
=1.64
/√3
0
0.005
0.01
0.015
1 10 100 1000
MV,a
ni [Cycles]
=1.74
0
0.005
0.01
0.015
1 10 100 1000
MV,a
ni [Cycles]
=1.76
1
10
100
1000
10000
100000
1 10 100 1000 10000 100000
Nb
[Blo
cks
to fa
ilu
re]
Nb,e [Blocks to failure]
1050 QT, FRI
1050 QT, FRR
1050 QT, FRI90
1050 QT, PI
1050 QT, PI90
304L, FRI
304L, FRR
304L, FRI15
304L, PI
Non-Conservative
Conservative
Discriminating strain paths
101
102
103
100
100 101 102 103 104 105
104
105
Dcr=1

Figure 11: Specimens of Al5083 [49] and S460N [49] subjected to short variable amplitude load histories.
Figure A1: Definition of angles , , and .
0
0.2
0.4
0.6
0.8
1
1.2
1 10 100 1000 10000
ni [Cycles]
20% Omission Levelx,a/xy,a=0.577, R=-1
x,a/x,MAX
xy,axy,MAX
MV,a/MV,MAX
100
1000
10000
100000
1000000
10000000
100 1000 10000 100000 1000000 10000000
Nf
[Cyc
les
to f
ail
ure
]
Nf,e [Cycles to failure]
Al5083, IPh, ZMS
Al5083, OoPh, ZMS
S460N, IPh, ZMS
S460N, OoPh, ZMS
Non-Conservative
Conservative
Linear VA load spectrum with 20% omission level
103
104
105
102
106
107
Non-Conservative
Conservative
102 103 104 105 106 107
Al5083 Dcr=0.37S460N Dcr=0.27
y
x
z
O
q
n
b
a