Embed Size (px)
Citation preview

German Edition: DOI: 10.1002/ange.201914115Black Carbon Hot PaperInternational Edition: DOI: 10.1002/anie.201914115
The Molecular Composition of Soot**Rachelle S. Jacobson, Andrew R. Korte, Akos Vertes, and J. Houston Miller*
Abstract: Soot (sometimes referred to as black carbon) isproduced when hydrocarbon fuels are burned. Our hypothesisis that polynuclear aromatic hydrocarbon (PAH) moleculesare the dominant component of soot, with individual PAHmolecules forming ordered stacks that agglomerate intoprimary particles (PP). Here we show that the PAH compo-sition of soot can be exactly determined and spatially resolvedby low-fluence laser desorption ionization, coupled with high-resolution mass spectrometry imaging. This analysis revealedthat PAHs of 239–838 Da, containing few oxygenated species,comprise the soot observed in an ethylene diffusion flame. Asinformed by chemical graph theory (CGT), the vast majority ofspecies observed in the sampled particulate matter may bedescribed as benzenoids, consisting of only fused 6-memberedrings. Within that limit, there is clear evidence for the presenceof radical PAH in the particulate samples. Further, forbenzenoid structures the observed empirical formulae limitthe observed isomers to those which are nearly circular withhigh aromatic conjugation lengths for a given aromatic ringcount. These results stand in contrast to recent reports thatsuggest higher aliphatic composition of primary particles.
Introduction
In carbon chemistry, the aromatic moiety appears inscientific disciplines as disparate as astrophysics and bio-chemistry. Because of the high thermodynamic stability ofpolynuclear aromatic hydrocarbon (PAH) molecules, thesespecies have been identified in crude oil (including asphal-tenes), are persistent organic pollutants present in manyenvironmental soil and sediment samples, and are thought tobe the source of infrared (IR) emission bands associated withmany interstellar environments.[1] An additional character-istic of PAH thermodynamics is the large attractive potentialsbetween adjacent molecular sheets (5 kJmol�1/C atom) andthese p-p interactions contribute to condensed phase struc-tures throughout nature (e.g., DNA and protein structure).
Recent investigations, enabled by advances in bothexperimental and computational hardware, have revealedsubstantial details of the early chemistry of PAH growth aswell as structural characteristics of soot[2] in flames.[3] At thebeginning of the process, radical-molecule chemical mecha-nisms have been proposed for the formation of the first fewaromatic rings, leading to condensed, largely planar, struc-tures.[4] The physical structure of soot freshly emitted fromflames has been characterized as fractal aggregates, with radiiof gyration on the order of 100–400 nm, and composed ofprimary particles (PP) with diameters on the order of 10–50 nm.[5] Within these PP, high resolution TEM revealsdisordered stacks with fringe lengths on the order of 1 nmand fringe spacing approximately that of graphite (0.35 nm).[6]
Experimentally, greater challenges are presented by theintermediate stages of this process, particularly approachingthe transition from two- to three-dimensional structures.Work from several laboratories has presented data from bothextractive and in situ optical measurements that support ourhypothesized mechanism that individual PAH moleculesgrow chemically until they are sufficiently large that theywill agglomerate into ordered stacks and subsequently intodis-ordered clusters. The optical results coupled with compu-tational chemistry calculations of particle electronic proper-ties suggest that the size of these PAHs will be approximately1.0� 0.2 nm in diameter and, on average, fall in the 450–650 Da mass range.[7] Figure 1 illustrates the processes asdescribed above.
A limitation of recent measurements is that the results arerepresentative of either averaged properties of the molecularensemble comprising the particles,[8] or biased toward a subset
Figure 1. Schematic diagram of the proposed mechanism for forma-tion of soot particulate in flames.
[*] Dr. R. S. Jacobson, Dr. A. R. Korte, Prof. A. Vertes, Prof. J. H. MillerDepartment of Chemistry, George Washington University800 22nd St, NW, Suite 4000, Washington, DC 20052 (USA)E-mail: [email protected]
[**] Reports from several groups address the ambiguity in nomenclaturefor soot and black carbon. The analysis reported here describesparticles that most closely match the description of Buseck et al.with “ns-soot” used for carbon nanospheres of less than 100 nm indiameter. For readability, we will refer to the material analyzed as“soot”.
Supporting information and the ORCID identification number(s) forthe author(s) of this article can be found under:https://doi.org/10.1002/anie.201914115.
AngewandteChemieResearch Articles
4484 � 2020 Wiley-VCH Verlag GmbH & Co. KGaA, Weinheim Angew. Chem. Int. Ed. 2020, 59, 4484 – 4490

of molecules in the distribution.[9] In this work, we usespatially-resolved laser desorption ionization-mass spectrom-etry (LDI-MS) to provide the first direct, detailed chemicalcomposition of PAH molecules that comprise soot sampledfrom an atmospheric-pressure flame.
Results and Discussion
The observed laser desorption ionization (LDI)—massspectrometry (MS) spectra varied with flame position andanalytical conditions. Low-fluence interrogation of sampleson silicon wafer substrates yielded the most artifact-freespectra. Artifacts observed with higher fluence and on othersubstrates include hydrogen losses to parent ions and theformation of dimers, as verified by analysis of standard PAHsamples. A spectrum acquired under these conditions 20 mmabove the burner surface in the wing of the flame is shown inFigure 2A. This flame area is positioned between the regionrich in hydrocarbon intermediates formed directly from thefuel ethylene[10] and the high-temperature, radical-rich re-gion.[1] The highest particulate concentrations are observed inthese annular regions at this flame height, here illustrated bymeasured laser-induced incandescence profiles of soot (Fig-ure 2B).[11]
Prior laser-based MS measurements resulted in onlycarbon cluster ions being detected at higher m/z mass rangeobserved in high BC regions.[12] Our PAH distribution is
centered at higher mass values than previously reportedmolecular beam mass spectrometry (MBMS) or early lasermicroprobe mass spectrometry (LMMS) results. In additionto the sampling method, the two most significant differencesbetween the current study and others are the low laser fluence(3.2 mJcm�2) combined with a more sensitive, higher reso-lution imaging mass spectrometer. In one past report,substantially higher fluences (> 40 mJcm�2) were needed togenerate sufficient ion signal for detection.[13] Additionally,only one insertion of the sample substrate was required togenerate sufficient ion signal in the current study, potentiallydecreasing the contamination by other flame areas resultingfrom repeated insertions.
The high mass resolving power afforded by the Orbitrapanalyzer allows for the resolution of nearly isobaric species.This, combined with internal calibration of the spectra topreviously identified PAH ions, allows for the confidentassignment of molecular formulae based on accurate m/zmeasurements. The assigned molecular formulae are pre-dominantly hydrocarbon species, with comparatively fewoxygenated species detected. The potential incorporation ofoxygen within PAH molecules is of significant interest,particularly with regard to their environmental consequen-ces.[14] In this study, while a small number of low-abundanceions in some flame areas could potentially be assigned asoxygenated PAH, they were very weakly detected (< 5%relative abundance) and did not show coherent spatialdistributions corresponding to the physical flame shape and
Figure 2. A) Representative mass spectrum from 20 mm above the burner in the flame wing; B) computed contours of ethylene (magenta),acetylene (red), and hydrogen atom concentrations (green) as well as experimental profiles of laser induced incandescence (LII-blue) (1) nearbase of flame. C) Mass spectral ion intensity image of C28H14
+ (red), C42H16+ (green), C50H18
+ (blue). Mass spectrum reported in part (A) collectedin region outlined by a yellow box.
AngewandteChemieResearch Articles
4485Angew. Chem. Int. Ed. 2020, 59, 4484 – 4490 � 2020 Wiley-VCH Verlag GmbH & Co. KGaA, Weinheim www.angewandte.org

thus may be background- or noise-related. Flames whereoxygenated-aromatic species have been identified have beenburned in a premixed configuration, where the oxygenavailability during molecular growth is typically much greater,or in oxygen-rich (and high temperature) regions of counter-flow diffusion flames where phenols, ethers, and furan-embedded species have been observed.[15]
Spectra acquired from the annular region 20 mm abovethe burner revealed a symmetric distribution of PAH ionsaround the flame�s centerline and were comprised entirely ofsingly-charged ions. The arithmetic mean mass of these PAHmolecules was 534.7 Da, whereas the mean weighted byabsolute ion intensity was 535.6 Da, confirming the symmetricpeak distribution. PAHs detected at this flame positionranged in mass from 239.0855–801.1638 Da. Mean PAH m/zand m/z ranges for other flame regions are shown in Table 1.
Figure 2C shows the spatial distribution of three ionswithin the lower, annular (wing) flame region: C28H14
+ (red),C42H16
+ (green), C50H18+ (blue). These molecules most likely
correspond to benzocoronene, circumpyrene, and a seven-teen-ring structure with many possible isomers. While thelarger C42H16
+ and C50H18+ molecules are more localized to
the flame wing area, the smaller C28H14+ is detectable in the
inner flame region as well. The yellow box indicates the pixelsaveraged to produce the spectrum shown in Figure 2A. It canbe seen from this spectrum that at this position, there are bothodd- and even-carbon numbered PAH identified in thespectrum, though in other laser-based studies, even-carbonnumbered PAH dominate the spectrum.[13] In work byHomann, PAH ions that were sampled directly from a flamewithout being separately ionized also showed similar distri-butions of intensities between odd- and even-carbon num-bered PAH.[16]
At height above burner (HAB) = 20 and 25 mm, highPAH ion intensities are observed in the flame wing area, nearthe boundary between fuel and air. This distribution isconsistent with profiles produced using other experimental
techniques as well as direct numerical simulation of this flame(Figure 2B). Conversely, along the centerline the ion abun-dance from PAH molecules increases as the HAB isincreased. Compared with the annular region, we observea shift in m/z range to lower molecular weight PAH species inthe central flame area at HAB = 25–30 mm with a narrowerdistribution of molecular size. At HAB = 25 mm and below,in situ measurements of soot volume fraction are unable tomeasure particulate near the centerline of the flame. The lackof larger PAH molecules in the center is likely the result oflower localized abundance of species critical to PAH growth,such as hydrogen atoms (shown in Figure 2B) or otherrelevant small radical hydrocarbons.
A comprehensive view of PAH molecules observed atdifferent flame positions is shown in Figure 3, with a summaryof the mass distribution statistics presented in Table 1. As can
be seen from this plot, the flame areas with thegreatest overall ion abundances correspond well withother measurements of soot particulate by in situtechniques. It is also apparent that ions with thegreatest abundance are similarly distributed betweeneven- and odd-carbon numbered PAH. In all theplots shown in Figure 3, there is a nearly normaldistribution of peaks with a given number of hydro-gens as the number of carbons is varied. This trend issimilar to Homann�s observations from native MSmeasurements of PAH in a low pressure flame,where these distributions were compared with struc-tures that, in the authors� words, were “the max-imally condensed arrangement of aromatic rings”.[16]
Another important observation is the high con-centrations of odd-carbon numbered PAH in mostflame areas, especially as the soot volume fractionincreases. PAH containing an odd number of hydro-gen atoms, without side chains, are usually freeradicals. It is possible that their observation isa sampling artefact, but there is precedence for theirobservation in analogous measurements.[13,17] Odd-
carbon and odd-electron PAH are often fully benzenoid,although possible structures may incorporate 5-memberedring(s) or an ethynyl side chain into the structure. Forexample, the most likely molecular structure of C47H17 isa fully peri-condensed 16-ring system, with one possibleisomer shown in Table S1.
Additional insight into PAH structures is offered bycomparing the observed distributions with two limits of PAHstructure in common use in the literature: cata- and peri-condensed PAH. In a classic definition reported by Birks,[18]
cata-condensed PAH are those in which no carbon atom isshared by more than two aromatic rings. Further, thesestructures are given the empirical formula C(4i+2)H(2i+4), wherei is the number of aromatic rings. Examples of cata-condensedPAH include the acenes, the phenacenes, and many highly-branched ring structures such as the acenographynes.[19] Thecata-condensed limit is shown as the dashed line in thedistribution plots shown in Figure 3. Peri-condensed PAHallow for carbon atoms to be shared by more than 2 rings, andthis class of molecules plays a role in structures of manycarbon-based materials including fullerenes, nanotubes, nano-
Table 1: Summary of m/z values across a series of specific flame locations. Valuesincluded in this tabulation were present in all three replicates measured, andintensities were averaged across replicates.
Flame Position Arithmeticmean
Weightedmean
Minimumm/z
Maximumm/z
HAB 20 left wing 553.8 545.0 239.0855 838.1716centerline 350.1 350.1 350.1090 350.1090right wing 534.7 535.6 239.0855 801.1638
HAB 25 left wing 534.6 530.6 239.0855 801.1638centerline 479.6 466.6 276.0934 679.1481right wing 541.7 534.4 239.0855 814.1716
HAB 30 left wing 540.4 523.1 239.0855 805.1951centerline 509.7 482.9 239.0855 779.1794right wing 529.3 519.7 239.0855 764.1560
HAB 35 left wing 521.7 517.2 300.0934 764.1560centerline 557.6 541.9 239.0855 827.1794right wing 474.0 473.1 276.0934 681.1638
AngewandteChemieResearch Articles
4486 www.angewandte.org � 2020 Wiley-VCH Verlag GmbH & Co. KGaA, Weinheim Angew. Chem. Int. Ed. 2020, 59, 4484 – 4490

flakes, graphene, and graphite. The “maximally-condensed”molecules referenced by Homann comprise a homologousseries of peri-condensed species with 6 free edges and varyinglengths of “zig-zag”[7a] edges joining them. This series is shownin the distribution plots of Figure 3 as solid lines. Observedspecies that are below this peri-condensed curve mayrepresent structures with 5-membered rings[20] or ethynyl sidechains added to peri-condensed PAHs. In their high resolu-tion AFM study of soot, Commodo et al.[20c] report both PAHwith five-membered rings as well many PAH with aliphaticbranches, predominantly methyl groups, although they notethe presence of sp3 methylene groups in some of the pentarings.
There are some notable differences in both flame systemand sampling protocol between the present study and theCommodo et al. reference.[20c] The distributions revealed inour LDI-MS experiments lie much closer to the highly-condensed limit than the cata-condensed line. Further, thepresence of side chains with sp2 or sp3 bonded carbons wouldonly shift species� empirical formulae to lower C/H ratios,which is not supported by this data.
Another approach for teasing out structural insight aboutthe collected particulate is available from chemical graphtheory (CGT). The connections between graph theory andchemical structure and isomer enumeration date to the mid-19th century and are often attributed to the English mathe-matician Cayley.[21, 22] In the ensuing 150 years, quantummodels for atomic and molecular electronic structureemerged and were subsequently validated by spectroscopy,computational chemistry, and even atomic scale imaging.Mathematicians and chemists have returned to the topicrepeatedly and have continued to find the formalisms of CGTvaluable in rationalizing observed properties at every molec-ular scale. Perhaps because of its intimate connection withhexagonal tiling, no chemical bonding category has receivedmore attention than the structure of polynuclear aromatichydrocarbons. (The reader is referred to the essential reviewof Randic[22]) Throughout this rich history, Kekul�, H�ckel,Pauling, and Clar[7a] have often been recognized for theircontributions to the understanding of aromatic structure.
Over the last several decades, the work of Dias[23] andBrunvoll and Cyvin[24] should also be recognized for theirextensive contributions to the application of CGT to our
Figure 3. Distribution of PAH at four heights above the burner and three radial locations. Values included were present in all three replicatesmeasured and intensities were averaged across replicates. The coloration of each plot corresponds to the averaged absolute intensity of each ionin that flame area. Also shown are C/H correlations for cata-condensed (dashed) and peri-condensed (solid) PAH structures. A map of thesampling locations is shown in Figure S2.
AngewandteChemieResearch Articles
4487Angew. Chem. Int. Ed. 2020, 59, 4484 – 4490 � 2020 Wiley-VCH Verlag GmbH & Co. KGaA, Weinheim www.angewandte.org

understanding of PAH bonding and structure. Using themathematical tools developed in these references, importantlimits emerge to confine the structure of molecules observedin the data obtained in the current experiments. As anexample, we consider one of the mass spectra collected at35 mm HAB in the wings of the flame. In this spectrum, thereare approximately 180 identified m/z peaks (with intensitiesbetween 4200 and 86000). The vast majority of these haveempirical formulae consistent with fully benzenoid hydro-carbons. Specifically, for a hydrocarbon of formula CnHs,benzenoid species will satisfy where quantities within thecurly brackets [Eq. (1)] are rounded up to the nearest integer.
Since the seminal work of Stein and Fahr[25] that definedthe most thermodynamic structure for a molecule with a giveninventory of carbon and hydrogen atoms, there has beennearly continuous debate about whether molecular growth isthermodynamically vs. kinetically limited. The consensus isthat it may have elements of both in the sense that radical-initiated growth chemistry leads to larger, and more stablebenzenoid PAH.[26] However, more recent literature suggeststhe importance of PAH structures which include five-mem-bered rings. When either one (fluoranthenoids) or two(indacenoids) five membered rings are included in a PAHstructure, the number of possible isomers increases dramat-ically,[27] indicative of the statistically greater ways to producethese structures from smaller PAH. This conjecture has beenborne out using the kinetic Monte Carlo variant known asstochastic nanoparticle simulator (SNAPS), which tracks thegrowth of individual PAH where reactivity is informed byatom type, bonding environment, and steric considerations.When applied to PAH growth chemistry, SNAPS producesmany PAH with five-membered rings,[28] both at the PAHperiphery and embedded in six-membered rings. Further,PAH with five-membered rings have been observed in samplesdrawn from low-pressure flames.[29] Nonetheless, the consensusis that PAH with five-membered rings are not as stable as fullybenzenoid structures[27] and it has been shown that interiorcarbon atoms in benzenoids are substantially more chemicallyinert than interior carbons in curved PAH (which occur withembedded five-member rings structures).[30]
For benzenoid structures, Brunvoll and Cyvin[24] providea great deal of additional limitations on and insights intostructures based solely on empirical formula. For example,relationships are drawn for the number of internal carbonatoms, ni ; the number of hexagonal rings, h ; and the numbersof isomers, both Kekul�an (closed shell) and non-Kekul�an(radicals). Finally, they provide an extensive discussion onwhat they refer to as the Dias Parameter, ds, suggested byDias to be a count of tree disconnections where “trees” areconstructed from lines connecting internal carbon atoms.Brunvoll and Cyvin[24] show how the Dias parameter can becalculated directly from the empirical formula CnHs from[Eq. (2)]:
The Dias Parameter is 0 when there are no disconnections,positive when there are, and negative for branched treeswhich occur when there are extensive networks of interiorcarbons. As an example, consider several 6-ring moleculeswhich were observed in our mass spectra: C24H12 (coronene),C25H13, C26H14, C27H15. All of the isomers of the odd-carbonspecies are radicals (as well as a small number of the isomersof the even-carbon species). The number of possible isomers(1, 3, 10, and 5, respectively[31]) grows with ds (�1, 0, 1, and 2)while it is observed that the MS intensity is greater for the lowds molecules (10 365, 26 997, 5226, and 8558, respectively)despite the statistically smaller number of structures thatsatisfy the empirical formula for low ds. The same trends areseen for groups containing higher numbers of rings observedin our spectra (See Supporting Information, Figure S3).
The Dias parameter may also be viewed in the context ofother measures of bonding and stability in aromatic moleculesthat have appeared over the last several decades including thework of Stein and Fahr[25] as well as structural classificationsbased on the work of Clar.[3] Specifically, compact, nearlycircular structures will have the lowest ds, the greatest numberof aromatic sextets, and are also the most thermodynamicallystable (Figure S4).
Our results challenge observations of some recent experi-ments as well as proposed models for incipient particlestructure in which incipient particles are suggested to haveboth aromatic and aliphatic carbon bonding.[32] In a recentcontribution by Johansson et al., the authors propose a mech-anism for the inception of particles (clustering of hydro-carbons by radical-chain reactions, CHRCR) that formincipient particles with aromatic islands connected by ali-phatic side chains[32b] surrounding a highly branched, largecentral molecule. They further propose that these incipientparticles serve as active sites for chemisorption of smallhydrocarbons that would lead to PP with more aliphatic thanaromatic surface character. We did not observe “seed”molecules with structures similar to that proposed by theCHRCR mechanism in this study. However, we cannot ruleout the possibility that these molecules exist in concentrationstoo low to be detectable by our protocol.
The contradiction between our current results and thosesuggesting more aliphatic composition of primary particlesremains an important topic for continued investigations. Oneof the motivations for the development of the CHRCR modelwas the lack of experimental evidence for sufficiently highconcentrations of large monomer PAH in flames to explainobserved primary particle concentrations, a conclusion madeby us in an early calculation of the equilibrium constant forthe dimerization constant for PAH.[33] In subsequent publica-tions, we qualified this conclusion by noting that sufficientlylarge PAH will physically condense at temperatures charac-teristic of soot formation in diffusion flames.[26b] Severalrecent studies have placed the limit for the physical agglom-eration of PAH at sizes even larger (> 700 Da) than observedhere.[34] This has led to suggestions that more complexchemistry may play a role in in PP formation including
AngewandteChemieResearch Articles
4488 www.angewandte.org � 2020 Wiley-VCH Verlag GmbH & Co. KGaA, Weinheim Angew. Chem. Int. Ed. 2020, 59, 4484 – 4490

aromatic excimer formation[35] (perhaps with aliphatic link-ages[36]) through radical[37] (or diradicals[38]), or “rim-bond-ing”.[39] The data presented here, as well as in contemporarystudies showing evidence for PAH clustering,[40] providesproof that species of sufficient size are present and that theirsize is consistent with the conjugation length inferred by bothRaman scattering and optical band gap measurementsobserved in the same burner/flame system.[7b, 8]
Conclusion
In this article we have presented the results of low-fluence, laser desorption ionization, coupled with high-resolution mass spectrometry analysis and imaging of partic-ulate collected from a hydrocarbon flame. The mass spectraand subsequent analysis reveal that the particulate is com-prised predominately of medium (� 300–800 Da), highlycondensed structures.
Additional insight to PAH structure in these measure-ments is found in the application of chemical graph theory.The vast majority of species observed in the sampledparticulate matter are consistent with fully benzenoid mor-phology, consisting of fused 6-membered rings. Further,within a group of molecules with a common number ofaromatic rings, species with low Dias Parameters dominatethe observed spectra, despite the fact that low ds moleculeshave fewer isomeric structures and this observation is morepronounced as the number of rings increases. This observa-tion reinforces the importance of resonant stability inobserved PAH distributions. Finally, CGT analysis providesclear evidence for the presence of radical PAH in theparticulate samples and suggests the dominance of highlycondensed aromatic structures in flame particulate.
Experimental Section
Experimental Details. A 60% ethylene in nitrogen-fueled, co-axial diffusion flame was investigated in this work, where the fuel/nitrogen mixture enters from a central fuel nozzle surrounded bya concentric flow of air. This flame system has been studiedextensively by our group and others using several experimentaltechniques, including laser induced incandescence (LII), TEM,Raman spectroscopy, and light extinction, along with correspondingcomputational models.[7b, 8,41] In this work, particulate from the flamewas thermophoretically sampled onto silicon wafer substrates. Thesubstrates were inserted into the center of the axially symmetricflame, and the resulting deposition pattern provided a map of sootcomposition that may be compared with radial distribution ofmolecular and condensed-phase species measured by other tech-niques (Figure 2). Some asymmetry is observable between the leftand right sides of the flame. This may be due to small differencesintroduced during the thermophoretic sampling in that as thesampling substrate is inserted its “left” side of the substrate isexposed to both soot growth regions of the flame whereas the “right”side is only exposed to one. Additionally, the temperature of thesubstrate�s left side may be higher due to a longer flame exposure,which may have an effect on thermophoretic deposition. Aftersampling, the wafers were analyzed by laser desorption ionization(LDI)-mass spectrometry (MS) imaging with a mass spectrometercapable of high mass resolution and accurate mass measurements. It is
important to note that a significant difference between molecularbeam (MB)MS and LDI-MS techniques in the measurement of soot isthat the material phase is different (gas and condensed, respectively).This difference results in low-mass PAH being undetectable in thiswork due to their volatility under our analytical conditions. Thespeciation of these lower mass compounds has been reported byseveral prior investigations.[13, 42] Vertical sampling accuracy waslimited to � 5 mm due to instability in the sampling rig, whereasradial information is limited by the raster pitch of the subsequentLDI-MS analysis (200 mm) as well as profile-broadening that mightoccur during sampling.
The ability of LDI-MS to provide chemical information wasinvestigated at a range of laser fluences and with soot captured onseveral substrates.[43] For all substrate materials, the resulting LDI-MSspectra varied with flame position and analytical conditions. Low-fluence interrogation of samples on silicon wafer substrates yieldedthe most artifact-free spectra. Artifacts observed with higher fluenceand on other substrates include hydrogen losses from parent ions andthe formation of dimers, as verified by analysis of pure PAHstandards. A spectrum acquired at low laser fluence from sootcaptured on silicon 20 mm above the burner surface in the wing of theflame is shown in Figure 2A. This flame area lies between the regionrich in hydrocarbon intermediates formed directly from the fuelethylene[10] and the high-temperature, radical-rich region. The highestparticulate concentrations are observed in these annular regions lowin this flame, here illustrated by measured laser-induced incandes-cence profiles of soot (Figure 2B).[11]
Prior laser-based MS measurements resulted in only carboncluster ions being observed in high soot regions.[44] Our PAHdistribution is centered at higher mass values than previouslyreported MBMS or early LMMS results. In addition to the samplingmethod, the two most significant differences between the currentstudy and others are the low laser fluence (3.2 mJcm�2) combinedwith a more sensitive, and higher-resolution imaging mass spectrom-eter. In one past report, substantially higher laser fluences were usedfor LDI For example, in one manuscript, substantially higher fluences(> 40 mJcm�2) were needed to generate sufficient ion signal fordetection.[13] Given the artifacts introduced by elevated fluencesobserved with PAH standards (dimerization and dehydrogenation), itis likely that reduced fluences provide better characterization of thecaptured material. The high mass resolving power of the Orbitrapanalyzer allows for the resolution of nearly-isobaric species. This,combined with accurate m/z measurements improved by internalcalibration to previously identified PAH ions, allows for the confidentassignment of molecular formulae.
Acknowledgements
The authors would like to thank Jennifer A. Giaccai forhelpful discussions and Monica M. Flores for helping withexperimental logistics. Partial support for this project wasprovided by the National Science Foundation CBET programthrough grants CBET-0828950, CBET1142284, and CBET-1706757 with Drs. Song Charng-Kong, Arvind Atreya, Ruey-Hung Chen, and Harsha Chelliah serving as TechnicalMonitors.
Conflict of interest
The authors declare no conflict of interest.
AngewandteChemieResearch Articles
4489Angew. Chem. Int. Ed. 2020, 59, 4484 – 4490 � 2020 Wiley-VCH Verlag GmbH & Co. KGaA, Weinheim www.angewandte.org

Keywords: black carbon · laser desorption ionization ·mass spectrometry · polynuclear aromatic hydrocarbons · soot
How to cite: Angew. Chem. Int. Ed. 2020, 59, 4484–4490Angew. Chem. 2020, 132, 4514–4520
[1] L. J. Allamandola, A. G. G. M. Tielens, J. R. Barker, Astrophys.J. Suppl. Ser. 1989, 71, 733 – 775.
[2] P. R. Buseck, K. Adachi, A. Gelencs�r, �. Tompa, M. P�sfai,Atmos. Chem. Phys. Discuss. 2012, 12, 24821 – 24846.
[3] �. �. Kçyl�, G. M. Faeth, T. L. Farias, M. G. Carvalho, Combust.Flame 1995, 100, 621 – 633.
[4] M. Frenklach, Phys. Chem. Chem. Phys. 2002, 4, 2028 – 2037.[5] M. Alf, B. Apicella, R. Barbella, J. N. Rouzaud, A. Tregrossi, A.
Ciajolo, Proc. Combust. Inst. 2009, 32, 697 – 704.[6] M. L. Botero, E. M. Adkins, S. Gonzlez-Calera, H. Miller, M.
Kraft, Combust. Flame 2016, 164, 250 – 258.[7] a) E. M. Adkins, J. H. Miller, Phys. Chem. Chem. Phys. 2017, 19,
28458 – 28469; b) E. M. Adkins, J. H. Miller, Phys. Chem. Chem.Phys. 2015, 17, 2686 – 2695; c) E. Adkins, J. Giaccai, J. Miller,Proc. Combust. Inst. 2019, 37, 903 – 910.
[8] J. D. Herdman, B. C. Connelly, M. D. Smooke, M. B. Long, J. H.Miller, Carbon 2011, 49, 5298 – 5311.
[9] E. M. Adkins, J. A. Giaccai, J. H. Miller, Proc. Combust. Inst.2017, 36, 957 – 964.
[10] K. C. Smyth, J. H. Miller, R. C. Dorfman, W. G. Mallard, R. J.Santoro, Combust. Flame 1985, 62, 157 – 181.
[11] M. D. Smooke, M. B. Long, B. C. Connelly, M. B. Colket, R. J.Hall, Combust. Flame 2005, 143, 613 – 628.
[12] R. A. Dobbins, Combust. Flame 2002, 130, 204 – 214.[13] R. A. Dobbins, R. A. Fletcher, H. C. Chang, Combust. Flame
1998, 115, 285 – 298.[14] K. O. Johansson, T. Dillstrom, M. Monti, F. El Gabaly, M. F.
Campbell, P. E. Schrader, D. M. Popolan-Vaida, N. K. Richards-Henderson, K. R. Wilson, A. Violi, H. A. Michelsen, Proc. Natl.Acad. Sci. USA 2016, 113, 8374 – 8379.
[15] Q. Wang, P. Elvati, D. Kim, K. O. Johansson, P. E. Schrader,H. A. Michelsen, A. Violi, Carbon 2019, 149, 328 – 335.
[16] K. H. Homann, Angew. Chem. Int. Ed. 1998, 37, 2434 – 2451;Angew. Chem. 1998, 110, 2572 – 2590.
[17] a) A. G. Marshall, R. P. Rodgers, Proc. Natl. Acad. Sci. USA2008, 105, 18090; b) S. M. Miladinovic, V. De Vriendt, S. A.Robotham, F. Maseri, S. Lucas, C. L. Wilkins, J. Am. Soc. MassSpectrom. 2010, 21, 411 – 420.
[18] J. B. Birks, Photophysics of Aromatic Molecules, Wiley-Inter-science, New York, 1970.
[19] F. Cataldo, O. Ori, M. V. Putz, ECS Trans. 2018, 26, 535 – 544.[20] a) R. Whitesides, M. Frenklach, J. Phys. Chem. A 2010, 114, 689 –
703; b) A. Raj, M. Celnik, R. Shirley, M. Sander, R. Patterson, R.West, M. Kraft, Combust. Flame 2009, 156, 896 – 913; c) M.Commodo, K. Kaiser, G. De Falco, P. Minutolo, F. Schulz, A.D’Anna, L. Gross, Combust. Flame 2019, 205, 154 – 164.
[21] A. Cayley, London Edinburgh Philos. Mag. J. Sci. 1857, 13, 172 –176.
[22] M. Randic, Chem. Rev. 2003, 103, 3449 – 3606.[23] a) J. R. Dias, J. Mol. Struct. THEOCHEM 1986, 137, 9 – 29; b) J.
Dias, J. Mol. Struct.: THEOCHEM 1986, 137, 9 – 29.[24] J. Brunvoll, S. Cyvin, Z. Naturforsch. A 1990, 45, 69 – 80.[25] S. E. Stein, A. Fahr, J. Phys. Chem. 1985, 89, 3714 – 3725.[26] a) M. Frenklach, D. W. Clary, W. C. Gardiner, S. E. Stein, Symp.
Combust. [Proc.] 1985, 20, 887 – 901; b) J. H. Miller, Symp.Combust. [Proc.] 1991, 23, 91 – 98.
[27] J. R. Dias, Polycyclic Aromat. Compd. 2014, 34, 177 – 190.[28] J. Y. W. Lai, P. Elvati, A. Violi, Phys. Chem. Chem. Phys. 2014,
16, 7969 – 7979.[29] N. Hansen, M. Schenk, K. Moshammer, K. Kohse-Hçinghaus,
Combust. Flame 2017, 180, 250 – 261.[30] L. T. Scott, Chem. Soc. Rev. 2015, 44, 6464 – 6471.[31] J. Brunvoll, S. J. Cyvin, Z. Naturforsch. A 1990, 45, 69.[32] a) K. O. Johansson, F. El Gabaly, P. E. Schrader, M. F. Campbell,
H. A. Michelsen, Aerosol Sci. Technol. 2017, 51, 1333 – 1344;b) K. O. Johansson, M. P. Head-Gordon, P. E. Schrader, K. R.Wilson, H. A. Michelsen, Science 2018, 361, 997; c) H. Wang,Proc. Combust. Inst. 2011, 33, 41 – 67.
[33] J. H. Miller, K. C. Smyth, W. G. Mallard, Symp. Combust. [Proc.]1985, 20, 1139 – 1147.
[34] T. S. Totton, A. J. Misquitta, M. Kraft, Phys. Chem. Chem. Phys.2012, 14, 4081 – 4094.
[35] J. H. Miller, Proc. Combust. Inst. 2005, 30, 1381 – 1388.[36] R. A. Krueger, G. Blanquart, Phys. Chem. Chem. Phys. 2019, 21,
10325 – 10335.[37] G. Vitiello, G. De Falco, F. Picca, M. Commodo, G. D’Errico, P.
Minutolo, A. D’Anna, Combust. Flame 2019, 205, 286 – 294.[38] H. Wang, Proc. Combust. Inst. 2011, 33, 41 – 67.[39] J. W. Martin, D. Hou, A. Menon, L. Pascazio, J. Akroyd, X. You,
M. Kraft, J. Phys. Chem. C 2019, 123, 26673 – 26682.[40] a) J. Happold, H.-H. Grotheer, M. Aigner, Rapid Commun.
Mass Spectrom. 2007, 21, 1247 – 1254; b) F. Carbone, A. Lambe,J. Jayne, D. Worsnop, A. Gomez, Proc. Combust. Inst. 2018, 37;c) F. Carbone, M. R. Canagaratna, A. T. Lambe, J. T. Jayne,D. R. Worsnop, A. Gomez, Proc. Combust. Inst. 2019, 37, 919 –926.
[41] a) B. C. Connelly, B. A. V. Bennett, M. D. Smooke, M. B. Long,Proc. Combust. Inst. 2009, 32, 879 – 886; b) N. J. Kempema, M. B.Long, Combust. Flame 2016, 164, 373 – 385; c) N. J. Kempema, B.Ma, M. B. Long, Appl. Phys. B 2016, 122, 232; d) B. Ma, M. B.Long, Appl. Phys. B 2014, 117, 287 – 303.
[42] a) A. Faccinetto, P. Desgroux, M. Ziskind, E. Therssen, C. Focsa,Combust. Flame 2011, 158, 227 – 239; b) N. Hansen, M. Schenk,K. Moshammer, K. Kohse-Hoinghaus, Combust. Flame 2017,180, 250 – 261.
[43] R. S. J. Golden, George Washington University (WashingtonDC), 2019.
[44] R. A. Fletcher, R. A. Dobbins, H. C. Chang, Anal. Chem. 1998,70, 2745 – 2749.
Manuscript received: November 5, 2019Accepted manuscript online: January 9, 2020Version of record online: January 30, 2020
AngewandteChemieResearch Articles
4490 www.angewandte.org � 2020 Wiley-VCH Verlag GmbH & Co. KGaA, Weinheim Angew. Chem. Int. Ed. 2020, 59, 4484 – 4490

Research Articles
Black Carbon
R. S. Jacobson, A. R. Korte, A. Vertes,J. H. Miller* &&&— &&&
The Molecular Composition of Soot
The dominant component of soot: Lowfluence, imaging, laser desorption/ioni-zation mass spectrometric analysis wasperformed on thermophoretically-sam-pled particulate carbon sampled froma laboratory, non-premixed flame. Thedata reveals that the majority of themolecular composition of soot can becharacterized as fused, six-memberedrings polynuclear aromatic hydrocarbons.
AngewandteChemieResearch Articles
&&&&Angew. Chem. Int. Ed. 2020, 59, 2 – 9 � 2020 Wiley-VCH Verlag GmbH & Co. KGaA, Weinheim www.angewandte.org
These are not the final page numbers! � �

Supporting Information
The Molecular Composition of Soot**Rachelle S. Jacobson, Andrew R. Korte, Akos Vertes, and J. Houston Miller*
ange_201914115_sm_miscellaneous_information.pdf

1
This PDF file includes:
Materials and Methods
Supplementary Text
Figs. S1 to S4
Tables S1

2
Materials and Methods
Substrate Materials
Low resistivity (0.005-0.020 cm) boron-doped p-type silicon wafers were purchased from
Silicon Valley Microelectronics, Inc. (Santa Clara, CA). Wafers were 525 25 m thick and
were received polished on one side. The polished side was used without further cleaning. Prior to
sampling, round wafers were hand cut with a diamond pen into pieces ~1 cm tall and ~2 cm
wide.
Burner and Flame Specifications
The burner specifications are available through the International Sooting Flame (ISF) workshop
website (https://www.adelaide.edu.au/cet/isfworkshop/). Briefly, the burner consisted of a
vertical fuel tube (4 mm I.D.) surrounded by a concentric air co-flow (74 mm I.D.). The cold
flow velocity for total fuel and oxidizer was set to 35 cm/s. In these measurements, only the 60%
ethylene, 40% nitrogen dilution was used. The resulting flame was lifted ~3 mm from the burner
surface and the tip of the flame was ~5 cm from the top of the burner. Ethylene (99.9%) and
nitrogen (99.995%) gases were acquired from Roberts Oxygen (Rockville, MD). The co-flowing
air was supplied by an in-house compression system.
Thermophoretic Sampling
The thermophoretic sampling rig used in these experiments was also used in an earlier
work by our group (1). The sampling process is enabled by a pneumatic slide (Omega
Engineering, Inc., Norwalk, CT, DLM-09M-50-50-P), with a movement range of 50.8 mm.
Extension and retraction are achieved by a system of solenoid and relays (Omega Engineering,
Inc., Norwalk, CT, OM-Air-C2VA0045 and SSR330DC10, respectively), which are controlled
by a NIDAQ (National Instruments, Austin, TX, SCB-68) via a homebuilt LabView program.
A custom machined sample holder was constructed from two stainless steel rods to hold the
silicon wafer pieces directly. A schematic of the sample holder is shown in Fig. S1. A 12.7 mm
diameter rod, 304 mm long, was clamped to a pneumatic slide with <30 mm extended. All
sections of the sample holder to the left of the 12.7 mm rod were constructed from a solid piece
of stainless steel. An identical copy of the flattened 46 mm (left) were machined from a second
piece and affixed with two set screws to directly hold the silicon wafer. The total thickness of
both pieces together is 1.5 mm. The silicon wafer substrates were positioned between these two
plates and the screws were tightened. Due to the thickness of the silicon wafer, a small piece of
wire was also used to increase the grip of the sample holder on the wafer substrates.
The pneumatic slide, clamps, and sample holder were all positioned using construction rails
(Thorlabs, XE25) and an optical breadboard (Thorlabs, MB8). Video monitoring of sampling
processes was achieved with a 240 fps camera; thus, the temporal resolution is limited to one
frame every 4.2 ms. Sampling times were all set to 400 ms, though the total flame interaction
time was 250 36 ms. The sampling process encompassed four distinct steps: entering the
flame, vertical vibration phase, staying stationary, and exiting the flame. Average sampling times
for each of these steps are 47 6, 49 4, 89 11, and 66 14 ms, respectively.
Immediately after exposure to the flame environment, each piece of silicon wafer was
taped to a commercial MALDI-MS sample plate using double-sided carbon tape (Ted Pella, Inc.,
Redding, CA). The carbon tape has been shown not to contribute to MS signal unless directly
exposed to laser radiation, which was avoided here. Samples were exposed to air for less than

3
one hour. They were taken directly to the mass spectrometer source and inserted into the vacuum
chamber.
Laser Desorption Ionization Mass Spectrometry Imaging
All measurements were made on a MALDI-LTQ-Orbitrap XL mass spectrometer (Thermo
Scientific, San Jose, CA) in positive ion mode. This instrument is equipped with an intermediate-
pressure (75 mTorr) MALDI source, which includes a nitrogen laser emitting 337 nm light with
4 ns pulse width and a repetition rate of 60 Hz. The laser beam interacts with the sample at an
angle of 32° from the normal, in the reflection geometry configuration. The laser power is
precisely controlled via software and is continuously monitored, with one 50% neutral density
filter in the beam path. All acquisitions were performed using 10 laser shots per spectrum. All
spectra were acquired in the Orbitrap analyzer with a resolving power setting of 100,000, though
the resolution is m/z dependent. Due to tradeoffs in ion transfer optics settings, the instrument
loses sensitivity when an overly wide range is selected; therefore, the acquisition range was
limited to m/z 150-1000 after preliminary experiments confirmed no ions were observed outside
that range.
Mass spectra were acquired using the control software MS imaging mode. In this mode, the
sampling laser is rastered in discrete steps over the desired area and a spectrum is recorded at
each of a series of x,y positions (pixels). From these spectra and the corresponding x,y positions,
maps of the distribution of specific ions can be generated. The imaging step size describes the
distance the sample plate moves between pixels. The laser spot is roughly elliptical (100 m 80
m), but a step size of 200 m was used as preliminary experiments showed no significant
increase in spatial information when lower step sizes were used and features < 200 m were not
observed.
Much attention was paid to the laser fluence used in these experiments. After extensive
investigation with small PAH standards, it was determined that 0.2 J of laser energy,
corresponding to a fluence of 3.2 mJ/cm2, delivered to the sample resulted in no significant
dimerization or fragmentation on when the sample was placed on silicon wafer substrates. Only
molecular ions were observed.
Silicon nanopost arrays (NAPA) were also tested as a substrate for laser desorption
ionization mass (2, 3). Due to the scale of the silicon nanoposts, the thermal stability of these
structures might be expected to not hold up to flame insertion. Additionally, there was no
discernable difference between mass spectra recorded on flat wafers and NAPA areas. Given the
highly aromatic nature of PAHs, energy from the UV laser used here is absorbed by the analytes
leading to ion production without the need for an external medium or matrix.
Data Analysis
Data was extracted from localized sample positions, representing soot from corresponding
flame areas, using ImageQuest software (Thermo Scientific, San Jose, CA). Resulting spectra
were imported to mMass for peak identification (http://www.mmass.org/donate/papers.php). A
list of six PAH were used to apply a slight mass calibration, restricted to a 5 ppm mass window.
After calibration, the spectral features were compared to a list of theoretical m/z values for all
possible combinations of 100 carbon atoms, 100 hydrogen atoms, and up to 4 oxygen atoms. In
this mass range, restricting the number of carbon and hydrogen atoms available for accurate

4
mass matching can bias the results leading to identified peaks with unrealistically high oxygen
content (4).
Review of Possible Biases in Analytical Technique
A possible concern in these measurements is potential to bias the observed ion signals to
either lower or higher mass species. At the low fluence used for these measurements, however,
these effects were determined to be minimized by measuring standard PAH species ≤300 Da.
Additionally, low-mass PAH species (<230 Da) were not observed because of their high
volatility. Analytical standards were not available for large PAH molecules to evaluate the
stability of these molecules in our experiments. Previous work, however, does not suggest a
significant bias away from stable, high mass molecules such as PAH larger than those observed.
(5)

5
Fig. S1.
Schematic diagram of the substrate holder for the thermophoretic sampling process. All values
are in mm. The flattened areas on the left are 1.5 mm thick in total, whereas the round rods in the
center and right are cylindrical, therefore their diameters are provided.

6
Fig. S2.
Map of sampling locations whose data is shown in the manuscript’s Figure 3 superimposed on a
false color image of soot particle volume fraction as determined by laser-induced incandescence
(6).

7
Fig. S3
Laser desorption mass spectral intensity observed at 35 mm above the flame on the right
“wing” as a function of Dias Parameter for selected, constant aromatic ring counts.

8
Fig. S4
Illustration of structural changes with Dias Parameter for selected 10 ring compounds. Note
that there is only 1 isomer for DS= -2, 42 isomers for DS=0, and 416 isomers for DS=2.
9
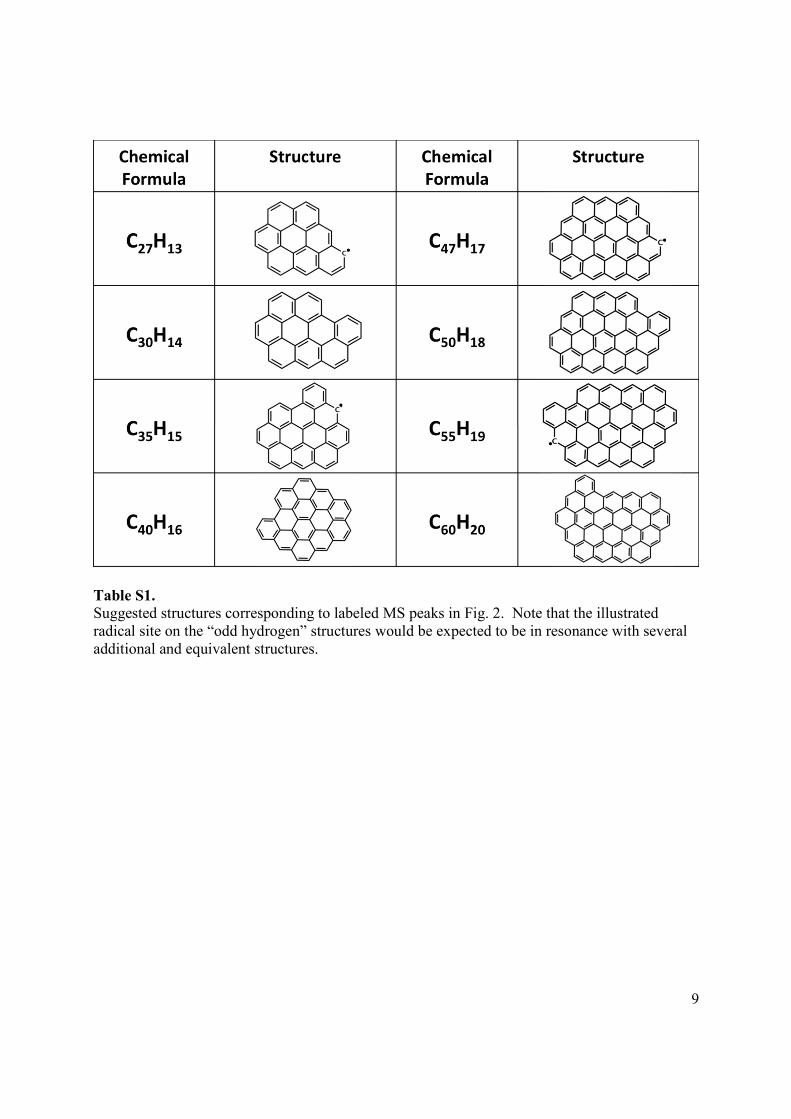
Table S1.
Suggested structures corresponding to labeled MS peaks in Fig. 2. Note that the illustrated
radical site on the “odd hydrogen” structures would be expected to be in resonance with several
additional and equivalent structures.

10
Supplemental References
1. J. D. Herdman, B. C. Connelly, M. D. Smooke, M. B. Long, J. H. Miller, A comparison
of Raman signatures and laser-induced incandescence with direct numerical simulation of
soot growth in non-premixed ethylene/air flames. Carbon 49, 5298-5311 (2011).
2. B. N. Walker, J. A. Stolee, A. Vertes, Nanophotonic Ionization for Ultratrace and Single-
Cell Analysis by Mass Spectrometry. Analytical Chemistry 84, 7756-7762 (2012).
3. S. A. Stopka et al., Molecular Imaging of Biological Samples on Nanophotonic Laser
Desorption Ionization Platforms. Angewandte Chemie International Edition 55, 4482-
4486 (2016).
4. K. O. Johansson et al., Formation and emission of large furans and oxygenated
hydrocarbons from flames. PNAS 113, 8374-8379 (2016).
5. B. Apicella et al., Mass spectrometric analysis of large PAH in a fuel-rich ethylene flame.
Proc. Combust. Inst. 31, 547-553 (2007).
6. M. D. Smooke, M. B. Long, B. C. Connelly, M. B. Colket, R. J. Hall, Soot formation in
laminar diffusion flames. Combustion and Flame 143, 613-628 (2005).