Embed Size (px)
Citation preview
Procedia Economics and Finance 5 ( 2013 ) 326 – 335
2212-5671 © 2013 The Authors. Published by Elsevier B.V.Selection and/or peer-review under responsibility of the Organising Committee of ICOAE 2013doi: 10.1016/S2212-5671(13)00039-7
International Conference on Applied Economics (ICOAE) 2013
The monetary poverty in Senegal between 2002-2006:
Regional disparities and effects of poverty decomposition.Ibrahima SY 1
PhD University of Toulon-var, Laboratory of LEAD BP 20132 – 83957 La Garde cedex France
AbstractThis paper provides an analysis of monetary poverty in Senegal. Poverty is estimated not through national but regionalpoverty thresholds. We present the methodological tools necessary for the understanding of the dynamics of poverty with the generic formula of poverty indices proposed by Foster, Greer and Thorbecke (1984) in order to estimate and analyze poverty in Senegal from 2002 to 2006. Starting over, and assuming the existence of disparities notorious variation of poverty, we explore the sectoral decomposition of poverty changes depending on the geographic location using thedecomposition method proposed by Ravallion, Huppi (1991). It is used for the assessment of the contribution of potentialexplanatory factors of differences in poverty. The obtained results reveal at first that the disparities in poverty show thenon-irrelevance of the use of a single threshold in Senegal. Then, they suggest lowering the monetary poverty in the national domain, but with strong disparities between regions and stabilization of the poverty inequality during a studied period. And finally, the effect of the changes of the localization of the population contributes to increase the poverty incertain regions and in the global poverty.
© 2013 The Authors. Published by Elsevier B.V.Selection and/or peer-review under responsibility of the Organising Committee of ICOAE 2013.
Keywords: Poverty, Inequality, Poverty Experienced, Poverty in perception in Senegal.
1. Introduction
Thus, numerous studies have been done on poverty in Senegal, initiatives promoted by the Directorate of Forecasting and Statistics (DPS) through the provision of data from the Senegalese Household Survey 1994and 2002 (ESAM I and II), and the Monitoring Survey Poverty in Senegal, 2005-2006 (ESPS). Most of thesestudies have focused on monetary poverty profile specifically on the characteristics of poverty and living
* Corresponding author. Tel.: +0033614385914; fax: 0033494142090.E-mail address: [email protected] / [email protected]
Available online at www.sciencedirect.com
© 2013 The Authors. Published by Elsevier B.V.Selection and/or peer-review under responsibility of the Organising Committee of ICOAE 2013
ScienceDirect
327 Ibrahima SY / Procedia Economics and Finance 5 ( 2013 ) 326 – 335
conditions of households (and Daffé Badji, 2003; Cissé, 2003; Diagne et al, 2005; Ki et al, 2005; Oxfam, 2009). However, these studies have a number of limitations. Poverty levels are calculated mainly from the usual indices of poverty based on a single poverty line (national poverty line), which can’t be sufficiently representative (Foster, Greer and Thorbecke (FGT)). Moreover, if poverty between 1994 and 2005 in Senegal is observed with a significant reduction, it would be far from uniform. Geographical disparities remain pronounced. Although some studies point to the existence of strong inequalities between urban and rural areas, none of them have been devoted to the analysis of disparities or decomposition of poverty at the regional level. This work fits into this perspective. It provides an analysis of the dynamics of poverty in monetary terms based on statistical information sections of two household surveys in 2002 and 2006. Section 2 provides an estimation of regional thresholds of poverty in Senegal by highlighting regional disparities in terms of poverty levels. Section 3 presents the methodological tools necessary for understanding the dynamics of poverty. This allows estimating and analyzing poverty in Senegal for the period 2002 - 2006 in Section 4. The section 5 explores the sector decomposition of changes in poverty in order to assess the contribution of potential explanatory factors of disparities in poverty.
2. Setting thresholds of poverty in Senegal
The analysis of poverty is probably far from exhausting all the dimensions of the problem, but it remains an inevitable path, partly because of the symbolic force of digit in our societies (Concialdi, 2002). In these approaches, a recurring question concerns the measurement of poverty: what is the minimum income defining the poverty of a person? The definition of thresholds poverty is fundamentally normative in nature (Concialdi, 1998). And in African countries, Senegal in particular, information relating to income is difficult to obtain. The subject remains taboo until now. The preference of expenses also reflects the desire to limit bias error of measurement of the variable.
2.1. Choice of indicator of poverty threshold
The indicator used to measure the well-being of households in Senegal is an aggregate of consumption per adult equivalent based on expenses. It includes expenditure on food and non-food. Despite the fact that consumer spending may be observed at different times of the year, no inflation adjustment has been done within the same survey into the estimates (ESAM II and ESPS 2006, Ndoye and al., 2009). To estimate the trend of poverty, it is important to use the same methodology for measuring poverty levels, regardless of period, region or area (urbane / rural). The estimates presented are based on the classical approach of the cost of basic needs, which is to estimate the proportion of the population or households that are able to buy a basket of food goods and increased an amount for non-food expenditures. It consists in a first step, to determine a food poverty line. Standards used vary from countries, but are generally between 1800 and 3000 Kcal / person / day. DSRP in Senegal used 2400 Kcal per adult equivalent. This approach differs significantly from that based on the calorific energy where the structure of the food basket of goods may change between two periods due to substitution of the household level. Although this structure has not fundamentally changed between the ESAM II and ESPS, the very high sensitivity of the incidence in relation to poverty line used in the case of Senegal, leads us to favor the approach based on the cost of basic needs. Consumption patterns may change from one period to another and from one region to another. However if the changes in consumption patterns are themselves the result of a change in poverty, then, allowing the basket to change over time or depending on the geographical location of households may bias the comparisons of poverty (Ndoye et al., 2009). By contrast, the value of the basket can change over time and for different layers. For
328 Ibrahima SY / Procedia Economics and Finance 5 ( 2013 ) 326 – 335
example, the value of the food basket varies between 2002 and 2006 as well as between regions (urban andrural) because of the prices that are different2.
2.2. Measurement of poverty: methods and estimates
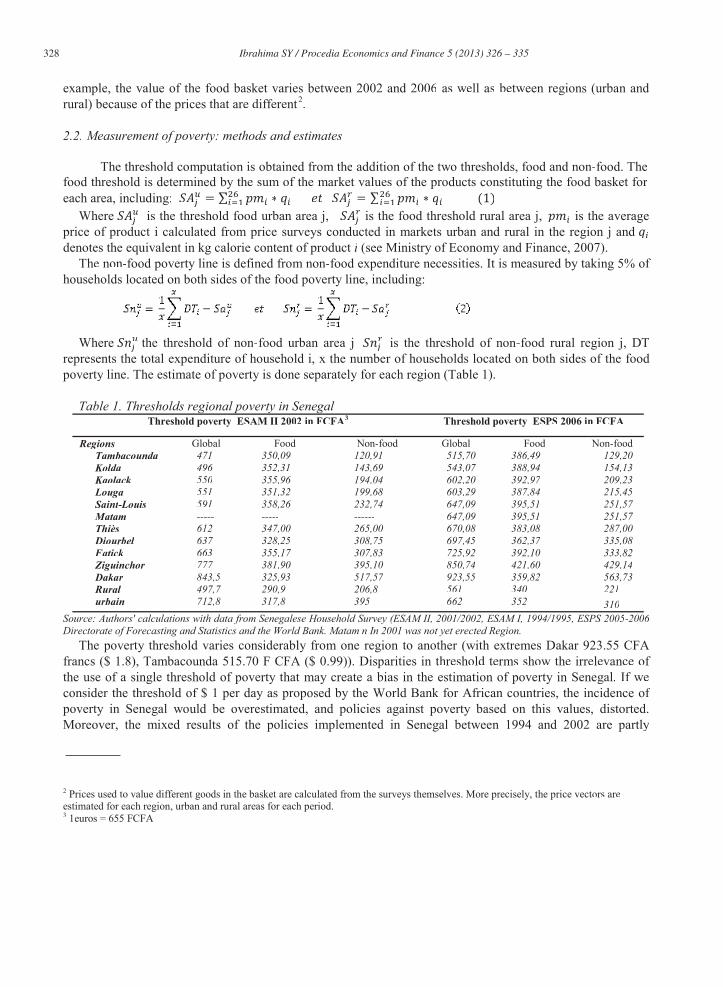
The threshold computation is obtained from the addition of the two thresholds, food and non-food. Thefood threshold is determined by the sum of the market values of the products constituting the food basket for each area, including: = = (1)
Where is the threshold food urban area j, is the food threshold rural area j, is the average price of product i calculated from price surveys conducted in markets urban and rural in the region j anddenotes the equivalent in kg calorie content of product i (see Ministry of Economy and Finance, 2007).
The non-food poverty line is defined from non-food expenditure necessities. It is measured by taking 5% of households located on both sides of the food poverty line, including:
Where the threshold of non-food urban area j is the threshold of non-food rural region j, DTrepresents the total expenditure of household i, x the number of households located on both sides of the food poverty line. The estimate of poverty is done separately for each region (Table 1).
Table 1. Thresholds regional poverty in SenegalThreshold poverty ESAM II 2002 in FCFA3 Threshold poverty ESPS 2006 in FCFA
Regions Global Food Non-food Global Food Non-food129,20154,13209,23215,45251,57251,57287,00335,08333,82429,14563,73221310
Tambacounda 471 350,09 120,91 515,70 386,49Kolda 496 352,31 143,69 543,07 388,94Kaolack 550 355,96 194,04 602,20 392,97Louga 551 351,32 199,68 603,29 387,84Saint-tt Louis- 591 358,26 232,74 647,09 395,51Matam ----- ----- ------ 647,09 395,51Thiès 612 347,00 265,00 670,08 383,08Diourbel 637 328,25 308,75 697,45 362,37Fatick 663 355,17 307,83 725,92 392,10Ziguinchor 777 381,90 395,10 850,74 421,60Dakar 843,5 325,93 517,57 923,55 359,82Rural 497,7 290,9 206,8 561 340urbain 712,8 317,8 395 662 352
Source: Authors' calculations with data from Senegalese Household Survey (ESAM II, 2001/2002, ESAM I, 1994/1995, ESPS 2005-2006 Directorate of Forecasting and Statistics and the World Bank. Matam n In 2001 was not yet erected Region.
The poverty threshold varies considerably from one region to another (with extremes Dakar 923.55 CFAfrancs ($ 1.8), Tambacounda 515.70 F CFA ($ 0.99)). Disparities in threshold terms show the irrelevance of the use of a single threshold of poverty that may create a bias in the estimation of poverty in Senegal. If weconsider the threshold of $ 1 per day as proposed by the World Bank for African countries, the incidence ofpoverty in Senegal would be overestimated, and policies against poverty based on this values, distorted.Moreover, the mixed results of the policies implemented in Senegal between 1994 and 2002 are partly
2 Prices used to value different goods in the basket are calculated from the surveys themselves. More precisely, the price vectors are estimated for each region, urban and rural areas for each period.3 1euros = 655 FCFA
329 Ibrahima SY / Procedia Economics and Finance 5 ( 2013 ) 326 – 335
attributable to this method of estimating poverty. The dividing line between the poor and non-poor (overall poverty threshold) is not calculated directly at national level, but at regional level and strata (urban and rural). The comparison between the ESAM II and ESPS can so be that in terms of incidence, depth and severity of poverty, but not in terms of poverty lines. Indeed, if the Dakar threshold is 923.55 CFA francs per day, a household with expenditure per adult equivalent per day equal to 920 FCFA is poor, while when considering a national threshold of 550 FCFA / adult equivalent / day, this household is anymore poor. This is a contradiction. For respecting the principle of the investigation that is to be representative to the regional level, calculate a national threshold is irrelevant. Then the incidence of poverty at the national level is obtained by cumulating all the poor of all regions, reported at total number of households in Senegal.
3. Estimation and analysis of poverty in Senegal
3.1. Methodological Framework
Approaches to poverty may be different due to the multidimensional nature of the phenomenon. The monetary approach is most commonly used. In this case, the income or expenses are generally used to measure well-being (Fall et al., 2011). We chose this approach in this work, even if it is limited, as in Paper Reduction Strategy Paper (DSRP), which serves as a reference. The poverty line is used to evaluate the incidence, depth and severity of poverty. In this regard, we use the poverty indices developed by Foster, Greer and Thorbecke (1984). Although there are other approaches that could solve the problem of aggregation of poverty and with almost the same properties as measures of Foster et al, in this study we limit to the presentation of the latter, only to be used in most African countries. The generic formula of poverty indices is defined by the following expression:
1( , )
1
q z yiP y ziN z
(3)
where z is the overall poverty, yi denotes the average actual household expenditure, N the total population, and q is the number of poor. The parameter can be interpreted as a coefficient of poverty. The poverty rate or the incidence of poverty P0 is the ratio between the number of poor households and the total number of households in the region ( =0 and = ). This index does not tell us, nor the extent of deprivation of the poor relative to the rest of the population, nor the dispersion of the poor, in relation to each other. Therefore, two other indices are proposed. The depth of poverty P1 is the difference relative to the line of poverty ( =1 and = ). This index shows the extent of poverty. The severity of poverty P2 is the proportion of individuals living in households furthest from the poverty line and are more heavily
weighted than those living close to the poverty line( =2 and = ). This index can also define the inequality of poverty. It measures the income gap between the poor themselves. The study also looks at poverty comparisons. When, for example policies are undertaken to reduce poverty, it becomes important to measure changes in indices and especially to decompose the observed variation to assess the contribution of potential explanatory factors. These can be done in time between sectors or socioeconomic groups. Within a sector analysis of poverty, the determination of poverty profiles - distribution of poverty across different subgroups depending on the environment, geographic location, gender, etc.., is of obvious interest (Hamadou Daouda 2010). The general problem of decomposition is set by Shorrocks (1999) (for details see Chantreuil, Trannoy, 1999, Shorrocks, 1999). Several decomposition techniques have been proposed in the literature Foster et al. (1984), Datt and Ravallion (1992), Kakwani (1993, 1997), Fields and Yoo (2000) for poverty, and Shorrocks (1982), and Chantreuil Trannoy (1999) for inequality. In this work, we propose the
330 Ibrahima SY / Procedia Economics and Finance 5 ( 2013 ) 326 – 335
decomposition Ravallion, Huppi (1991), who drew our attention. Suppose we can stratify the population intosubgroups m (j = 1,..., m). Given the principle of additively of FGT indices, a poverty profile can give thevalue of the indices for each segment j (Pj). Thus, overall poverty is obtained by averaging of various indices,weighted by the share of each group in the population (Ravallion, 1992): =Moreover, the principle of additively of FGT indices, the change in poverty between two dates ( = 1, 2) iscaptured by changes in poverty within regions - intra-regional variations - and population movements between regions - regional variations - (Ravallion, Huppi, 1991). Since =
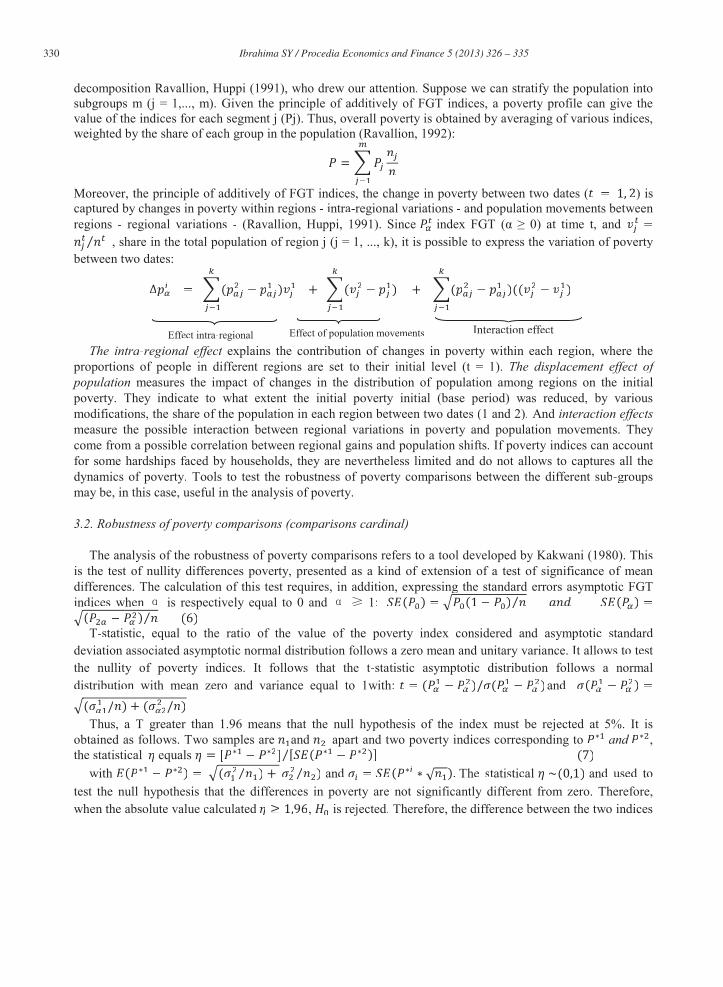
, share in the total population of region j (j = 1, ..., k), it is possible to express the variation of poverty between two dates: = ( ) + ( ) + ( )(( )
The intra-regional effect explains the contribution of changes in poverty within each region, where theproportions of people in different regions are set to their initial level (t = 1). The displacement effect of population measures the impact of changes in the distribution of population among regions on the initialpoverty. They indicate to what extent the initial poverty initial (base period) was reduced, by variousmodifications, the share of the population in each region between two dates (1 and 2). And interaction effectsmeasure the possible interaction between regional variations in poverty and population movements. They come from a possible correlation between regional gains and population shifts. If poverty indices can account for some hardships faced by households, they are nevertheless limited and do not allows to captures all thedynamics of poverty. Tools to test the robustness of poverty comparisons between the different sub-groups may be, in this case, useful in the analysis of poverty.
3.2. Robustness of poverty comparisons (comparisons cardinal)
The analysis of the robustness of poverty comparisons refers to a tool developed by Kakwani (1980). This is the test of nullity differences poverty, presented as a kind of extension of a test of significance of meandifferences. The calculation of this test requires, in addition, expressing the standard errors asymptotic FGTindices when is respectively equal to 0 and 1: ( ) = (1 ) ( ) =( ) (6)
T-statistic, equal to the ratio of the value of the poverty index considered and asymptotic standard deviation associated asymptotic normal distribution follows a zero mean and unitary variance. It allows to test the nullity of poverty indices. It follows that the t-statistic asymptotic distribution follows a normaldistribution with mean zero and variance equal to 1with: = ( )/ ( )and ( ) =( / ) + ( / )
Thus, a T greater than 1.96 means that the null hypothesis of the index must be rejected at 5%. It isobtained as follows. Two samples are and apart and two poverty indices corresponding to and , the statistical equals = [ ] [ ( )] (7)
with ( ) = ( ) + ) and = ( ). The statistical ~(0,1) and used to test the null hypothesis that the differences in poverty are not significantly different from zero. Therefore,when the absolute value calculated 1,96, is rejected. Therefore, the difference between the two indices
Effect intra-regional Effect of population movements Interaction effect
331 Ibrahima SY / Procedia Economics and Finance 5 ( 2013 ) 326 – 335
of poverty is statistically significant for confidence level of 5 percent.
4. Analysis of the evolution of poverty in Senegal between 2002 and 2006
The conceptual and analytical tools previously exposed will now allow us to provide, an analysis of the dynamics of poverty over the period 2002-2006, based on the databases ESAM II4 and ESPS5.
4.1. Evolution of the national poverty: Disparities notorious decline between 2002 and 2006 by area of residence and gender of household head.
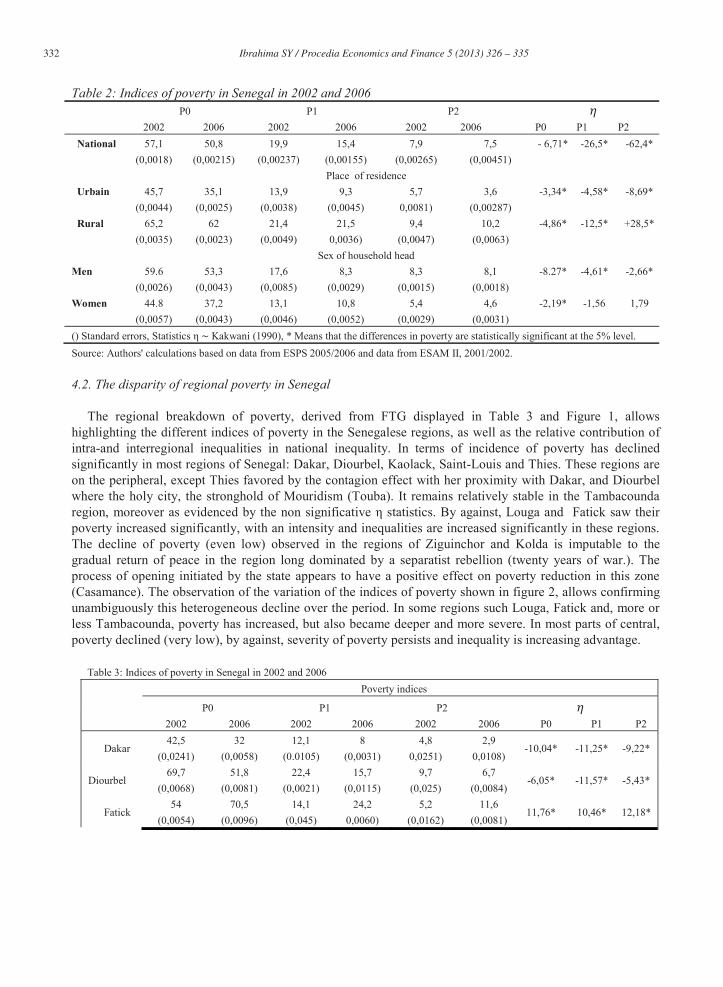
Table 2 it displays the results. T-statistic has a value greater than 1.96, so we can reject the null hypothesis at 5%. Differences in poverty between 2002 and 2006 are significantly different from zero in so far as the
It can be observed that the incidence of poverty down 7 points at national level. This decrease is even more significant when considering the intensity indicator. Indeed, the poverty gap as a percentage of the poverty line (P1) during the same period declined significantly, from 18% to 16.4%. However, this downward trend is not uniform since inequality of poverty seems to have stabilized during the period. This result suggests a slight improvement in average resources of poor in percentage of the poverty line. Toutefois, le recul de la pauvreté au niveau national cache des évolutions contrastées par zone de résidence du ménage. Naturally, the level living that prevailing in rural areas is lower than in cities (Hamadou Daouda, 2010). This configuration requires an examination of sectoral developments of living standard during the period. In this regard, we observe that the changes in poverty within each area contribute to reduce deprivation means. The contribution of the rural sector in explaining poverty is much more important, especially when considering the intensity and inequality of poverty. This, regardless that year. In general, the proportion of households in poverty has decreased: it rose from 67.9% in 1994 (Ndoye et al., 2009) to 57.1% in 2001 to reach 50.8% in 2005. If the incidence of poverty declined in rural significantly between 2002 and 2006, from 65.2% to 62%, it is still high compared to the rest of the country. The decline in the incidence of poverty over the same period is significantly higher in urban (50.1 to 38.8%). The poverty depth is estimated at 15.4% of the national population in 2006. The level shown in the rural area (21.5%) is quite high compared to urban areas (9.3%). Moreover, it should be noted that this decline in urban poverty is mainly due to the improvement of living conditions in urban areas (UN - Habitat, 2008). Using of index of the severity of poverty gives a relatively higher weighting of the poorest households. At the national level this index was 7.5% in 2006. Our estimates show also that poverty in Senegal mainly affects households headed by men. That being, the trend resulting from the conviction that female-headed households represent a social layer disadvantaged is not verified in Senegal. So, bringing this trend more often than the concept of "women and poverty" is a source of error and restriction of the scope of the analysis Nioumou D. et al. (1996).
4 Senegalese Household Survey, Second Edition (ESAM II) was carried out in Senegal by the Directorate of Forecasting and Statistics Senegal (DPS) dismemberment of the Ministry of Economy and Finance. The ESAM II involved 6600 households from 2001 to 2002. Observation units are households spread across the country and representing all social strata of the country. 5 Monitoring Survey Poverty in Senegal 2005 - 2006, was carried out in Senegal by the National Agency of Statistics and Demography (ANSD), the joint funding of Agency Social Development Fund (AFDS) and Ministry of Women, Family and Social Development (MFFDS). The ESPS for 13,600 households in 2006.
332 Ibrahima SY / Procedia Economics and Finance 5 ( 2013 ) 326 – 335
Table 2: Indices of poverty in Senegal in 2002 and 2006 P0 P1 P2 2002 2006 2002 2006 2002 2006 P0 P1 P2 National 57,1
(0,0018) 50,8
(0,00215) 19,9
(0,00237) 15,4
(0,00155) 7,9
(0,00265) 7,5
(0,00451) - 6,71* -26,5* -62,4*
Place of residence Urbain 45,7
(0,0044) 35,1
(0,0025) 13,9
(0,0038) 9,3
(0,0045) 5,7
0,0081) 3,6
(0,00287) -3,34* -4,58* -8,69*
Rural 65,2 (0,0035)
62 (0,0023)
21,4 (0,0049)
21,5 0,0036)
9,4 (0,0047)
10,2 (0,0063)
-4,86* -12,5* +28,5*
Sex of household head Men 59.6
(0,0026) 53,3
(0,0043) 17,6
(0,0085) 8,3
(0,0029) 8,3
(0,0015) 8,1
(0,0018) -8.27* -4,61* -2,66*
Women 44.8 (0,0057)
37,2 (0,0043)
13,1 (0,0046)
10,8 (0,0052)
5,4 (0,0029)
4,6 (0,0031)
-2,19* -1,56 1,79
() Standard errors, Statistics ~ Kakwani (1990), * Means that the differences in poverty are statistically significant at the 5% level. Source: Authors' calculations based on data from ESPS 2005/2006 and data from ESAM II, 2001/2002.
4.2. The disparity of regional poverty in Senegal
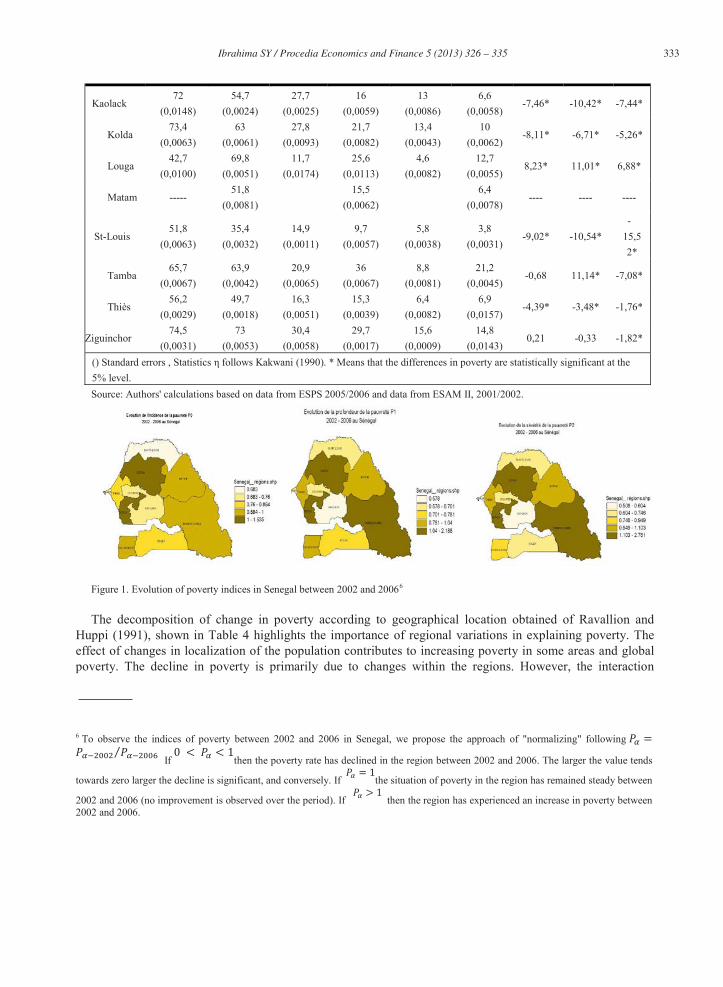
The regional breakdown of poverty, derived from FTG displayed in Table 3 and Figure 1, allows highlighting the different indices of poverty in the Senegalese regions, as well as the relative contribution of intra-and interregional inequalities in national inequality. In terms of incidence of poverty has declined significantly in most regions of Senegal: Dakar, Diourbel, Kaolack, Saint-Louis and Thies. These regions are on the peripheral, except Thies favored by the contagion effect with her proximity with Dakar, and Diourbel where the holy city, the stronghold of Mouridism (Touba). It remains relatively stable in the Tambacounda region, moreover as evidenced by the non significative Louga and Fatick saw their poverty increased significantly, with an intensity and inequalities are increased significantly in these regions. The decline of poverty (even low) observed in the regions of Ziguinchor and Kolda is imputable to the gradual return of peace in the region long dominated by a separatist rebellion (twenty years of war.). The process of opening initiated by the state appears to have a positive effect on poverty reduction in this zone (Casamance). The observation of the variation of the indices of poverty shown in figure 2, allows confirming unambiguously this heterogeneous decline over the period. In some regions such Louga, Fatick and, more or less Tambacounda, poverty has increased, but also became deeper and more severe. In most parts of central, poverty declined (very low), by against, severity of poverty persists and inequality is increasing advantage.
Table 3: Indices of poverty in Senegal in 2002 and 2006
Poverty indices
P0 P1 P2 2002 2006 2002 2006 2002 2006 P0 P1 P2
Dakar 42,5
(0,0241) 32
(0,0058) 12,1
(0.0105) 8
(0,0031) 4,8
0,0251) 2,9
0,0108) -10,04* -11,25* -9,22*
Diourbel 69,7
(0,0068) 51,8
(0,0081) 22,4
(0,0021) 15,7
(0,0115) 9,7
(0,025) 6,7
(0,0084) -6,05* -11,57* -5,43*
Fatick 54
(0,0054) 70,5
(0,0096) 14,1
(0,045) 24,2
0,0060) 5,2
(0,0162) 11,6
(0,0081) 11,76* 10,46* 12,18*
333 Ibrahima SY / Procedia Economics and Finance 5 ( 2013 ) 326 – 335
Kaolack 72
(0,0148) 54,7
(0,0024) 27,7
(0,0025) 16
(0,0059) 13
(0,0086) 6,6
(0,0058) -7,46* -10,42* -7,44*
Kolda 73,4
(0,0063) 63
(0,0061) 27,8
(0,0093) 21,7
(0,0082) 13,4
(0,0043) 10
(0,0062) -8,11* -6,71* -5,26*
Louga 42,7
(0,0100) 69,8
(0,0051) 11,7
(0,0174) 25,6
(0,0113) 4,6
(0,0082) 12,7
(0,0055) 8,23* 11,01* 6,88*
Matam ----- 51,8
(0,0081) 15,5
(0,0062) 6,4
(0,0078) ---- ---- ----
St-Louis 51,8
(0,0063) 35,4
(0,0032) 14,9
(0,0011) 9,7
(0,0057) 5,8
(0,0038) 3,8
(0,0031) -9,02* -10,54*
-15,52*
Tamba 65,7
(0,0067) 63,9
(0,0042) 20,9
(0,0065) 36
(0,0067) 8,8
(0,0081) 21,2
(0,0045) -0,68 11,14* -7,08*
Thiès 56,2
(0,0029) 49,7
(0,0018) 16,3
(0,0051) 15,3
(0,0039) 6,4
(0,0082) 6,9
(0,0157) -4,39* -3,48* -1,76*
Ziguinchor 74,5
(0,0031) 73
(0,0053) 30,4
(0,0058) 29,7
(0,0017) 15,6
(0,0009) 14,8
(0,0143) 0,21 -0,33 -1,82*
() Standard errors , Statistics follows Kakwani (1990). * Means that the differences in poverty are statistically significant at the 5% level. Source: Authors' calculations based on data from ESPS 2005/2006 and data from ESAM II, 2001/2002.
Figure 1. Evolution of poverty indices in Senegal between 2002 and 20066
The decomposition of change in poverty according to geographical location obtained of Ravallion and Huppi (1991), shown in Table 4 highlights the importance of regional variations in explaining poverty. The effect of changes in localization of the population contributes to increasing poverty in some areas and global poverty. The decline in poverty is primarily due to changes within the regions. However, the interaction
6 To observe the indices of poverty between 2002 and 2006 in Senegal, we propose the approach of "normalizing" following =
If 0 < < 1
then the poverty rate has declined in the region between 2002 and 2006. The larger the value tends
towards zero larger the decline is significant, and conversely. If = 1
the situation of poverty in the region has remained steady between
2002 and 2006 (no improvement is observed over the period). If > 1
then the region has experienced an increase in poverty between 2002 and 2006.
334 Ibrahima SY / Procedia Economics and Finance 5 ( 2013 ) 326 – 335
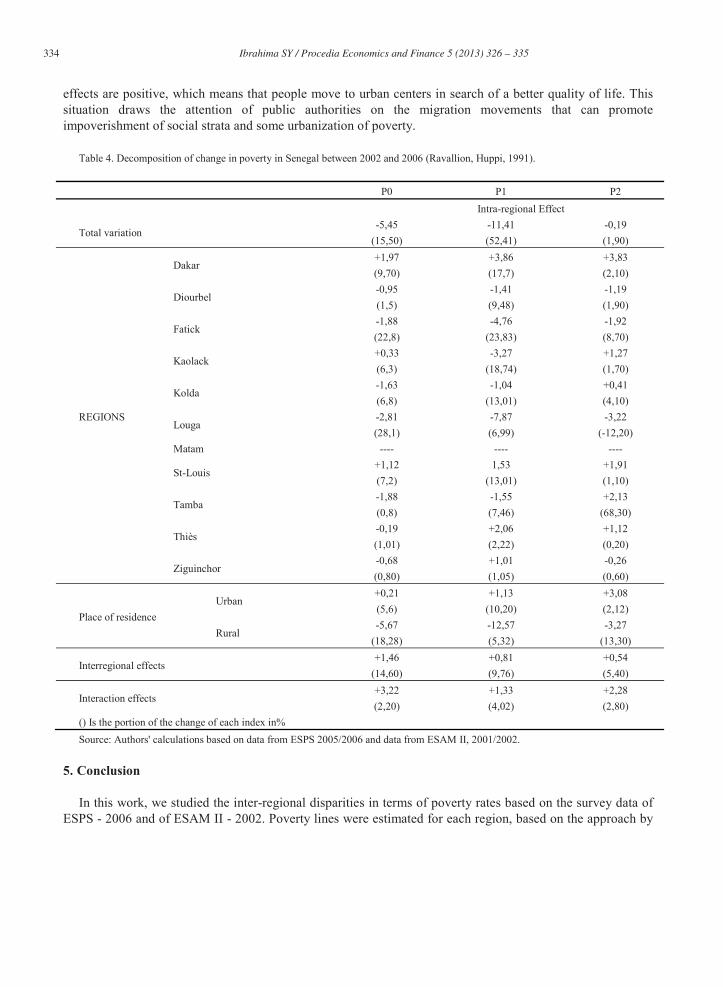
effects are positive, which means that people move to urban centers in search of a better quality of life. This situation draws the attention of public authorities on the migration movements that can promote impoverishment of social strata and some urbanization of poverty.
Table 4. Decomposition of change in poverty in Senegal between 2002 and 2006 (Ravallion, Huppi, 1991).
P0 P1 P2 Intra-regional Effect
Total variation -5,45
(15,50) -11,41 (52,41)
-0,19 (1,90)
REGIONS
Dakar +1,97 (9,70)
+3,86 (17,7)
+3,83 (2,10)
Diourbel -0,95 (1,5)
-1,41 (9,48)
-1,19 (1,90)
Fatick -1,88 (22,8)
-4,76 (23,83)
-1,92 (8,70)
Kaolack +0,33 (6,3)
-3,27 (18,74)
+1,27 (1,70)
Kolda -1,63 (6,8)
-1,04 (13,01)
+0,41 (4,10)
Louga -2,81 (28,1)
-7,87 (6,99)
-3,22 (-12,20)
Matam ---- ---- ----
St-Louis +1,12 (7,2)
1,53 (13,01)
+1,91 (1,10)
Tamba -1,88 (0,8)
-1,55 (7,46)
+2,13 (68,30)
Thiès -0,19 (1,01)
+2,06 (2,22)
+1,12 (0,20)
Ziguinchor -0,68 (0,80)
+1,01 (1,05)
-0,26 (0,60)
Place of residence Urban
+0,21 (5,6)
+1,13 (10,20)
+3,08 (2,12)
Rural -5,67
(18,28) -12,57 (5,32)
-3,27 (13,30)
Interregional effects +1,46
(14,60) +0,81 (9,76)
+0,54 (5,40)
Interaction effects +3,22 (2,20)
+1,33 (4,02)
+2,28 (2,80)
() Is the portion of the change of each index in% Source: Authors' calculations based on data from ESPS 2005/2006 and data from ESAM II, 2001/2002.
5. Conclusion
In this work, we studied the inter-regional disparities in terms of poverty rates based on the survey data of ESPS - 2006 and of ESAM II - 2002. Poverty lines were estimated for each region, based on the approach by
335 Ibrahima SY / Procedia Economics and Finance 5 ( 2013 ) 326 – 335
expenses, generally used by the PRSP, in accordance with the standards of Senegal. On the basis of these poverty lines, the poverty in Senegal is estimated over the period 2002 - 2006 as well as the decomposition of poverty indices from FTG. This has enabled us to apprehend the changes in poverty within regions (interregional effect) and the movement of people between regions (interregional effect). Senegal is one of the African countries that have managed to reduce significatively poverty in recent years. However, this decrease is very heterogeneous. The decomposition of change in poverty according to the localisation from Ravallion and Huppi (1991) confirms this trend. A key finding of this analysis is that, if beyond economic conditions, the fight against poverty must focus on building infrastructure in rural and suburban, success requires considering their geographical distribution and their ability to spread that have, so far, attracted very little attention Senegalese authorities.
References Badji S., Daffé G., 2003. Le profil de la pauvreté féminine au Sénégal, Rapport de Recherche MIMAP. Chantreuil, F. et Trannoy, A., 1999. Inequality Decomposition Values: the Trade-off between Marginality and Consistency. Workinh
Paper. Classification JEL : D 63, C 71. Cissé F. ,2003). Le profil de Pauvreté au Sénégal : une approche monétaire, Rapport de Recherche MIMAP. Concialdi P., 1998. De nouveaux indicateurs ? Pauvreté, Cahiers Français, n°286, « Les indicateurs économiques », avril, pp. 68-77. Concialdi P., 2002. Les seuils de pauvreté monétaire : usages et mesures. IRES, n°38, pp. 109-136. Datt, G. and Ravallion, M., 1992. Growth and Redistribution Components of Changes in Poverty Measures: A decomposition with
applications to Brasil and India in 1980s. Journal of Development Economics, 38 (1992) 275-295. Diagne O. D., Faye O., Faye S., 2005. Le Noyau Dur de la Pauvreté au Sénégal, CRDI. Document de Politique Economique et Sociale 2011-2015 – Sénégal, 2011. Placer le Sénégal sur la rampe de l’émergence. Fall A. S., Sall M., Sylla B. M., 2011. Les Dynamiques de la Pauvreté au Sénégal : Pauvreté chronique, pauvreté transitoire et
vulnérabilités, Centre de Recherche sur la Pauvreté Chronique (CPRC), UNICEF, en collaboration avec l’ANSD. Fields, G.S. Yoo G., 2000. Falling Labor Income Inequality in Korea’s Economic Growth : Paterns and Underlying Causes. Review of
Income and Wealth Series 46, Number 2, June 2000. Foster J., Greer J., Thorbecke E., 1984. A class of decomposable poverty measures, Econometrica, 52, pp. 761-765. Hamadou Daouda Y., 2010. Dynamique de pauvreté, Inégalité et croissance économique en Afrique subsaharienne : Une investigation
appliquée au Cas du Niger Thèse pour le Doctorat de Sciences Économiques, Université Montesquieu – Bordeaux IV. Kakwani, N., 1980. On a Class of Poverty Measures, Econornetrica, N°48, pp. 437-446. Ki J. B., Faye B., Faye S., 2005. Pauvreté multidimensionnelle au Sénégal : approche non monétaire fondée sur les besoins de base, PEP
cahier de recherche PMMA. Ministère de l’Economie et des Finances, 2002. Cellule de Suivi du Programme de Lutte contre La Pauvreté (CSPLP), Document de
Stratégie de Réduction de la Pauvreté DSRP II. Ministère de l'Economie et des Finances ,2007. Document de Stratégie pour la Croissance et la Réduction de la Pauvreté (DSRP) au
Sénégal, Document de Politique Economique et Sociale. Ndoye, D., Adoho F., Backiny-Yetna P., Fall M., Ndiaye P.T., Wodon Q., 2009. Tendance et profil de la pauvreté au Sénégal de 1994 à
2006, Perspective Afrique, 4 (1-3). ONU – habitat., 2008. Sénégal: profil urbain de Dakar. Programme des Nations unies pour les Établissements Humains / Programme
Participatif de l’élaboration des profils urbains dans les pays Africains, Caraïbes et Pacifiques , (ACP). Oxfam International au Sénégal, 2009. Analyse du contexte de la pauvreté au Sénégal, Rapport Provisoire. Ravaillon M., Datt G., 2001. Why has Economic Growth been more Pro-Poor in Some States of India than Others? International
Monetary Fund Seminar Series n°2001-59, Washington DC. Ravallion M. and Huppi M., 1991. Measuring changes in Poverty: a methodological case study of Indonesia during an adjustment period`
World Bank Economic, Review Vol 5, pp57-82. Ravallion M., 1992. Poverty Comparisons: A Guide to Concepts and Methods. The World Bank, Living Standards Measurement Study,
Working Paper, n°88. Shorrocks A. F., 1982. Inequality Decomposition by Factor Component, Econometrica, vol. 50, pp. 193-211. Shorrocks, A.F., 1999. Decomposition Procedures for Distributional Analysis : A Unified Framework Based on the Shapley Value.
Mimeo. Department of Economics, University of Essex.


![UNICEF Global Study on Child Poverty and Disparities EAPRO Regional Workshop - Bangkok Sharmila Kurukulasuriya [skurukulasuriya@unicef.org] Policy and](https://img.pdfslide.net/doc/110x75/56649b4e550346318e8c73ad/unicef-global-study-on-child-poverty-and-disparities-eapro-regional-workshop.jpg)