Embed Size (px)
Citation preview
WP/06/48
The Monetary Transmission Mechanism in Jordan
Tushar Poddar, Randa Sab, and
Hasmik Khachatryan

© 2006 International Monetary Fund WP/06/48
IMF Working Paper
Middle East and Central Asia Department
The Monetary Transmission Mechanism in Jordan
Prepared by Tushar Poddar, Randa Sab, and Hasmik Khachatryan1
Authorized for distribution by Zubair Iqbal
February 2006
Abstract
This Working Paper should not be reported as representing the views of the IMF. The views expressed in this Working Paper are those of the author(s) and do not necessarily represent those of the IMF or IMF policy. Working Papers describe research in progress by the author(s) and are published to elicit comments and to further debate.
This paper examines monetary transmission in Jordan using the vector autoregressive approach. We find that the real 3-month CD rate, the Central Bank’s operating target, affects bank retail rates and that monetary policy, measured by the spread between the 3-month CD rate and the U.S. Federal Funds rate, is effective in influencing foreign reserves. We do not find evidence of monetary policy affecting output. Output responds very little to changes in bank lending rates. Furthermore, equity prices and the exchange rate are not significant channels for transmitting monetary policy to economic activity. The effect of monetary policy on the stock market seems insignificant. JEL Classification Numbers: O53, E4, E5 Keywords: Jordan, monetary policy, transmission mechanism Author(s) E-Mail Address: [email protected], [email protected]
1 Mr. Poddar and Ms. Sab are economists in the IMF’s Middle East and Central Asia Department, and Ms. Khachatryan was a summer intern in the same department. We would like to thank Mohsin Khan, Zubair Iqbal, Edward Gardner, Ahsan Mansur, Martin Petri, Alain Feler, Joseph Ntamatungiro, Axel Schimmelpfennig, Helaway Tadesse, and Tahsin Saadi for their valuable comments, Victor Echevarria for his excellent research assistance, and Judith Rey and Imel Yu for their outstanding secretarial support.
- 2 -
Contents Page
I. Introduction ..........................................................................................................................3
II. Channels of Monetary Transmission ................................................................................4 A. Interest Rate Channel ................................................................................................4 B. Credit Channel ..........................................................................................................5 C. Equity Price Channel.................................................................................................6
III. Conduct of Monetary Policy in Jordan...........................................................................6 A. Interest Rate Pass-Through .......................................................................................8
IV. Evidence from VARs.........................................................................................................9 A. Basic Model ............................................................................................................10 B. Interest Rate Channel ..............................................................................................13 C. Credit Channel ........................................................................................................15 D. Equity Price Channel ..............................................................................................16 E. Exchange Rate Channel...........................................................................................17
V. Conclusions and Policy Implications...............................................................................18
References...............................................................................................................................26
Tables 1. Regression Results of 3-Month CD Rates on Real Deposit Rates ................................8 2. Regression Results of 3-Month CD Rates on Real Lending Rates................................9 3. Variance Decomposition (VD) of the Basic Model.....................................................12 Figures 1. Jordan’s Interest Rate and the U.S. Federal Funds Rate................................................7 2. 3-Month CD, Lending, and Deposit Rates ....................................................................7 3. Retail Spread and 3-month CD Rate..............................................................................8 4. Impulse Responses for the Basic Model......................................................................12 5. Impulse Responses to Real Lending Rates and Spreads..............................................14 6. Cumulative Impulse Responses to Real Lending Rates ..............................................15 7. Domestic Credit, 3-Month CD, and Real Lending Rates ............................................15 8. Stock Market Index and Market Capitalization...........................................................16 9. Impulse Responses of Output to Monetary Shocks in Basic and Equity Models........17 10. Impulse Responses of Output to Monetary Shocks in the Equity Model....................17 11. Impulse Responses of Output to Monetary Shocks in Basic and Exchange Rate
Models .........................................................................................................................18 12. Impulse Responses of Output to Monetary Shocks in Exchange Rate Model ............18 Appendixes I. Impulse Responses.......................................................................................................19 II. Granger Causality Tests Summary ..............................................................................24
- 3 -
I. INTRODUCTION
As a small open economy subject to shocks, Jordan faces particularly difficult challenges in the conduct of its monetary policy. Understanding the effects of monetary policy and the channels through which it is transmitted is critical to its successful conduct. Thus far, little analytical work has been done in this area, and scant guidance is available to help Jordanian policymakers evaluate changes in policy and their effects on the economy. This paper attempts to fill this lacuna by studying issues relating to the monetary transmission mechanism in Jordan.
Several factors make understanding the transmission mechanism in Jordan particularly important. First, given the volatile regional environment, the likelihood of a major external shock hitting the economy is substantial. As such, the economy-wide effects of monetary policy responding to such shocks is of interest to policymakers. Second, Jordan has recently witnessed a spurt in asset prices, in both the housing and the stock markets. This has raised the question of whether and how monetary policy should respond to these increases. A third issue is how monetary policy could influence credit to the private sector. The objective of this paper is to shed light on each of these issues and provide a useful basis for policy analysis.
Although little work has been done specifically on Jordan, the literature on the monetary transmission mechanism is large and growing. This literature has primarily used vector autoregressions (VARs), focusing primarily on reduced-form relationships between monetary policy and output using a small number of variables. Studies on the U.S. transmission mechanism have dominated the literature. However, recent studies have looked at the transmission process in Japan,2 Thailand,3 and Brazil.4
This paper considers the overall monetary transmission mechanism in Jordan, examining interest rate pass-through from the central bank’s CD rates to retail rates. It then considers the channels of monetary transmission and investigates the interest rate, credit, equity price, and exchange rate channels. It also examines the effect of monetary policy on the stock market.
We found that the current operating target of monetary policy, the spread between 3-month CD rates and the U.S. Federal Funds rate, influences bank retail rates and foreign reserves. We do not find any evidence of monetary policy significantly affecting economic activity. Aggregate activity responds very little to changes in bank lending rates. The latter are not influencing domestic credit, as the interest elasticity of credit demand is low. Furthermore,
2 See Morsink and Bayoumi (2001).
3 See Disyatat and Vongsinsirikul (2003).
4 See Rabanal and Schwartz (2000).
- 4 -
equity prices and the exchange rate are not significant channels for transmitting monetary policy to aggregate activity. The effect of monetary policy on the stock market seems insignificant.
The rest of the paper is organized as follows: Section II presents the channels of monetary transmission in the literature, which become the focus of our discussion in the paper; Section III traces developments in the conduct of monetary policy in Jordan focusing on interest rate pass-through; Section IV presents evidence from VARs on the monetary transmission process and discusses results from our investigation into various channels; finally, Section V concludes and presents policy implications.
II. CHANNELS OF MONETARY TRANSMISSION
There are multiple theories on the role of monetary policy in the economy. The standard neoclassical model considers money to be neutral, which means that changes to the money supply and to interest rates have an effect only on nominal variables but never affect real variables such as real GDP. In contrast, Keynesian theories argue that prices do not adjust systematically, so that a change in the money supply could have an effect on real interest rates and therefore on economic activity (as long as a country does not fall into a liquidity trap). More recent theories about a firm’s decision-making process and on the functioning of financial markets suggest that there may be alternative channels by which interest rates can affect the real economy without resorting to Keynesian price rigidities. In particular, changes in interest rates affect the return on equity relative to the return on bonds. Thus, relative demand for and prices of stocks and bonds will change, leading to changes in the value of Tobin’s Q and the financial wealth of individuals, which would affect output. Finally, interest rates can affect credit to the private sector, and thus activity, by making higher/lower liquidity available to banks, which would affect their lending through balance sheet effects. We test these theories to see whether or not they apply to Jordan.
A. Interest Rate Channel
The interest rate channel is the standard Keynesian channel of monetary transmission. A fall in real interest rates lowers the cost of capital, causing a rise in investment spending, thereby leading to an increase in aggregate demand and a rise in output.5 It is the real rather than the nominal interest rate that affects consumer and business decisions. In addition, it is often the real long-term interest rate and not the short-term interest rate that is viewed as having the largest impact on spending. Changes in the short-term nominal interest rate induced by a central bank result in a corresponding change in the real interest rate on both short- and long-term bonds owing to nominal price rigidities. Hence, expansionary monetary policy, which lowers the short-term nominal interest rate, also lowers the short-term real interest rate, and this would still be true even in a world with rational expectations (Mishkin, 1996). These
5 See Cotarelli and Courelis (1994).
- 5 -
lower real interest rates then lead to rises in business fixed investment, residential housing investment, consumer durable expenditure, and inventory investment, all of which produce a rise in aggregate output.6
B. Credit Channel
There are two basic channels of monetary transmission that arise as a result of information problems in credit markets: the bank lending channel and the balance sheet channel.7
The bank lending channel is applicable when expansionary monetary policy, which increases banks’ reserves and deposits, increases the amount of credit available. Given banks’ special role as lenders to classes of bank borrowers, this increase in loans will cause investment (and possibly consumer) spending to rise. An important implication of the credit view is that monetary policy will have a greater effect on expenditures of smaller firms that are more dependent on bank loans than on large firms that can access the stock and bond markets directly.
The balance sheet channel arises from the presence of asymmetric information in credit markets, particularly with respect to adverse selection and moral hazard. The lower the net worth of business firms, the more severe the adverse selection and moral hazard problems that arise from lending to these firms. Lower net worth reduces the collateral for loans, and so losses from adverse selection are higher. A decline in net worth, which raises the adverse selection problem, thus leads to decreased lending and investment.
Expansionary monetary policy, which causes a rise in equity prices as described earlier, raises the net worth of firms and so leads to higher investment spending and aggregate demand because of the decrease in adverse selection and moral hazard problems.
Expansionary monetary policy, which lowers nominal interest rates, also causes an improvement in firms’ balance sheets because it raises cash flow, thereby reducing adverse selection and moral hazard problems. An important feature is that it is the nominal interest rate that tends to affect firms’ cash flow the most, because long-term debt is typically fixed and thus has little impact on firms’ cash flow.
6 Taylor (1995) surveys research on interest rate channels and concludes that there is strong empirical evidence for substantial interest rate effects on consumer and investment spending, making the interest-rate monetary transmission mechanism a strong one. 7 See Kashyap and Stein (2000).
- 6 -
C. Equity Price Channel
There are two channels involving equity prices that are important to the monetary transmission mechanism; these involve Tobin’s Q theory of investment and wealth effects on consumption.8
Tobin’s Q theory provides a mechanism by means of which monetary policy affects the economy through its effects on the valuation of equities. q is defined as the market value of firms divided by the replacement cost of capital. If q is high, the market price of firms is high relative to the replacement cost of capital, and new plant and equipment capital is cheap relative to the market value of business firms. Companies can then issue equity and get a high price for it relative to the cost of the plant and equipment they are buying. Thus, investment spending will rise because firms can buy a lot of new investment goods with only a small issue of equity. The reverse applies when q is low and, consequently, investment spending will be low. When the central bank reduces interest rates, the discounted value of future profits of companies rises and fixed income instruments become relatively less attractive. Thus, the demand for equities increases as does their price. To the extent that firms compare the market value of capital to its replacement cost in making investment decisions, this stimulates investment expenditures, and hence output.
An alternative channel for monetary transmission through equity prices occurs through wealth effects on consumption. According to Modigliani’s life-cycle model, consumption spending is determined by the lifetime resources of consumers, which are made up of human capital, real capital, and financial wealth. A major component of financial wealth is common stocks. When stock prices rise, the value of financial wealth increases, thus increasing the lifetime resources of consumers, and consumption should rise.
III. CONDUCT OF MONETARY POLICY IN JORDAN
The primary objective of monetary policy in Jordan is maintaining a pegged exchange rate with the U.S. dollar. Given the instability in the region, and being a small open economy, Jordan is vulnerable to external developments, in particular, to higher international oil prices and lower external grants. Hence, the Central Bank of Jordan (CBJ) has accumulated foreign reserves to help cushion external shocks and maintain the peg.
Prior to mid-1995 the CBJ used an intermediate monetary aggregate target (M2) to support its monetary policy objective.9 This framework had worked well for Jordan until 1995, when
8 See Cashin and McDermott(1995) and Chen, Firth, and Rui (2001).
9 Monetary policy was conducted through a reserve-money programming framework where the demand for broad money was estimated given a programmed level of real income growth and inflation. Given the demand for money and a forecast for the money multiplier, an estimate was then made for the implied demand for reserve money. Given its forecast of net foreign assets and the items composing net domestic assets, the CBJ
(continued…)
- 7 -
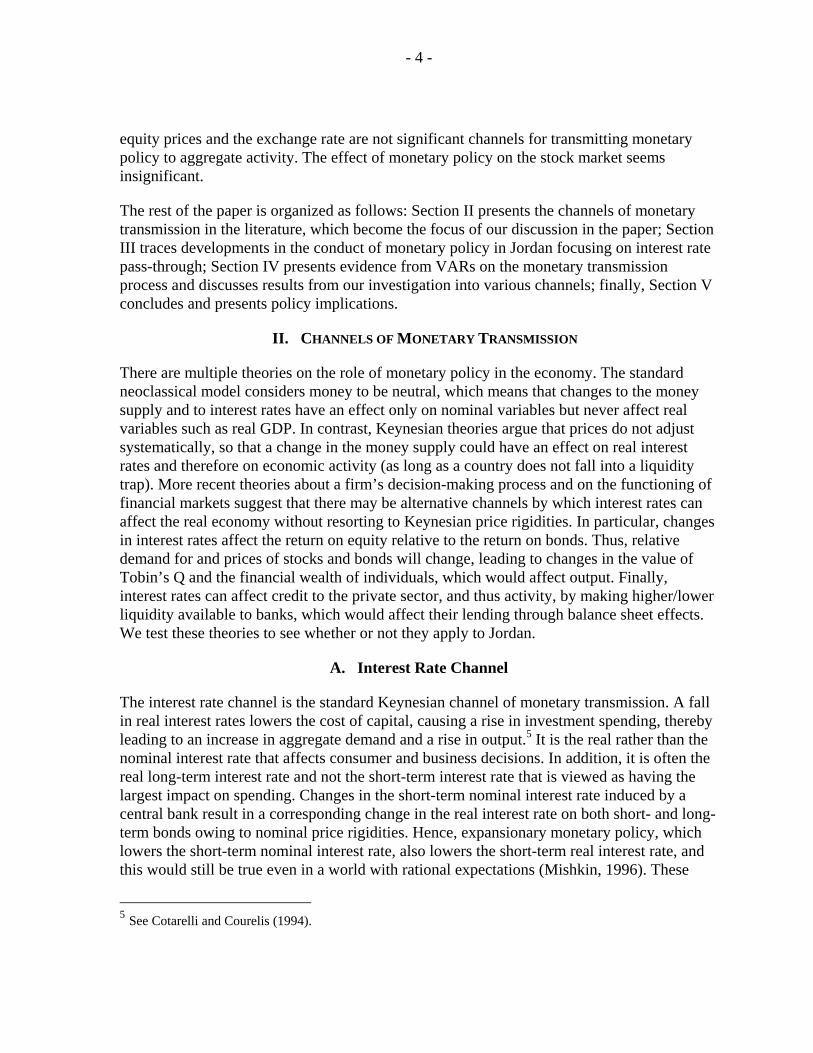
the money multiplier's volatility increased, resulting in significant errors in the forecasting of the reserve money level.
In mid-1995, the CBJ adopted an accommodating policy and started using the CD auction rate as the operating target for achieving exchange rate stability. Thanks to imperfect asset substitutability, the CBJ has some independence in setting the interest rate spread. It targets the interest rate by varying its offerings of auctioned CDs. By targeting the CD rate, the CBJ attempts to influence bank deposit and lending rates to induce changes in the demand for the Jordanian dinar (JD) relative to the U.S. dollar. Thus, the success of the CBJ in achieving its objectives depends on the transmission of the monetary policy stance, through CD rates, to bank rates. This, in turn, affects the demand for JD and the level of foreign exchange, and ultimately the ability to maintain the peg. The CBJ does not intervene in the foreign exchange market.
The overnight deposit facility was introduced in March 1998 to give the CBJ a tool for managing liquidity on a daily basis (between auctions) and to act as a floor to the interbank rate. Since 2000, the CBJ has been adjusting the overnight rate broadly in line with actions by the U.S. Federal Reserve. The result is that the CBJ has moved away from solely targeting CD auction rates toward a corridor system of interest rates with the overnight deposit window rate as the floor and the 7-day repo facility as the ceiling (Figure 1).
then calculated the overall magnitude of liquidity injection or absorption that would be consistent with the reserve money target.
Figure 1. Jordan's Interest Rates and the U.S. Federal Funds Rate
Repurchase Agreements
3-month CD
Fed Funds
0.0
2.0
4.0
6.0
8.0
10.0
12.0
14.0
1995 1996 1997 1998 1999 2000 2001 2002 2003 2004 2005
Overnight deposit window
Source: Central Bank of Jordan.
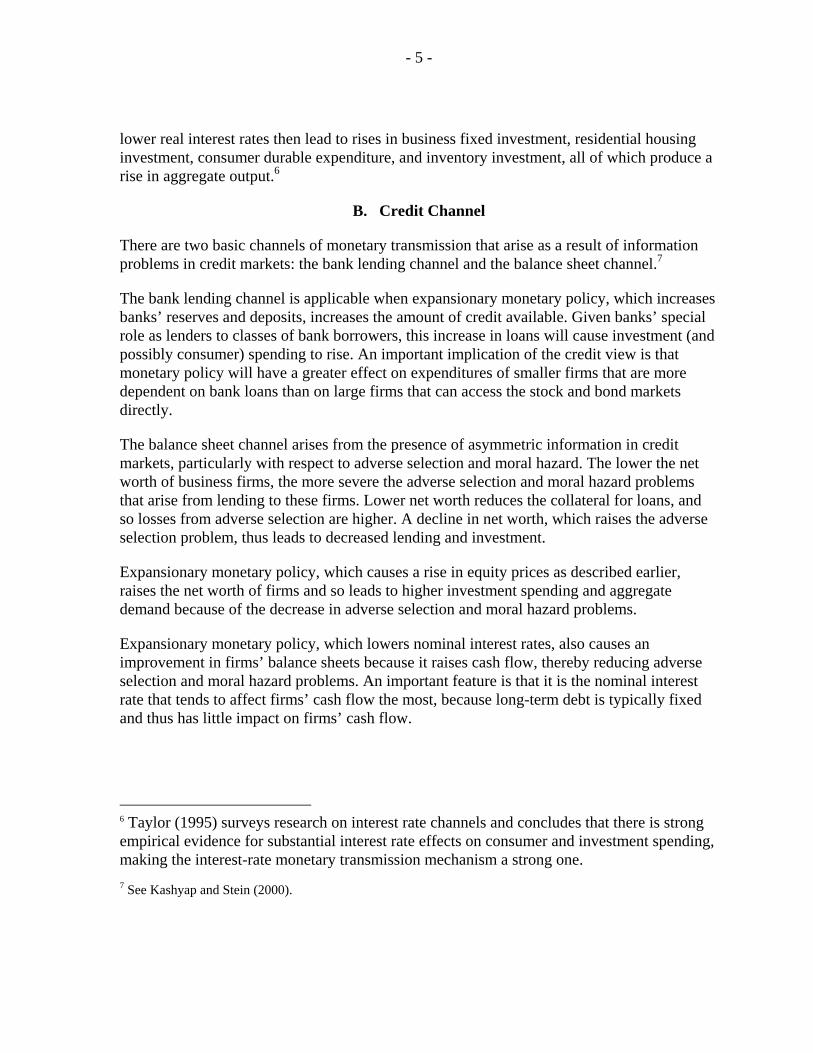
Figure 2. 3-Month CD, Lending, and Deposit Rates
Deposit rate
Lending Rate (end of period)
CD3M
0
2
4
6
8
10
12
14
Dec-95
Oct-96
Aug-97
Jun-98
Apr-99
Feb-00
Dec-00
Oct-01
Aug-02
Jun-03
Apr-04
Feb-05
Source: Central Bank of Jordan.
- 8 -
A. Interest Rate Pass-Through
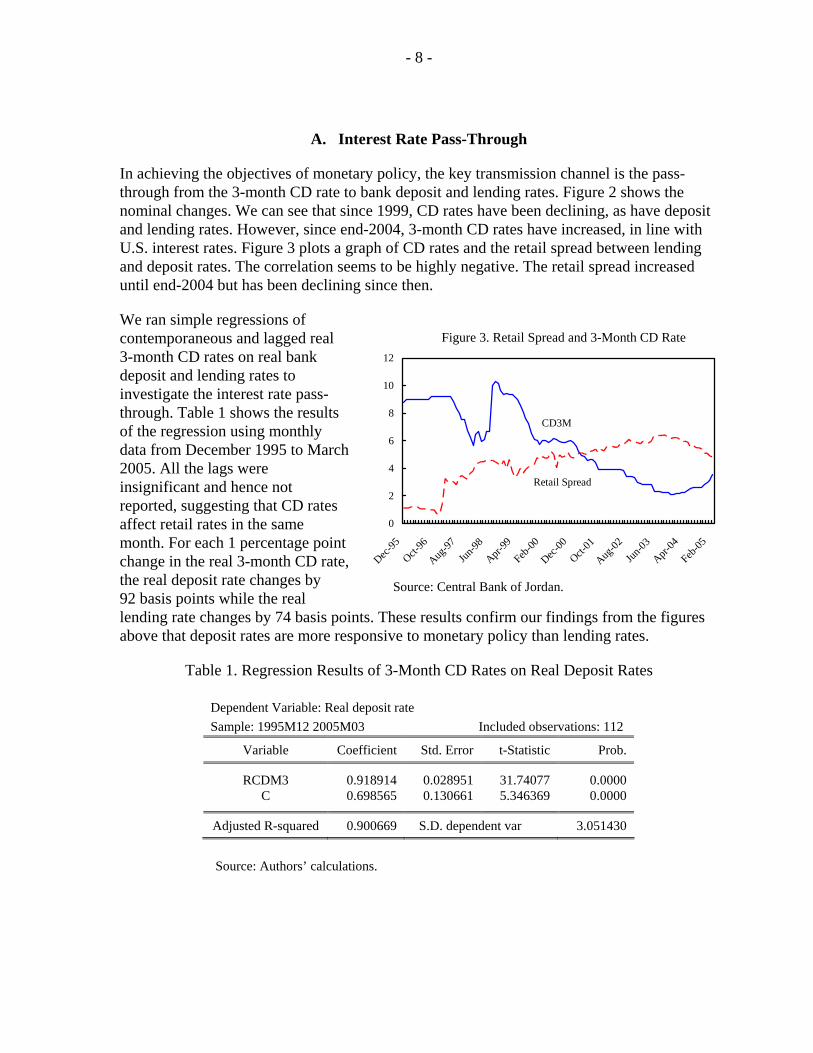
In achieving the objectives of monetary policy, the key transmission channel is the pass-through from the 3-month CD rate to bank deposit and lending rates. Figure 2 shows the nominal changes. We can see that since 1999, CD rates have been declining, as have deposit and lending rates. However, since end-2004, 3-month CD rates have increased, in line with U.S. interest rates. Figure 3 plots a graph of CD rates and the retail spread between lending and deposit rates. The correlation seems to be highly negative. The retail spread increased until end-2004 but has been declining since then.
We ran simple regressions of contemporaneous and lagged real 3-month CD rates on real bank deposit and lending rates to investigate the interest rate pass-through. Table 1 shows the results of the regression using monthly data from December 1995 to March 2005. All the lags were insignificant and hence not reported, suggesting that CD rates affect retail rates in the same month. For each 1 percentage point change in the real 3-month CD rate, the real deposit rate changes by 92 basis points while the real lending rate changes by 74 basis points. These results confirm our findings from the figures above that deposit rates are more responsive to monetary policy than lending rates.
Table 1. Regression Results of 3-Month CD Rates on Real Deposit Rates
Dependent Variable: Real deposit rate Sample: 1995M12 2005M03 Included observations: 112
Variable Coefficient Std. Error t-Statistic Prob.
RCDM3 0.918914 0.028951 31.74077 0.0000 C 0.698565 0.130661 5.346369 0.0000
Adjusted R-squared 0.900669 S.D. dependent var 3.051430
Source: Authors’ calculations.
Source: Central Bank of Jordan.
Figure 3. Retail Spread and 3-Month CD Rate
CD3M
Retail Spread
0
2
4
6
8
10
12
Dec-95
Oct-96
Aug-97
Jun-98
Apr-99
Feb-00
Dec-00
Oct-01
Aug-02
Jun-03
Apr-04
Feb-05
- 9 -
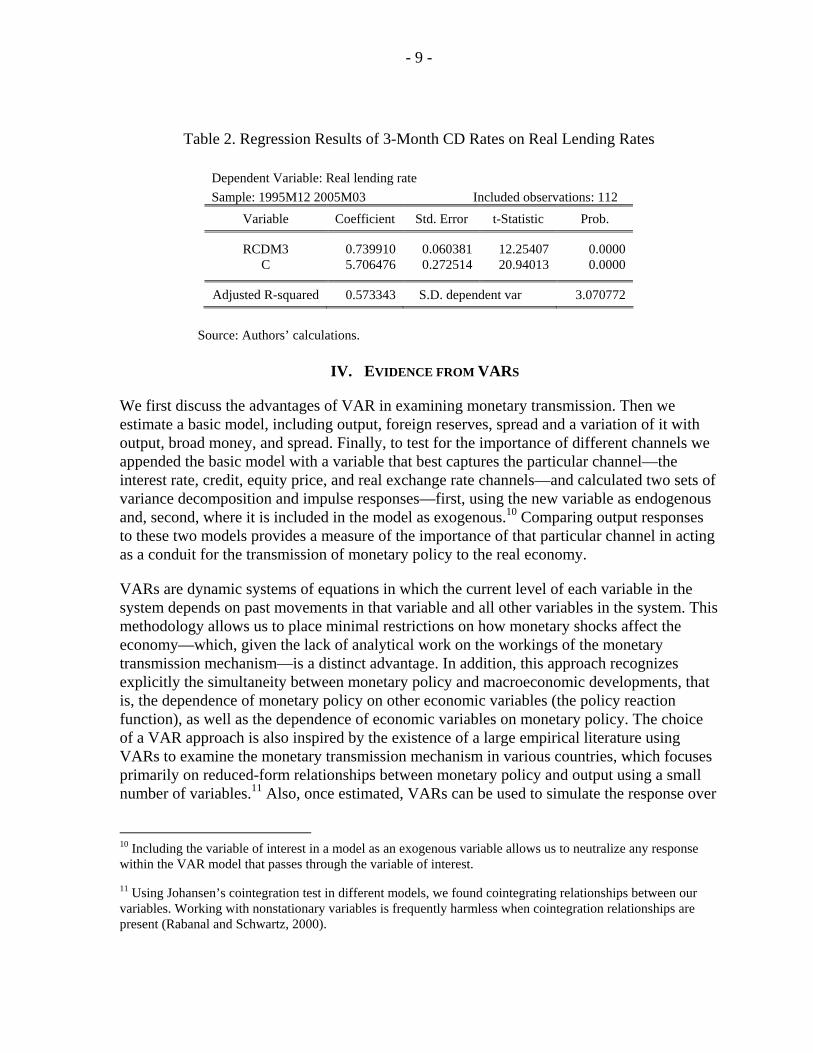
Table 2. Regression Results of 3-Month CD Rates on Real Lending Rates
Dependent Variable: Real lending rate Sample: 1995M12 2005M03 Included observations: 112
Variable Coefficient Std. Error t-Statistic Prob.
RCDM3 0.739910 0.060381 12.25407 0.0000 C 5.706476 0.272514 20.94013 0.0000
Adjusted R-squared 0.573343 S.D. dependent var 3.070772
Source: Authors’ calculations.
IV. EVIDENCE FROM VARS
We first discuss the advantages of VAR in examining monetary transmission. Then we estimate a basic model, including output, foreign reserves, spread and a variation of it with output, broad money, and spread. Finally, to test for the importance of different channels we appended the basic model with a variable that best captures the particular channel—the interest rate, credit, equity price, and real exchange rate channels—and calculated two sets of variance decomposition and impulse responses—first, using the new variable as endogenous and, second, where it is included in the model as exogenous.10 Comparing output responses to these two models provides a measure of the importance of that particular channel in acting as a conduit for the transmission of monetary policy to the real economy.
VARs are dynamic systems of equations in which the current level of each variable in the system depends on past movements in that variable and all other variables in the system. This methodology allows us to place minimal restrictions on how monetary shocks affect the economy—which, given the lack of analytical work on the workings of the monetary transmission mechanism—is a distinct advantage. In addition, this approach recognizes explicitly the simultaneity between monetary policy and macroeconomic developments, that is, the dependence of monetary policy on other economic variables (the policy reaction function), as well as the dependence of economic variables on monetary policy. The choice of a VAR approach is also inspired by the existence of a large empirical literature using VARs to examine the monetary transmission mechanism in various countries, which focuses primarily on reduced-form relationships between monetary policy and output using a small number of variables.11 Also, once estimated, VARs can be used to simulate the response over
10 Including the variable of interest in a model as an exogenous variable allows us to neutralize any response within the VAR model that passes through the variable of interest.
11 Using Johansen’s cointegration test in different models, we found cointegrating relationships between our variables. Working with nonstationary variables is frequently harmless when cointegration relationships are present (Rabanal and Schwartz, 2000).
- 10 -
time of any variable in the set to either an own disturbance or a disturbance to any other variable in the system and to produce variance decomposition of the variables.
The mathematical representation of a VAR is:
τε+++= −− ptptt yAyAy ...11 ,
where yt is a k vector of endogenous variables, A1, ...Ap are matrices of coefficients to be estimated, and εt is a vector of innovations that may be contemporaneously correlated but are uncorrelated with their own lagged values and uncorrelated with all of the right-hand side variables.
Given that only lagged values of the endogenous variables show on the right-hand side of the equations, simultaneity is not a problem, and OLS yields consistent estimates.
The estimation is done using quarterly data from 1996 Q1 to 2005 Q1. We chose this period because of the structural change in the adoption of the peg to the dollar in 1995 and also because of the lack of consistent data for some variables before 1995. The optimal lag length under the Schwarz and Akaike criterion was two. The VARs estimated in this paper are quite parsimonious, with the set of variables kept relatively small and lag length set to two quarters. Given that some of the variables in the model are likely to be nonstationary, there is a trade-off between estimating the VAR in levels versus in first differences. The trade-off is between the loss of efficiency (when the VAR is estimated in levels) and the loss of information about long-run relationships (when the VAR is estimated in first differences). In particular, a VAR in first differences provides no information on the relationships between levels of the variables in the VAR, and it is this aspect on which economic theory is usually most informative. Moreover, while estimation in levels may incur some efficiency losses, this comes at no cost in terms of consistency of estimators. Most of the empirical literature on VARs has tended to estimate VARs that are unrestricted in levels. We estimated the levels specification in order to meet our objective of understanding long-run relationships among the variables, as well as to compare our results to the literature. We also estimated the first difference specifications but did not report these results because they were not significantly different than those in levels. We present the full impulse-response functions in Appendix I.
A. Basic Model
Our parsimonious basic model includes the natural log of real output, natural log of foreign reserves (fx), and the spread between 3-month CD rates in Jordan and the U.S. Federal Funds rate. The latter is used as a measure of monetary policy as Jordan has pegged its exchange rate to the U.S. dollar since 1995 and since 3-month CD rates have been used as an operational target for monetary policy in the time period under consideration, as discussed in Section III above. We used nominal interest rate differences between Jordan and the United
- 11 -
States in the model because, with a pegged exchange rate, the choice of currency in the portfolio depends mostly on differences in nominal rates.12
The ordering of the variables reflects an implicit assumption about the dynamic structure of the economy and is in part guided by the fact that the movements in the spread between 3-month CD rates in Jordan and the U.S. Federal Funds rate tend to lead to changes in output. The ordering was chosen on the basis of the speed with which the variables respond to shocks, with real output assumed to be the least responsive, followed by foreign reserves, and, finally, the spread between 3-month CD rates in Jordan and the U.S. Federal Funds rate. This seems plausible and consistent with the actual behavior of the economy since changing real output is a time-consuming process while monetary authorities set policy with at least some indication about contemporaneous developments in output and foreign reserves. Yet the results are similar with alternative ordering, including reversing the order.
The VAR is identified using a recursive Cholesky decomposition. As the reduced-form errors are typically correlated, the Cholesky decomposition isolates the underlying structural errors by recursive orthogonalization, with the innovation in the first equation untransformed, the innovation in the second equation taken as orthogonal to the first, and so on.
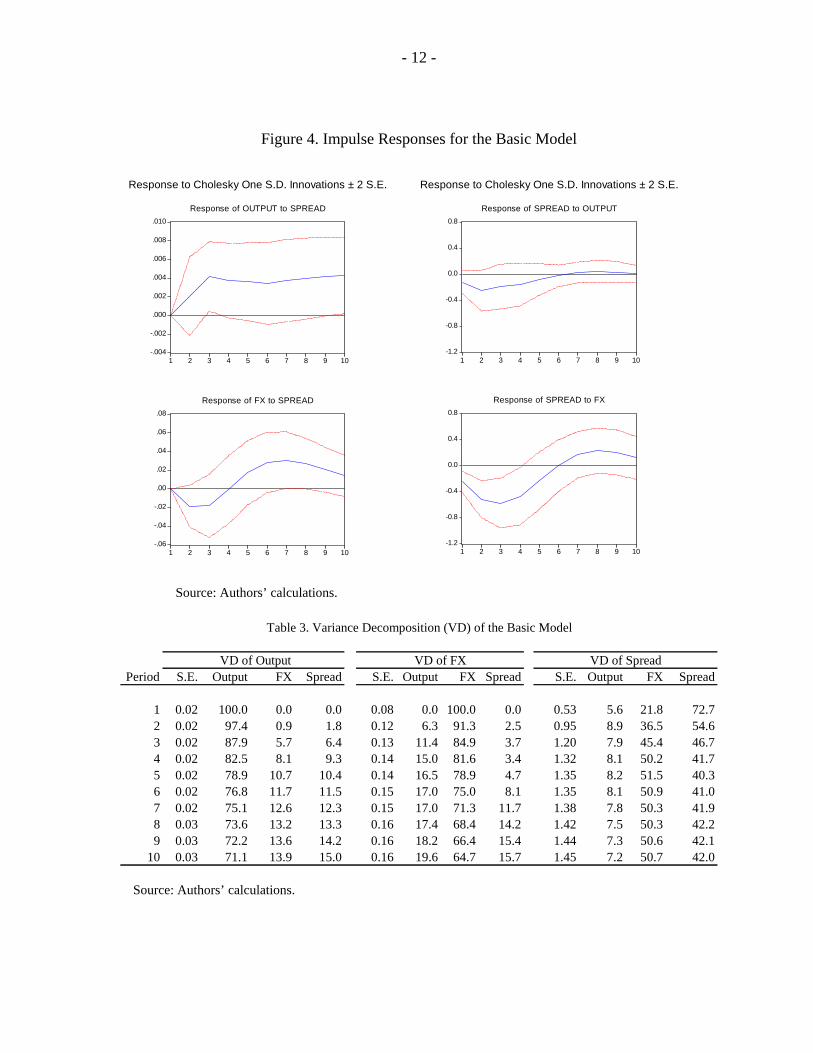
To see the influence of monetary policy on output and foreign reserves, we look at the impulse-response functions (Figure 4). The impact of monetary policy shocks on output is very small and has large standard errors. In particular, the estimated coefficient of the spread between the 3-month CD rate and the U.S. Federal Funds rate on output in the VAR was not statistically significant. Moreover, pairwise Granger causality tests reveal that we can reject the hypothesis that our monetary policy measure Granger causes output (Appendix II). To examine the share of fluctuations in a given variable that are caused by different shocks, Table 3 presents variance decompositions for each variable at forecast horizons of one through 10 quarters. The columns give the percentage of the variance due to each shock, with each row adding up to 100 percent. The results reveal that, after two years, monetary policy shocks account for only 13 percent of the fluctuation in output, with own shocks accounting for most of the rest.
12 Indeed, during the period of analysis (1996–2005), average CPI inflations in the United States and Jordan have been similar, with a mean of 2.3 for the former and 2.0 for the latter. We include inflation in one VAR but do not find any effect of inflation on output or of monetary policy on inflation because, in a fixed exchange rate regime, inflation is imported. Hence, we omitted inflation from the model.
- 12 -
-1.2
-0.8
-0.4
0.0
0.4
0.8
1 2 3 4 5 6 7 8 9 10
Response of SPREAD to OUTPUT
-1.2
-0.8
-0.4
0.0
0.4
0.8
1 2 3 4 5 6 7 8 9 10
Response of SPREAD to FX
Response to Cholesky One S.D. Innovations ± 2 S.E.
Figure 4. Impulse Responses for the Basic Model
-.004
-.002
.000
.002
.004
.006
.008
.010
1 2 3 4 5 6 7 8 9 10
Response of OUTPUT to SPREAD
-.06
-.04
-.02
.00
.02
.04
.06
.08
1 2 3 4 5 6 7 8 9 10
Response of FX to SPREAD
Response to Cholesky One S.D. Innovations ± 2 S.E.
Source: Authors’ calculations.
Table 3. Variance Decomposition (VD) of the Basic Model
VD of Output VD of FX VD of Spread Period S.E. Output FX Spread S.E. Output FX Spread S.E. Output FX Spread
1 0.02 100.0 0.0 0.0 0.08 0.0 100.0 0.0 0.53 5.6 21.8 72.72 0.02 97.4 0.9 1.8 0.12 6.3 91.3 2.5 0.95 8.9 36.5 54.63 0.02 87.9 5.7 6.4 0.13 11.4 84.9 3.7 1.20 7.9 45.4 46.74 0.02 82.5 8.1 9.3 0.14 15.0 81.6 3.4 1.32 8.1 50.2 41.75 0.02 78.9 10.7 10.4 0.14 16.5 78.9 4.7 1.35 8.2 51.5 40.36 0.02 76.8 11.7 11.5 0.15 17.0 75.0 8.1 1.35 8.1 50.9 41.07 0.02 75.1 12.6 12.3 0.15 17.0 71.3 11.7 1.38 7.8 50.3 41.98 0.03 73.6 13.2 13.3 0.16 17.4 68.4 14.2 1.42 7.5 50.3 42.29 0.03 72.2 13.6 14.2 0.16 18.2 66.4 15.4 1.44 7.3 50.6 42.1
10 0.03 71.1 13.9 15.0 0.16 19.6 64.7 15.7 1.45 7.2 50.7 42.0
Source: Authors’ calculations.
- 13 -
Tighter monetary policy (defined as a positive shock of 1 standard deviation to the spread between Jordan’s 3-month CD rate and the U.S. Federal Funds rate)13 led to a fall in foreign reserves for the first two quarters, bottoming out at about 2 percent, and then to an increase until the seventh quarter of about 3 percent, after which the impact starts to fade. The decrease over the first two quarters suggests that tighter monetary policy is a preemptive measure to the possible capital outflow, and that increasing interest rates and capital outflows are contemporaneous. This result may suggest that the CBJ reacts to a fall in reserves by increasing interest rates spreads.
Looking at monetary policy response to shocks to reserves and output, we find that a positive shock to international reserves has a negative impact on the spread between 3-month CD rates in Jordan and the U.S. Federal Funds rate for about two quarters. This suggests that a higher level of international reserves gives more room for easing monetary policy in Jordan. Similarly, a positive shock to real GDP gives the central bank room to reduce rates, with the negative impact ending after two quarters.
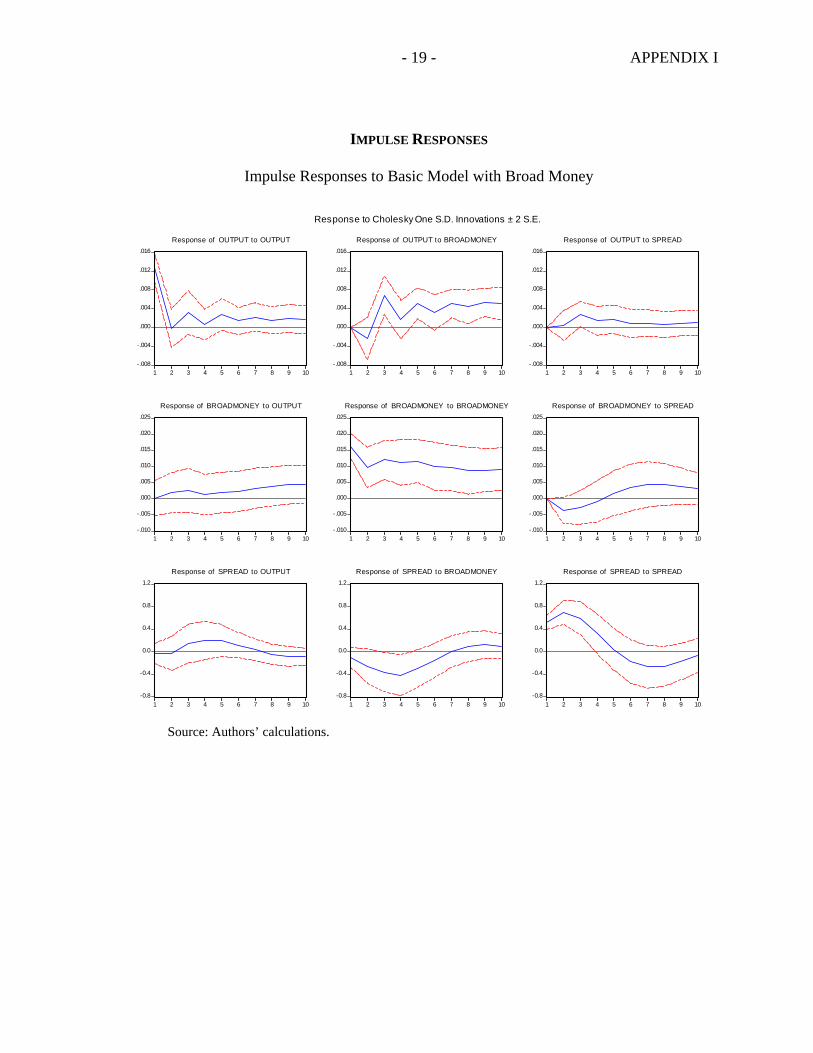
Subsequently, we used a variation of the basic model with output, broad money, and spreads between 3-month CD rates in Jordan and the U.S. Federal Funds rate to examine monetary transmission. We found a statistically significant positive effect from broad money to real output on the second quarter. Since neither the credit channel nor the interest channel seems to affect output, this positive relationship may be due to third-factor effects. For instance, positive productivity or balance of payments shocks cause output to rise and capital inflows and money supply to increase. Variance decomposition suggests that, after two years, broad money shocks account for 40 percent of the fluctuations in output, while own shocks account for more than half of such variance. In other words, while monetary policy, through spread, does not affect output, broad money does. To better understand the link between broad money and output, we divided broad money into money and quasi-money. The results from this model indicate that it is quasi-money (time and savings deposits) rather than money that primarily affects output. Variance decomposition suggests that, after two years, quasi-money accounts for 33 percent of the fluctuation in output, money accounts for 6 percent, and the spread for only 3 percent. Granger causality tests confirm that broad money causes output.
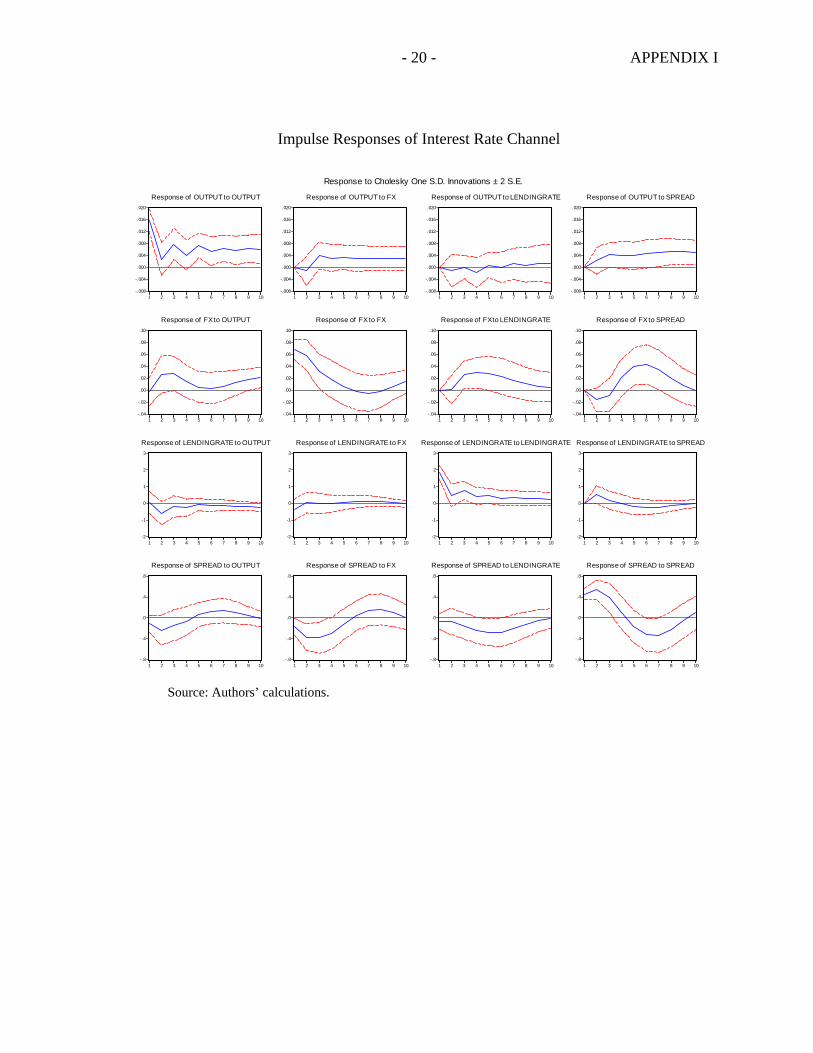
B. Interest Rate Channel
To test for the interest rate channel, we appended our basic model with the real lending rate. The variables in this expanded VAR have the following ordering: real output, foreign reserves, real lending rate, and spread between Jordan’s 3-month CD rates and the U.S. Federal Funds rate.
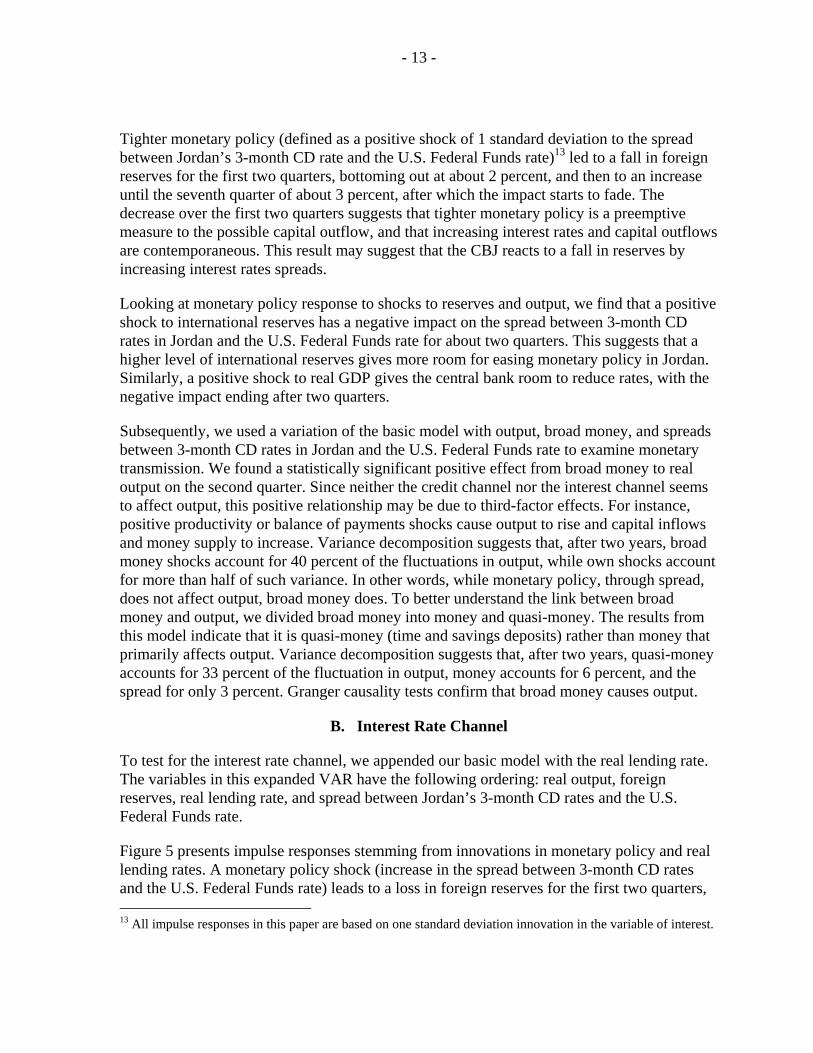
Figure 5 presents impulse responses stemming from innovations in monetary policy and real lending rates. A monetary policy shock (increase in the spread between 3-month CD rates and the U.S. Federal Funds rate) leads to a loss in foreign reserves for the first two quarters, 13 All impulse responses in this paper are based on one standard deviation innovation in the variable of interest.
- 14 -
-.002
-.001
.000
.001
.002
.003
.004
.005
.006
1 2 3 4 5 6 7 8 9 10
LENDINGRATE SPREAD
Response of OUTPUT to CholeskyOne S.D. Innovations
then to an increase, which peaks by the sixth quarter, after which reserves fall and converge to their long-run level. A monetary policy innovation increases real lending rates for the first two quarters, after which they start falling, with the effect fading after 10 quarters. Variance decomposition indicates that, after two years, monetary policy accounts for 18 percent of the fluctuation in output, while own shocks account for most of the variance.
Figure 5. Impulse Responses to Real Lending Rates and Spreads
-.02
-.01
.00
.01
.02
.03
.04
.05
1 2 3 4 5 6 7 8 9 10
LENDINGRATE SPREAD
Response of FX to CholeskyOne S.D. Innovations
-0.4
0.0
0.4
0.8
1.2
1.6
2.0
1 2 3 4 5 6 7 8 9 10
LENDINGRATE SPREAD
Response of LENDINGRATE to CholeskyOne S.D. Innovations
Source: Authors’ calculations.
- 15 -
A positive shock to the real lending rate does not affect output, but it increases foreign reserves up to the fifth quarter, after which the effects start to die out. Variance decomposition indicates that real lending contributes to only 1 percent of the variance in output for the first two years. Granger causality tests show that real lending does not cause output.
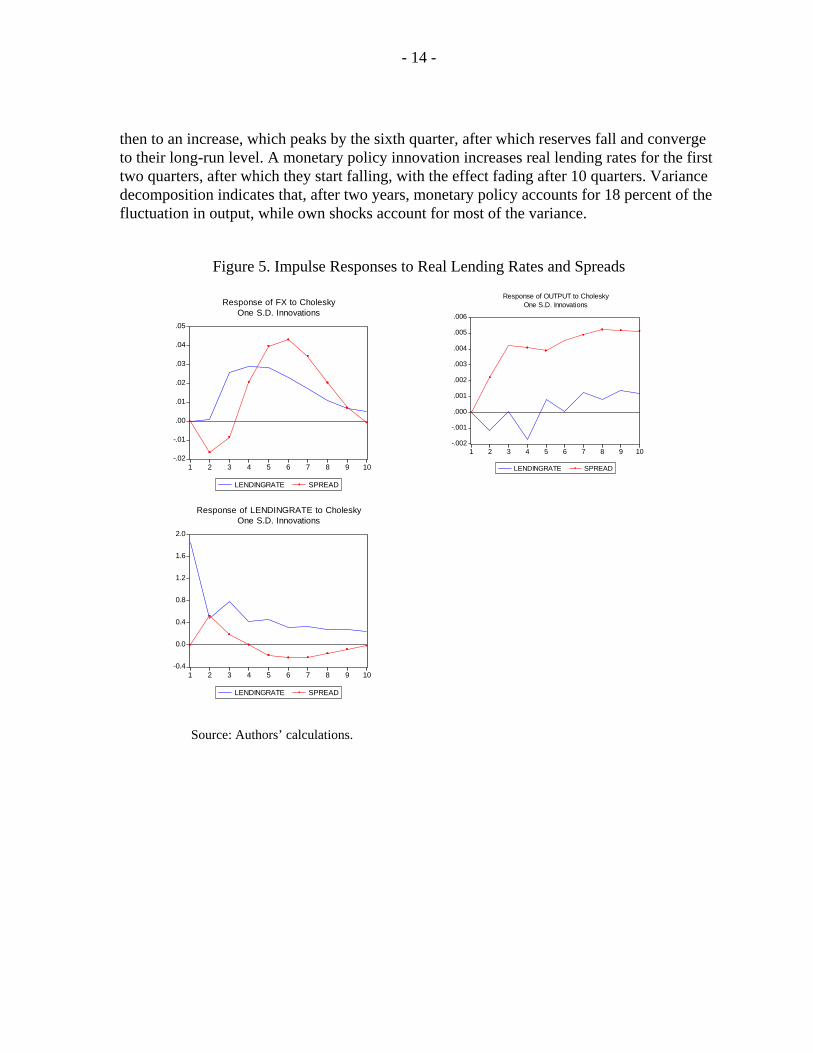
The results from exogenizing real lending rates (Figure 6) show that they have little explanatory power for variations in output.
Figure 6. Cumulative Impulse Responses to Real Lending Rates
Source: Authors’ calculations.
C. Credit Channel
Bank lending is the primary source of financing in Jordan, with the ratio of domestic credit to GDP being more than 80 percent for over a decade until 2003. In 2004, the ratio has increased gradually. The overall stable behavior of the ratio (Figure 7) suggests that interest rate variations have had little impact on the level of domestic credit. Since September 1998, the central bank has gradually decreased the 3-month CD rate from about 10 percent to about 4 percent in March 2005. As a result, real interest rates on CDs decreased from about 9 percent to 3 percent for the same period. However, no major changes in the domestic credit-to-GDP ratio was observed, except in the last two years.
To examine the importance of bank
0
0.001
0.002
0.003
0.004
0.005
0.006
1 2 3 4 5 6 7 8 9 10 11 12
Quarters
Lending rate (endogenous) Lending rate (exogenous)
0
0.001
0.002
0.003
0.004
0.005
0.006
1 2 3 4 5 6 7 8 9 10 11 12
Quarters
Lending model Basic model
Figure 7. Domestic Credit, 3-Month CD, and Real Lending Rates(In percent)
0
20
40
60
80
100
120
1995Q4 1996Q4 1997Q4 1998Q4 1999Q4 2000Q4 2001Q4 2002Q4 2003Q4 2004q40
2
4
6
8
10
12
14
Credit-GDP (left scale) CD3M Real lending rate
Sources: Central Bank of Jordan and authors' calculations.
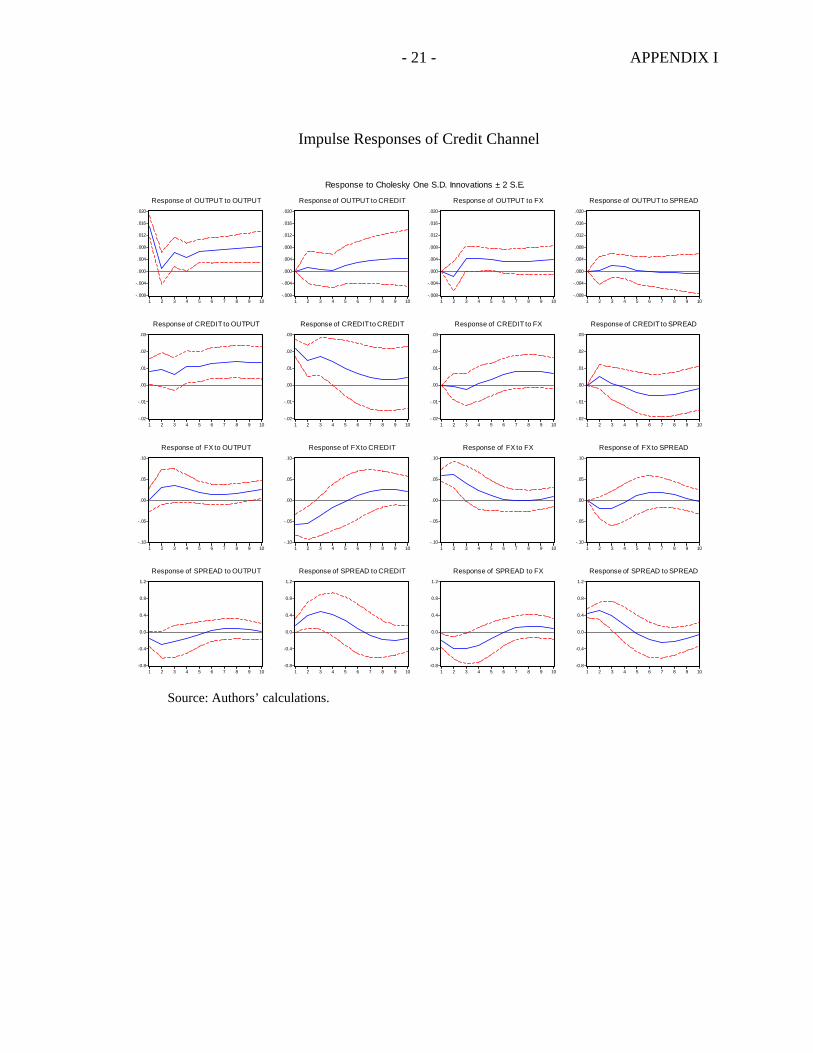
- 16 -
credit in the monetary transmission mechanism, we included the natural log of seasonally adjusted real domestic credit in the VAR.14 The ordering is as follows: real output, real credit, foreign reserves, and spread between 3-month CD rates and the U.S. Federal Funds rate. Impulse responses suggest that output responses to a monetary shock through the domestic credit channel are weak. Granger causality tests reveal that credit Granger causes output at the first lag only. Similarly, a shock to real lending rates does not have an impact on output. Variance decomposition suggests that, after two years, credit accounts for 7 percent of the fluctuation in output, the spread between 3-month CD rates and the U.S. Federal Funds rate accounts for 1 percent, and foreign reserves for 14 percent, while own shocks account for 78 percent of such variance, a significantly higher value than for any other variable in the VAR.
D. Equity Price Channel
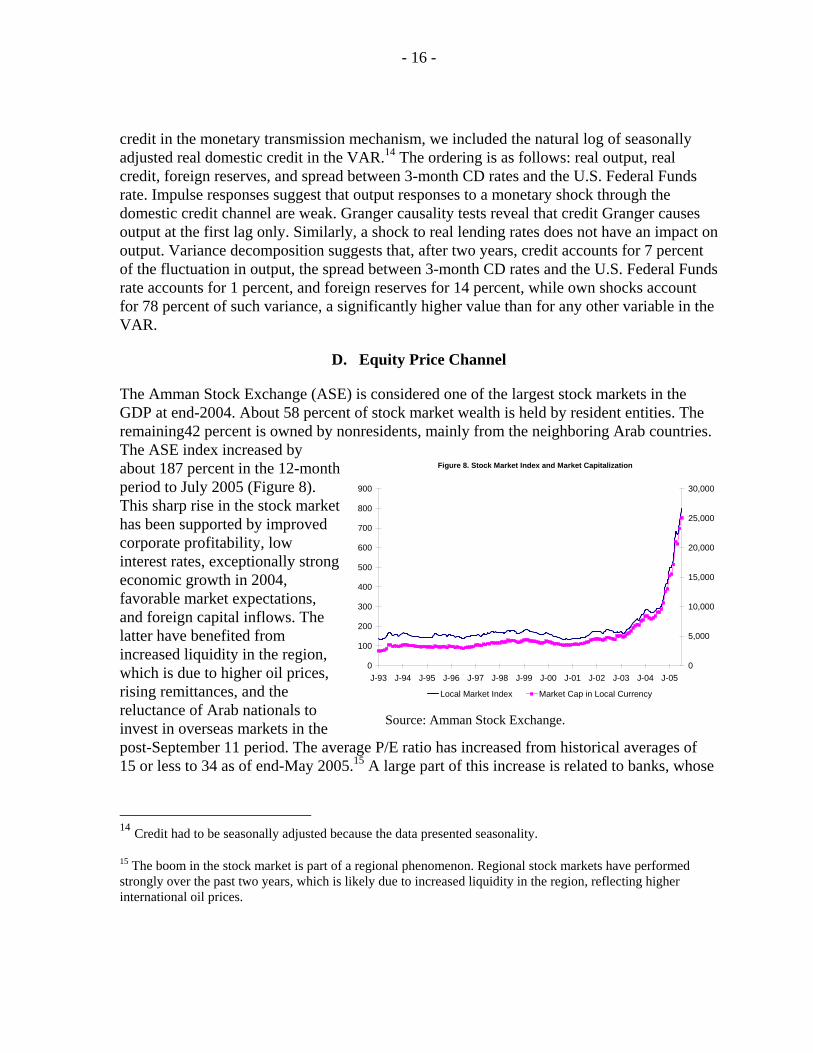
The Amman Stock Exchange (ASE) is considered one of the largest stock markets in the GDP at end-2004. About 58 percent of stock market wealth is held by resident entities. The remaining42 percent is owned by nonresidents, mainly from the neighboring Arab countries. The ASE index increased by about 187 percent in the 12-month period to July 2005 (Figure 8). This sharp rise in the stock market has been supported by improved corporate profitability, low interest rates, exceptionally strong economic growth in 2004, favorable market expectations, and foreign capital inflows. The latter have benefited from increased liquidity in the region, which is due to higher oil prices, rising remittances, and the reluctance of Arab nationals to invest in overseas markets in the post-September 11 period. The average P/E ratio has increased from historical averages of 15 or less to 34 as of end-May 2005.15 A large part of this increase is related to banks, whose
14 Credit had to be seasonally adjusted because the data presented seasonality.
15 The boom in the stock market is part of a regional phenomenon. Regional stock markets have performed strongly over the past two years, which is likely due to increased liquidity in the region, reflecting higher international oil prices.
Figure 8. Stock Market Index and Market Capitalization
0
100
200
300
400
500
600
700
800
900
J-93 J-94 J-95 J-96 J-97 J-98 J-99 J-00 J-01 J-02 J-03 J-04 J-050
5,000
10,000
15,000
20,000
25,000
30,000
Local Market Index Market Cap in Local Currency
Source: Amman Stock Exchange.
- 17 -
average P/E ratio of about 43 is now much higher than that of industry (24), the service sector (26), and insurance companies (14).
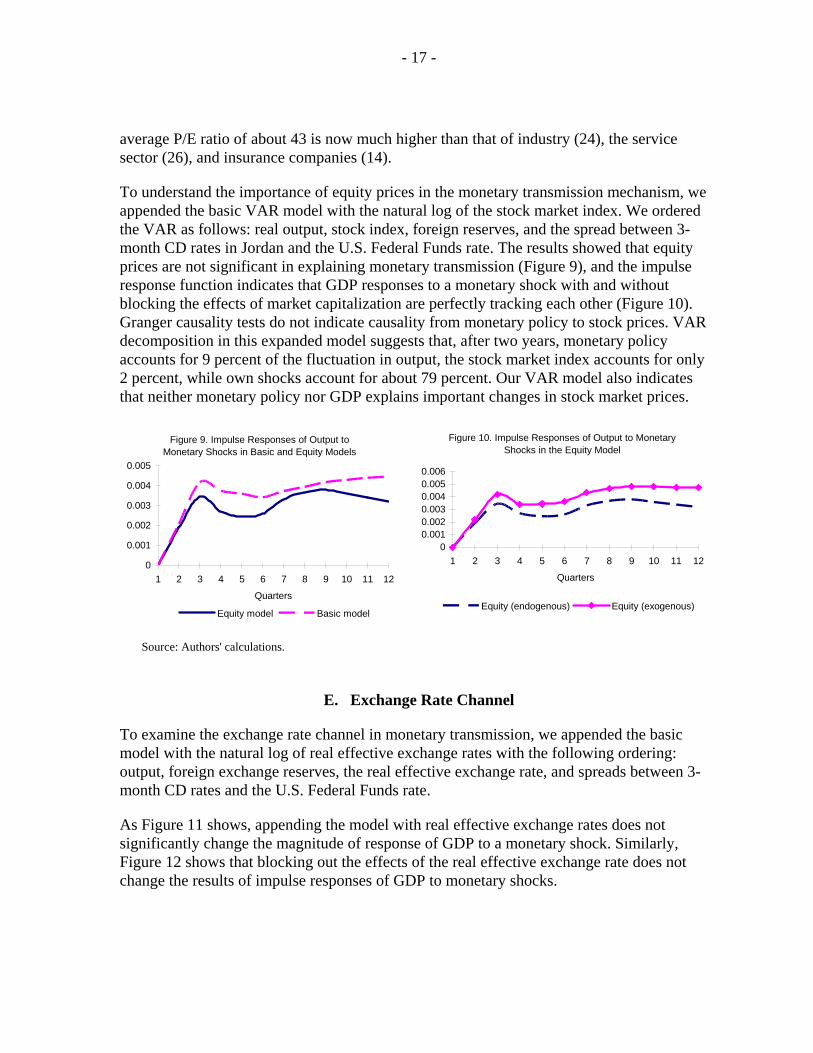
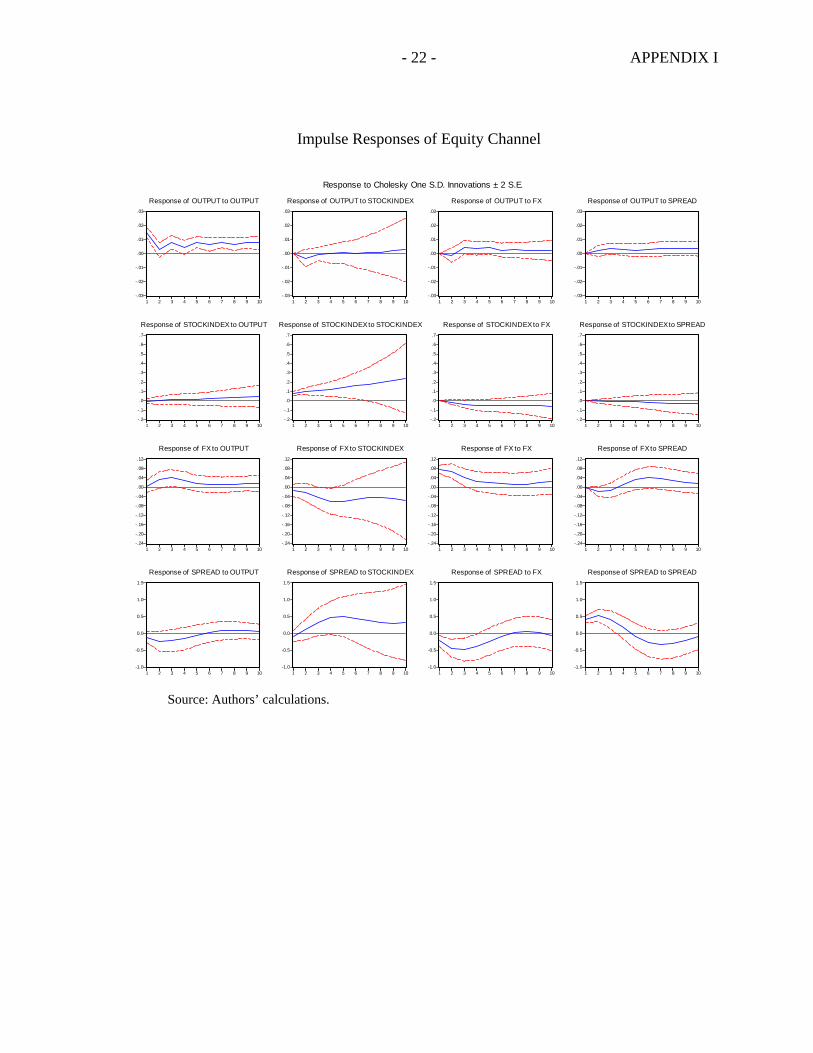
To understand the importance of equity prices in the monetary transmission mechanism, we appended the basic VAR model with the natural log of the stock market index. We ordered the VAR as follows: real output, stock index, foreign reserves, and the spread between 3-month CD rates in Jordan and the U.S. Federal Funds rate. The results showed that equity prices are not significant in explaining monetary transmission (Figure 9), and the impulse response function indicates that GDP responses to a monetary shock with and without blocking the effects of market capitalization are perfectly tracking each other (Figure 10). Granger causality tests do not indicate causality from monetary policy to stock prices. VAR decomposition in this expanded model suggests that, after two years, monetary policy accounts for 9 percent of the fluctuation in output, the stock market index accounts for only 2 percent, while own shocks account for about 79 percent. Our VAR model also indicates that neither monetary policy nor GDP explains important changes in stock market prices.
Figure 10. Impulse Responses of Output to Monetary Shocks in the Equity Model
00.0010.0020.0030.0040.0050.006
1 2 3 4 5 6 7 8 9 10 11 12
Quarters
Equity (endogenous) Equity (exogenous)
Figure 9. Impulse Responses of Output to Monetary Shocks in Basic and Equity Models
0
0.001
0.002
0.003
0.004
0.005
1 2 3 4 5 6 7 8 9 10 11 12
Quarters
Equity model Basic model
Source: Authors' calculations.
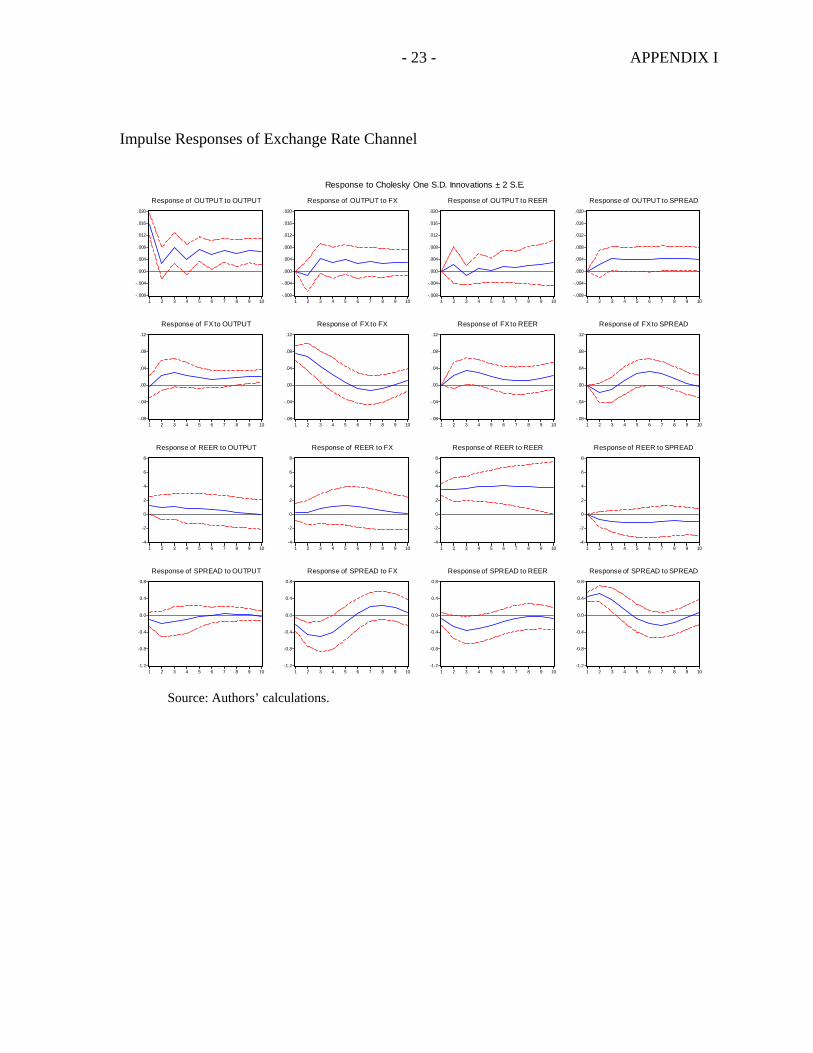
E. Exchange Rate Channel
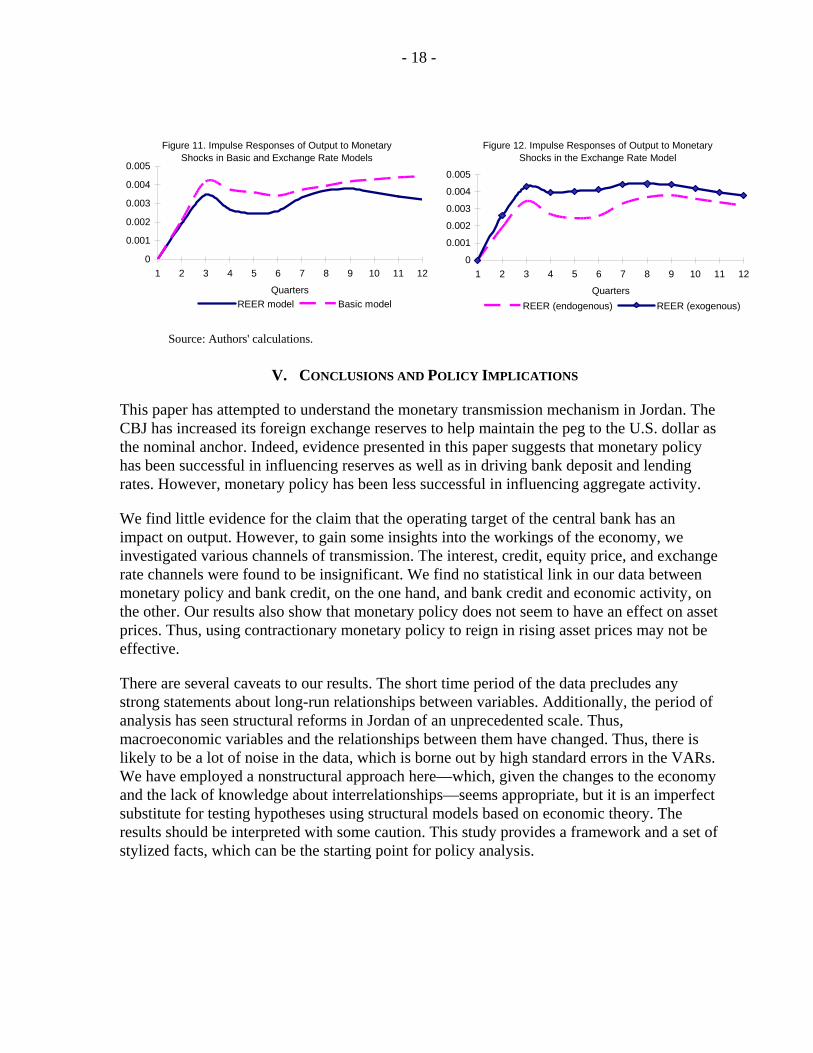
To examine the exchange rate channel in monetary transmission, we appended the basic model with the natural log of real effective exchange rates with the following ordering: output, foreign exchange reserves, the real effective exchange rate, and spreads between 3-month CD rates and the U.S. Federal Funds rate.
As Figure 11 shows, appending the model with real effective exchange rates does not significantly change the magnitude of response of GDP to a monetary shock. Similarly, Figure 12 shows that blocking out the effects of the real effective exchange rate does not change the results of impulse responses of GDP to monetary shocks.
- 18 -
Figure 11. Impulse Responses of Output to Monetary Shocks in Basic and Exchange Rate Models
0
0.001
0.002
0.003
0.004
0.005
1 2 3 4 5 6 7 8 9 10 11 12
QuartersREER model Basic model
Figure 12. Impulse Responses of Output to Monetary Shocks in the Exchange Rate Model
0
0.001
0.002
0.003
0.004
0.005
1 2 3 4 5 6 7 8 9 10 11 12
QuartersREER (endogenous) REER (exogenous)
Source: Authors' calculations.
V. CONCLUSIONS AND POLICY IMPLICATIONS
This paper has attempted to understand the monetary transmission mechanism in Jordan. The CBJ has increased its foreign exchange reserves to help maintain the peg to the U.S. dollar as the nominal anchor. Indeed, evidence presented in this paper suggests that monetary policy has been successful in influencing reserves as well as in driving bank deposit and lending rates. However, monetary policy has been less successful in influencing aggregate activity.
We find little evidence for the claim that the operating target of the central bank has an impact on output. However, to gain some insights into the workings of the economy, we investigated various channels of transmission. The interest, credit, equity price, and exchange rate channels were found to be insignificant. We find no statistical link in our data between monetary policy and bank credit, on the one hand, and bank credit and economic activity, on the other. Our results also show that monetary policy does not seem to have an effect on asset prices. Thus, using contractionary monetary policy to reign in rising asset prices may not be effective.
There are several caveats to our results. The short time period of the data precludes any strong statements about long-run relationships between variables. Additionally, the period of analysis has seen structural reforms in Jordan of an unprecedented scale. Thus, macroeconomic variables and the relationships between them have changed. Thus, there is likely to be a lot of noise in the data, which is borne out by high standard errors in the VARs. We have employed a nonstructural approach here—which, given the changes to the economy and the lack of knowledge about interrelationships—seems appropriate, but it is an imperfect substitute for testing hypotheses using structural models based on economic theory. The results should be interpreted with some caution. This study provides a framework and a set of stylized facts, which can be the starting point for policy analysis.
- 19 - APPENDIX I
IMPULSE RESPONSES
Impulse Responses to Basic Model with Broad Money
-.008
-.004
.000
.004
.008
.012
.016
1 2 3 4 5 6 7 8 9 10
Response of OUTPUT to OUTPUT
-.008
-.004
.000
.004
.008
.012
.016
1 2 3 4 5 6 7 8 9 10
Response of OUTPUT to BROADMONEY
-.008
-.004
.000
.004
.008
.012
.016
1 2 3 4 5 6 7 8 9 10
Response of OUTPUT to SPREAD
-.010
-.005
.000
.005
.010
.015
.020
.025
1 2 3 4 5 6 7 8 9 10
Response of BROADMONEY to OUTPUT
-.010
-.005
.000
.005
.010
.015
.020
.025
1 2 3 4 5 6 7 8 9 10
Response of BROADMONEY to BROADMONEY
-.010
-.005
.000
.005
.010
.015
.020
.025
1 2 3 4 5 6 7 8 9 10
Response of BROADMONEY to SPREAD
-0.8
-0.4
0.0
0.4
0.8
1.2
1 2 3 4 5 6 7 8 9 10
Response of SPREAD to OUTPUT
-0.8
-0.4
0.0
0.4
0.8
1.2
1 2 3 4 5 6 7 8 9 10
Response of SPREAD to BROADMONEY
-0.8
-0.4
0.0
0.4
0.8
1.2
1 2 3 4 5 6 7 8 9 10
Response of SPREAD to SPREAD
Response to Cholesky One S.D. Innovations ± 2 S.E.
Source: Authors’ calculations.
- 20 - APPENDIX I
Impulse Responses of Interest Rate Channel
-.008
-.004
.000
.004
.008
.012
.016
.020
1 2 3 4 5 6 7 8 9 10
Response of OUTPUT to OUTPUT
-.008
-.004
.000
.004
.008
.012
.016
.020
1 2 3 4 5 6 7 8 9 10
Response of OUTPUT to FX
-.008
-.004
.000
.004
.008
.012
.016
.020
1 2 3 4 5 6 7 8 9 10
Response of OUTPUT to LENDINGRATE
-.008
-.004
.000
.004
.008
.012
.016
.020
1 2 3 4 5 6 7 8 9 10
Response of OUTPUT to SPREAD
-.04
-.02
.00
.02
.04
.06
.08
.10
1 2 3 4 5 6 7 8 9 10
Response of FX to OUTPUT
-.04
-.02
.00
.02
.04
.06
.08
.10
1 2 3 4 5 6 7 8 9 10
Response of FX to FX
-.04
-.02
.00
.02
.04
.06
.08
.10
1 2 3 4 5 6 7 8 9 10
Response of FX to LENDINGRATE
-.04
-.02
.00
.02
.04
.06
.08
.10
1 2 3 4 5 6 7 8 9 10
Response of FX to SPREAD
-2
-1
0
1
2
3
1 2 3 4 5 6 7 8 9 10
Response of LENDINGRATE to OUTPUT
-2
-1
0
1
2
3
1 2 3 4 5 6 7 8 9 10
Response of LENDINGRATE to FX
-2
-1
0
1
2
3
1 2 3 4 5 6 7 8 9 10
Response of LENDINGRATE to LENDINGRATE
-2
-1
0
1
2
3
1 2 3 4 5 6 7 8 9 10
Response of LENDINGRATE to SPREAD
-.8
-.4
.0
.4
.8
1 2 3 4 5 6 7 8 9 10
Response of SPREAD to OUTPUT
-.8
-.4
.0
.4
.8
1 2 3 4 5 6 7 8 9 10
Response of SPREAD to FX
-.8
-.4
.0
.4
.8
1 2 3 4 5 6 7 8 9 10
Response of SPREAD to LENDINGRATE
-.8
-.4
.0
.4
.8
1 2 3 4 5 6 7 8 9 10
Response of SPREAD to SPREAD
Response to Cholesky One S.D. Innovations ± 2 S.E.
Source: Authors’ calculations.
- 21 - APPENDIX I
Impulse Responses of Credit Channel
-.008
-.004
.000
.004
.008
.012
.016
.020
1 2 3 4 5 6 7 8 9 10
Response of OUTPUT to OUTPUT
-.008
-.004
.000
.004
.008
.012
.016
.020
1 2 3 4 5 6 7 8 9 10
Response of OUTPUT to CREDIT
-.008
-.004
.000
.004
.008
.012
.016
.020
1 2 3 4 5 6 7 8 9 10
Response of OUTPUT to FX
-.008
-.004
.000
.004
.008
.012
.016
.020
1 2 3 4 5 6 7 8 9 10
Response of OUTPUT to SPREAD
-.02
-.01
.00
.01
.02
.03
1 2 3 4 5 6 7 8 9 10
Response of CREDIT to OUTPUT
-.02
-.01
.00
.01
.02
.03
1 2 3 4 5 6 7 8 9 10
Response of CREDIT to CREDIT
-.02
-.01
.00
.01
.02
.03
1 2 3 4 5 6 7 8 9 10
Response of CREDIT to FX
-.02
-.01
.00
.01
.02
.03
1 2 3 4 5 6 7 8 9 10
Response of CREDIT to SPREAD
-.10
-.05
.00
.05
.10
1 2 3 4 5 6 7 8 9 10
Response of FX to OUTPUT
-.10
-.05
.00
.05
.10
1 2 3 4 5 6 7 8 9 10
Response of FX to CREDIT
-.10
-.05
.00
.05
.10
1 2 3 4 5 6 7 8 9 10
Response of FX to FX
-.10
-.05
.00
.05
.10
1 2 3 4 5 6 7 8 9 10
Response of FX to SPREAD
-0.8
-0.4
0.0
0.4
0.8
1.2
1 2 3 4 5 6 7 8 9 10
Response of SPREAD to OUTPUT
-0.8
-0.4
0.0
0.4
0.8
1.2
1 2 3 4 5 6 7 8 9 10
Response of SPREAD to CREDIT
-0.8
-0.4
0.0
0.4
0.8
1.2
1 2 3 4 5 6 7 8 9 10
Response of SPREAD to FX
-0.8
-0.4
0.0
0.4
0.8
1.2
1 2 3 4 5 6 7 8 9 10
Response of SPREAD to SPREAD
Response to Cholesky One S.D. Innovations ± 2 S.E.
Source: Authors’ calculations.
- 22 - APPENDIX I
Impulse Responses of Equity Channel
-.03
-.02
-.01
.00
.01
.02
.03
1 2 3 4 5 6 7 8 9 10
Response of OUTPUT to OUTPUT
-.03
-.02
-.01
.00
.01
.02
.03
1 2 3 4 5 6 7 8 9 10
Response of OUTPUT to STOCKINDEX
-.03
-.02
-.01
.00
.01
.02
.03
1 2 3 4 5 6 7 8 9 10
Response of OUTPUT to FX
-.03
-.02
-.01
.00
.01
.02
.03
1 2 3 4 5 6 7 8 9 10
Response of OUTPUT to SPREAD
-.2
-.1
.0
.1
.2
.3
.4
.5
.6
.7
1 2 3 4 5 6 7 8 9 10
Response of STOCKINDEX to OUTPUT
-.2
-.1
.0
.1
.2
.3
.4
.5
.6
.7
1 2 3 4 5 6 7 8 9 10
Response of STOCKINDEX to STOCKINDEX
-.2
-.1
.0
.1
.2
.3
.4
.5
.6
.7
1 2 3 4 5 6 7 8 9 10
Response of STOCKINDEX to FX
-.2
-.1
.0
.1
.2
.3
.4
.5
.6
.7
1 2 3 4 5 6 7 8 9 10
Response of STOCKINDEX to SPREAD
-.24
-.20
-.16
-.12
-.08
-.04
.00
.04
.08
.12
1 2 3 4 5 6 7 8 9 10
Response of FX to OUTPUT
-.24
-.20
-.16
-.12
-.08
-.04
.00
.04
.08
.12
1 2 3 4 5 6 7 8 9 10
Response of FX to STOCKINDEX
-.24
-.20
-.16
-.12
-.08
-.04
.00
.04
.08
.12
1 2 3 4 5 6 7 8 9 10
Response of FX to FX
-.24
-.20
-.16
-.12
-.08
-.04
.00
.04
.08
.12
1 2 3 4 5 6 7 8 9 10
Response of FX to SPREAD
-1.0
-0.5
0.0
0.5
1.0
1.5
1 2 3 4 5 6 7 8 9 10
Response of SPREAD to OUTPUT
-1.0
-0.5
0.0
0.5
1.0
1.5
1 2 3 4 5 6 7 8 9 10
Response of SPREAD to STOCKINDEX
-1.0
-0.5
0.0
0.5
1.0
1.5
1 2 3 4 5 6 7 8 9 10
Response of SPREAD to FX
-1.0
-0.5
0.0
0.5
1.0
1.5
1 2 3 4 5 6 7 8 9 10
Response of SPREAD to SPREAD
Response to Cholesky One S.D. Innovations ± 2 S.E.
Source: Authors’ calculations.
- 23 - APPENDIX I
Impulse Responses of Exchange Rate Channel
-.008
-.004
.000
.004
.008
.012
.016
.020
1 2 3 4 5 6 7 8 9 10
Response of OUTPUT to OUTPUT
-.008
-.004
.000
.004
.008
.012
.016
.020
1 2 3 4 5 6 7 8 9 10
Response of OUTPUT to FX
-.008
-.004
.000
.004
.008
.012
.016
.020
1 2 3 4 5 6 7 8 9 10
Response of OUTPUT to REER
-.008
-.004
.000
.004
.008
.012
.016
.020
1 2 3 4 5 6 7 8 9 10
Response of OUTPUT to SPREAD
-.08
-.04
.00
.04
.08
.12
1 2 3 4 5 6 7 8 9 10
Response of FX to OUTPUT
-.08
-.04
.00
.04
.08
.12
1 2 3 4 5 6 7 8 9 10
Response of FX to FX
-.08
-.04
.00
.04
.08
.12
1 2 3 4 5 6 7 8 9 10
Response of FX to REER
-.08
-.04
.00
.04
.08
.12
1 2 3 4 5 6 7 8 9 10
Response of FX to SPREAD
-4
-2
0
2
4
6
8
1 2 3 4 5 6 7 8 9 10
Response of REER to OUTPUT
-4
-2
0
2
4
6
8
1 2 3 4 5 6 7 8 9 10
Response of REER to FX
-4
-2
0
2
4
6
8
1 2 3 4 5 6 7 8 9 10
Response of REER to REER
-4
-2
0
2
4
6
8
1 2 3 4 5 6 7 8 9 10
Response of REER to SPREAD
-1.2
-0.8
-0.4
0.0
0.4
0.8
1 2 3 4 5 6 7 8 9 10
Response of SPREAD to OUTPUT
-1.2
-0.8
-0.4
0.0
0.4
0.8
1 2 3 4 5 6 7 8 9 10
Response of SPREAD to FX
-1.2
-0.8
-0.4
0.0
0.4
0.8
1 2 3 4 5 6 7 8 9 10
Response of SPREAD to REER
-1.2
-0.8
-0.4
0.0
0.4
0.8
1 2 3 4 5 6 7 8 9 10
Response of SPREAD to SPREAD
Response to Cholesky One S.D. Innovations ± 2 S.E.
Source: Authors’ calculations.
- 24 - APPENDIX II
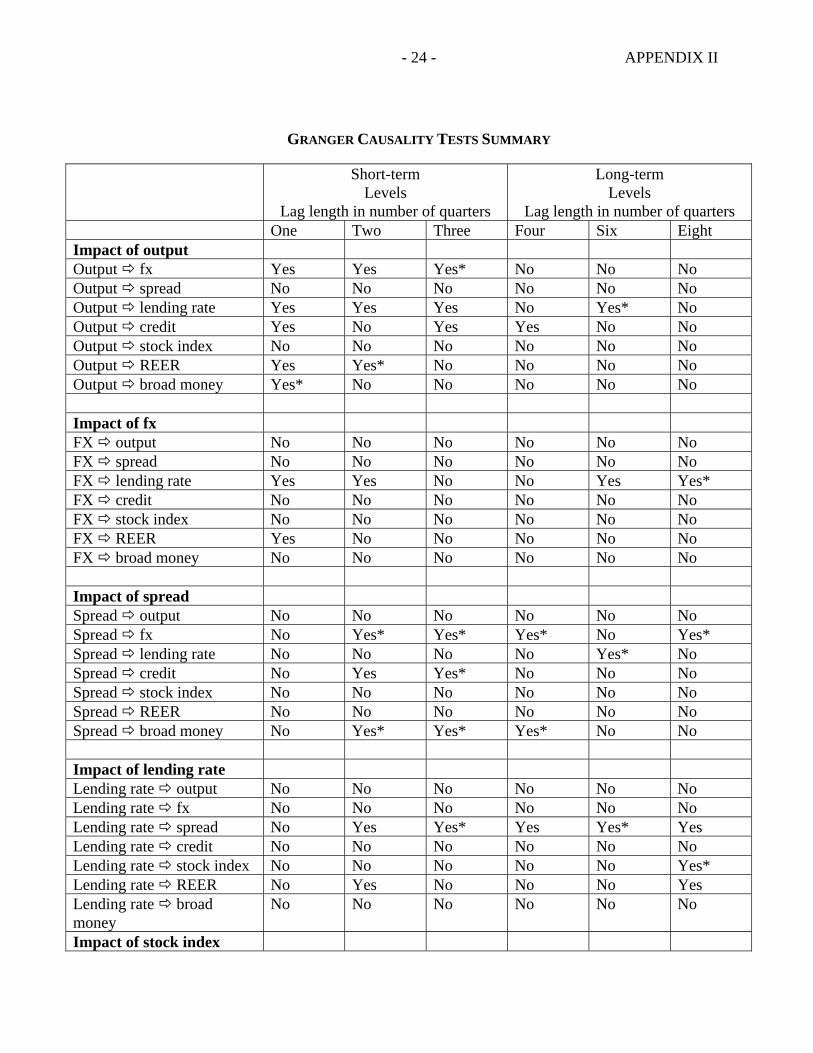
GRANGER CAUSALITY TESTS SUMMARY
Short-term Levels
Lag length in number of quarters
Long-term Levels
Lag length in number of quarters One Two Three Four Six Eight Impact of output Output fx Yes Yes Yes* No No No Output spread No No No No No No Output lending rate Yes Yes Yes No Yes* No Output credit Yes No Yes Yes No No Output stock index No No No No No No Output REER Yes Yes* No No No No Output broad money Yes* No No No No No Impact of fx FX output No No No No No No FX spread No No No No No No FX lending rate Yes Yes No No Yes Yes* FX credit No No No No No No FX stock index No No No No No No FX REER Yes No No No No No FX broad money No No No No No No Impact of spread Spread output No No No No No No Spread fx No Yes* Yes* Yes* No Yes* Spread lending rate No No No No Yes* No Spread credit No Yes Yes* No No No Spread stock index No No No No No No Spread REER No No No No No No Spread broad money No Yes* Yes* Yes* No No Impact of lending rate Lending rate output No No No No No No Lending rate fx No No No No No No Lending rate spread No Yes Yes* Yes Yes* Yes Lending rate credit No No No No No No Lending rate stock index No No No No No Yes* Lending rate REER No Yes No No No Yes Lending rate broad money
No No No No No No
Impact of stock index
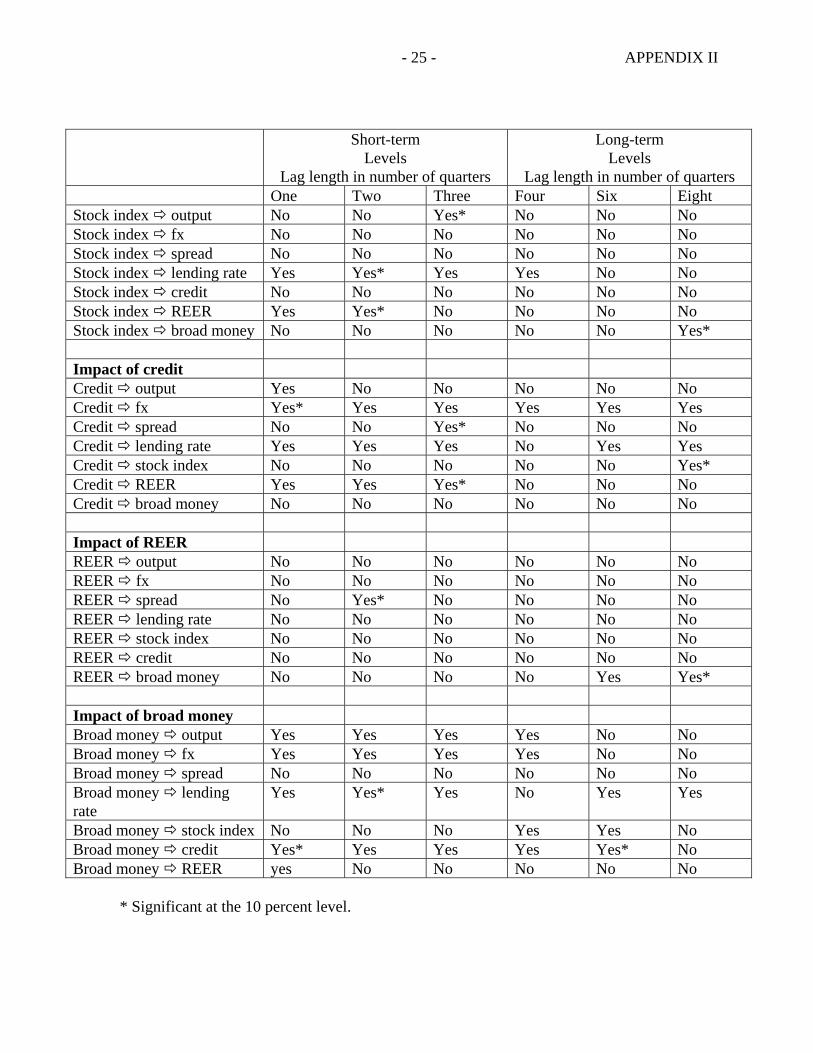
- 25 - APPENDIX II
Short-term Levels
Lag length in number of quarters
Long-term Levels
Lag length in number of quarters One Two Three Four Six Eight Stock index output No No Yes* No No No Stock index fx No No No No No No Stock index spread No No No No No No Stock index lending rate Yes Yes* Yes Yes No No Stock index credit No No No No No No Stock index REER Yes Yes* No No No No Stock index broad money No No No No No Yes* Impact of credit Credit output Yes No No No No No Credit fx Yes* Yes Yes Yes Yes Yes Credit spread No No Yes* No No No Credit lending rate Yes Yes Yes No Yes Yes Credit stock index No No No No No Yes* Credit REER Yes Yes Yes* No No No Credit broad money No No No No No No Impact of REER REER output No No No No No No REER fx No No No No No No REER spread No Yes* No No No No REER lending rate No No No No No No REER stock index No No No No No No REER credit No No No No No No REER broad money No No No No Yes Yes* Impact of broad money Broad money output Yes Yes Yes Yes No No Broad money fx Yes Yes Yes Yes No No Broad money spread No No No No No No Broad money lending rate
Yes Yes* Yes No Yes Yes
Broad money stock index No No No Yes Yes No Broad money credit Yes* Yes Yes Yes Yes* No Broad money REER yes No No No No No
* Significant at the 10 percent level.
- 26 -
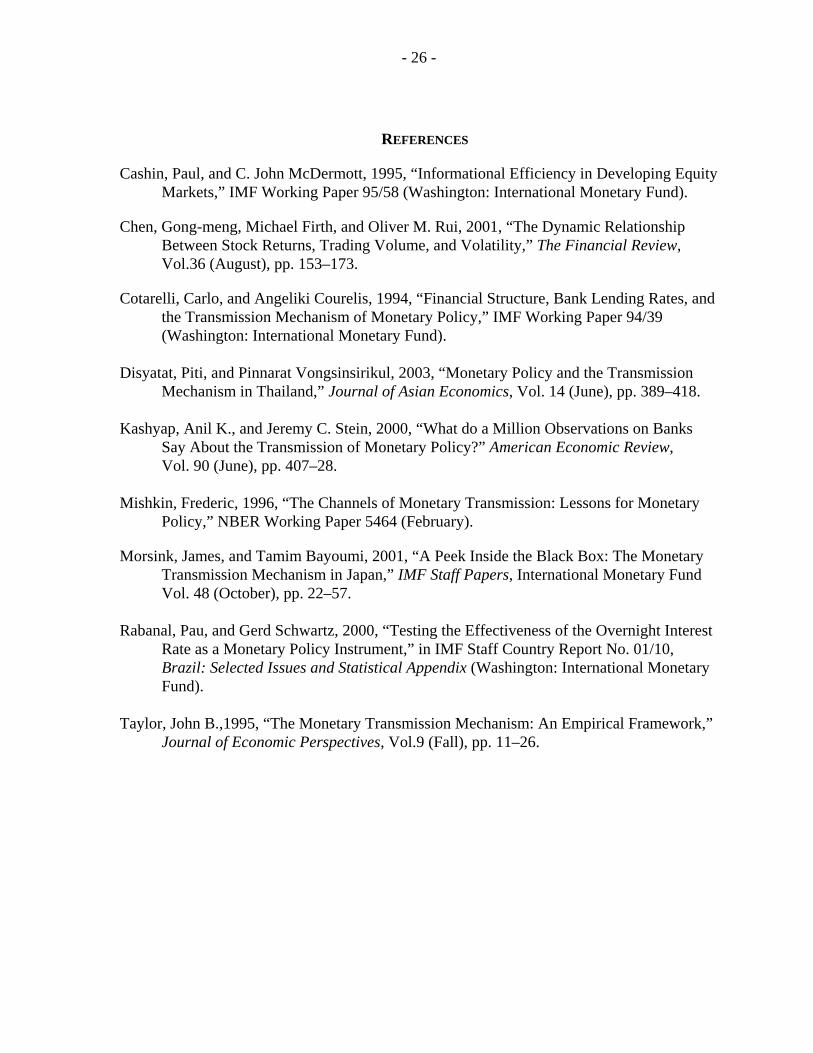
REFERENCES
Cashin, Paul, and C. John McDermott, 1995, “Informational Efficiency in Developing Equity Markets,” IMF Working Paper 95/58 (Washington: International Monetary Fund).
Chen, Gong-meng, Michael Firth, and Oliver M. Rui, 2001, “The Dynamic Relationship Between Stock Returns, Trading Volume, and Volatility,” The Financial Review, Vol.36 (August), pp. 153–173.
Cotarelli, Carlo, and Angeliki Courelis, 1994, “Financial Structure, Bank Lending Rates, and the Transmission Mechanism of Monetary Policy,” IMF Working Paper 94/39 (Washington: International Monetary Fund).
Disyatat, Piti, and Pinnarat Vongsinsirikul, 2003, “Monetary Policy and the Transmission
Mechanism in Thailand,” Journal of Asian Economics, Vol. 14 (June), pp. 389–418. Kashyap, Anil K., and Jeremy C. Stein, 2000, “What do a Million Observations on Banks
Say About the Transmission of Monetary Policy?” American Economic Review, Vol. 90 (June), pp. 407–28.
Mishkin, Frederic, 1996, “The Channels of Monetary Transmission: Lessons for Monetary
Policy,” NBER Working Paper 5464 (February).
Morsink, James, and Tamim Bayoumi, 2001, “A Peek Inside the Black Box: The Monetary Transmission Mechanism in Japan,” IMF Staff Papers, International Monetary Fund Vol. 48 (October), pp. 22–57.
Rabanal, Pau, and Gerd Schwartz, 2000, “Testing the Effectiveness of the Overnight Interest
Rate as a Monetary Policy Instrument,” in IMF Staff Country Report No. 01/10, Brazil: Selected Issues and Statistical Appendix (Washington: International Monetary Fund).
Taylor, John B.,1995, “The Monetary Transmission Mechanism: An Empirical Framework,”
Journal of Economic Perspectives, Vol.9 (Fall), pp. 11–26.


![[MOH Jordan] Jordan Public Health Surveillance](https://img.pdfslide.net/doc/110x75/586a119d1a28ab677d8bb3dc/moh-jordan-jordan-public-health-surveillance.jpg)