Embed Size (px)
Citation preview
The Mortgage Foreclosure Process amongst Homogenous Neighborhoods in San Antonio
Dr. Christine Drennon, Lucy Elder, Adrian Lopez-Mobilia, Patricia Perez
Abstract: Foreclosure rates in the San Antonio area have increased substantially over the past several years with no firm explanation for the process that is causing this increase. Our research goal is to identify the foreclosure process in San Antonio. We will focus on characteristics of 20 neighborhoods located in the northwestern part of the city. These neighborhoods are homogenous within but heterogeneous between and it is in these homogenous characteristics that we explain the foreclosure process. We will test the process we have identified in a multi-agent system in order to verify our results with the ultimate goal of being able to simulate the process in other areas of San Antonio.
Introduction
The rising rate of mortgage foreclosures in the United States not only affects individuals in foreclosure, but also impacts society as a whole. The root of the current foreclosure crisis stems back to the housing boom, when interest rates were relatively low and housing prices were rising. During this time, mortgage brokers relaxed lending standards and provided subprime mortgages to individuals with poor credit scores. The terms of subprime mortgages include higher interest rates (at least 2-3 percent higher) that are often at adjustable rates. Adjustable rate mortgages (ARMs) typically adjust at much higher interest rates resulting in a significant increase in an individual’s mortgage payment, which can cause an individual to foreclose on their home.
Currently, ARMs have the highest rate of foreclosure. However, many other
standard mortgages are also experiencing difficulties as the value of homes has fallen.
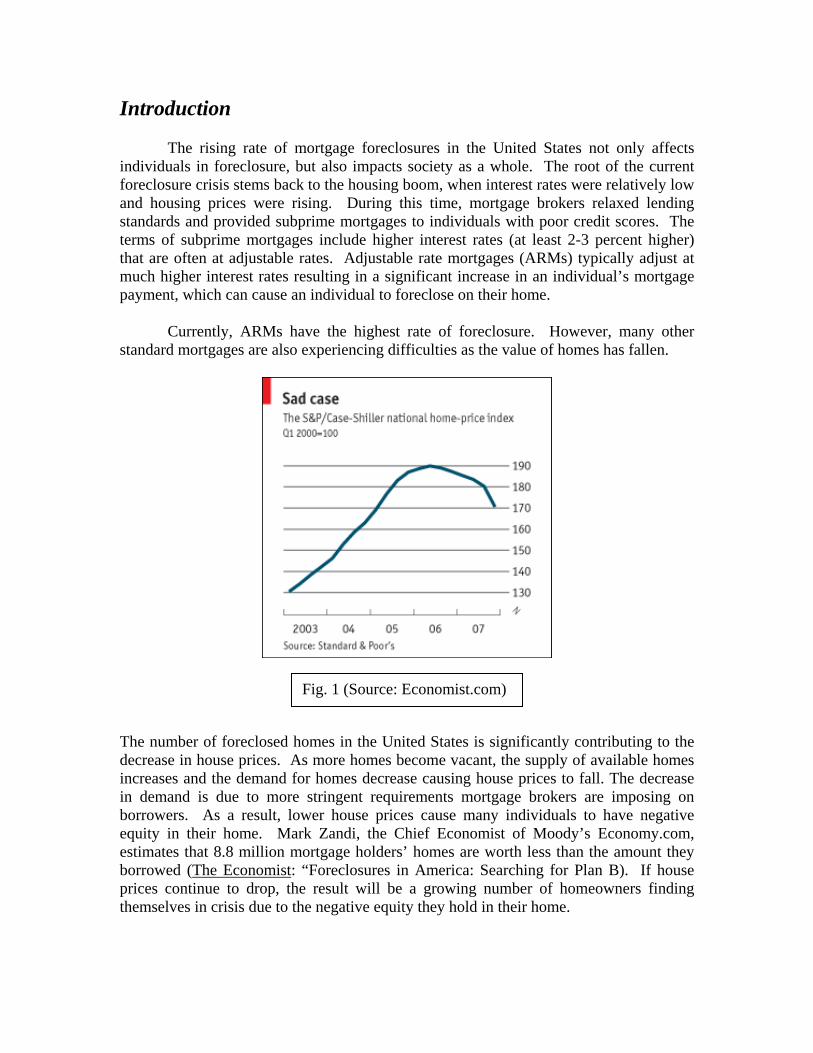
The number of foreclosed homes in the United States is significantly contributing to the decrease in house prices. As more homes become vacant, the supply of available homes increases and the demand for homes decrease causing house prices to fall. The decrease in demand is due to more stringent requirements mortgage brokers are imposing on borrowers. As a result, lower house prices cause many individuals to have negative equity in their home. Mark Zandi, the Chief Economist of Moody’s Economy.com, estimates that 8.8 million mortgage holders’ homes are worth less than the amount they borrowed (The Economist: “Foreclosures in America: Searching for Plan B). If house prices continue to drop, the result will be a growing number of homeowners finding themselves in crisis due to the negative equity they hold in their home.
Fig. 1 (Source: Economist.com)
The impact of the foreclosure crisis is devastating thousands of homeowners in San Antonio. Several of the areas in San Antonio being heavily impacted by this situation are newer neighborhoods, built in the 1980s and many in the 1990s and 2000s. The building process of these relatively new neighborhoods is one that creates a very homogenous environment within the neighborhood itself. These homes are very similar in size, style, and price. The relationship between these homogenous neighborhoods and their foreclosure rates will be the main focus of our research. Related Work In this section I will speak about related work in two categories. The first focuses on housing sub-markets and the spatial creation of these markets. The second group of related works focuses on the impact of subprime mortgages and foreclosures.
Housing Sub-markets
Previous publications by David Harvey of Johns Hopkins University address various ideas concerning housing markets. In his article titled, “Class-Monopoly Rent, Finance Capital and the Urban Revolution”, Harvey addresses financial institutions that function solely in the housing market (p244). Through his research on the housing sub-markets in Baltimore, Maryland, he identified an explanation for the structure of these sub-markets that differed significantly from previous thought. Harvey found that:
Residential differentiation in urban areas has long been explained in terms of social ecological processes, consumer preferences, utility-maximizing behaviors on the part of individuals, and the like. The Baltimore evidence suggests that financial and governmental institutions play an active role in shaping residential differentiation and that the active agent in the process is an investor seeking to realize a class-monopoly rent (Harvey “Class-Monopoly Rent”, 249).
Harvey then states that most of these financial institutions’ primary goals are to expand business and create profits, which cause them to invest in more stable landlords/homeowners (Harvey “Class-Monopoly Rent”, 249).
Another work by David Harvey titled, “Society, the City and the Space-Economy of Urbanism” also addresses housing markets where he discusses the relationship between use-values and exchange-values. He described use-values as values homeowners or renters place on a property based on a set of criteria uniquely important to that individual. These values vary from person to person and also vary during a person’s life stage. Exchange-values are similar to the property’s market value (Harvey “Space-Economy of Urbanism”, 15-16). Harvey then states that the relationship between the two types of values is significant and that an increase in use-value often results in an increase in exchange-value (Harvey “Space-Economy of Urbanism”, 35).
Elvin Wyly expands on ideas from both Harvey’s articles mentioned above in his
article, “Continuity and Change in the Restless Urban Landscape”. Wyly states that housing sub-markets are a result of many processes working together. He states that a household’s individual needs and wants (what Harvey refers to as use-value) interact with the actions of various agents in the housing market including homebuilders, lenders, and investors. These agents control, in a sense, the set of options available to homebuyers (Wyly, 315).
Craig Watkins’ article “The Definition and Identification of Housing Sub-Markets” differs from Harvey’s articles on housing sub-markets by identifying a more general definition for the existence of sub-markets. He states that in order to determine the existence of housing sub-markets, segmented demand and segmented supply must generate different prices for a housing unit that is standardized structurally throughout an area (Watkins, 2241). Subprime Mortgages and Foreclosure
In “The Evolution of the Subprime Mortgage Market,” Chomsisenphet and Pennington-Cross identify the terms of subprime mortgages that make them more costly to borrow as well as the type of borrowers receiving subprime mortgages. They describe two periods of subprime mortgages: the period from the mid 1990s to 1999 and the period from 2000 and 2004. During the period from the mid 1990s to 1999, the numbers of subprime mortgages grew rapidly and were primarily given to individuals with poor credit scores that were considered “risky”. From 2000 to 2004, the number of subprime mortgages continued to grow, however, they were now being given to individuals with higher credit scores that were being loaned larger amounts than they would normally be able to obtain under the terms of more standard mortgages (Chomsisenphet and Pennington-Cross, 55).
In Edmiston and Zalneraitis’ article, “Rising Foreclosures in the United States: A Perfect Storm”, three conditions contribute to the current high rate of foreclosures in the United States. The first condition is that described by Chomsisenphet and Pennington-Cross - the significant increase in subprime lending during 2004 to 2006. Edmiston and Zalneraitis then identify the second as the large number of new, non-traditional mortgages, generally adjustable rate mortgages. This condition is especially affected in the current market due to increasing interest rates. The third condition applies to homeowners who are unable to make mortgage payments and find it impossible to sell their properties due to falling home prices. Edmiston and Zalneraitis state that this condition creates drastically rising mortgage foreclosure rates (Edmiston and Zalneraitis, 122-132).
Where Edmiston and Zalneraitis study the cause of foreclosure, Immergluck and Pennington-Cross discuss the impact of home foreclosures on property values in the Chicago area in their article, “The External Cost of Foreclosure: The Impact of Single Family Mortgage Foreclosures on Property Values”. The results of this study used
information collected between the years of 1997 and 1998. During this time period, 3,750 single-family homes foreclosed resulting in an aggregate decline in property values of at least $598 million. This figure can then be broken down further to approximately $159,000 per foreclosure (Immergluck and Smith, 73). Immergluck and Smith then state the importance of relaxing the effects of foreclosure not only on the lenders and borrows directly involved, but also the effects on the community as a whole with regard to policy decisions (Immergluck and Smith, 75).
Proposal
Through exploratory analysis, Dr. Drennon has identified a cluster pattern of mortgage foreclosures in the San Antonio area. Clustering not only exists at the macro level of the city of San Antonio, but also at the micro level of neighborhoods. Though these clustering patterns exist, there is no real explanation for the process that is causing some areas to have much higher rates of foreclosure compared to neighboring areas with average or low foreclosure rates. The relationship between characteristics of specific, individual neighborhoods and foreclosure rates, as well as the spatial proximity of these neighborhoods, will be the focus of our work. By researching specific attributes of neighborhoods, particularly attributes that are common throughout the neighborhood and create a homogenous landscape, we will identify the process that is causing certain neighborhoods to have high foreclosure rates. Many of the attributes we will focus on will contain specific information concerning types of mortgages and the types of lenders present in a neighborhood. Using a Geographic Information System (GIS), we will spatially and statistically analyze this information to reach our conclusion. Eventually, this process will be implemented in a multi-agent system to simulate the foreclosure process and predict areas that are potentially in danger of high foreclosure rates.
In order to proceed with our analysis, we have identified an area of neighborhoods
and have helped create a database that will consist of land records from the parcels within our area of focus. We have built a working GIS and have integrated the current, but incomplete, database information into the system. We have also researched aspects of the mortgage market pre 1980s and post 1980s and have aided in the development of agents in NetLogo with pre 1980s conditions. Below is detailed information concerning our current progress and the anticipated steps we will take to continue our research.
Neighborhoods and Demographics
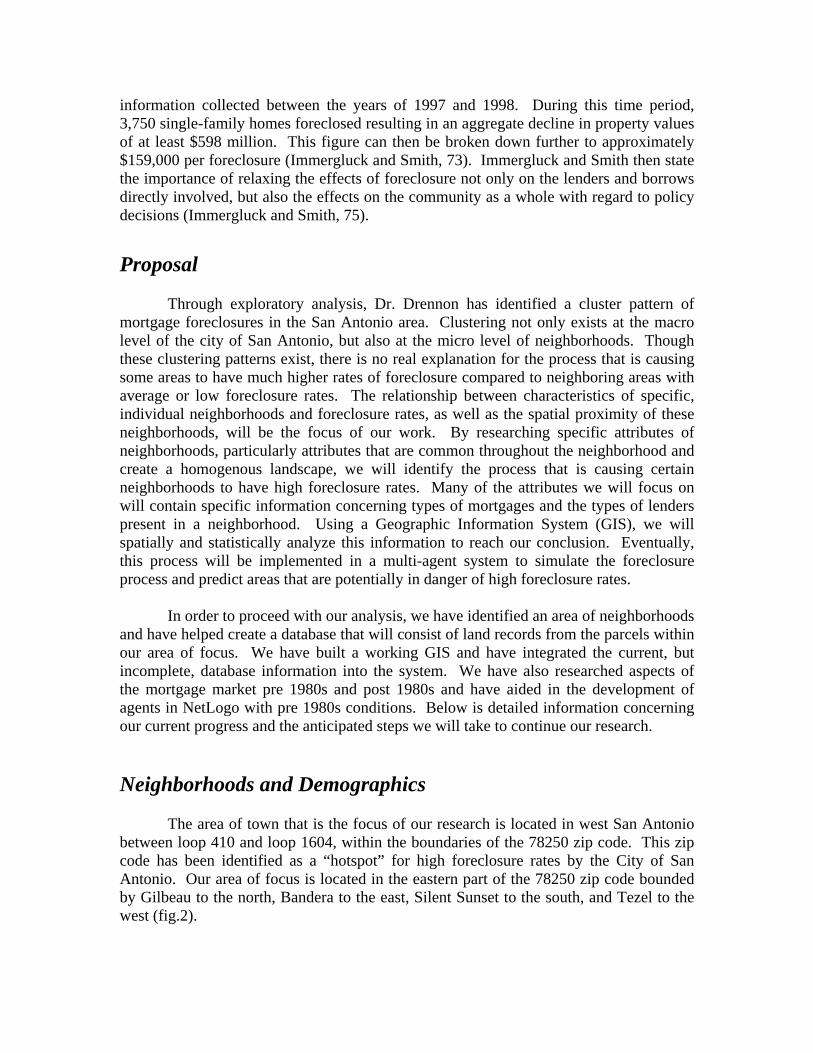
The area of town that is the focus of our research is located in west San Antonio between loop 410 and loop 1604, within the boundaries of the 78250 zip code. This zip code has been identified as a “hotspot” for high foreclosure rates by the City of San Antonio. Our area of focus is located in the eastern part of the 78250 zip code bounded by Gilbeau to the north, Bandera to the east, Silent Sunset to the south, and Tezel to the west (fig.2).
This area contains 2,984 parcels and the homes on these parcels were built
between the years of 1975 and 2007. There are 20 neighborhoods in this area and the majority of homes within these neighborhoods are of similar size, style, and price. However, the size, style, and price between the neighborhoods vary. Mean home values amongst the neighborhoods range from 77,000 to 263,000. All neighborhood mean home values are shown in fig. 3 where the majority of home values within our neighborhood fall between 115,000 and 152,000. Also present within this area are a variety of foreclosure rates amongst the neighborhoods. Some neighborhoods have high foreclosure rates, while others have average or low rates. This area will provide a landscape that has homogeneity within the neighborhood but heterogeneity between neighborhoods, and will be optimal for the focus of our research.
Fig.2 Area of focus within the 78250 zip
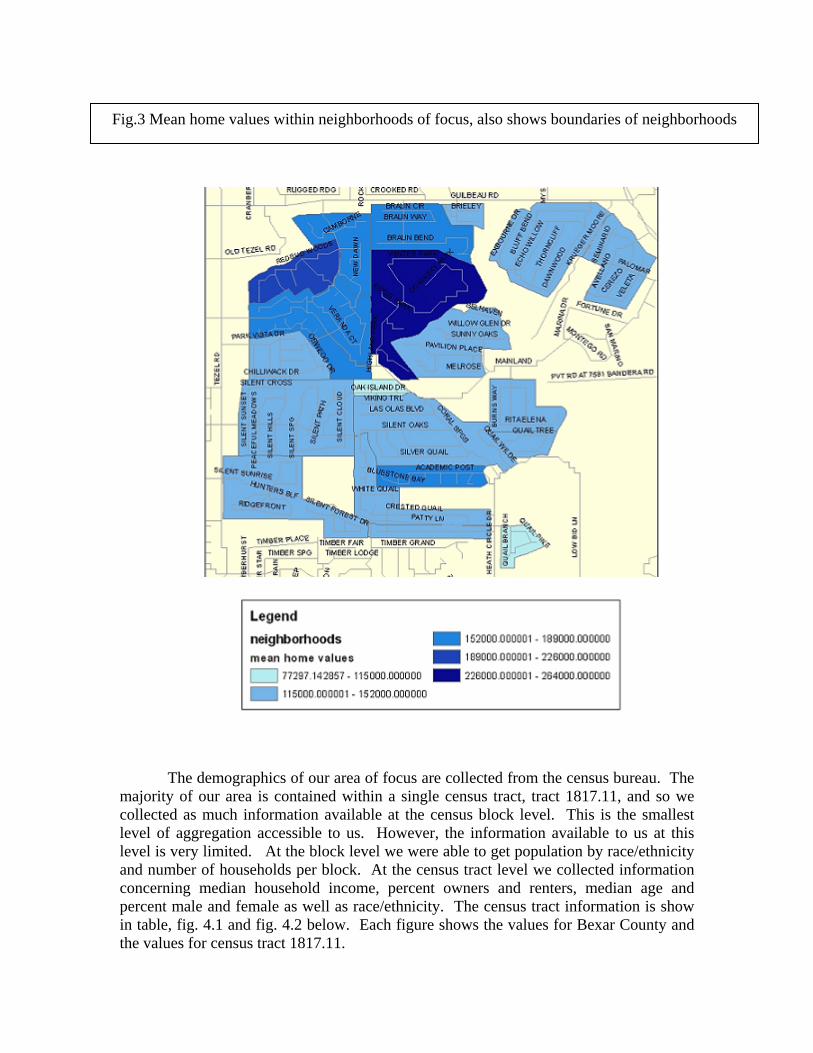
The demographics of our area of focus are collected from the census bureau. The
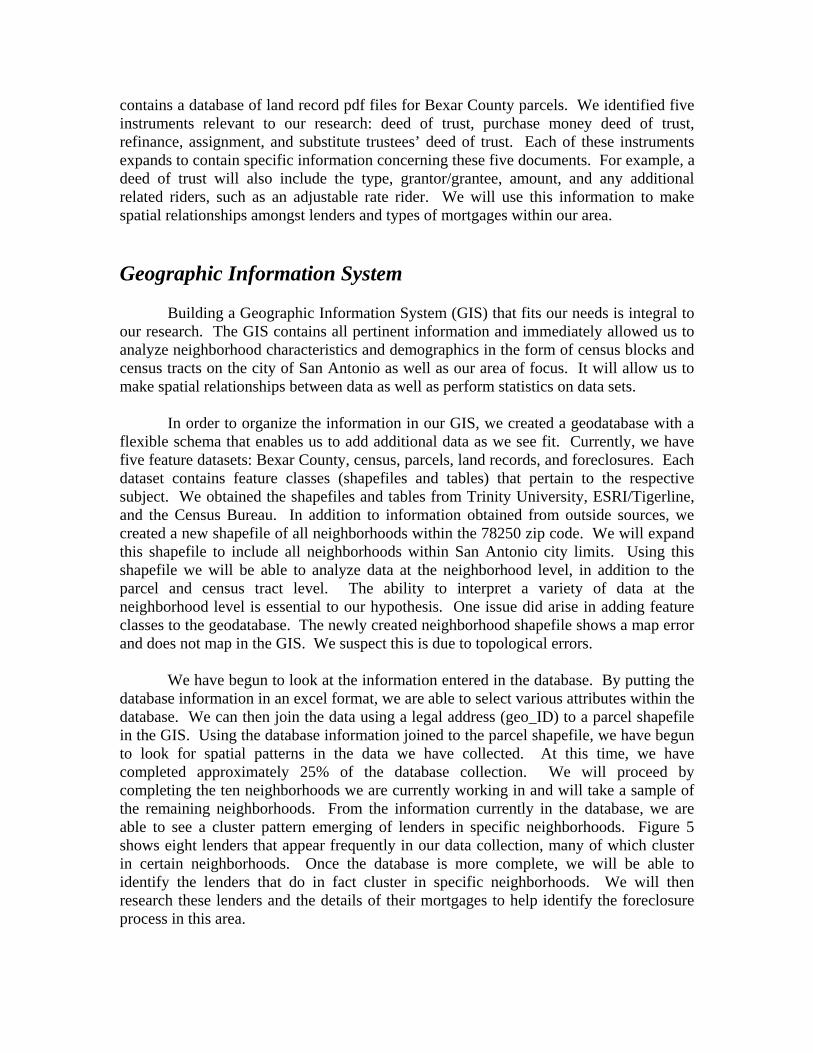
majority of our area is contained within a single census tract, tract 1817.11, and so we collected as much information available at the census block level. This is the smallest level of aggregation accessible to us. However, the information available to us at this level is very limited. At the block level we were able to get population by race/ethnicity and number of households per block. At the census tract level we collected information concerning median household income, percent owners and renters, median age and percent male and female as well as race/ethnicity. The census tract information is show in table, fig. 4.1 and fig. 4.2 below. Each figure shows the values for Bexar County and the values for census tract 1817.11.
Fig.3 Mean home values within neighborhoods of focus, also shows boundaries of neighborhoods
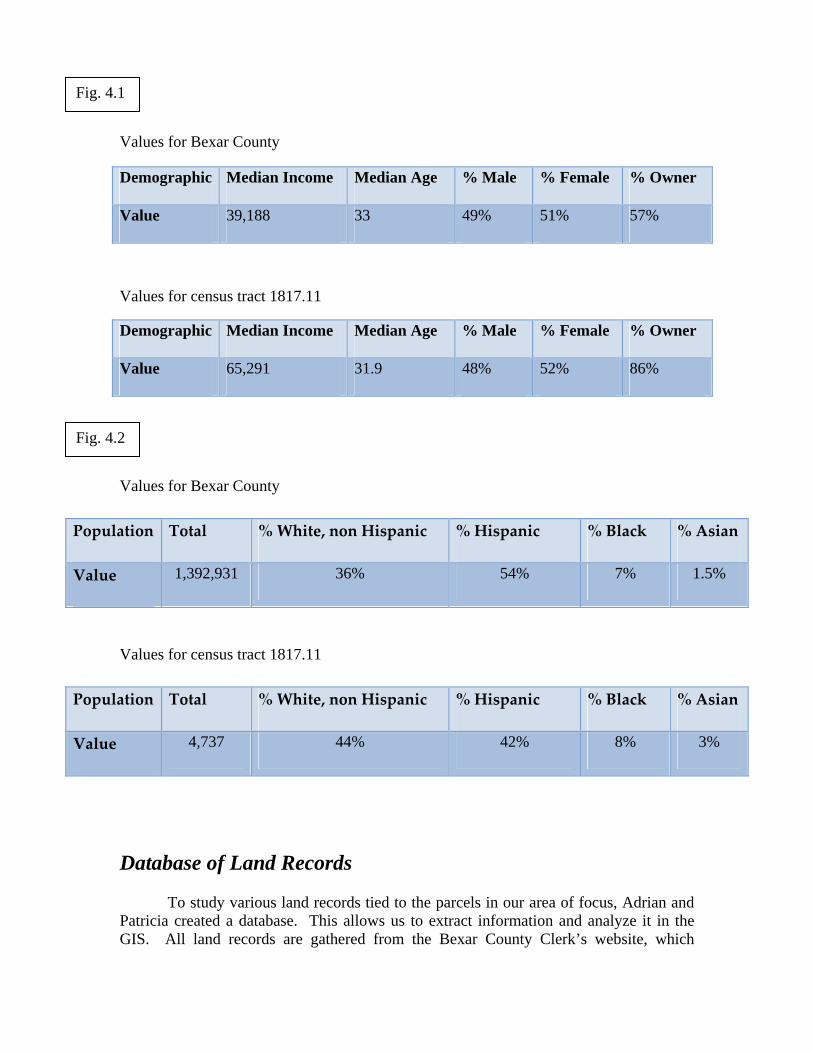
Values for Bexar County
Values for census tract 1817.11
Values for Bexar County
Values for census tract 1817.11
Database of Land Records
To study various land records tied to the parcels in our area of focus, Adrian and Patricia created a database. This allows us to extract information and analyze it in the GIS. All land records are gathered from the Bexar County Clerk’s website, which
Demographic Median Income Median Age % Male % Female % Owner
Value 39,188 33 49% 51% 57%
Demographic Median Income Median Age % Male % Female % Owner
Value 65,291 31.9 48% 52% 86%
Population Total % White, non Hispanic % Hispanic % Black % Asian
Value 1,392,931 36% 54% 7% 1.5%
Population Total % White, non Hispanic % Hispanic % Black % Asian
Value 4,737 44% 42% 8% 3%
Fig. 4.1
Fig. 4.2
contains a database of land record pdf files for Bexar County parcels. We identified five instruments relevant to our research: deed of trust, purchase money deed of trust, refinance, assignment, and substitute trustees’ deed of trust. Each of these instruments expands to contain specific information concerning these five documents. For example, a deed of trust will also include the type, grantor/grantee, amount, and any additional related riders, such as an adjustable rate rider. We will use this information to make spatial relationships amongst lenders and types of mortgages within our area. Geographic Information System Building a Geographic Information System (GIS) that fits our needs is integral to our research. The GIS contains all pertinent information and immediately allowed us to analyze neighborhood characteristics and demographics in the form of census blocks and census tracts on the city of San Antonio as well as our area of focus. It will allow us to make spatial relationships between data as well as perform statistics on data sets.
In order to organize the information in our GIS, we created a geodatabase with a flexible schema that enables us to add additional data as we see fit. Currently, we have five feature datasets: Bexar County, census, parcels, land records, and foreclosures. Each dataset contains feature classes (shapefiles and tables) that pertain to the respective subject. We obtained the shapefiles and tables from Trinity University, ESRI/Tigerline, and the Census Bureau. In addition to information obtained from outside sources, we created a new shapefile of all neighborhoods within the 78250 zip code. We will expand this shapefile to include all neighborhoods within San Antonio city limits. Using this shapefile we will be able to analyze data at the neighborhood level, in addition to the parcel and census tract level. The ability to interpret a variety of data at the neighborhood level is essential to our hypothesis. One issue did arise in adding feature classes to the geodatabase. The newly created neighborhood shapefile shows a map error and does not map in the GIS. We suspect this is due to topological errors.
We have begun to look at the information entered in the database. By putting the
database information in an excel format, we are able to select various attributes within the database. We can then join the data using a legal address (geo_ID) to a parcel shapefile in the GIS. Using the database information joined to the parcel shapefile, we have begun to look for spatial patterns in the data we have collected. At this time, we have completed approximately 25% of the database collection. We will proceed by completing the ten neighborhoods we are currently working in and will take a sample of the remaining neighborhoods. From the information currently in the database, we are able to see a cluster pattern emerging of lenders in specific neighborhoods. Figure 5 shows eight lenders that appear frequently in our data collection, many of which cluster in certain neighborhoods. Once the database is more complete, we will be able to identify the lenders that do in fact cluster in specific neighborhoods. We will then research these lenders and the details of their mortgages to help identify the foreclosure process in this area.
Agent Development In addition to our goal of identifying the foreclosure process in San Antonio, we are aiding in the development of agents that will eventually be implemented in a multi-agent system with the goal of being able to recreate the foreclosure process identified using the GIS. The first steps we took in agent development involved Adrian and Patricia building agents based on the 1980s mortgage market conditions. We chose these conditions for two reasons. First, there are several studies on the effects of laws and policies in place in the 1980s with firm statistics on the number of mortgages by type as well as by borrower. Also, there is information about borrowers themselves including median income and FICA scores grouped by first time buyers and repeat buyers. We used this information to define our agents. The second reason we chose to begin with 1980s conditions is the fact that 1980s laws/policies are less complicated than the policies enacted post 1980s. Setting up agents based on the simpler, 1980s conditions, has created a solid base to build the more complicated post 1980s agents. Several changes in the mortgage market occurred post 1980s. A significant change was the securitization of home mortgages. This allowed mortgages to be sold to third parties or investors. The third parties can either be Government Sponsored Entities (GSE) or private institutions that often combine home mortgages into packages and sell them to investors (Rosen). This has created an increase in capital to provide more home loans by increasing the liquidity of the mortgage market. The results of securitization have opened the door for subprime mortgages, which has contributed to the growth of predatory lending practices. Also essential was the Depository Institutions Deregulation and Monetary Control Act (DIDMCA) and the Alternative Mortgage Transactions Parity Act (AMTPA). These changes created incentives for lenders to refinance home mortgages at higher interest rates and break the mold of conventional, fixed rate mortgages by implementing adjustable rate mortgages and balloon payment mortgages (Texas Law Review). The ramifications of the post 1980s laws/policies will need to be implemented into our agents in order to test the foreclosure process in San Antonio. Conclusion Our progress thus far has taken us to a midway point in our research. Our next steps will involve completing the citywide neighborhood shapefile in order to conduct neighborhood statistics throughout the entire city. This will help us create a comprehensive GIS. Also, we will soon be able to add the complete database information to the GIS for analysis. Depending on the spatial patterns that result, we will research various lenders and mortgage details. This will take us closer to our goal of identifying the foreclosure process amongst these homogenous neighborhoods. Thus far, the lender clustering patterns that have emerged from the current data contribute to and expand the homogenous characteristics within the neighborhoods in our area of focus. We will also continue to research post 1980s mortgage market attributes in order to
implement them into the agents, making them more contemporary agents in the multi-agent system. Ultimately, elements of the process identified through the GIS analysis will be confirmed through statistical analysis and also by the multi-agent system created by fellow REU research students. If the results from the simulation match the information in the GIS, the process will be accurate. It will then be possible to simulate the foreclosure process in other areas of San Antonio

Map of 78250 zip code and the location of the zip code within Bexar County.
References
Harvey, D. “Class-Monopoly Rent, Finance Capital and the Urban Revolution.” Regional Studies. 8. (March 20, 1974): 239-255. Harvey, D. “Society, the City and the Space-Economy of Urbanism.” Association of American Geographers Resource Paper no. 18 (1972): 1-52. Wyly, E. “Continuity and Change in the Restless Urban Landscape.” Economic Geography. 75. (October 1999): 309-338. Watkins, C. A. “The Definition and Identification of Housing Sub-Markets.” Environmental and Planning A. 33. (September 4, 2001): 2235-2253 “Foreclosures in America: Searching for Plan B.” The Economist. 28 February 2008. 2 June 2008. <http://www.economist.com/finance/displaystory.cfm?story_id=10766432&CFID=8059578&CFTOKEN=75872613> Chomsisengphet, Souphala and Anthony Pennington-Cross. “The Evolution of the Subprime Mortgage Market.” Federal Reserve Bank of St. Louis Review. 88.1 (February 2006): 31-56. Immergluck, Dan and Geoff Smith. “The External Costs of Foreclosure: The Impact of Single Family Mortgage Foreclosures on Property Values.” Housing Policy Debate. 17.1 (2006): 57-79. Edmiston, Kelly and Dan Zalneraitis. “Rising Foreclosures in the United States: A Perfect Storm.” Economic Review. (Fourth Quarter, 2007): 115-147. Rosen, Richard J. “The Role of Securitization in Mortgage Lending.” The Chicago Fed <Letter: Essays on Issues. 244 (November 2007). http://www.chicagofed.org/publications/fedletter/cflnovember2007_244.pdf>