Embed Size (px)
Citation preview
Major Themes in Economics Major Themes in Economics
Volume 14 Article 5
Spring 2012
The Most Influential Factors in Determining the Happiness of The Most Influential Factors in Determining the Happiness of
Nations Nations
Julie Lang University of Northern Iowa
Follow this and additional works at: https://scholarworks.uni.edu/mtie
Part of the Economics Commons
Let us know how access to this document benefits you
Copyright ©2012 by Major Themes in Economics
Recommended Citation Recommended Citation Lang, Julie (2012) "The Most Influential Factors in Determining the Happiness of Nations," Major Themes in Economics, 14, 33-54. Available at: https://scholarworks.uni.edu/mtie/vol14/iss1/5
This Article is brought to you for free and open access by the Journals at UNI ScholarWorks. It has been accepted for inclusion in Major Themes in Economics by an authorized editor of UNI ScholarWorks. For more information, please contact [email protected].
The Most Influential Factors in Determining theHappiness of Nations
Julie Lang
ABSTRACT. Previous research has found that the most influential factors determining thehappiness of nations are the Human Development Index (HDI) and the GINI index. Usingdata from The World Bank, United Nations Development Programme (UNDP) HumanDevelopment Reports, The World Database of Happiness, the Satisfaction with Life Scale,and the New Economic Foundation's The (Un) Happy Planet Index 2.0, this study teststhree regression models to determine what factors are most influential in determining thehappiness of nations, holding everything else constant. All three models suggest thatplentiful precipitation contributes to happiness. Two models imply that low corruption,a high Human Development Index, and low unemployment also matter. One model findsa positive relationship between happiness and a more equal income distribution.
I. Introduction
"When I am abroad, I always make it a rule never to criticize orattack the government of my own country. I make up for lost timewhen I come home."
Winston Churchill
Governments have a difficult task. Along with being the first to take theblame if things go wrong, they are responsible for the wealth, health, andsecurity of every individual [Davies 2009]. Not all governments arecreated equal. Some are better at governing than others. But what does"better" mean? Low corruption? Better health? High GDP? Or do allof these affect the happiness of the people?
The government of the country of Bhutan has made its most importantgoal the peace and happiness of its people and the safety and sovereigntyof the nation. Bhutan's philosophy emphasizes Gross National Happiness(GNH) over financial measures such as Gross Domestic Product (GDP)[Alkire 2011]. Gross National Happiness statistics are not available forother countries, so other measures will be examined in order to find themost influential determinants of the happiness of nations.
The topic is important because life satisfaction ought to be one of themain goals of national and international policymakers [Becchetti,
33
1
Lang: The Most Influential Factors in Determining the Happiness of Nati
Published by UNI ScholarWorks, 2012
Major Themes in Economics, Spring 201234
Trovato, and Bedoya 2011, 273-290]. But how do we measurehappiness? What is the connection between wealth and happiness? There is a growing body of literature that considers these questions.
II. Literature Review
Many authors equate the concepts of happiness, wealth, and lifesatisfaction [Ferrer-i-Carbonell 2005, 997-1019]. This matter ofhappiness, wealth, and personal satisfaction is not new to the world ofscience. Many economists, sociologists, and psychologists areinvestigating the issue to find out what makes us happier or unhappier.
Binswanger uses a treadmill as a metaphor for the continuous searchfor more happiness by striving for more income, which in turn createsmore income but not more happiness [Binswanger 2006, 366-381]. Thetreadmill effect argues that happiness does not increase along withincome because of peoples' concern about status. Binswanger's treadmillalso suggests that time-saving technological development does notalleviate time pressure in people's lives. The multi-option treadmillmeans that beyond a particular level, more opportunities to spend timeand money do not increase people's happiness.
Graham, Eggers, and Sukhtankar use panel data from Russia to showthat there are many different factors that affect human well-being[Graham, Eggers, and Sukhtankar 2004, 319-342]. Some factors aredetermined by the socio-economic and demographic variables includingincome fluctuations, marital status modifications, and educational level. Other factors include self-esteem and optimism. The study concludes thatpeople who have high levels of happiness are more likely to increase theirfuture income because they are more likely to achieve their goals.
Alesina, Di Tella, and MacCulloch study the effect of inequality onindividual well-being [Alesina, Di Tella, and MacCulloch 2004,2009-2042]. According to their study, individuals are less happy wheninequality is high and social mobility is low. Americans believe they areable to move up and down the income ladder whereas Europeans believethat they live in a less mobile situation. Individuals are less happy whenthere is a larger disparity between social classes.
Keely examines welfare as a function of income growth and theassortment of consumer goods [Keely 2005, 333-355]. There is atendency for people to identify with a group, and they struggle tomaintain its way of life. The harder they must struggle, the less happy
2
Major Themes in Economics, Vol. 14 [2012], Art. 5
https://scholarworks.uni.edu/mtie/vol14/iss1/5
Lang: The Most Influential Factors 35
they are. Keely concludes that the continual growth of income and goodsin developing countries does not lead to a similar increase in happinessafter a particular point.
III. Measurements of Happiness
Happiness, or Life Satisfaction, has been measured using many differentindices. This study considers three: the Happy Planet Index, the WorldDatabase of Happiness, and the Satisfaction with Life Scale. Threeseparate indices were used because comparing one person's level ofhappiness to another's is difficult; by its very nature reported happinessis subjective. Yet researchers have found that large data samples acrossnations and time show patterns in the determinants of happiness.
The first measure comes from the New Economic Foundation's "The(Un) Happy Planet Index" first published in July 2006 and updated in July2009. The report presents the Happy Planet Index. The HPI takes intoconsideration both objective data as well as subjective data but does notuse income as an explicit variable. It also accounts for how the planet'sresources are used. The goal of development is to provide high standardsof human welfare while responsibly consuming resources. The HappyPlanet Index incorporates three separate indicators: ecological footprint,self-reported life satisfaction, and life expectancy. Ecological footprintmeasures the impact on the environment of human consumption. Theecological footprint measures how much land area is needed to sustain agiven population at its present levels of consumption, technologicaldevelopment, and resource efficiency. The second factor, self-reportedlife satisfaction, is based on the views of American psychologist EdDiener who defines the concept of well-being in terms of threedimensions: positive affect (the frequency that a person experiencespositive moods and emotions), negative affect (the frequency that aperson experiences negative moods and emotions), and life satisfaction(reflecting on an individual's overall evaluation of their life). Thismeasure is created from international surveys which simply ask "If youconsider your life overall, how satisfied would you say you arenowadays?" Responses are given on a scale of 1 to 10 with 1 being verydissatisfied and 10 being extremely satisfied. Although this method is notperfect, it is generally accepted worldwide as an indicator of human wellbeing due to the comparisons with other national statistics ["(Un) HappyPlanet Index 2.0" 2006]. The third indicator, life expectancy, measures
3
Lang: The Most Influential Factors in Determining the Happiness of Nati
Published by UNI ScholarWorks, 2012
Major Themes in Economics, Spring 201236
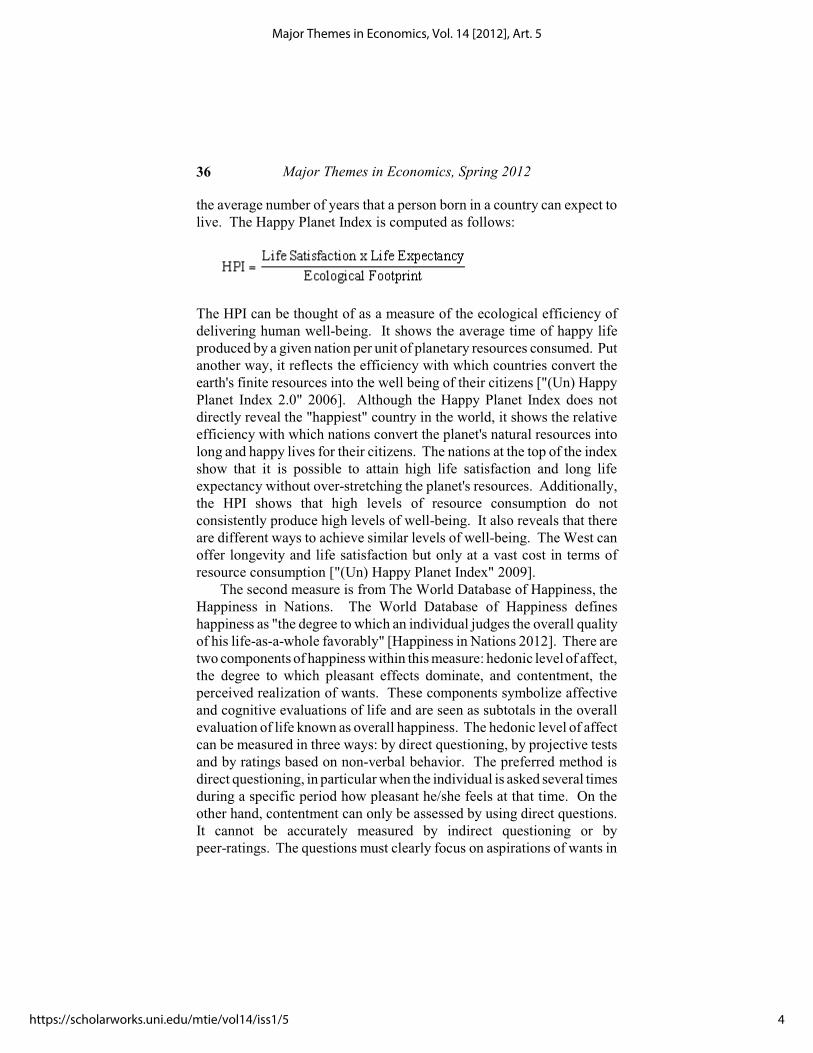
the average number of years that a person born in a country can expect tolive. The Happy Planet Index is computed as follows:
The HPI can be thought of as a measure of the ecological efficiency ofdelivering human well-being. It shows the average time of happy lifeproduced by a given nation per unit of planetary resources consumed. Putanother way, it reflects the efficiency with which countries convert theearth's finite resources into the well being of their citizens ["(Un) HappyPlanet Index 2.0" 2006]. Although the Happy Planet Index does notdirectly reveal the "happiest" country in the world, it shows the relativeefficiency with which nations convert the planet's natural resources intolong and happy lives for their citizens. The nations at the top of the indexshow that it is possible to attain high life satisfaction and long lifeexpectancy without over-stretching the planet's resources. Additionally,the HPI shows that high levels of resource consumption do notconsistently produce high levels of well-being. It also reveals that thereare different ways to achieve similar levels of well-being. The West canoffer longevity and life satisfaction but only at a vast cost in terms ofresource consumption ["(Un) Happy Planet Index" 2009].
The second measure is from The World Database of Happiness, theHappiness in Nations. The World Database of Happiness defineshappiness as "the degree to which an individual judges the overall qualityof his life-as-a-whole favorably" [Happiness in Nations 2012]. There aretwo components of happiness within this measure: hedonic level of affect,the degree to which pleasant effects dominate, and contentment, theperceived realization of wants. These components symbolize affectiveand cognitive evaluations of life and are seen as subtotals in the overallevaluation of life known as overall happiness. The hedonic level of affectcan be measured in three ways: by direct questioning, by projective testsand by ratings based on non-verbal behavior. The preferred method isdirect questioning, in particular when the individual is asked several timesduring a specific period how pleasant he/she feels at that time. On theother hand, contentment can only be assessed by using direct questions. It cannot be accurately measured by indirect questioning or bypeer-ratings. The questions must clearly focus on aspirations of wants in
4
Major Themes in Economics, Vol. 14 [2012], Art. 5
https://scholarworks.uni.edu/mtie/vol14/iss1/5
Lang: The Most Influential Factors 37
a life-perspective. In principle, happiness is measureable but not all thequestionnaires and observation schedules used for its measurement areconsidered acceptable. Many measures that link to larger phenomena areleft out in this database of happiness. All of the answers in this study arebased on questions that successfully passed a test for face-validity. Moreover, accepted answers are classified in five different ways: i) focus,ii) time-frame, iii) mode of observation, iv) rating-scale type, and v)rating-scale range. The number of potential combinations is enormousbecause of all the sub-divisions within these classifications. Subtledifferences in wording cause many questions to fit within the samecombination. These questions are denoted by a supplementary sign sothat each question has a specific code. Responses are given on an 11-stepscale with 0 being very dissatisfied and 10 being extremely satisfied. Theverbal scale has 3-steps: very happy, pretty happy, and not too happy. Examples of classification and scale types are found in Appendix I[Happiness in Nations 2012]. The World Database of Happiness (WDH)uses the word "happiness" to describe the subjective enjoyment of life-thedegree to which an individual judges the overall quality of life-as-a-wholefavorably.
The third measure is the Satisfaction with Life Scale (SWLS). TheSatisfaction with Life Scale is created from a survey. The survey'squestions allow individuals to weight areas of their lives in terms of theirown values. It should be noted that measuring respondents' satisfactionwith common areas might also provide useful additional information[Frisch 1992]. The Satisfaction with Life Scale is intended to measure anindividual's global judgment of life satisfaction, which depends on acomparison of life circumstances to one's standards. Due to its briefformat, it can be included in an evaluation with minimal cost in time. Thereading level of the scale is between 6 and 10 grade levels, andth th
therefore, is usable with most adults. The five items of the Satisfactionwith Life Scale and scoring instructions can be found in Appendix II. Criticisms arise from the assumption that individuals place equal value onall life areas but there seems to be consistent results. In the end, theSatisfaction with Life Scale is a one-minute, five-item instrumentdesigned to measure global judgments of satisfaction with one's life[Diener 2009].
5
Lang: The Most Influential Factors in Determining the Happiness of Nati
Published by UNI ScholarWorks, 2012
Major Themes in Economics, Spring 201238
IV. Possible Determinants of Happiness
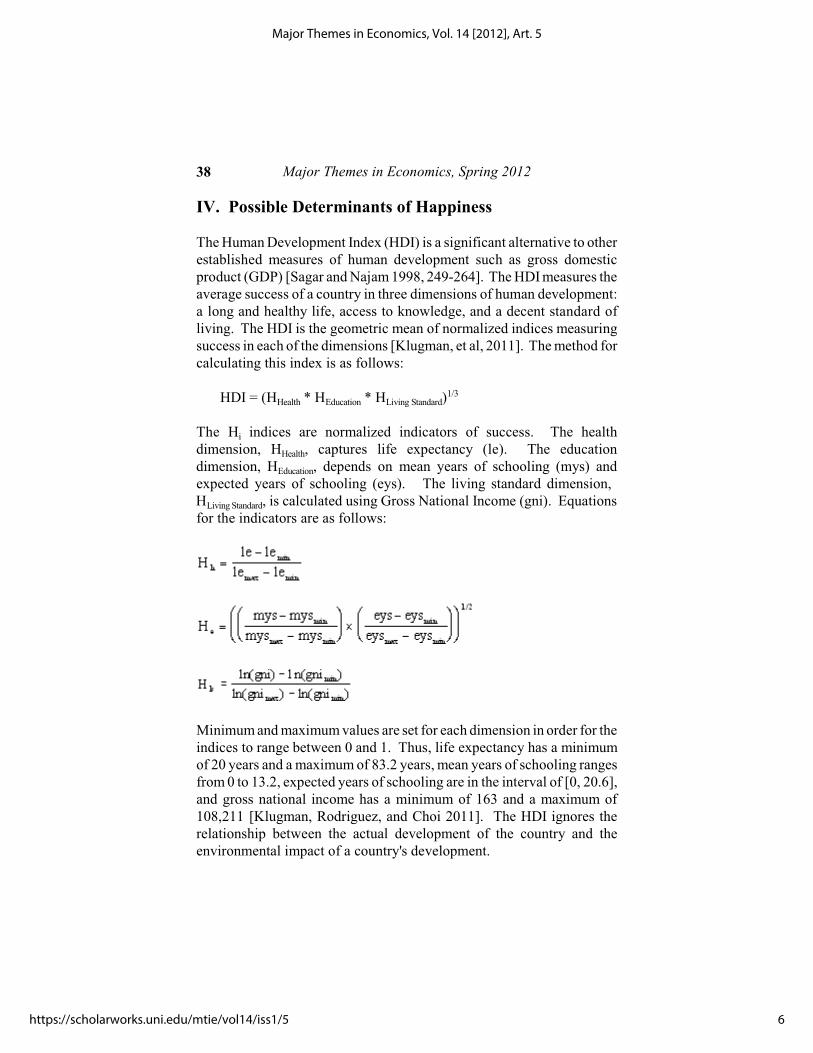
The Human Development Index (HDI) is a significant alternative to otherestablished measures of human development such as gross domesticproduct (GDP) [Sagar and Najam 1998, 249-264]. The HDI measures theaverage success of a country in three dimensions of human development:a long and healthy life, access to knowledge, and a decent standard ofliving. The HDI is the geometric mean of normalized indices measuringsuccess in each of the dimensions [Klugman, et al, 2011]. The method forcalculating this index is as follows:
Health Education Living StandardHDI = (H * H * H )1/3
iThe H indices are normalized indicators of success. The health
Healthdimension, H , captures life expectancy (le). The education
Educationdimension, H , depends on mean years of schooling (mys) andexpected years of schooling (eys). The living standard dimension,
Living StandardH , is calculated using Gross National Income (gni). Equationsfor the indicators are as follows:
Minimum and maximum values are set for each dimension in order for theindices to range between 0 and 1. Thus, life expectancy has a minimumof 20 years and a maximum of 83.2 years, mean years of schooling rangesfrom 0 to 13.2, expected years of schooling are in the interval of [0, 20.6],and gross national income has a minimum of 163 and a maximum of108,211 [Klugman, Rodriguez, and Choi 2011]. The HDI ignores therelationship between the actual development of the country and theenvironmental impact of a country's development.
6
Major Themes in Economics, Vol. 14 [2012], Art. 5
https://scholarworks.uni.edu/mtie/vol14/iss1/5
Lang: The Most Influential Factors 39
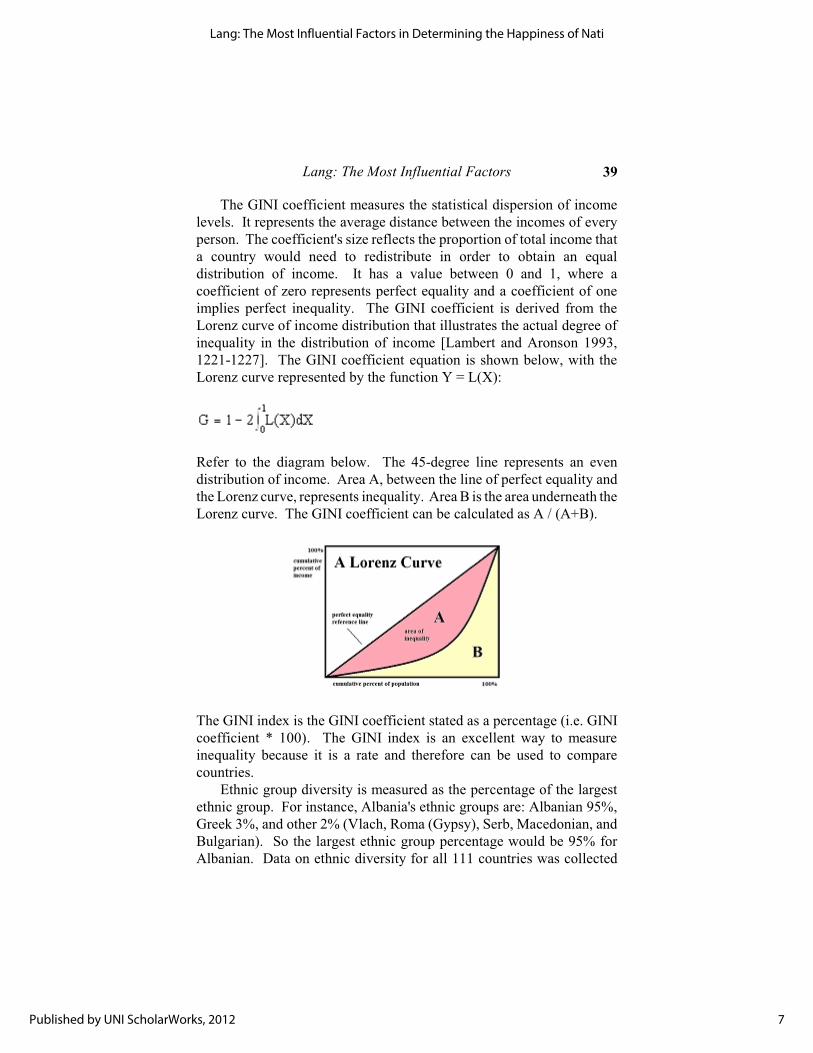
The GINI coefficient measures the statistical dispersion of incomelevels. It represents the average distance between the incomes of everyperson. The coefficient's size reflects the proportion of total income thata country would need to redistribute in order to obtain an equaldistribution of income. It has a value between 0 and 1, where acoefficient of zero represents perfect equality and a coefficient of oneimplies perfect inequality. The GINI coefficient is derived from theLorenz curve of income distribution that illustrates the actual degree ofinequality in the distribution of income [Lambert and Aronson 1993,1221-1227]. The GINI coefficient equation is shown below, with theLorenz curve represented by the function Y = L(X):
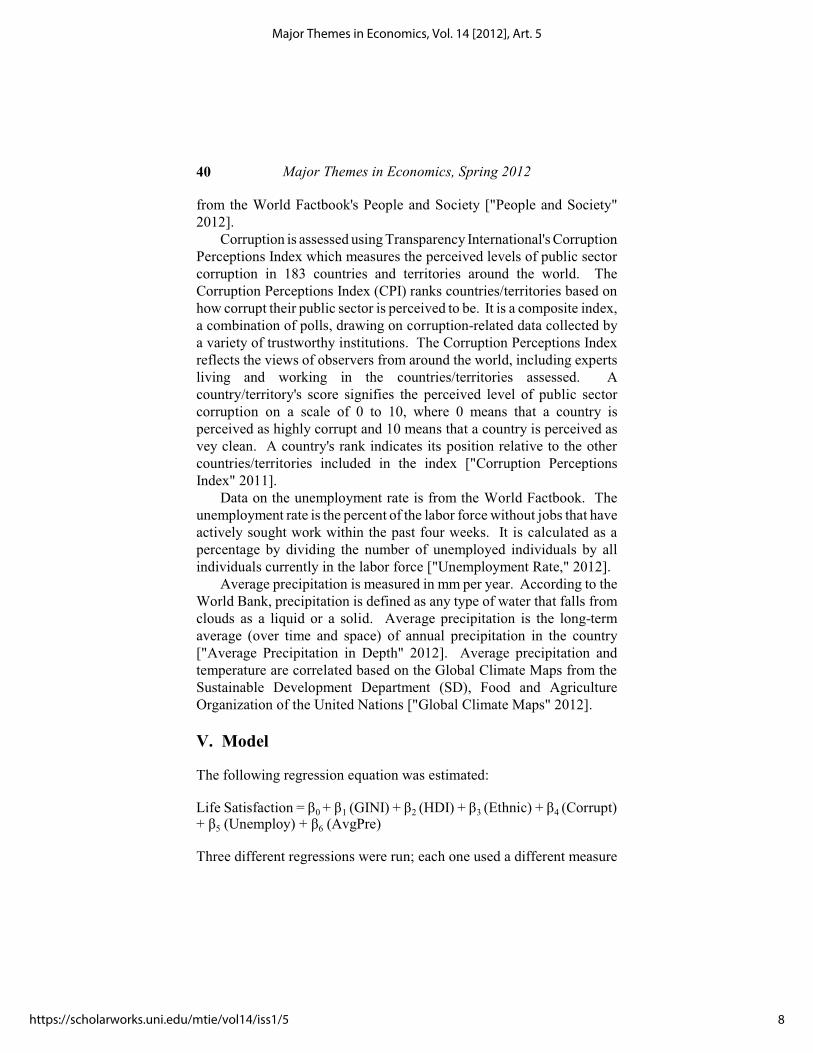
Refer to the diagram below. The 45-degree line represents an evendistribution of income. Area A, between the line of perfect equality andthe Lorenz curve, represents inequality. Area B is the area underneath theLorenz curve. The GINI coefficient can be calculated as A / (A+B).
The GINI index is the GINI coefficient stated as a percentage (i.e. GINIcoefficient * 100). The GINI index is an excellent way to measureinequality because it is a rate and therefore can be used to comparecountries.
Ethnic group diversity is measured as the percentage of the largestethnic group. For instance, Albania's ethnic groups are: Albanian 95%,Greek 3%, and other 2% (Vlach, Roma (Gypsy), Serb, Macedonian, andBulgarian). So the largest ethnic group percentage would be 95% forAlbanian. Data on ethnic diversity for all 111 countries was collected
7
Lang: The Most Influential Factors in Determining the Happiness of Nati
Published by UNI ScholarWorks, 2012
Major Themes in Economics, Spring 201240
from the World Factbook's People and Society ["People and Society"2012].
Corruption is assessed using Transparency International's CorruptionPerceptions Index which measures the perceived levels of public sectorcorruption in 183 countries and territories around the world. TheCorruption Perceptions Index (CPI) ranks countries/territories based onhow corrupt their public sector is perceived to be. It is a composite index,a combination of polls, drawing on corruption-related data collected bya variety of trustworthy institutions. The Corruption Perceptions Indexreflects the views of observers from around the world, including expertsliving and working in the countries/territories assessed. Acountry/territory's score signifies the perceived level of public sectorcorruption on a scale of 0 to 10, where 0 means that a country isperceived as highly corrupt and 10 means that a country is perceived asvey clean. A country's rank indicates its position relative to the othercountries/territories included in the index ["Corruption PerceptionsIndex" 2011].
Data on the unemployment rate is from the World Factbook. Theunemployment rate is the percent of the labor force without jobs that haveactively sought work within the past four weeks. It is calculated as apercentage by dividing the number of unemployed individuals by allindividuals currently in the labor force ["Unemployment Rate," 2012].
Average precipitation is measured in mm per year. According to theWorld Bank, precipitation is defined as any type of water that falls fromclouds as a liquid or a solid. Average precipitation is the long-termaverage (over time and space) of annual precipitation in the country["Average Precipitation in Depth" 2012]. Average precipitation andtemperature are correlated based on the Global Climate Maps from theSustainable Development Department (SD), Food and AgricultureOrganization of the United Nations ["Global Climate Maps" 2012].
V. Model
The following regression equation was estimated:
0 1 2 3 4Life Satisfaction = â + â (GINI) + â (HDI) + â (Ethnic) + â (Corrupt)
5 6+ â (Unemploy) + â (AvgPre)
Three different regressions were run; each one used a different measure
8
Major Themes in Economics, Vol. 14 [2012], Art. 5
https://scholarworks.uni.edu/mtie/vol14/iss1/5
Lang: The Most Influential Factors 41
of Life Satisfaction. GINI is the GINI index, HDI is the HumanDevelopment Index, Ethnic is ethnic group diversity, Corrupt iscorruption, Unemploy is unemployment, and AvgPre is averageprecipitation.
It is predicted that the coefficient on the variable GINI will benegative. A decrease in the GINI index means that the incomedistribution is more equal, which should increase happiness. The coefficient on HDI should be positive. Longer life, better education,and higher living standards should make people happier.
It is predicted that the variable Ethnic will be positively related tohappiness. As the percentage of the largest ethnic group increases, theless diversity there is within the country. Less diversity means there arenot as many things to possibly disagree about. Therefore, citizens will behappier.
The coefficient on Corrupt should also be positive. As the CorruptionPerceptions Index score increases, the perceived level of public sectorcorruption falls. As a result, people should be happier.
The coefficient on the variable Unemploy is expected to be negative. It is expected that unemployed people are likely to be less happy. Therefore as the unemployment rate of the country decreases, thehappiness of the country increases.
The coefficient on AvgPre is expected to be positive. This is becauseof the correlation between average precipitation and temperature. As theamount of precipitation increases, so does the average temperature. Individuals seem to be happier in warmer weather or tropical locations.Other variables were considered but not included because data on themwere not available. These variables include creativity, spirituality,loyalty, welfare, desire for adventure, and government stability.
To summarize the models:
Dependent Variable:
Life Satisfaction
= measured according to the Happy Planet Index (HPI)= measured according to the World Database of Happiness= measured according to the Satisfaction with Life Scale
9
Lang: The Most Influential Factors in Determining the Happiness of Nati
Published by UNI ScholarWorks, 2012
Major Themes in Economics, Spring 201242
Independent Variables:
GINI = GINI index valuesHDI = Human Development Index valuesEthnic = Ethnic group diversity percentagesCorruption = Corruption Perceptions Index valuesUnemploy = Unemployment valuesAvgPre = Average precipitation values
VI. Data
Information on 111 countries around the world was collected andanalyzed. The HPI index values are from The (Un) Happy Planet Index2.0, HPI 2.0 Results downloaded from the New Economic Foundation(NEF). The NEP provides the complete data file containing overallscores as well as component results ["(Un) Happy Planet Index 2.0"2009]. The World Database of Happiness, the Happiness in Nationsprovides a table of the average happiness. It is measured on a scale of 0to 10 based on how much people enjoy their life-as-a-whole [Happinessin Nations 2012]. The Satisfaction with Life Scale (SWLS) is based ona five-item scale (see Appendix II) designed to measure global judgmentsof satisfaction with one's life [Diener 2009].
The GINI index values are from The World Bank, GINI Indexdatabank, which gives the most recent year for which there is data. Thedata are based on primary household survey data developed fromgovernment statistical agencies and World Bank country departments["World Bank"]. The Human Development Index (HDI) values are fromthe United Nations Development Programme (UNDP) HumanDevelopment Reports, which provides a table of the 2011 results. Lifeexpectancy at birth is supplied by the UN Department of Economic andSocial Affairs, expected years of schooling by the UNESCO Institute forStatistics, mean years of schooling by Barro and Lee, and GNI per capitaby the World Bank and the International Monetary Fund [HumanDevelopment Reports 2011]. The ethnic group diversity values are fromthe Central Intelligence Agency's World Factbook, People and Society tabfrom each country ["People and Society" 2012]. The corruption variablevalues come from the Corruption Perceptions Index, which provides atable of 2011 results. The ranks are based on how corrupt the publicsector is perceived to be ["Corruption Perceptions Index" 2011]. Theunemployment values are from the Central Intelligence Agency's WorldFactbook, which provides a table of the most recently availableunemployment rates ["Unemployment Rate" 2012]. Average
10
Major Themes in Economics, Vol. 14 [2012], Art. 5
https://scholarworks.uni.edu/mtie/vol14/iss1/5
Lang: The Most Influential Factors 43
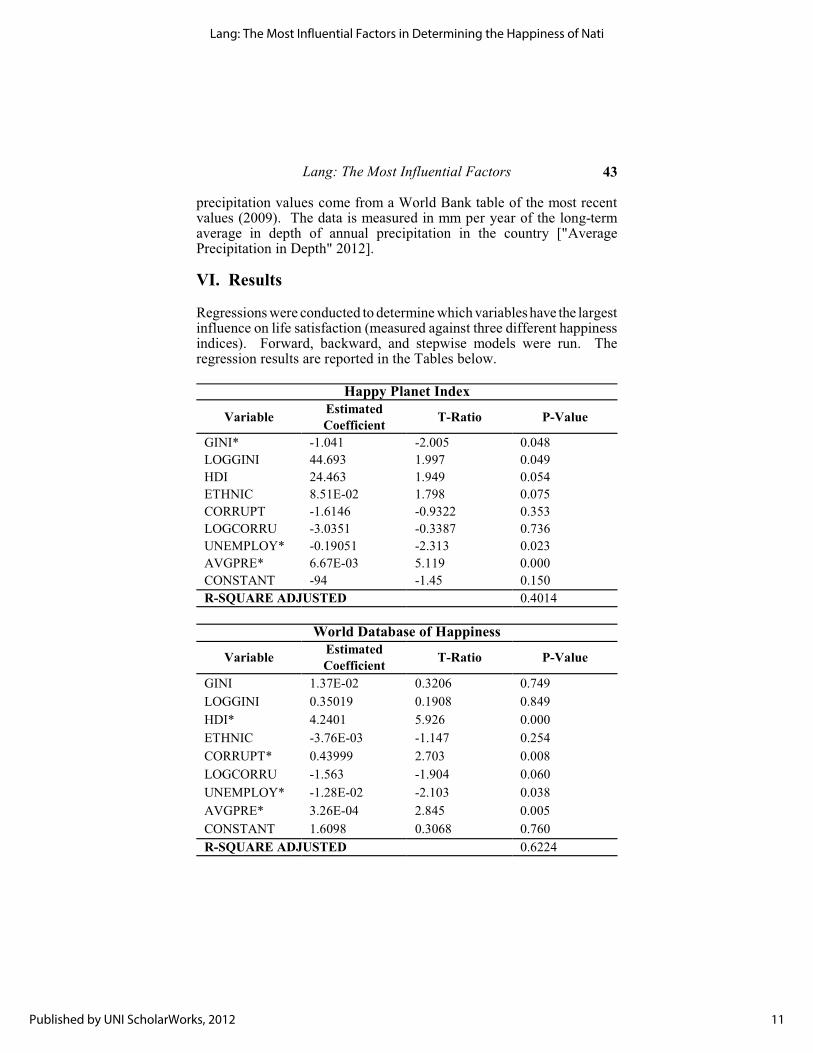
precipitation values come from a World Bank table of the most recentvalues (2009). The data is measured in mm per year of the long-termaverage in depth of annual precipitation in the country ["AveragePrecipitation in Depth" 2012].
VI. Results
Regressions were conducted to determine which variables have the largestinfluence on life satisfaction (measured against three different happinessindices). Forward, backward, and stepwise models were run. Theregression results are reported in the Tables below.
Happy Planet Index
VariableEstimatedCoefficient
T-Ratio P-Value
GINI* -1.041 -2.005 0.048
LOGGINI 44.693 1.997 0.049
HDI 24.463 1.949 0.054
ETHNIC 8.51E-02 1.798 0.075
CORRUPT -1.6146 -0.9322 0.353
LOGCORRU -3.0351 -0.3387 0.736
UNEMPLOY* -0.19051 -2.313 0.023
AVGPRE* 6.67E-03 5.119 0.000
CONSTANT -94 -1.45 0.150
R-SQUARE ADJUSTED 0.4014
World Database of Happiness
VariableEstimatedCoefficient
T-Ratio P-Value
GINI 1.37E-02 0.3206 0.749
LOGGINI 0.35019 0.1908 0.849
HDI* 4.2401 5.926 0.000
ETHNIC -3.76E-03 -1.147 0.254
CORRUPT* 0.43999 2.703 0.008
LOGCORRU -1.563 -1.904 0.060
UNEMPLOY* -1.28E-02 -2.103 0.038
AVGPRE* 3.26E-04 2.845 0.005
CONSTANT 1.6098 0.3068 0.760
R-SQUARE ADJUSTED 0.6224
11
Lang: The Most Influential Factors in Determining the Happiness of Nati
Published by UNI ScholarWorks, 2012
Major Themes in Economics, Spring 201244
Satisfaction with Life Scale
VariableEstimatedCoefficient
T-Ratio P-Value
GINI 6.13E-03 3.25E-03 0.997
LOGGINI 35.971 0.4292 0.669
HDI* 73.817 2.938 0.004
ETHNIC -1.59E-02 -0.1431 0.886
CORRUPT* 23.665 4.346 0.000
LOGCORRU* -81.761 -3.007 0.003
UNEMPLOY -0.27528 -1.147 0.254
AVGPRE* 1.05E-02 2.813 0.006
CONSTANT 19.298 8.07E-02 0.936
R-SQUARE ADJUSTED 0.4787
*Significant variables
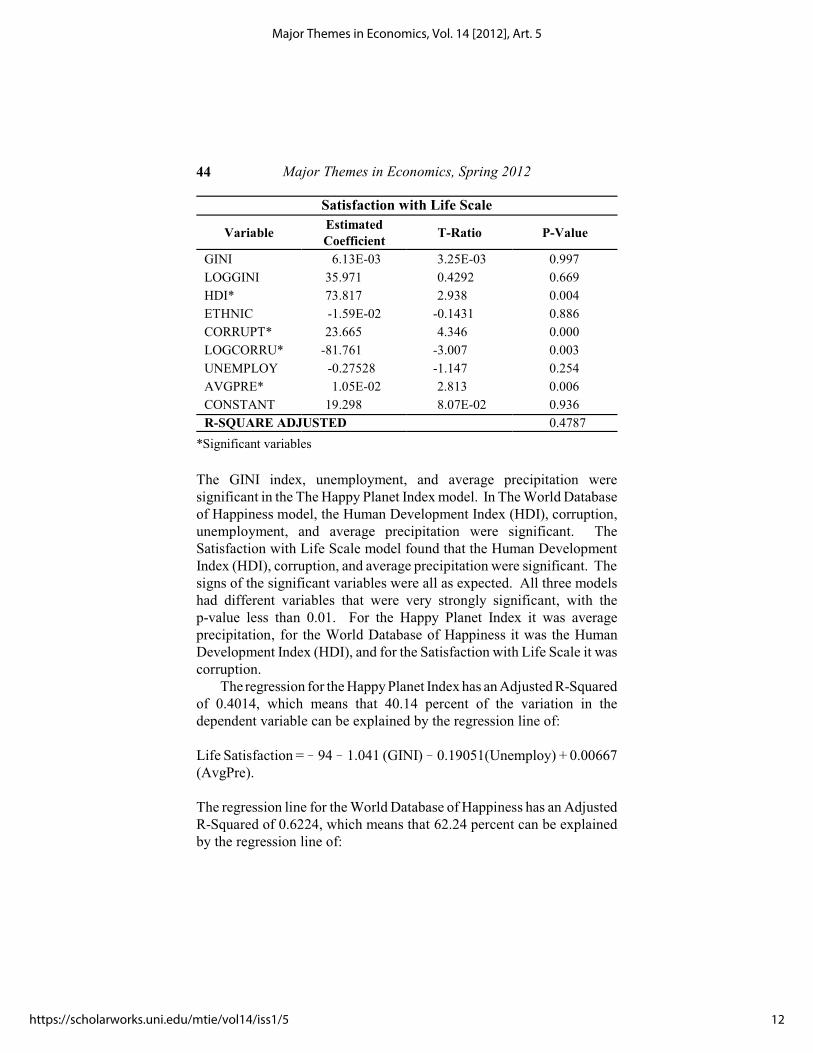
The GINI index, unemployment, and average precipitation weresignificant in the The Happy Planet Index model. In The World Databaseof Happiness model, the Human Development Index (HDI), corruption,unemployment, and average precipitation were significant. TheSatisfaction with Life Scale model found that the Human DevelopmentIndex (HDI), corruption, and average precipitation were significant. Thesigns of the significant variables were all as expected. All three modelshad different variables that were very strongly significant, with thep-value less than 0.01. For the Happy Planet Index it was averageprecipitation, for the World Database of Happiness it was the HumanDevelopment Index (HDI), and for the Satisfaction with Life Scale it wascorruption.
The regression for the Happy Planet Index has an Adjusted R-Squaredof 0.4014, which means that 40.14 percent of the variation in thedependent variable can be explained by the regression line of:
Life Satisfaction = ! 94 ! 1.041 (GINI) ! 0.19051(Unemploy) + 0.00667(AvgPre).
The regression line for the World Database of Happiness has an AdjustedR-Squared of 0.6224, which means that 62.24 percent can be explainedby the regression line of:
12
Major Themes in Economics, Vol. 14 [2012], Art. 5
https://scholarworks.uni.edu/mtie/vol14/iss1/5
Lang: The Most Influential Factors 45
Life Satisfaction = 1.6098 + 4.2401 (HDI) + 0.43999 (Corrupt) ! 0.0128(Unemploy) + 0.000326 (AvgPre).
The regression for the Satisfaction with Life Scale has an AdjustedR-Squared of 0.4787, which means that 47.87 percent can be explainedby the regression line of:
Life Satisfaction = 19.298 + 73.817 (HDI) + 23.665 (Corrupt) + 0.0105(AvgPre).
These are fairly good fits. There are many other variables thatinfluence life satisfaction but they are hard to perfectly measure.
A possible issue is multicollinearity. One way to determine if thereis multicollinearity is by the variance inflation factor (VIF). The VIFsuggests which covariate to remove. The covariate needs to be removedif the VIF is greater than ten. The VIF values are all less than ten so themodels did not need to be altered. Another way to assessmulticollinearity is to examine the condition index. If the conditionnumber is greater than the square root of one thousand then there ismulticollinearity. Once again, multicollinearity is not indicated and themodels do not need to be changed.
VII. Conclusion
This paper set out to find the most influential factors in determining thehappiness of nations. The research provided insights into what thesefactors might be. All three models suggest that plentiful precipitationcontributes to happiness. Two models imply that low corruption, a highHuman Development Index, and low unemployment also matter. Onemodel finds a positive relationship between happiness and a more equalincome distribution. Even though the factors used explain some of thevariations, there are still many other factors that are influential andimmeasurable. If there were more time and better information, it wouldbe good to gather data on other factors, specifically creativity, spirituality,loyalty, welfare, desire for adventure, and government stability.
13
Lang: The Most Influential Factors in Determining the Happiness of Nati
Published by UNI ScholarWorks, 2012
Major Themes in Economics, Spring 201246
Appendix I
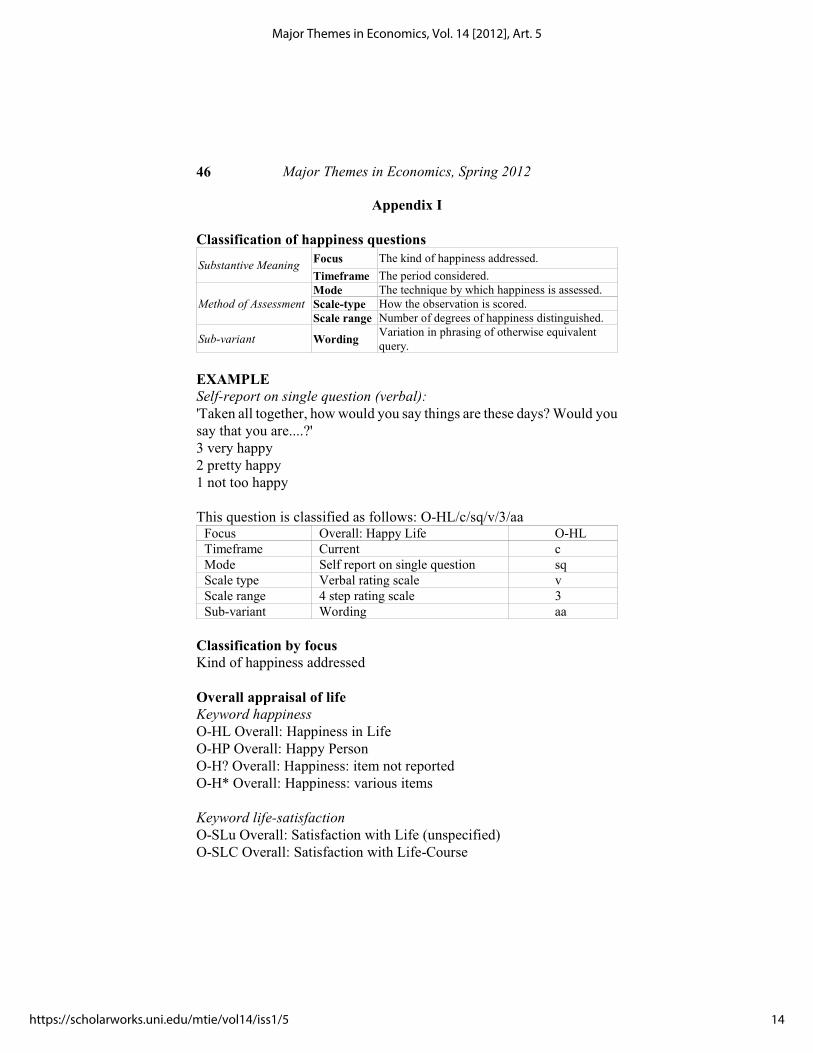
Classification of happiness questions
Substantive MeaningFocus The kind of happiness addressed.
Timeframe The period considered.
Method of AssessmentMode The technique by which happiness is assessed.Scale-type How the observation is scored.Scale range Number of degrees of happiness distinguished.
Sub-variant WordingVariation in phrasing of otherwise equivalentquery.
EXAMPLESelf-report on single question (verbal):'Taken all together, how would you say things are these days? Would yousay that you are....?'3 very happy2 pretty happy 1 not too happy
This question is classified as follows: O-HL/c/sq/v/3/aaFocus Overall: Happy Life O-HLTimeframe Current cMode Self report on single question sqScale type Verbal rating scale vScale range 4 step rating scale 3Sub-variant Wording aa
Classification by focusKind of happiness addressed
Overall appraisal of lifeKeyword happinessO-HL Overall: Happiness in LifeO-HP Overall: Happy PersonO-H? Overall: Happiness: item not reportedO-H* Overall: Happiness: various items
Keyword life-satisfactionO-SLu Overall: Satisfaction with Life (unspecified)O-SLC Overall: Satisfaction with Life-Course
14
Major Themes in Economics, Vol. 14 [2012], Art. 5
https://scholarworks.uni.edu/mtie/vol14/iss1/5
Lang: The Most Influential Factors 47
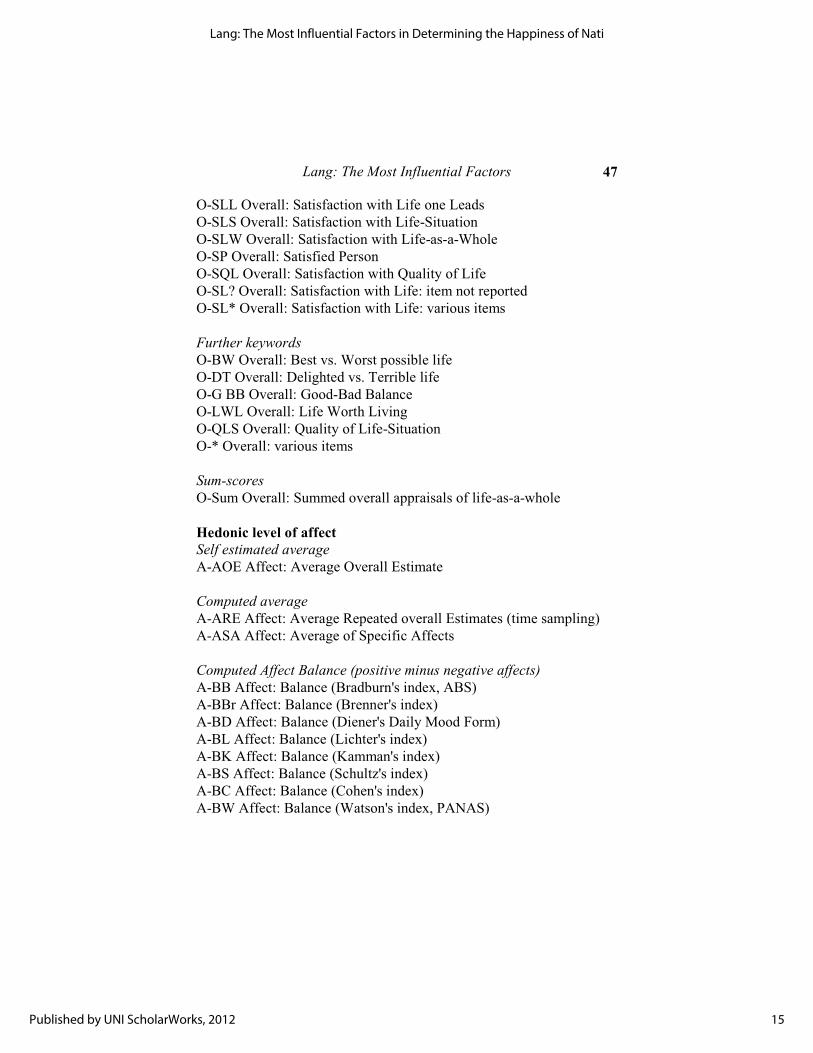
O-SLL Overall: Satisfaction with Life one LeadsO-SLS Overall: Satisfaction with Life-SituationO-SLW Overall: Satisfaction with Life-as-a-WholeO-SP Overall: Satisfied PersonO-SQL Overall: Satisfaction with Quality of LifeO-SL? Overall: Satisfaction with Life: item not reportedO-SL* Overall: Satisfaction with Life: various items
Further keywordsO-BW Overall: Best vs. Worst possible lifeO-DT Overall: Delighted vs. Terrible lifeO-G BB Overall: Good-Bad BalanceO-LWL Overall: Life Worth LivingO-QLS Overall: Quality of Life-SituationO-* Overall: various items
Sum-scoresO-Sum Overall: Summed overall appraisals of life-as-a-whole
Hedonic level of affectSelf estimated averageA-AOE Affect: Average Overall Estimate
Computed averageA-ARE Affect: Average Repeated overall Estimates (time sampling)A-ASA Affect: Average of Specific Affects
Computed Affect Balance (positive minus negative affects)A-BB Affect: Balance (Bradburn's index, ABS)A-BBr Affect: Balance (Brenner's index)A-BD Affect: Balance (Diener's Daily Mood Form)A-BL Affect: Balance (Lichter's index)A-BK Affect: Balance (Kamman's index)A-BS Affect: Balance (Schultz's index)A-BC Affect: Balance (Cohen's index)A-BW Affect: Balance (Watson's index, PANAS)
15
Lang: The Most Influential Factors in Determining the Happiness of Nati
Published by UNI ScholarWorks, 2012
Major Themes in Economics, Spring 201248
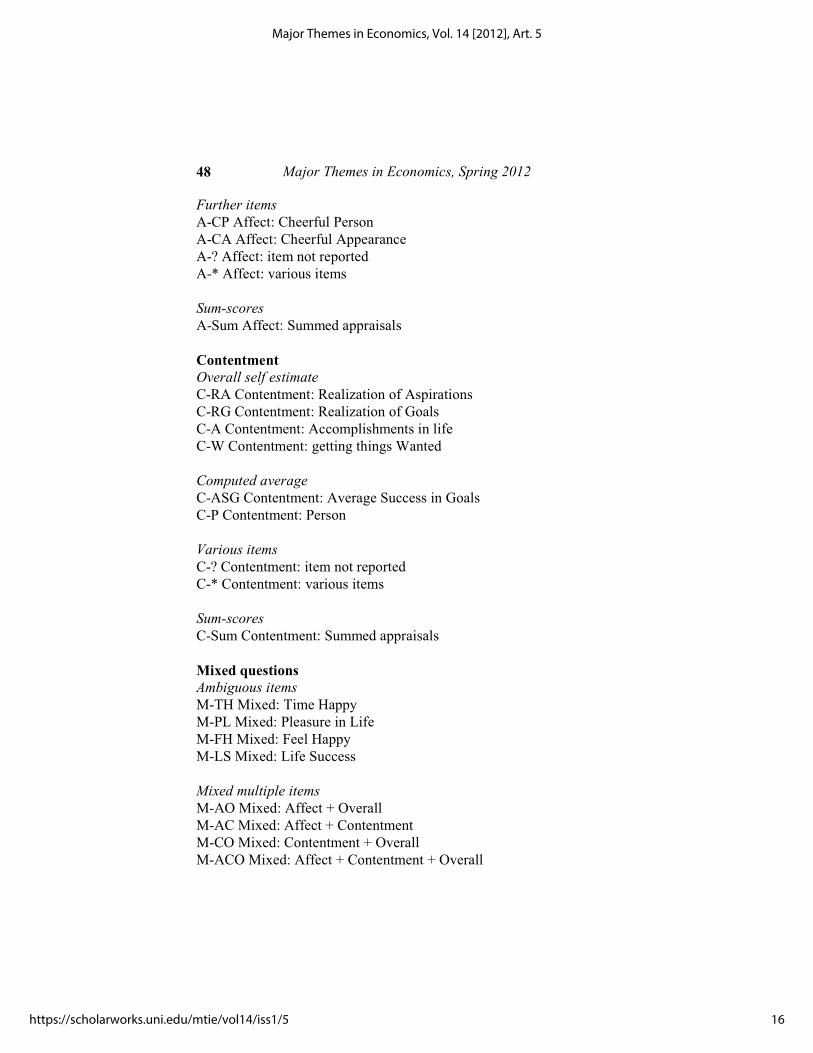
Further itemsA-CP Affect: Cheerful PersonA-CA Affect: Cheerful AppearanceA-? Affect: item not reportedA-* Affect: various items
Sum-scoresA-Sum Affect: Summed appraisals
ContentmentOverall self estimateC-RA Contentment: Realization of AspirationsC-RG Contentment: Realization of GoalsC-A Contentment: Accomplishments in lifeC-W Contentment: getting things Wanted
Computed averageC-ASG Contentment: Average Success in GoalsC-P Contentment: Person
Various itemsC-? Contentment: item not reportedC-* Contentment: various items
Sum-scoresC-Sum Contentment: Summed appraisals
Mixed questionsAmbiguous itemsM-TH Mixed: Time HappyM-PL Mixed: Pleasure in LifeM-FH Mixed: Feel HappyM-LS Mixed: Life Success
Mixed multiple itemsM-AO Mixed: Affect + OverallM-AC Mixed: Affect + ContentmentM-CO Mixed: Contentment + OverallM-ACO Mixed: Affect + Contentment + Overall
16
Major Themes in Economics, Vol. 14 [2012], Art. 5
https://scholarworks.uni.edu/mtie/vol14/iss1/5
Lang: The Most Influential Factors 49
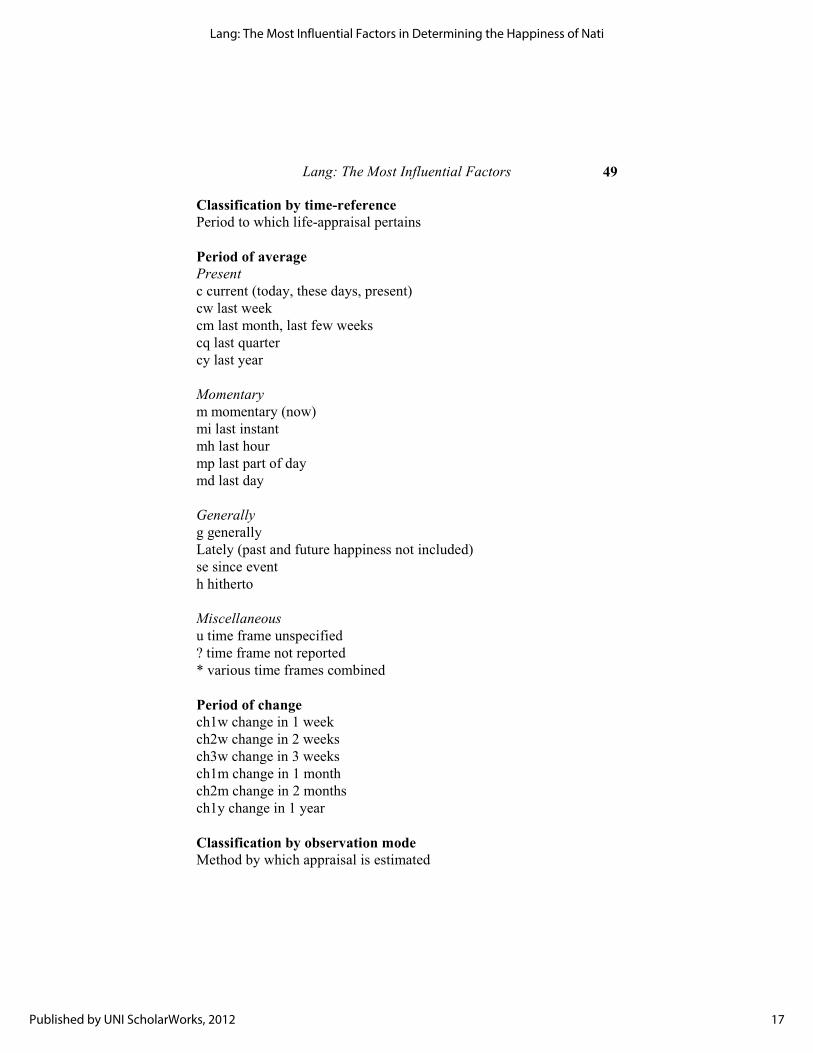
Classification by time-referencePeriod to which life-appraisal pertains
Period of averagePresentc current (today, these days, present)cw last weekcm last month, last few weekscq last quartercy last year
Momentarym momentary (now)mi last instantmh last hourmp last part of daymd last day
Generallyg generallyLately (past and future happiness not included)se since eventh hitherto
Miscellaneousu time frame unspecified? time frame not reported* various time frames combined
Period of changech1w change in 1 weekch2w change in 2 weeksch3w change in 3 weeksch1m change in 1 monthch2m change in 2 monthsch1y change in 1 year
Classification by observation modeMethod by which appraisal is estimated
17
Lang: The Most Influential Factors in Determining the Happiness of Nati
Published by UNI ScholarWorks, 2012
Major Themes in Economics, Spring 201250
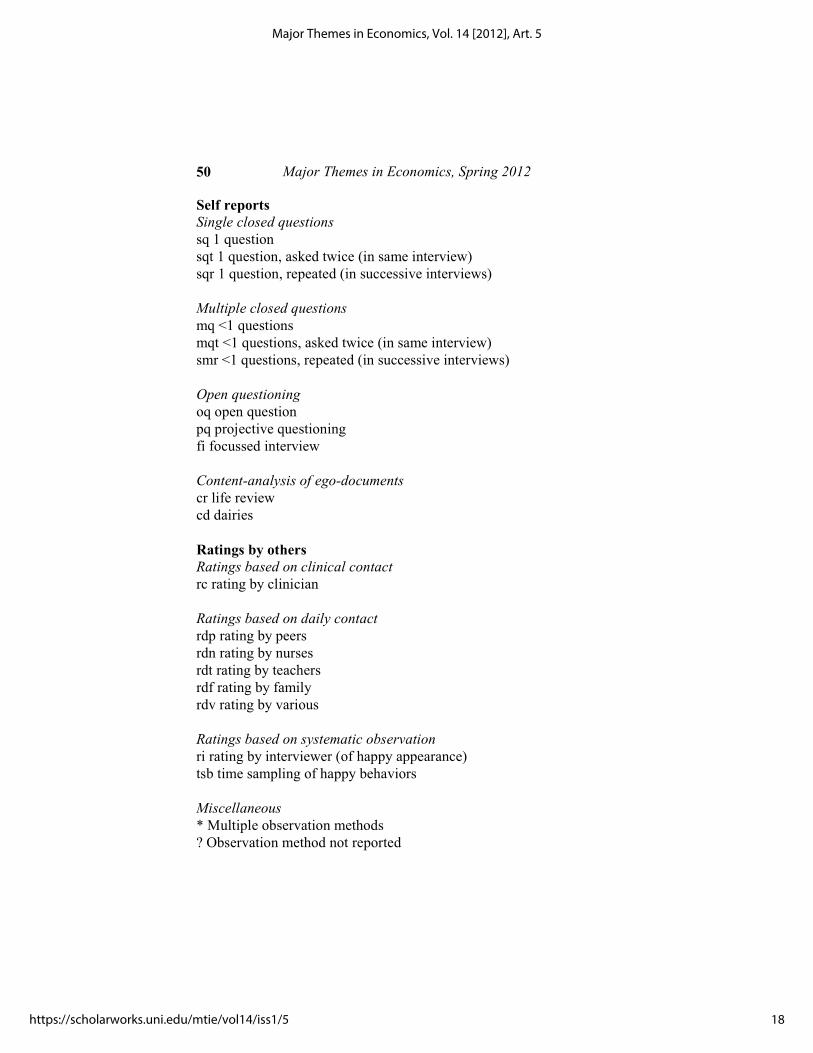
Self reportsSingle closed questionssq 1 questionsqt 1 question, asked twice (in same interview)sqr 1 question, repeated (in successive interviews)
Multiple closed questionsmq <1 questionsmqt <1 questions, asked twice (in same interview)smr <1 questions, repeated (in successive interviews)
Open questioningoq open questionpq projective questioningfi focussed interview
Content-analysis of ego-documentscr life reviewcd dairies
Ratings by othersRatings based on clinical contactrc rating by clinician
Ratings based on daily contactrdp rating by peersrdn rating by nursesrdt rating by teachersrdf rating by familyrdv rating by various
Ratings based on systematic observationri rating by interviewer (of happy appearance)tsb time sampling of happy behaviors
Miscellaneous* Multiple observation methods? Observation method not reported
18
Major Themes in Economics, Vol. 14 [2012], Art. 5
https://scholarworks.uni.edu/mtie/vol14/iss1/5
Lang: The Most Influential Factors 51
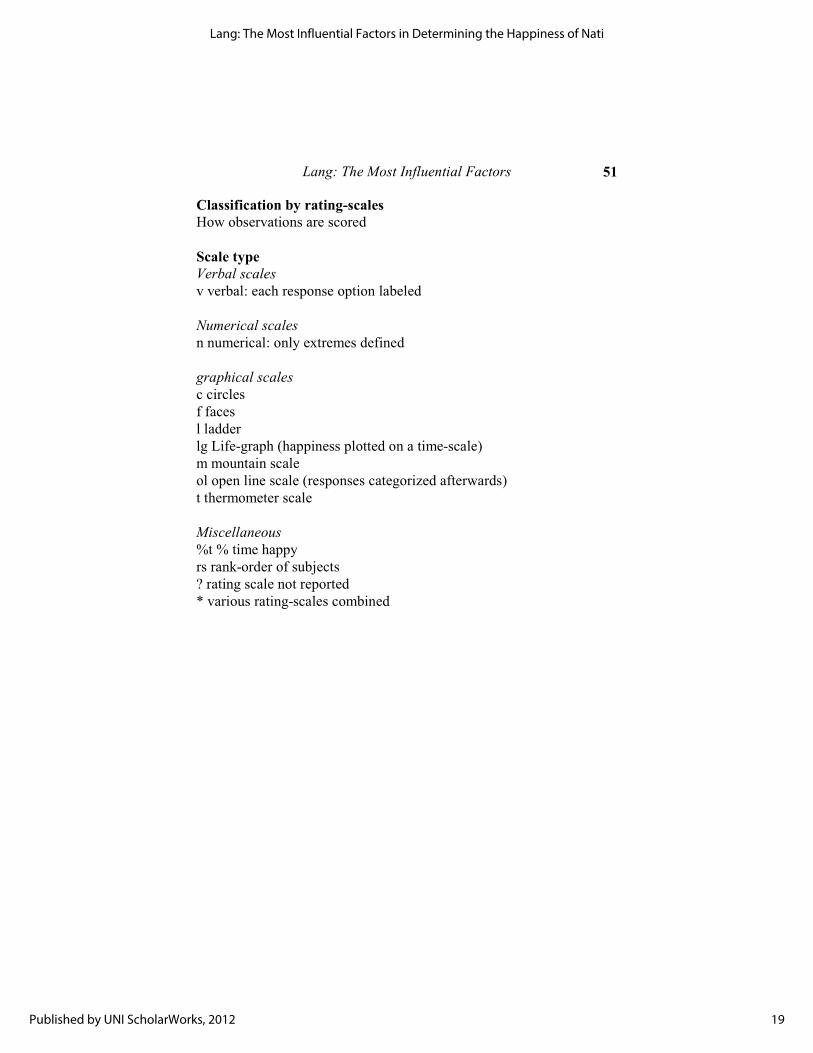
Classification by rating-scalesHow observations are scored
Scale typeVerbal scalesv verbal: each response option labeled
Numerical scalesn numerical: only extremes defined
graphical scalesc circlesf facesl ladderlg Life-graph (happiness plotted on a time-scale)m mountain scaleol open line scale (responses categorized afterwards)t thermometer scale
Miscellaneous%t % time happyrs rank-order of subjects? rating scale not reported* various rating-scales combined
19
Lang: The Most Influential Factors in Determining the Happiness of Nati
Published by UNI ScholarWorks, 2012
Major Themes in Economics, Spring 201252
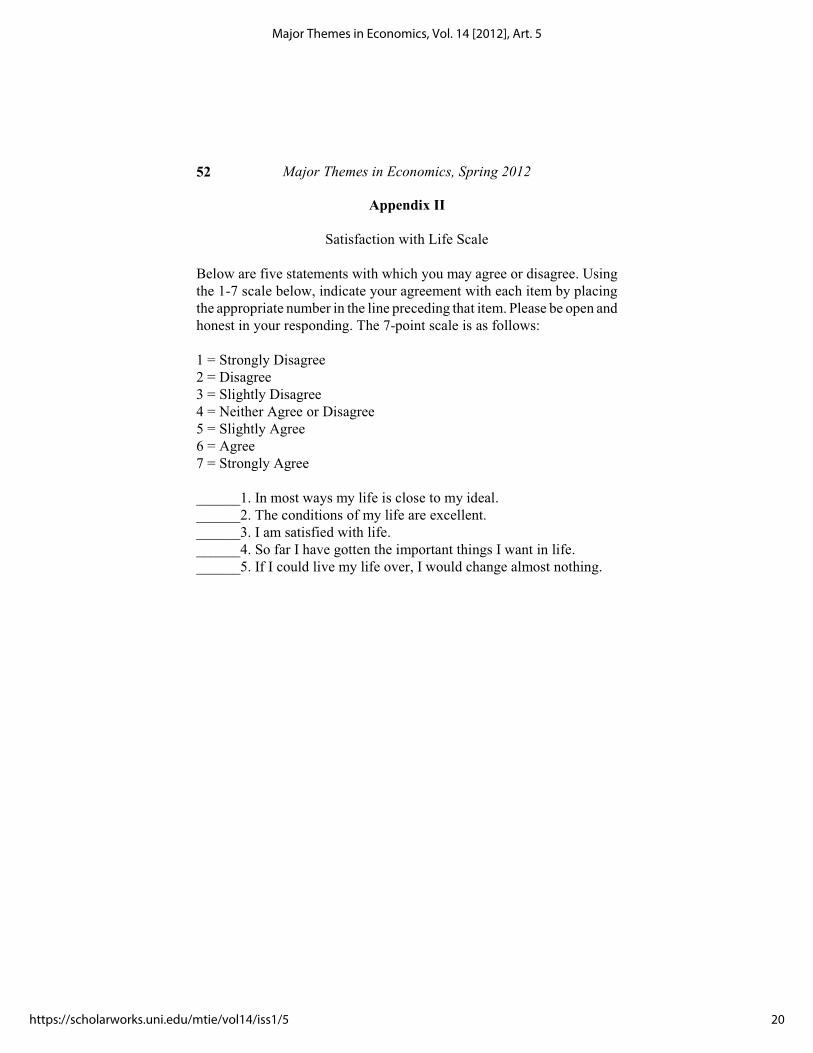
Appendix II
Satisfaction with Life Scale
Below are five statements with which you may agree or disagree. Usingthe 1-7 scale below, indicate your agreement with each item by placingthe appropriate number in the line preceding that item. Please be open andhonest in your responding. The 7-point scale is as follows:
1 = Strongly Disagree2 = Disagree3 = Slightly Disagree4 = Neither Agree or Disagree5 = Slightly Agree6 = Agree7 = Strongly Agree
______1. In most ways my life is close to my ideal.______2. The conditions of my life are excellent.______3. I am satisfied with life.______4. So far I have gotten the important things I want in life.______5. If I could live my life over, I would change almost nothing.
20
Major Themes in Economics, Vol. 14 [2012], Art. 5
https://scholarworks.uni.edu/mtie/vol14/iss1/5
Lang: The Most Influential Factors 53
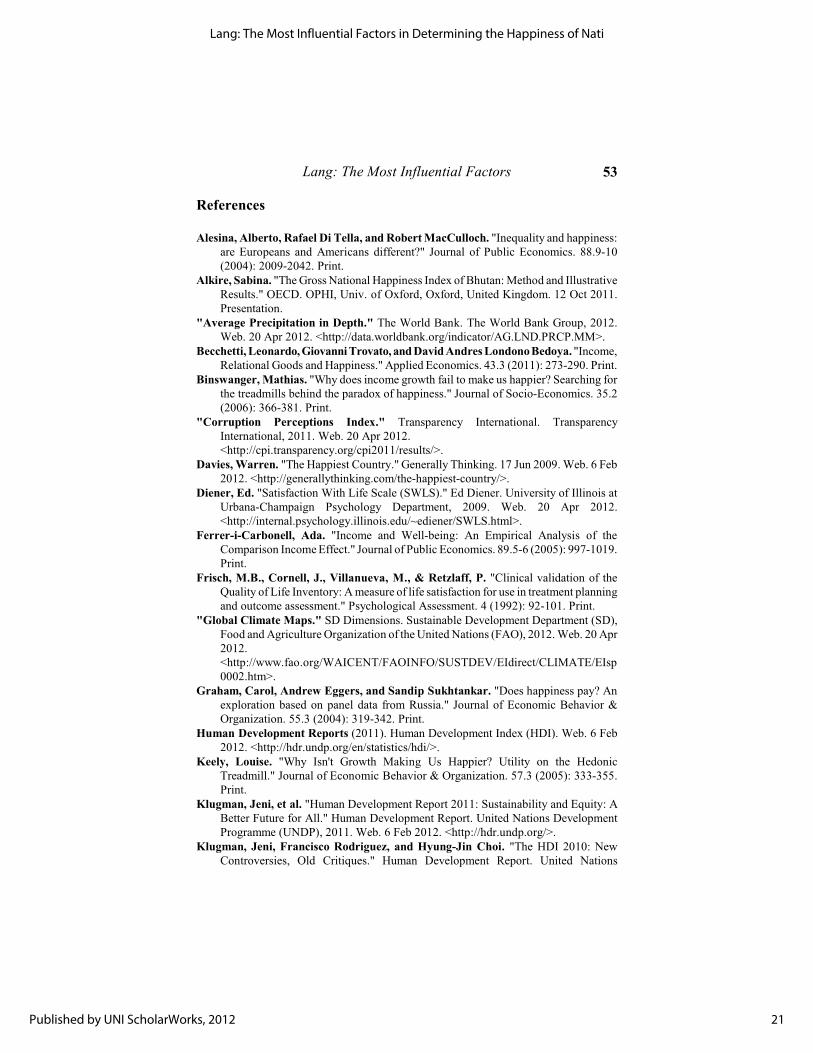
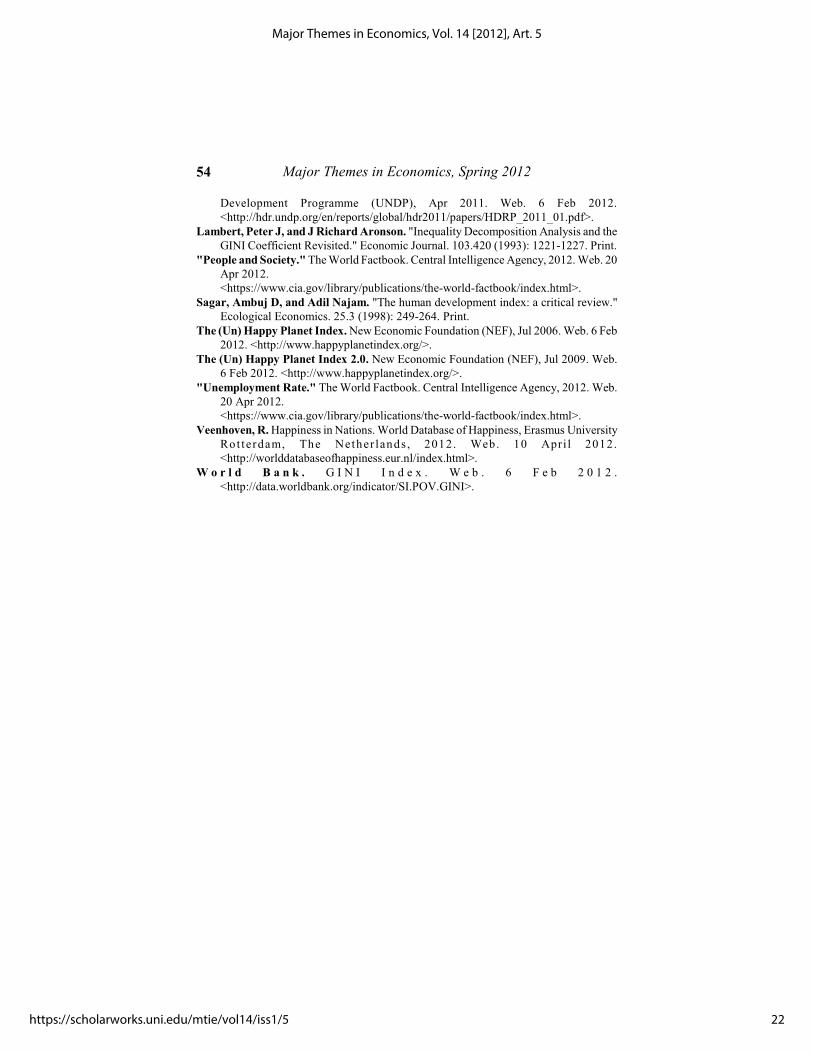
References
Alesina, Alberto, Rafael Di Tella, and Robert MacCulloch. "Inequality and happiness:are Europeans and Americans different?" Journal of Public Economics. 88.9-10(2004): 2009-2042. Print.
Alkire, Sabina. "The Gross National Happiness Index of Bhutan: Method and IllustrativeResults." OECD. OPHI, Univ. of Oxford, Oxford, United Kingdom. 12 Oct 2011.Presentation.
"Average Precipitation in Depth." The World Bank. The World Bank Group, 2012.Web. 20 Apr 2012. <http://data.worldbank.org/indicator/AG.LND.PRCP.MM>.
Becchetti, Leonardo, Giovanni Trovato, and David Andres Londono Bedoya. "Income,Relational Goods and Happiness." Applied Economics. 43.3 (2011): 273-290. Print.
Binswanger, Mathias. "Why does income growth fail to make us happier? Searching forthe treadmills behind the paradox of happiness." Journal of Socio-Economics. 35.2(2006): 366-381. Print.
"Corruption Perceptions Index." Transparency International. TransparencyInternational, 2011. Web. 20 Apr 2012.<http://cpi.transparency.org/cpi2011/results/>.
Davies, Warren. "The Happiest Country." Generally Thinking. 17 Jun 2009. Web. 6 Feb2012. <http://generallythinking.com/the-happiest-country/>.
Diener, Ed. "Satisfaction With Life Scale (SWLS)." Ed Diener. University of Illinois atUrbana-Champaign Psychology Department, 2009. Web. 20 Apr 2012.<http://internal.psychology.illinois.edu/~ediener/SWLS.html>.
Ferrer-i-Carbonell, Ada. "Income and Well-being: An Empirical Analysis of theComparison Income Effect." Journal of Public Economics. 89.5-6 (2005): 997-1019.Print.
Frisch, M.B., Cornell, J., Villanueva, M., & Retzlaff, P. "Clinical validation of theQuality of Life Inventory: A measure of life satisfaction for use in treatment planningand outcome assessment." Psychological Assessment. 4 (1992): 92-101. Print.
"Global Climate Maps." SD Dimensions. Sustainable Development Department (SD),Food and Agriculture Organization of the United Nations (FAO), 2012. Web. 20 Apr2012.<http://www.fao.org/WAICENT/FAOINFO/SUSTDEV/EIdirect/CLIMATE/EIsp0002.htm>.
Graham, Carol, Andrew Eggers, and Sandip Sukhtankar. "Does happiness pay? Anexploration based on panel data from Russia." Journal of Economic Behavior &Organization. 55.3 (2004): 319-342. Print.
Human Development Reports (2011). Human Development Index (HDI). Web. 6 Feb2012. <http://hdr.undp.org/en/statistics/hdi/>.
Keely, Louise. "Why Isn't Growth Making Us Happier? Utility on the HedonicTreadmill." Journal of Economic Behavior & Organization. 57.3 (2005): 333-355.Print.
Klugman, Jeni, et al. "Human Development Report 2011: Sustainability and Equity: ABetter Future for All." Human Development Report. United Nations DevelopmentProgramme (UNDP), 2011. Web. 6 Feb 2012. <http://hdr.undp.org/>.
Klugman, Jeni, Francisco Rodriguez, and Hyung-Jin Choi. "The HDI 2010: NewControversies, Old Critiques." Human Development Report. United Nations
21
Lang: The Most Influential Factors in Determining the Happiness of Nati
Published by UNI ScholarWorks, 2012
Major Themes in Economics, Spring 201254
Development Programme (UNDP), Apr 2011. Web. 6 Feb 2012.<http://hdr.undp.org/en/reports/global/hdr2011/papers/HDRP_2011_01.pdf>.
Lambert, Peter J, and J Richard Aronson. "Inequality Decomposition Analysis and theGINI Coefficient Revisited." Economic Journal. 103.420 (1993): 1221-1227. Print.
"People and Society." The World Factbook. Central Intelligence Agency, 2012. Web. 20Apr 2012.<https://www.cia.gov/library/publications/the-world-factbook/index.html>.
Sagar, Ambuj D, and Adil Najam. "The human development index: a critical review."Ecological Economics. 25.3 (1998): 249-264. Print.
The (Un) Happy Planet Index. New Economic Foundation (NEF), Jul 2006. Web. 6 Feb2012. <http://www.happyplanetindex.org/>.
The (Un) Happy Planet Index 2.0. New Economic Foundation (NEF), Jul 2009. Web.6 Feb 2012. <http://www.happyplanetindex.org/>.
"Unemployment Rate." The World Factbook. Central Intelligence Agency, 2012. Web.20 Apr 2012.<https://www.cia.gov/library/publications/the-world-factbook/index.html>.
Veenhoven, R. Happiness in Nations. World Database of Happiness, Erasmus UniversityRot terdam, The Nether lands , 2012. Web. 10 Apri l 2012.<http://worlddatabaseofhappiness.eur.nl/index.html>.
W o r l d B a n k . G I N I I n d e x . W e b . 6 F e b 2 0 1 2 .<http://data.worldbank.org/indicator/SI.POV.GINI>.
22
Major Themes in Economics, Vol. 14 [2012], Art. 5
https://scholarworks.uni.edu/mtie/vol14/iss1/5