Embed Size (px)
Citation preview

The National Aviation Operations
Monitoring Service
PROJECT OVERVIEW
Background, Approach, Development and Current Status
Mary Connors and Linda Connell

Purpose of Meeting
Introduce NAOMS project
Describe project in sufficient detail that potential benefits are understood
Solicit advice on future FAA briefings and activities

Agenda
NAOMS BriefingNAOMS introduction and overviewSurvey methodology; NAOMS design decisionsSurvey instrumentNAOMS survey initial resultsFuture directions
Discussion

NAOMS Team
NASA Managers• Mary Connors, PhD AvSP, Level 3• Linda Connell AvSP, Level 3
Battelle Support Service Contract to NASA• Loren Rosenthal Battelle Manager• Robert Dodd, ScD Principal Investigator• Jon Krosnick, PhD Survey Methodologist • Joan Cwi, PhD Survey Application• Andrea Swickardt, PhD Statistician• Tom Ferryman, PhD Statistician• Mike Jobanek, MS Aviation Safety Analyst• Rowena Morrison, PhD Aviation Safety Analyst

The NAOMS Team
The NAOMS team is highly experienced and qualified in…
Survey methodologyStatistics Survey application Aviation operations and safety

Expressed Need for Event Data
There have been multiple and consistent recommendations for improvement in aviation data systems . . .
White House Commission on Aviation Safety and Security (“Gore Report” 1998) --
– “Most effective way to identify incidents and problems in aviation is for the people who operate the system (pilots, mechanics, controllers, dispatchers, etc) to self- disclose the information.” (Page 13)
GAO Evaluation (Safer Skies Review, June 2000) --– Additional performance measures required - Use precursors associated with past accidents to track safety baseline and
improvements from interventions
NTSB (Safety Report on Transportation Safety Databases, 2002) --– Over 19 recommendations for improvements in safety event reporting (1968-2001)– Need to address problem of under-reporting in current aviation safety data systems
FAA (Internal Studies, 2004 Strategic Plan draft)– Identify risks before they lead to accidents

The Unmet Data Need
Reliable, stable numbers with system-wide scope– To inform policy decisions– And, investment decisions
Providing better and more rapid feedback on system change, both technological and procedural
Facilitating a truly data-driven basis for safety decisions– An escape from the accident du jour policy-making syndrome

Available Data
A number of databases attempt to capture safety-related information concerning the National Airspace System (NAS)– NTSB Accident/Incident Database– FAA Data System (NAIMS)– Aviation Safety Reporting System (ASRS)
A number of databases attempt to capture safety-related information concerning specific parts of the NAS– FOQA– PDARS– ASAP
No existing database addresses the health and safety of the NASA as a whole in a quantitatively defensible fashion

Goals
1. Track long-term aviation safety trends and patterns.
2. Monitor the impacts of technological and procedural change on the system.
3. Make substantial contributions to data-driven aviation safety decision making.
FlexibleAccessibleComprehensiveQuantitative
To create a new national capability that will :
Features soughtFeatures sought
in NAOMSin NAOMS

NAOMS measures event occurrences, not causes.
(Notable findings require additional investigation.)

NAOMS Survey Approach
Regularly survey those who operate the National Aviation System (NAS)
– View the NAS through their eyes
– Include all types of operations (air carrier, regional, corporate, GA)
Collect data on respondents’events (as operationally experienced)Guarantee confidentiality of dataAchieve scientific integrity by
– Using well crafted survey instruments
– And, rigorous analytic methods.

Questionnaire Structure
Section A: Operational Exposure– Measures operational activity levels (risk exposure)
Section B: Safety Event Experiences (Core Questions) – Counts standard event frequencies with long-term trends in mind
Section C: Focus Topics– Provides a moving “searchlight” that can be redirected as needed to
topics of interest
Section D: Participant Feedback – Seeks continuing feedback on the validity of the NAOMS survey
process and survey questions

NAOMS Development: Initial Stages
Initial program planning started in FY1997
Part of NASA’s AvSP program– Method for evaluating impact of AvSP interventions
Extensive workshops and briefings to FAA and industry through all phases
Development process and OMB approvals were comprehensive, rigorous, and labor-intensive– Required Federal Register Notices (FRN)
Routine data collection began with air carrier pilots in April 2001

Government & Industry Groups Briefed
FAA
HAI
GAMA
AOPA
ALPA
CAST-JIMDAT
NTSB
NATCA
NATA
Boeing
NBAA
SWAPA
ASRS Advisory Subcommittee
ATA
Workshops
Preliminary NAOMS workshop, 5/11/99, Alexandria, VA, 60 attendees
NAOMS field study briefing 3/1/00, D.C., 75 attendees

NAOMS Development Timeline

FAA Participation
Elements of the FAA have been involved in the NAOMS process from the beginning and at various stages in its development
Office of System SafetyFlight Standards - GALines of BusinessATO - Office of Performance Analysis
NASA has invited FAA representatives to serve on the NAOMS Working Group
Encourage others within their organization to provide feedback through the NAOMS Working Group
Will need support for the NAOMS ATC survey effort
Determine how the NAOMS results can best be used to support the FAA safety mission

Overview Summary
NAOMS follows best survey practices
NAOMS measures the occurrence of events, not causes
It is intended to serve the aviation industry as a whole
The NAOMS survey is designed to expose areas that need further investigation
NAOMS questionnaires development is (excrutiatingly) deliberate and thorough
Numerous briefings and workshops have been conducted with the aviation community

Overview Summary (cont’d)
NAOMS statistical methods are robust
NAOMS meets the goal of a quantitative statistically defensible, system-wide safety assessment tool, complementing other databases and assessment tools.

The National Aviation Operations
Monitoring Service
Survey Methodology/Design Decisions
Jon Krosnick Stanford University

Surveys Can Measure
Attitudes
Preferences
Beliefs about the state of the world
Predictions about the future
Past behavioral experiences or events
NAOMS will be almost exclusively concerned with measuring events

You Can Learn
Frequency of occurrences
Changes over time
Similarities and differences among groups

The Survey Approach to Data Gathering
Human-centered
Quantitative
Flexible (versatile, topical)
Comprehensive
Well-developed methods
Statistically accurate
Stable

Survey Benefits
Surveys have been used to shape national policy for many decades
This use is extensive in areas such as public health policy and economics
Aviation safety is a natural topic for survey data collection
Survey methods are mature and well understood

Examples of Federal Surveys
Survey of Income and Program Participation (Census Bureau) 1984 -
Consumer Expenditure Surveys (Census Bureau) 1968 -
Annual Housing Surveys (Census Bureau) 1973 -
Survey of Consumer Attitudes (NSF) 1953 –
Health and Nutrition Examination Surveys (NCHS) 1959 -
National Health Interview Surveys (NCHS) 1970 -
American National Election Studies (NSF) 1948 -
Panel Study of Income Dynamics (NSF) 1968 –
National Longitudinal Surveys (BLS) 1964 -
Behavioral Risk Factor Surveillance System (CDC) 1984 –
Monitoring the Future (NIDA) 1975 -

Federal Surveys that Measure Event Rates
National Crime Victimization Survey (crimes)
Behavioral Risk Factor Surveillance System (e.g., substance use, immunization, seat belt use)
National Health Interview Survey (e.g., injuries, disability, health insurance coverage)
National Health and Nutrition Examination Survey (food consumption)
National Survey of Distracted and Drowsy Driving
National Survey of Drinking and Driving

Validity of Event Rate Measurements
National Crime Victimization Survey (NCVS) Survey reports higher crime rates than FBI reported rates “Did you experience this?” vs. Events reported to the policeTrends over time are very highly correlated (.91)
Monitoring the Future (MTF) SurveyRates of drunk driving higher than that found in NHTSA Fatality Analysis Reporting System (FARS)Driving drunk vs. fatal accidents with drunk driversTrends over time are very highly correlated (.94)

Features of These Surveys
Federally-funded via contracts or grants
Long-term tracking studies
Large number of constituencies use the data
Important policy decisions are based on the data
Conducted by knowledgeable and respected research organizations

Features of These Surveys (Cont’d.)
Design done by collaborative teams of investigators
Principal Investigators remain stable over time
Advisory Oversight Boards oversee the entire project and make suggestions about project direction
Methodological experts serve on advisory boards

Features of These Surveys (Cont’d.)
Questionnaires have core items that remain constant from wave to wave
Topical questions are rotated into and out of the questionnaire to reflect current interests
Press releases and press conferences mark the release of new data (e.g., once a year)
Publications by the project staff summarize a simple set of core trend findings
De-identified and aggregated Information is released to the public
Information forms basis for follow-up studies

The National Aviation Operations
Monitoring Service
Survey Methodology-Part 2
Jon Krosnick Stanford University

Design Decisions

NAOMS Design Decisions
What events to address?
What order of questions?
How long of a recall period?
What mode?

Building Lists of Events
Content Sources
Consultation with Industry/Gov’t Safety Group, e.g.FAAASRS AnalystsWorkshops
Review of Aviation Databases, e.g.ASRSNTSBNAIMSBTS
Focus Groups with Active Professional Participants

Questionnaire Structure and Organization
Conducted ALPA-supported experimental research with active line pilots to determine– How well pilots remember (period of recall)– How pilots organized memory of safety events (questionnaire
organization)– Survey “talk-aloud” tests (individual pilots provide real time criticism
of questionnaire content and structure)

Question Ordering
Question Ordering Relates to Memory Organization:Records of experiences are organized systematically and thematically in memoryUnderstanding respondent memory organization is crucial to optimizing accuracyAsking questions in clusters that match a person’s
memory organization improves measurement precisionVarious hypotheses about how pilots might organize their memories discussed, but no hard data.

Memory Organizations
Severity
Causes
Phase of Flight

Identifying Memory Organization
Experiments
Participants: Air carrier pilots
Various tasksOrder of RecallLabeling of ClustersSorting of Events into Categories
Decision: A “hybrid” organization emerged: mostly event categories with some phases
ATC, mechanical failure, weather, etc.Takeoff, cruise, etc.

Recall Period
Recall Period - The optimal time between event occurrence and survey
Respondent recall period is crucial to survey validity Needs to maximize recall and balance survey logisticsMemories fade over timeParticipants should not be asked to recall things from too far in the pastLiterature Review: A literature review resulted in data that we felt to be insufficient for our purposesOur own study of pilots’ recall of mundane flight events: 7 days maximumWe needed to determine how long more significant events can be remembered

Field Trial
Evaluate methods and survey questionnaireResponse ratesData quality and completenessData reliability and validityCollection modesQuestion wordingRespondent feedback on survey
Estimate scale of a fully operational systemCostsRequired sample sizes

Field Trial Approach
Assessment of the survey instrument and procedures
630 air carrier pilotsVarious versions were testedLast section of survey asked participants for feedback on survey and process
VariationsMode (telephone, mail, face-to-face)Recall periodSection orderTopical foci

Draft Questionnaire
Developed a draft questionnaire that was– Extensively edited and corrected for non-technical wording by
survey method experts– Edited and corrected for technical accuracy by aviation subject
matter experts
Extensive and detailed up-front effort was devoted to questionnaire development.

Recall Period: Validity Analysis
Association of hours flown with number of events witnessed
Association of days in the recall period with number of events witnessed
Strongest relationships for one month and two months
Decision: 60 days chosen as recall period

Mode: Selection and Validation
Validation results:More hours flown should be associated with more events witnessedMore days in the recall period should be associated with more events witnessedStronger relationships indicate more accurate reporting
Mode selection:30% stronger relationships for telephone than mail
Decision: Perform telephone interviewing (Computer Assisted Telephone Interview - CATI)

Summary of Design Conclusions
Address as many safety events identified during preliminary investigations as practical
Order questions to match hybrid clustering
Use 60-day recall period to maximize documentation of rare events
Use telephone interviewing to maximize measurement accuracy
Sample size of approximately 8,000 interviews per year will provide sufficient sensitivity.

The National Aviation Operations
Monitoring Service
Questionnaire Description
Robert Dodd
Dodd and Associates

Air Carrier Questionnaire: Structure
Section A: Aviation Activity DataHours and Legs by make-model and by crew positionPrevious 60 days and Life-time (total hours only)
Section B: Safety Related EventsConsistent data set over timeAirborne conflicts, spatial deviations, ground events, weather encounters, equipment problems, pilot-ATC interaction issues, turbulence, passenger issues, aircraft handling
Section C: Focus QuestionsTopics driven by government/industry priorities
Section D: Survey FeedbackConfidence in recall abilityRelevance of questionsAny problems with specific questions

Air Carrier Questionnaire: General Characteristics
Questions are closed and specificAsking number of times events occurredOpinion not included
Interview is constructed to minimize time required for completionAverage time for completion is 18 minutes
Many questions follow “skip-pattern”Designed to capture more information if a response to a question is affirmativeTransparent to the interview subjectReduces time burden
Many questions are “menu-driven”Helps standardize response values
Scripted responses provided for interviewers for most common questions for clarification

Air Carrier Questionnaire: Section A “Demographics”
Initial questions designed to screen the respondent to ensure they are eligible to complete interview
Flew in last 60 days as air carrier pilot
Balance of questions designed to gain insight into pilot’s experience and type of flying
Information used for analytical categorization (i.e. aircraft size) and for denominator data for other calculationsExtent of flying during last 60 days used as denominator for rate calculations
Specific data elements include (Questions A1-A8):Total career hours, hours and legs flown in last 60 daysMake model of aircraft flown, type operation flown (pax/cargo)Domestic/international experience in last 60 days, size of airline (three size categories)Position in cockpit i.e. captain, first-officer, flight-engineer, relief pilot or other position

Air Carrier Questionnaire: Section B “Safety Events”
Covers operational events that the pilot may have experienced
There are 50 main questions included in Section B covering 9 topic areas
These are questions designed to be asked over time. Results are being used for trend generation
The vast majority of responses are 0 or 1
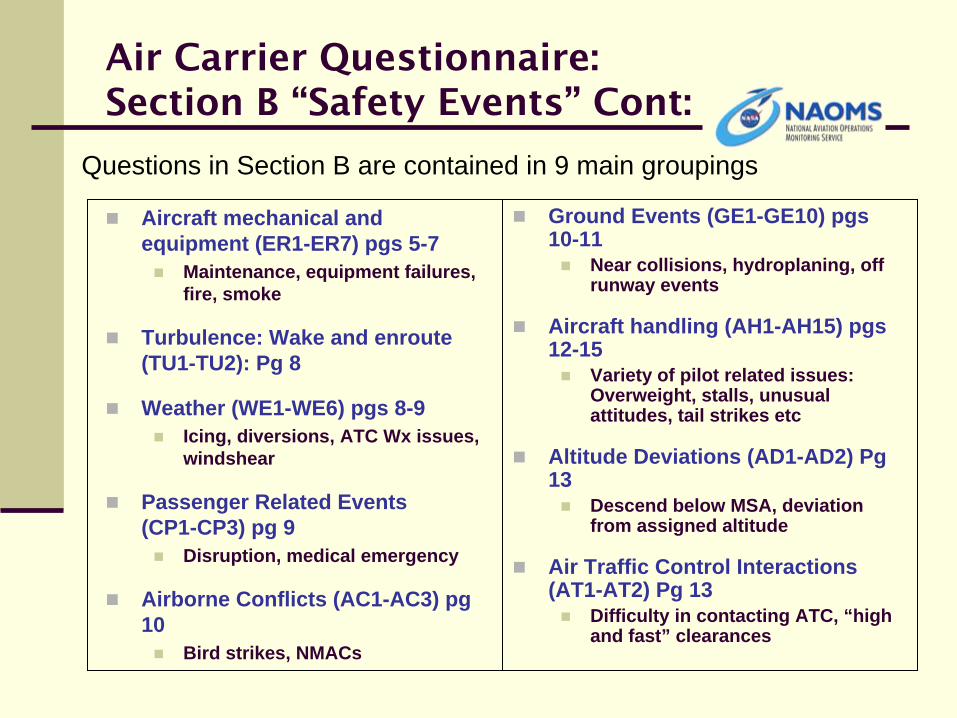
Air Carrier Questionnaire: Section B “Safety Events”
Cont:
Aircraft mechanical and equipment (ER1-ER7) pgs 5-7
Maintenance, equipment failures, fire, smoke
Turbulence: Wake and enroute(TU1-TU2): Pg 8
Weather (WE1-WE6) pgs 8-9Icing, diversions, ATC Wx issues, windshear
Passenger Related Events (CP1-CP3) pg 9
Disruption, medical emergency
Airborne Conflicts (AC1-AC3) pg 10
Bird strikes, NMACs
Ground Events (GE1-GE10) pgs 10-11
Near collisions, hydroplaning, off runway events
Aircraft handling (AH1-AH15) pgs 12-15
Variety of pilot related issues: Overweight, stalls, unusual attitudes, tail strikes etc
Altitude Deviations (AD1-AD2) Pg 13
Descend below MSA, deviation from assigned altitude
Air Traffic Control Interactions (AT1-AT2) Pg 13
Difficulty in contacting ATC, “high and fast” clearances
Questions in Section B are contained in 9 main groupings

Air Carrier Questionnaire: Section C “Topical Questions”
Section C designed to be changeable and flexibleRevision and implementation would take several months
Development, editing, testing
Focus of Section C is not trendingFocus on specific issues as needs
Exploration of new technologiesExploration of specific areas of interest
Section C provides a “quick-response” capability to explore emerging safety issues

Air Carrier Questionnaire: Section C, “In-Close Approach Changes”
Current Section C Deals with “In-Close Approach Changes” (ICAC) and Associated Events
Sixteen main questions (IC1-IC16) pgs 17-20 Extensive use of “drill-down” questions to account for
Number of ICACs,Type of airplane
(“steam-gauge” or “glass”)Type of automation
Type of approach Location of airport Type of clearance changeReason for changeType of problem, if any, associated with change

Air Carrier Questionnaire: Section D, “Feedback”
Last section of the questionnaire designed to obtain feedback from interview subjects
Five questions (D1-D5) Pgs 21-22 provide NAOMS team with information about the survey
Confidence that questions were answered correctlyIdentification of confusing questionsIssues that should be addressed that are not currently addressed in the questionnaire (open-ended responses)Internet usage at home (to determine feasibility of web-based surveys)Other comments as appropriate

Data Collection
CPHRE (Center for Public Health Research and Evaluation)CATISample Selection (without replacement for one year)Locating pilotsMailing Letter (NASA letterhead)Interview processReport of response rates
Response RatesNot located = 18% to 25%Not eligible = 19%Located and eligible = 85% completion rateOver 23,000 interviews completed to date
The National Aviation Operations
Monitoring Service
Preliminary Results
Robert Dodd and Loren Rosenthal,
Battelle

Section D: Confidence In Accuracy of Answers (Question D1)
0.10% 0.30%
6.80%
40.80%
51.90%
0.00%
10.00%
20.00%
30.00%
40.00%
50.00%
60.00%
NotConfident
ModeratelyConfident
ExtremelyConfident

Section D: Confusing or Ambiguous Questions (Question D2)
No 91.1%
Yes for one or more questions 8.7%
Values based on responses from 12,783 pilots

Section A: Hours and Legs Last 60 Days by Aircraft Size (Questions A1 and A2)
0
20
40
60
80
100
120
Small Medium Large WidebodyAircraft Size
HoursLegs

Section A: Type of Flights (Questions A4-A6)
0102030405060708090
%
Small
Medium
Large
WDBY
Pax Flights
Cargo Flights
Other Flights

Section A: Pilot Reporter Cockpit Position (Question A7)
0
10
20
30
40
50
60
70
80
Small Medium Large WDBY
CaptainF/OF/EReliefOther

Section C: Special Topic –
In-Close Approach Changes
Dynamics of approach clearance changes requested by ATC within ten miles of a destination airport
Sixteen questions relating to:Pilot execution of requested changesConsequences
Questions focus on number of in-close approach change (ICAC) events
Followed by additional questions concerning the last ICAC experienced by pilot
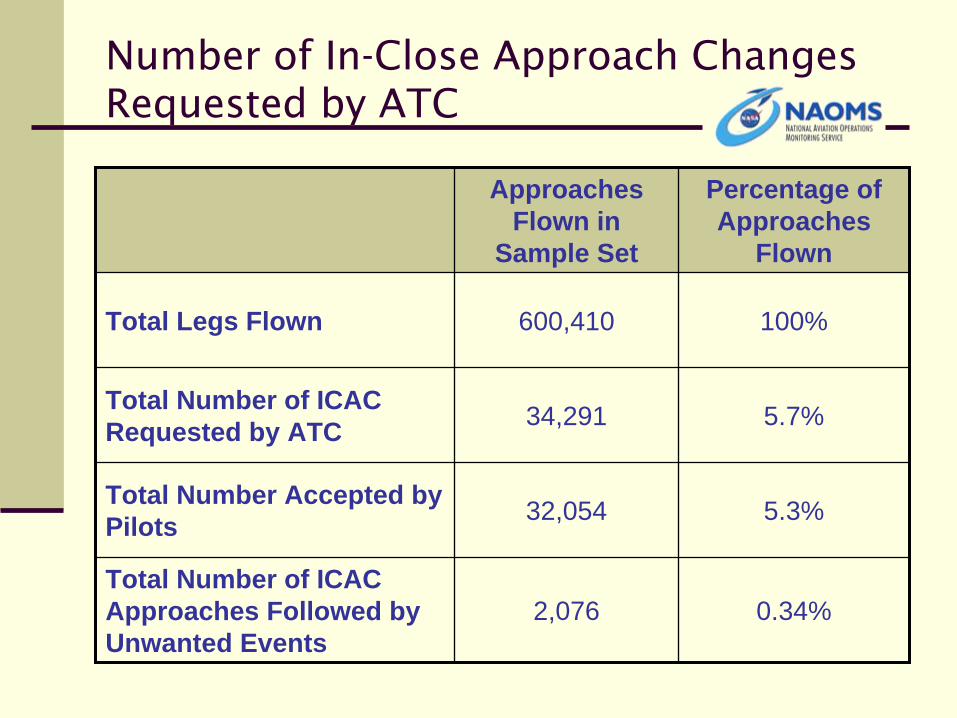
Number of In-Close Approach Changes Requested by ATC
Approaches Flown in
Sample Set
Percentage of Approaches
Flown
Total Legs Flown 600,410 100%
Total Number of ICAC Requested by ATC 34,291 5.7%
Total Number Accepted by Pilots 32,054 5.3%
Total Number of ICAC Approaches Followed by Unwanted Events
2,076 0.34%

Issues Associates with In-Close Approach Changes
Type of ICAC Issue Percentage of Approaches with Unwanted Events
Unstablilized Approach 71.8%
Long/Fast Landing 60.4%
Wake Turbulence Encounter
21.9%
Missed Approach 22.4%
Ground Conflict 4.5%
Airborne Conflict 6.4%
Out of Limit Winds 3.1%
Landing without Clearance 0.5%
Other 37.9%

Section B Results
Adobe Slides

In-Close Approach Change Probability for the 50 Busiest US Airports
Prob
abili
ty o
f A
n In
Clo
se A
ppro
ach
Cha
nge
Highest Number of Airport Operations
Lowest Number of Airport Operations

AdvancedAnalyses

WEIGHTING OF COMPOSITE INDEX COMPONENTS
- 0.20 0.40 0.60 0.80 1.00 1.20 1.40 1.60 1.80
Pax Medical Emergency
Pax Caused Lndg or Diversion
Pilot Left Cockpit
Relative Weight
Statistical Stability Perceived Safety Severity
CABIN EVENTS COMPOSITE INDEX
y = -0.0458x3 + 1.5058x2 - 16.352x + 116.37R2 = 0.8933
-
0.20
0.40
0.60
0.80
1.00
1.20R
ELA
TIVE
CH
AN
GE
COMPOSITE 1.00 0.93 0.66 0.69 0.64 0.61 0.56 0.61 0.65 2001.SP 2001.SU 2001.AU 2002.WTR 2002.SP 2002.SU 2002.AU 2003.WTR 2003.SP
9-11 Effects

Bird Strike Modeling Slides Here
The National Aviation Operations
Monitoring Service
NAOMS Working Group
Mary Connors
NASA

The National Aviation Operations Monitoring Service
Conclusion and Future DirectionsMary Connors and Linda Connell

Conclusion
NAOMS data do not stand by themselves; they need to be used in conjunction with other stakeholder data/research
Ultimate value of NAOMS data depends on government/industry acceptance and use by stakeholders

CAST/JIMDAT Participation
ChairpersonsJay Pardee (FAA/ANE-100)Paul Russell (Boeing Commercial Airplane)
Meetings: Several NAOMS briefings over last 18 months
Feb 03 – San Diego Jul 03 – Newport, RIDec 03 – Presentation in Seattle Jun 04 - San Francisco
ActivitiesAnalysis of 25 completed safety and 21 committed JIMDAT safety enhancementsAt June meeting in San Francisco made suggestions for inclusions of Section B; suggested topics for Section C (Aircraft automation, MELs); procedures; training; cargo versus passenger operations

CAST/JIMDAT Participation, cont.
JIMDAT selected Section C “Procedures and Training”Established subgroup including representatives from Allied PilotAssociation, Boeing Commercial Airplane and FAA Seattle AircraftEvaluation Group
StatusInitial draft completedTalk alouds completedQuestions reworked
ImplementationCATI programming complete 9-15-2004Interviews 9/30 through 11/30 Results to JIMDAT Dec 04

Proposed NAOMS Working Group
PurposeEnsure that results are validly interpretedGain agreement on content, level, and timing of information releaseRecommend new directionsBuild community support for NAOMS
Industry and Government groupRecruited from all major industry/labor segmentsIndividuals selected for their personal knowledge & skills
Non-Disclosure/Confidentiality agreement asked of industry participants
(Base on pre-decisional exemption from public information requirements)
Industry Participation through Ames Associates Program(No government compensation; no intellectual property rights; participants are covered by Workmen’s Compensation by NASA Ames Research Center) Status; Two working group formation meetings held

NAOMS Development Timeline

Plans/Decisions for FY 05
Air carrier pilot telephone surveys continue
ATC survey developed and tested
Web-based survey options
Sampling modified as appropriate
High-level analytical protocols implemented

ATO, Especially the Office of Performance Analysis,
may be very important to NAOMS’ future