Embed Size (px)
Citation preview

national carbonaccounting system
tech
nica
l rep
ort n
o. 4
Land Clearing:A Social History
The National Carbon Accounting System provides a complete
accounting and forecasting capability for human-induced sources and
sinks of greenhouse gas emissions from Australian land based
systems. It will provide a basis for assessing Australia’s progress
towards meeting its international emissions commitments.
http://www.greenhouse.gov.au
The lead Commonwealth agency on greenhouse
matters
Australian Greenhouse Office
technical report no. 4 Land Clearing: A Social History

The National Carbon Accounting System:
• Supports Australia's position in the international development ofpolicy and guidelines on sinks activity and greenhouse gas emissionsmitigation from land based systems.
• Reduces the scientific uncertainties that surround estimates of landbased greenhouse gas emissions and sequestration in the Australian context.
• Provides monitoring capabilities for existing land based emissionsand sinks, and scenario development and modelling capabilities thatsupport greenhouse gas mitigation and the sinks development agendathrough to 2012 and beyond.
• Provides the scientific and technical basis for internationalnegotiations and promotes Australia's national interests ininternational fora.
http://www.greenhouse.gov.au/ncas
For additional copies of this report phone 1300 130 606
Series 1 Publications
1. Setting the Frame
2. Estimation of Changes in Soil Carbon Due to Changes in Land Use
3. Woody Biomass: Methods for Estimating Change
4. Land Clearing 1970-1990: A Social History
5a. Review of Allometric Relationships for Estimating Woody Biomass for Queensland, the NorthernTerritory and Western Australia
5b. Review of Allometric Relationships for Estimating Woody Biomass for New South Wales, theAustralian Capital Territory, Victoria, Tasmania and South Australia
6. The Decay of Coarse Woody Debris
7. Carbon Content of Woody Roots: Revised Analysis and a Comparison with Woody ShootComponents (Revision 1)
8. Usage and Lifecycle of Wood Products
9. Land Cover Change: Specification for Remote Sensing Analysis
10. National Carbon Accounting System: Phase 1 Implementation Plan for the 1990 Baseline
11. International Review of the Implementation Plan for the 1990 Baseline (13-15 December 1999)
Series 2 Publications
12. Estimation of Pre-Clearing Soil Carbon Conditions
13. Agricultural Land Use and Management Information
14. Sampling, Measurement and Analytical Protocols for Carbon Estimation in Soil, Litter and CoarseWoody Debris
15. Carbon Conversion Factors for Historical Soil Carbon Data
16. Remote Sensing Analysis Of Land Cover Change - Pilot Testing of Techniques
17. Synthesis of Allometrics, Review of Root Biomass and Design of Future Woody Biomass SamplingStrategies
18. Wood Density Phase 1 - State of Knowledge
19. Wood Density Phase 2 - Additional Sampling
20. Change in Soil Carbon Following Afforestation or Reforestation
21. System Design
22. Carbon Contents of Above-Ground Tissues of Forest and Woodland Trees
23. Plant Productivity - Spatial Estimation of Plant Productivity and Classification by Vegetation Type
24. Analysis of Wood Product Accounting Options for the National Carbon Accounting System
25. Review of Unpublished Biomass-Related Information: Western Australia, South Australia, NewSouth Wales and Queensland
26. CAMFor User Manual

The Australian Greenhouse Office is the lead Commonwealth agency on greenhouse matters.
LAND CLEARING:A SOCIAL HISTORY
AUSTRALIAN GREENHOUSE OFFICE
National Carbon Accounting System Technical Report No. 4
September 2000

Australian Greenhouse Officeii
Printed in Australia for the Australian Greenhouse Office© Commonwealth of Australia 2000
This work is copyright. It may be reproduced in whole or part for study or trainingpurposes subject to the inclusion of an acknowledgement of the source and nocommercial usage or sale results. Reproduction for purposes other than those listedabove requires the written permission of the Communications Team, AustralianGreenhouse Office. Requests and inquires concerning reproduction and rights shouldbe addressed to the Communications Team, Australian Greenhouse Office, GPO Box 621, CANBERRA ACT 2601.
For additional copies of this document please contact National Mailing and Marketing.Telephone: 1300 130 606. Facsimile: (02) 6299 6040.
Email: [email protected]
For further information please contact the National Carbon Accounting System athttp://www.greenhouse.gov.au/ncas/
Neither the Commonwealth nor the Consultants responsible for undertaking thisproject accepts liability for the accuracy of or inferences from the material contained inthis publication, or for any action as a result of any person’s or group’s interpretations,deductions, conclusions or actions in reliance on this material.
September 2000
Environment Australia Cataloguing-in-Publication
Land clearing: A social history / Australian Greenhouse Office.
p. cm.
(National Carbon Accounting System technical report; no. 4)
ISSN: 14426838
1. Clearing of land-Australia-History. I. Australian Greenhouse Office. II. Series.
631.61’0994-dc21

National Carbon Accounting System Technical Report iii
SUMMARY
This social history documents the factors thatcontributed to the land clearing that occurred since1970, and provides an overview of where and whenit took place. It was commissioned under theNational Carbon Accounting System (NCAS), toprovide contextual information for a land coverchange study for the period since 1970. Theinformation presented here is not intended to beused in either a quantitative or predictive sense.Findings are presented first as a national overview,and then as State and Territory analyses of whyclearing occurred, and where and when the majorclearing events took place.
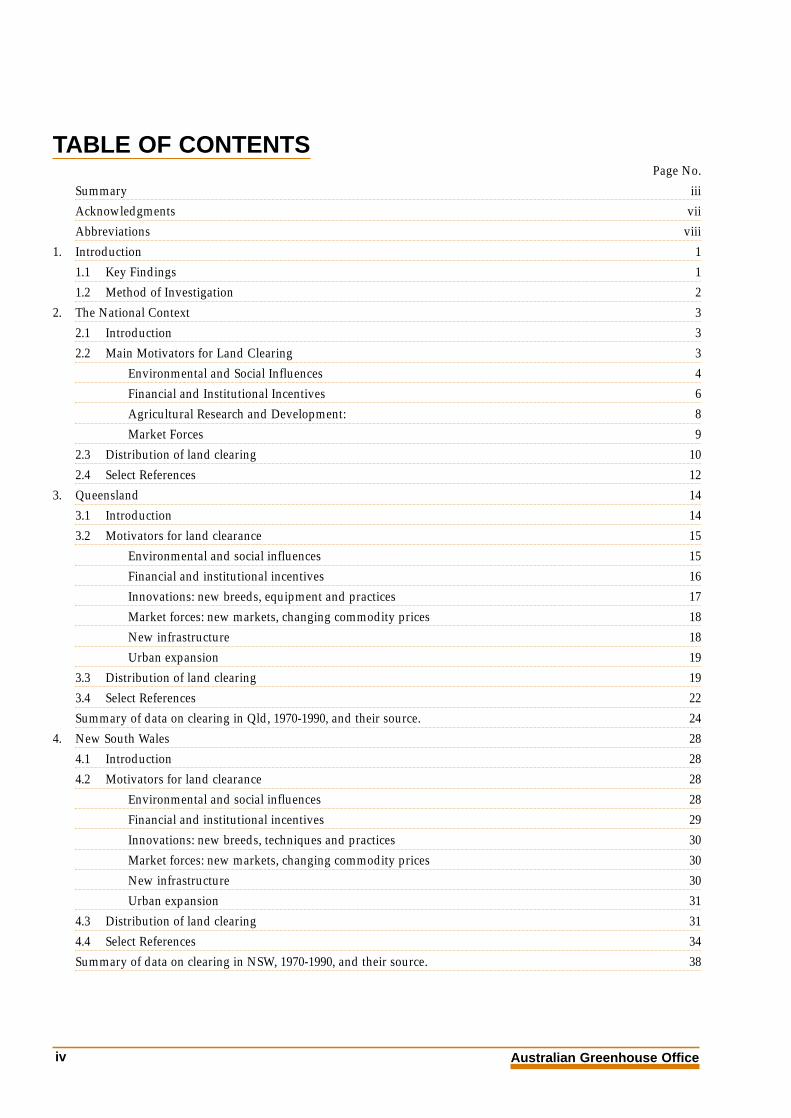
TABLE OF CONTENTSPage No.
Summary iii
Acknowledgments vii
Abbreviations viii
1. Introduction 1
1.1 Key Findings 1
1.2 Method of Investigation 2
2. The National Context 3
2.1 Introduction 3
2.2 Main Motivators for Land Clearing 3
Environmental and Social Influences 4
Financial and Institutional Incentives 6
Agricultural Research and Development: 8
Market Forces 9
2.3 Distribution of land clearing 10
2.4 Select References 12
3. Queensland 14
3.1 Introduction 14
3.2 Motivators for land clearance 15
Environmental and social influences 15
Financial and institutional incentives 16
Innovations: new breeds, equipment and practices 17
Market forces: new markets, changing commodity prices 18
New infrastructure 18
Urban expansion 19
3.3 Distribution of land clearing 19
3.4 Select References 22
Summary of data on clearing in Qld, 1970-1990, and their source. 24
4. New South Wales 28
4.1 Introduction 28
4.2 Motivators for land clearance 28
Environmental and social influences 28
Financial and institutional incentives 29
Innovations: new breeds, techniques and practices 30
Market forces: new markets, changing commodity prices 30
New infrastructure 30
Urban expansion 31
4.3 Distribution of land clearing 31
4.4 Select References 34
Summary of data on clearing in NSW, 1970-1990, and their source. 38
Australian Greenhouse Officeiv

National Carbon Accounting System Technical Report v
TABLE OF CONTENTS (continued)
Page No.
5. Australian Capital Territory 41
5.1 Introduction 41
5.2 Motivators for land clearance 41
Urban expansion 41
5.3 Distribution of land clearing 42
5.4 Select References 42
Summary of data on clearing in the ACT, 1970-1990, and their source. 43
6. Victoria 44
6.1 Introduction 44
6.2 Motivators for land clearance 44
Environmental and social influences 44
Financial and institutional incentives 44
Market forces: new markets, changing commodity prices 45
New infrastructure 45
Urban expansion 45
6.3 Distribution of land clearing 45
6.4 Select References 49
Summary of data on clearing in the Vic, 1970-1990, and their source 50
7. Tasmania 51
7.1 Introduction 51
7.2 Motivators for land clearance 51
Environmental and social influences 51
Financial and institutional incentives 51
Innovations: new breeds, techniques and practices 52
Market forces: new markets, changing commodity prices 52
Urban expansion 53
7.3 Distribution of land clearing 53
7.4 Select References 54
Summary of data on clearing in Tas, 1970-1990, and their source. 56
8. South Australia 59
8.1 Introduction 59
8.2 Motivators for land clearance 59
Environmental and social influences 59
Financial and institutional incentives 60
Innovations: new breeds, techniques and practices 61
Market forces: new markets, changing commodity prices 61
New infrastructure 61
Urban expansion 61
8.3 Distribution of land clearing 61
8.4 Select References 66
Summary of data on clearing in SA, 1970-1990, and their source. 68

TABLE OF CONTENTS (continued)
Page No.
9. Western Australia 73
9.1 Introduction 73
9.2 Motivators for land clearance 73
Environmental and social influences 73
Financial and institutional incentives 75
Innovations: new breeds, techniques and practices 76
Market forces: new markets, changing commodity prices 76
New infrastructure 76
Urban expansion 78
9.3 Distribution of land clearing 78
9.4 Select References 79
Summary of data on clearing in WA, 1970-1990, and their source. 80
10. Northern Territory 82
10.1 Introduction 82
10.2 Motivators for land clearance 82
Environmental and social influences 82
Financial and institutional incentives 83
Innovations: new breeds, techniques and practices 83
Market forces: new markets, changing commodity prices 83
New infrastructure 84
Urban expansion 84
10.3 Distribution of land clearing 84
10.4 Select References 85
Summary of data on clearing in the NT, 1970-1990, and their source. 86
LIST OF FIGURES
Figure 1. Main motivators for land clearing 4
Figure 2. Net value of Farm Production (ABARE 2000) 10
Figure 3. Clearing in Queensland has been motivated by agricultural profits, assisted by a combination of environmental influences, incentive schemes and agricultural R&D 14
Figure 4. Areas of major clearing in Queensland 15
Australian Greenhouse Officevi

National Carbon Accounting System Technical Report vii
ACKNOWLEDGMENTS
Research for this report was provided by ResourcePolicy & Management Consultants (RolandBreckwoldt and Jenny Andrew) in association withMike Williams, Siwan Lovett and Robert Boden. Thisincluded some 250 interviews in addition to detailedresearch of published and unpublished reports andmedia coverage. Editorial services were provided byTricia Kaye and Penny Olsen.
Workshops and reviews by State and TerritoryGovernments led to numerous significant inputs tothe report.
Australian Greenhouse Officeviii
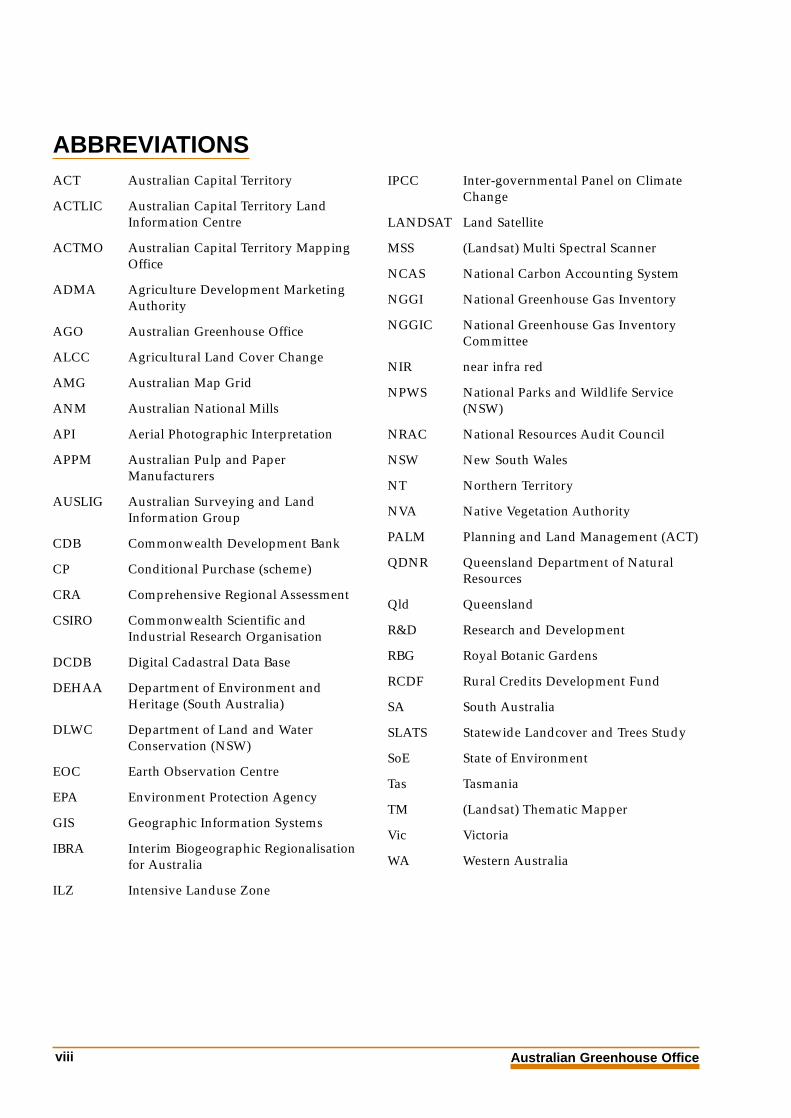
ABBREVIATIONSACT Australian Capital Territory
ACTLIC Australian Capital Territory LandInformation Centre
ACTMO Australian Capital Territory MappingOffice
ADMA Agriculture Development MarketingAuthority
AGO Australian Greenhouse Office
ALCC Agricultural Land Cover Change
AMG Australian Map Grid
ANM Australian National Mills
API Aerial Photographic Interpretation
APPM Australian Pulp and PaperManufacturers
AUSLIG Australian Surveying and LandInformation Group
CDB Commonwealth Development Bank
CP Conditional Purchase (scheme)
CRA Comprehensive Regional Assessment
CSIRO Commonwealth Scientific andIndustrial Research Organisation
DCDB Digital Cadastral Data Base
DEHAA Department of Environment andHeritage (South Australia)
DLWC Department of Land and WaterConservation (NSW)
EOC Earth Observation Centre
EPA Environment Protection Agency
GIS Geographic Information Systems
IBRA Interim Biogeographic Regionalisationfor Australia
ILZ Intensive Landuse Zone
IPCC Inter-governmental Panel on ClimateChange
LANDSAT Land Satellite
MSS (Landsat) Multi Spectral Scanner
NCAS National Carbon Accounting System
NGGI National Greenhouse Gas Inventory
NGGIC National Greenhouse Gas InventoryCommittee
NIR near infra red
NPWS National Parks and Wildlife Service(NSW)
NRAC National Resources Audit Council
NSW New South Wales
NT Northern Territory
NVA Native Vegetation Authority
PALM Planning and Land Management (ACT)
QDNR Queensland Department of NaturalResources
Qld Queensland
R&D Research and Development
RBG Royal Botanic Gardens
RCDF Rural Credits Development Fund
SA South Australia
SLATS Statewide Landcover and Trees Study
SoE State of Environment
Tas Tasmania
TM (Landsat) Thematic Mapper
Vic Victoria
WA Western Australia

1. INTRODUCTION
Land clearing is a major source of Australia’sgreenhouse gas emissions, estimated to contributeabout 12 per cent of Australia’s total emissions in1998. Land clearing is accounted for under the LandUse Change and Forestry sector of the NationalGreenhouse Gas Inventory. Estimation methods areguided by the Revised Intergovernmental Panel onClimate Change (IPCC) Guidelines (IPCC 1996).Harvesting for forestry is accounted for separately,using wood harvest statistics. This study, under theNational Carbon Accounting System (NCAS),therefore focuses largely upon the clearing of nativevegetation for various agricultural purposes.
Under the Kyoto Protocol, as a net emitter in thissector, Australia will be able to include land clearingemissions in its 1990 Baseline. This will require areduction in the current uncertainties that generallysurround estimates of land clearing emissions. Amajor source of improvement will be gained frombetter estimates of the rates of land clearing, where itoccurred, and what type of vegetation was beingcleared. This is critical in the calculation of biomasscleared and resultant carbon emissions. Currentmethodology assumes a twenty year decay cycle forcarbon released by land clearing – this means that anestimation for 1990 will need to include data on thearea and location of land clearing from 1970-1990.
Remote sensing will play a key role in improvingland clearing estimates for 1970-1990 – indeed it isthe only way of providing an accurate map of whereclearing occurred, and matching the clearing to thevegetation type. The period 1970-1990 embraces twodecades when great advances were made in remotesensing technology, but there are key gaps in theimage archive. There are also variations in thequality of the available data, requiring considerablecalibration and interpretation.
National Carbon Accounting System Technical Report 1
A number of remote sensing analyses have alreadybeen undertaken. These have generally sought toestimate rates of land cover change operating overvarying periods. In terms of the 1990 Baseline, themost relevant of these are:
• a study of land cover change acrossAustralia from 1980-1990 (Graetz, EarthObservation Centre (EOC),unpublished data);
• an analysis of forest cover change inVictoria from 1972-1987 (Woodgate & Black1988); and
• an analysis of tree clearing in Queenslandfrom 1988-1992 (Statewide Landcover andTrees Study (SLATS), QueenslandDepartment of Natural Resources(QDNR) 1997 & 1999).
These studies are described more fully in a latersection of this chapter. In general, these studies haveselected time periods on the basis of dataavailability and quality, rather than meeting aspecific temporal objective, as required in the 1990Baseline estimation.
The NCAS will be commissioning a specific multi-temporal remote sensing analysis of land coverchange from 1970 onwards. It will be important thatthis study is focussed on the areas and periods ofmajor change, and that it is able to seek out andintegrate a range of data types in those priorityplaces and times. Moreover, an understanding ofmotivation and process will assist in the explanationof both trends and anomalies in the available data.
1.1 KEY FINDINGSAgricultural profit is the primary motivator for landclearing. This can be gained in two ways: immediateeconomic gain from increased production, andfuture economic gain from increased land values.
During the period 1970-1990 both these forms ofeconomic gain were enhanced by a range offinancial and institutional incentives for agricultural

Australian Greenhouse Office2
development, which provided cheap land alongwith venture capital in the forms of loans or taxconcessions. These incentives were largelydiminished by the late 1980s, although they have leftbehind a legacy of smaller subdivisions withreduced economic margins, and hence a need tofarm more intensively. Also, once land is clearedthere is an incentive to maintain the resultantimproved land values through re-clearing,particularly in warmer areas where regrowthis significant.
The direct financial incentives were overlain with arange of environmental and socio-economicinfluences. The availability of suitable land, andassociated road rail and water infrastructure wasparticularly important. In Queensland, New SouthWales and Western Australia, large areas of newland were developed for both grazing and cropping.In New South Wales and Western Australia existinggrazing land was converted into cropping, requiringmore intensive development of the land. Theexpansion of grazing and the conversion to croppingwere supported by a range of agricultural researchand development initiatives, providing moreproductive plant varieties with greater droughttolerance and a capacity to farm on poorer soilsthrough the use of fertilisers.
Land tenure and the introduction of clearingcontrols have been strong influences, with clearinggenerally reducing after the introduction of controls,but often reported as increasing beforehand.Clearing is now controlled by legislation in WesternAustralia, South Australia, Victoria and New SouthWales, and to some degree Queensland.The introduction of legislation, while reflectingchanging social attitudes and a growing awarenessof the effect and extent of land degradation, hasgenerally been strongly opposed by farmers.
The influence of commodity prices on clearing isvaried, and closely tied to the degree of profit to begained. Increased commodity prices and newmarkets encouraged agricultural expansion andconversion from grazing to cropping.
Equally though, declining profits either fromdecreased commodity prices, or from saturatedmarkets, often necessitated clearing, by demandingmore production to simply maintain income.Commodity prices therefore do not necessarily affectclearing rates in a direct way, but rather form part ofa general framework of available finance to theindividual farmer.
Overall the nature and rate of clearing variedthroughout the period 1970-1990 on a jurisdictionalbasis, indicating that government policies have hada profound influence on the economics of clearing atthe farm level. During the late 1980s, attitudestowards the land had begun to change, and this isreflected in changed policies. In many areas, the rateof clearing began to decline in the late 1980s, whilein other areas, significant clearing continued.
1.2 METHOD OF INVESTIGATIONData for this project were gathered through personaland telephone interviews, literature reviews andobservation. A total of over 105 interviews wereconducted throughout Australia with government,non-government, industry and landholderrepresentatives. Interviewees, where possible, wereselected in terms of their involvement in past land-clearing data collection and/or their historicunderstanding of clearing and clearing events ona State, regional or local level. Not all relevantstakeholders could be interviewed forthis assessment.
The literature review includes: publicationsspecifically addressing land clearing issues; theresults of remote sensing data collection and othermapped information from the internet or writtenreports and maps.
Information gathered has been sorted intobiogeographic regions, where possible, followingThackway and Cresswell (1995). This provides abroadscale break-up of the Australianenvironment into biogeographical regions, crossingState and Territory boundaries and groupings ofinteracting ecosystems.

National Carbon Accounting System Technical Report 3
2. THE NATIONAL CONTEXT
2.1 INTRODUCTIONOver many decades Commonwealth and StateGovernments have directed financial, organisationaland human resources to encourage the developmentand expansion of rural industries in Australia. Therural sector was and continues to be seen as a vitalsector of the nation’s economic and social fabric.
Land clearing was supported by Commonwealthand State Governments as an essential part ofimproved productivity, contributing to theenhancement of national economic prosperity. Thisdrive for agricultural development, coupled withtechnological advances, available finance and a‘pioneering’ approach, encouraged both theexpansion of agricultural land, and theintensification of agriculture on existing land.During the 1980s attitudes towards the land began tochange with a growing awareness of the effect of treeclearing on land degradation.
The 1990s have generally witnessed a major shiftat the Commonwealth and State levels, with newlegislative, political and economic factors affectingdecision-making in relation to landclearing activities.
2.2 MAIN MOTIVATORS FOR LANDCLEARING
Clearing is motivated by the pursuit of agriculturalprofit, either for immediate returns or future gainsthrough improved land values. The balance betweenthe cost of clearing and the gains to be made isinfluenced by several inter-related factors. For thepurposes of this report, these have been divided intothe following topics, although it must be recognisedthat it is the confluence of these that counts, and nottheir individual effects: (see Figure 1)
• Environmental and social influences: landcapability and suitability, land managementpractices, attitudes towards the land andclearing controls all form a part of thecontext in which clearing takes place.
• Financial and institutional incentives: thesehad the greatest influence, as the cost ofclearing is directly alleviated, and oftenloans or land grants were contingent uponthe land being cleared.
• Innovations: new crops and pastures, andthe use of fertilisers, made productionpossible on previously unused lands, andharvesting equipment required clearedswathes. Bulldozers could clear land farmore effectively than the previousmanual methods.
• Market forces: commodity prices fluctuated,with clearing occurring both in times ofboom and bust. Generally farming becameless profitable, creating greater pressure onthe individual farmer.
• New infrastructure: new dams encouragedmore irrigated farming, and road and railinfrastructure was required to support thenew industries.
• Urban expansion: urban expansion hasoccurred mainly in the coastal areas, andwhile the area of clearing has been small,biomass cleared in high rainfall areas couldbe significant.

Australian Greenhouse Office4
Environmental and Social Influences
At the national level, a range of inter-relatedenvironmental and social factors combined to bothencourage land clearing for agricultural purposes,and influence its pattern. The influence of climate,and seasonal events such as El Nino, play a strongrole in agricultural productivity, and no doubtinfluence the pattern of clearing. However, therelationship of climatic events to clearing is likely tobe complex. On the one hand, good seasons may
encourage clearing, as there is a greater confidencein the agricultural economy. On the other hand,clearing may also be a by-product of dry seasons,with more production required at the margins to beprofitable. The influence of climate is not furtherexamined in this report, due to the perceivedcomplexity and general lack of understanding ofits effect.
Figure 1: Main motivators for land clearing.
Environmental and social influences• Land availability/capability• Clearing controls• Attitudes to the land
Market forces• Fluctuating commodity prices• Declining terms of trade• New markets
Incentives• Loans or land grants• Tax breaks
Innovations• New breeds• New practices• Clearing technology
New infrastructure• Water• Road/rail access to markets• Storage/handling
Agricultural Opportunity• Expansion into new lands• Secondary clearing of existing lands
National Carbon Accounting System Technical Report 5
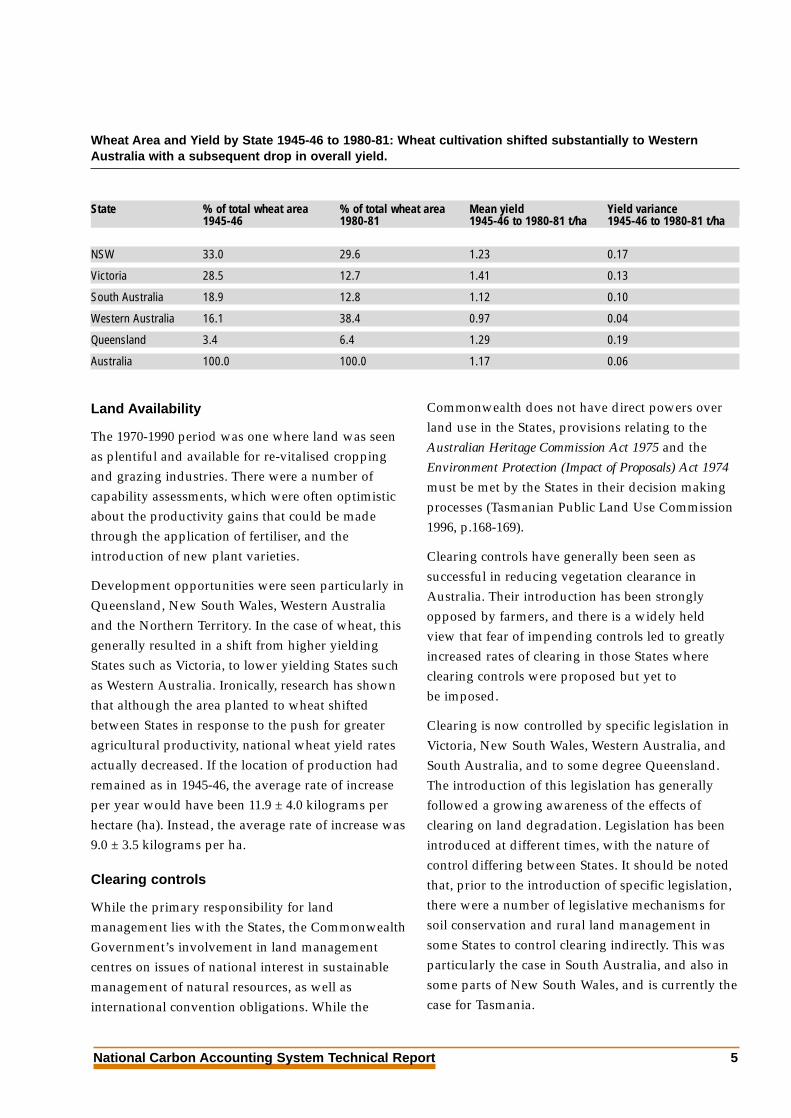
Land Availability
The 1970-1990 period was one where land was seenas plentiful and available for re-vitalised croppingand grazing industries. There were a number ofcapability assessments, which were often optimisticabout the productivity gains that could be madethrough the application of fertiliser, and theintroduction of new plant varieties.
Development opportunities were seen particularly inQueensland, New South Wales, Western Australiaand the Northern Territory. In the case of wheat, thisgenerally resulted in a shift from higher yieldingStates such as Victoria, to lower yielding States suchas Western Australia. Ironically, research has shownthat although the area planted to wheat shiftedbetween States in response to the push for greateragricultural productivity, national wheat yield ratesactually decreased. If the location of production hadremained as in 1945-46, the average rate of increaseper year would have been 11.9 ± 4.0 kilograms perhectare (ha). Instead, the average rate of increase was9.0 ± 3.5 kilograms per ha.
Clearing controls
While the primary responsibility for landmanagement lies with the States, the CommonwealthGovernment’s involvement in land managementcentres on issues of national interest in sustainablemanagement of natural resources, as well asinternational convention obligations. While the
Commonwealth does not have direct powers overland use in the States, provisions relating to theAustralian Heritage Commission Act 1975 and theEnvironment Protection (Impact of Proposals) Act 1974
must be met by the States in their decision makingprocesses (Tasmanian Public Land Use Commission1996, p.168-169).
Clearing controls have generally been seen assuccessful in reducing vegetation clearance inAustralia. Their introduction has been stronglyopposed by farmers, and there is a widely heldview that fear of impending controls led to greatlyincreased rates of clearing in those States whereclearing controls were proposed but yet tobe imposed.
Clearing is now controlled by specific legislation inVictoria, New South Wales, Western Australia, andSouth Australia, and to some degree Queensland.The introduction of this legislation has generallyfollowed a growing awareness of the effects ofclearing on land degradation. Legislation has beenintroduced at different times, with the nature ofcontrol differing between States. It should be notedthat, prior to the introduction of specific legislation,there were a number of legislative mechanisms forsoil conservation and rural land management insome States to control clearing indirectly. This wasparticularly the case in South Australia, and also insome parts of New South Wales, and is currently thecase for Tasmania.
Wheat Area and Yield by State 1945-46 to 1980-81: Wheat cultivation shifted substantially to WesternAustralia with a subsequent drop in overall yield.
State % of total wheat area % of total wheat area Mean yield Yield variance 1945-46 1980-81 1945-46 to 1980-81 t/ha 1945-46 to 1980-81 t/ha
NSW 33.0 29.6 1.23 0.17
Victoria 28.5 12.7 1.41 0.13
South Australia 18.9 12.8 1.12 0.10
Western Australia 16.1 38.4 0.97 0.04
Queensland 3.4 6.4 1.29 0.19
Australia 100.0 100.0 1.17 0.06

Australian Greenhouse Office6
Financial and Institutional Incentives
There were a range of incentives for agriculturalland development provided by Commonwealth andState Governments, in the form of low-cost finance,tax concessions or cheap land. These incentivestipped the economic balance in favour of clearing, toboth increase production and to improve landvalues. In many cases this resulted in thesubdivision of existing holdings into smallerfarming units, which came under increasingfinancial pressure as terms of trade declined. Insome areas, corporate farming was encouraged, andsmaller units were combined to provide economiesof scale.
The Rural Credits Development Fund
The Rural Credits Development Fund (RCDF) wasestablished by the Commonwealth Government in1925 under the Rural Credits Bill. The Fund wasdesigned to provide a pool of money to be accessedby a range of rural organisations upon application.Initially, there did not appear to be any consistencyabout the manner in which funds were allocated.
Rather, the monies tended to be sought in times ofemergency by both private and public sectororganisations. The Fund provided a significantsource of investment for the rural sector and, inparticular, rural research and development, andworked to supplement Commonwealth, State, andindustry contributions.
The RCDF was abolished in 1987 as a result ofrecommendations made in a report of theCommittee of Inquiry into the Australian FinancialSystem. The Committee found that the RCDF was nolonger required to provide financial assistance to therural sector given Commonwealth Governmentfinancial constraints and the contribution beingmade to rural research and development throughother avenues.
Commonwealth Development Bank
The Commonwealth Development Bank (CDB) wasmentioned by a number of the people interviewed asplaying a part in facilitating land clearing.It was stated that the advent of the CDB marked thetime when landholders could obtain loans to
Clearing controls differ substantially between States both in nature and timing
State Relevant legislation Comments
Queensland Land Act 1962 and Land Act 1994 Permits not required for clearing of regrowth
New South Wales State Environmental Planning Policy no. 46 (SEPP 46) 1995
Native Vegetation Conservation Act 1997
Australian Capital Territory Nature Conservation Act 1980 and Land (Planning and Environment) Act 1991
Victoria Planning and Environment Act 1997and Planning and Environment Act 1998
Tasmania No direct legislation Some provisions under the Forest Practices Act 1985,the Land Use Planning and Approvals Act 1993,the National Parks and Wildlife Act 1970 and the Threatened Species Protection Act 1995
South Australia Native Vegetation Act 1985 and Native Vegetation Act 1991
Western Australia Soil and Land Conservation Act 1945 Further enforced since 1995 through the Conservation and Land Management Act 1984 and Environment Protection Act 1986
Northern Territory

National Carbon Accounting System Technical Report 7
undertake development works, including clearing,from financial institutions. It was also said thatother banks soon offered the same loans to preservebusiness and share in profit from agriculturaldevelopment.
The CDB was established on 14 January 1960 andwas designed to supplement the existing bankingsystem rather than compete with it. Offices wereestablished in each State and Territory capital city.The philosophy underpinning the DevelopmentBank was the:
“… opening-up in various parts of Australia of new
areas of leasehold land … the new settler … must have
greater equity than his counterpart of a few years ago
because the costs facing the settler today are greater and
yet his returns have not correspondingly increased …
the Development Bank by filling in the gap in the
sources of finance available, will help to encourage a
resurgence of this pioneering spirit and inspire men to
undertake bold new schemes which will not only benefit
them personally but the nation as a whole. (McDonald
1960)”
The CDB was only interested in providing ruralcredit and all fields of primary production wereconsidered (McDonald 1960). Three main purposesfor which CDB loans could be accessed were:
• to improve a primary producers standardof living;
• to re-distribute income within the primaryproducing community; and
• to increase a primary producers income –this included the important field ofexpenditure on items which improvedfarm productivity.
The CDB provided loans at low interest rates toprimary producers, as well as subsidised financialadvisory services to the rural community. Landclearing activities were seen as increasing the valueof the land and, hence, improving farm productivityand income.
The Income Tax Assessment Act
A wide variety of tax-based concessions wereavailable to farmers until the mid 1980s. Some ofthese concessions included five year incomeaveraging, the unlimited carry forward of losses, theprovision of machinery investment allowances andspecial (five year) depreciation rates for items ofplant and some structural improvements. Of specificrelevance to vegetation clearance, however, wassection 75(1)(b) that allowed a full deduction in theyear incurred for expenditure on
‘... the destruction and removal of timber, scrub or
undergrowth indigenous to the land.’
The increasing criticism engendered by Section 75(1)(b) led to a review by the Bureau of AgriculturalEconomics and, shortly afterwards, theCommonwealth Government passed an AmendingAct (165/1973) that significantly curtailed many ofthe concessions outlined above. Of special interestwas the amendment to Section 75(1)(b) that allowedclearance expenditure (and certain otherdevelopment costs) to be deducted only over aperiod of ten years (ten per cent per annum)(Harris 1976, p. 22-23).
Since 1983, there have been no income taxdeductions for the capital costs of clearing land.Instead, landholders are now able to secure taxdeductions by fencing off remnant stands ofvegetation and engaging in other landcaretype activities.
War settlement scheme
The War Service Land Settlement Scheme wasestablished under the Lands Settlement Agreement Act
1945 (Cwlth) and allowed for the CommonwealthGovernment to finance the development of areasconsidered suitable for the settlement of ex-servicemen. State Governments were responsible forthe local operation and general administration ofthe scheme.

Australian Greenhouse Office8
Operating in the post-war period, the Schemeimpacted on land clearing during the 1970 – 1990period, as it encouraged the subdivision of existingholdings into smaller blocks. These smaller ‘soldiersettlement blocks’ were often economically marginal,leading to land clearing on properties that wouldnot be economically viable without continuousdevelopment.
Specific budget allocations for Statedevelopment
There are many examples where the CommonwealthGovernment allocated funds to the States andTerritories for specific development schemes thateither directly or indirectly led to tree clearing.While the majority of these predate the period ofreview, they still exert an influence on land clearing.For example the allocation of $23 million toQueensland in 1963 towards the Brigalow LandDevelopment Scheme was part of the foundation ofa scheme that led to the one of the major andcontinuing clearing events in the State. Otherdevelopment schemes funded by theCommonwealth affecting land clearing include theQueensland Beef Roads (funded in the 1960s) anddams such as the Burdekin, Thompson andFairbairn Dams, also in Queensland.
Commonwealth export licenses
The advent of a market for woodchips in the early1970s provided an opportunity for forest clearing onprivate land, with the returns from timber forwoodchips assisting in the cost of converting forestto pasture. This was especially important inTasmania in the early 1970s, and alleviated the fulleffect of rural recession for many landholders.Although forestry as a land use is generally a stateresponsibility, the Commonwealth Governmentmust first approve the export licenses forforest products.
Agricultural support programs such asdrought relief and rural adjustment
The Commonwealth Government has provided fundsfor drought relief, distributed via the State and TerritoryGovernments to landholders to compensate fortransport costs for fodder and stock. While it is difficultto draw a direct relationship between such subsidiesand tree clearing, there is no doubt thatCommonwealth funding arrangements such as droughtrelief and discounted interest rates through the RuralAdjustment Scheme have helped keep landholders onsmall properties, with more marginal returns. It wasreported through interview for this study that RuralAdjustment Scheme loans were still being provided forland clearing in both the Mulga Lands and the DesertUplands bioregions in Queensland.
Land Taxes and Rating Systems
In high value land areas, rates and land taxes arelikely to be high. These are generally areas wheredevelopment pressures are high, for either urbandevelopment or high value agricultural commoditiessuch as vineyards or sugar cane. This provides anincentive to convert land into production, to offsetthe cost of high rates and taxes.
Agricultural Research and Development:
Government support for research aimed atimproving the productivity of Australia’s ruralindustries began in 1918 with the establishment ofthe Council for Scientific and Industrial Research,later to become the Commonwealth Scientific andIndustrial Research Organisation (CSIRO). Otherorganisations funded by the Commonwealth toconduct research in this area were universities, StateGovernment departments of agriculture and amixture of statutory and non-statutory industryschemes. For example, Rural Industry ResearchFunds were established in the 1950s, derived fromthe sale of commodities.
Early research and development focussed onimmediate short-term benefits. There was anabundance of land and international markets were

National Carbon Accounting System Technical Report 9
buoyant. Within such a climate, farmers andgovernment preferred research that provided quickfinancial returns rather than investing in less-certainlong-term research investigations.
Research gradually became fragmented and therelationship between industry and researchertenuous. The passage of the Rural Industries Research
Act 1985 (Cwlth) resulted in change, with thenumerous research committees that existed tomanage the rural industry development funds,merged into fourteen industry research councils. Theresearch councils were commodity based, with theNational Farmers Federation giving support to thenew structures and arguing that it improved theprospects for the conduct of research beneficialto farmers.
When the Primary Industries and Energy Research and
Development Act 1989 (Cwlth) was passed, theresearch councils were converted into the network ofcommodity based Rural Research and DevelopmentCorporations that exist today. The basis for thechange to a corporate structure was that Governmentwanted to work in partnership with industry tocreate profitable and sustainable agriculturalenterprises (Lovett 1997, p. 1-3).
The establishment of rural research and developmentinstitutions specifically focusing on increasingagricultural productivity led to the introduction ofnew agricultural management practices. Some of theresearch undertaken to improve agriculturalproductivity presented new opportunities in regionspreviously not considered viable for grazing orcropping enterprises. In so doing, this researchfacilitated land clearing activities. For example,research into soil deficiencies and the ways in whichsoil could be improved through the use of traceelements and fertilisers has been a major driver forfurther land clearing and conversion to agriculturalproduction. Closely associated with this research wasdetailed experimentation with pasture cultivarsbelieved to be suitable for application on traceelement deficient lands.
This type of investigation led to the selection of anumber of suitable strains and the sowing down ofnewly cleared trace deficient areas to mixedleguminous and grass pastures. As the research intotrace elements and fertilisers improved so did thedevelopment of specifications for farmers to use inparticular locations, with each State investing inresearch to develop sets of local specifications.
In combination with this research were the technicalimprovements of machinery available for clearanceand cultivation. World War II proved productive inthis respect, stimulating rapid development andrefinement of such heavy machinery as the crawler-tracked bulldozers, a machine well suited for cheapand rapid scrub clearance. At the same time heavydisc ploughs became widely available, combiningwith the bulldozers to provide a land utilisationtechnology suited to cheap and rapid vegetationclearance (Harris 1976, p. 20-21).
Rural research and development has been asignificant contributor to agricultural productivityin Australia over the twentieth century. Therelationship between research and its impact onland clearing activities, particularly in the postWorld War II era, has been noted with more recentdevelopments such as the introduction of newwheat varieties and more tolerant and robust cropscontinuing to influence land use. In general,however, the past decade has recognised theimportance of sustainable agricultural production,with research more focused on efficient and effectiveland use, rather than the opening up of new land foragricultural enterprises.
Market Forces
The profitability of Australian agriculture, with itsorientation towards export trade, remains closelylinked to price fluctuations in international markets.During the 1970s new markets developed for beef,wheat and cotton, and associated periods of highprices for many rural commodities. The influence ofcommodity prices on clearing varies. Clearing cantake place in times of boom, taking advantage of
Australian Greenhouse Office10
Australian farm incomes (in 2000-01 dollars)
0
2
4
6
8
10
12
14
16
18
1960
-61
1962
-63
1964
-65
1966
-67
1968
-69
1970
-71
1972
-73
1974
-75
1976
-77
1978
-79
1980
-81
1982
-83
1984
-85
1986
-87
1988
-89
1990
-91
1992
-93
1994
-95
1996
-97
1998
-99
2000
-01
$BIL
LION
0
50
100
150
200
250
Terms of trade (Index: 1996-97 = 100)
Net value of production
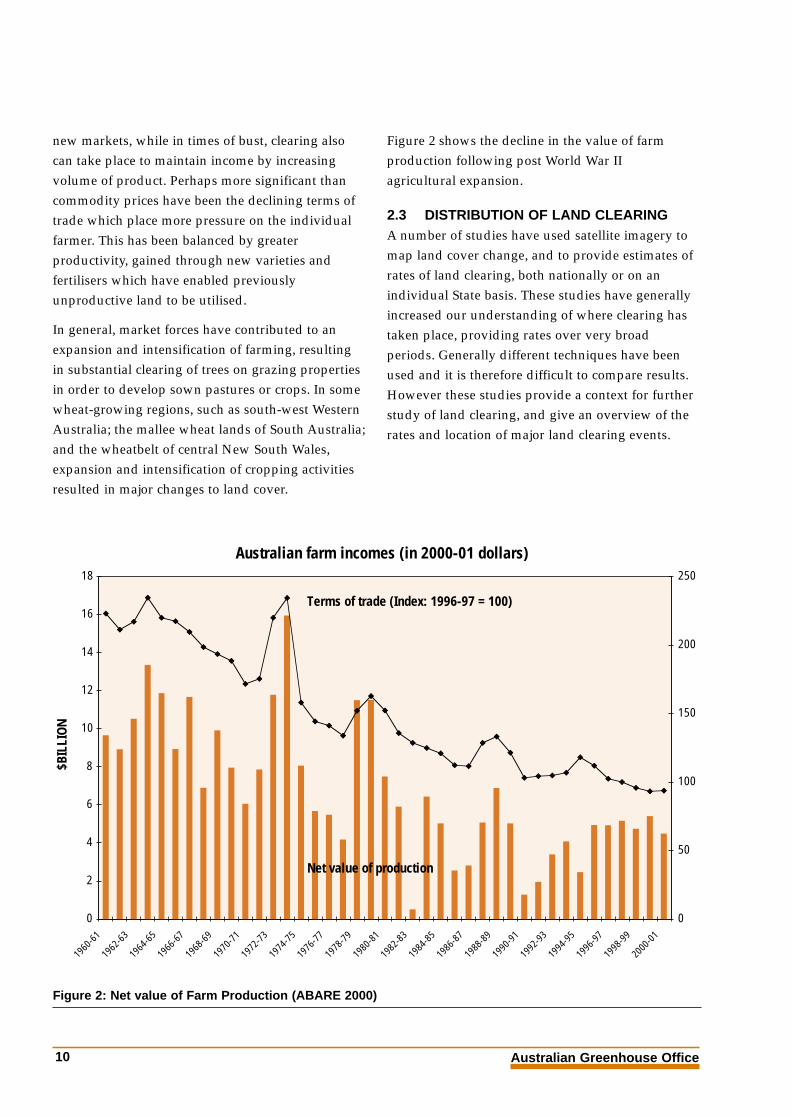
new markets, while in times of bust, clearing alsocan take place to maintain income by increasingvolume of product. Perhaps more significant thancommodity prices have been the declining terms oftrade which place more pressure on the individualfarmer. This has been balanced by greaterproductivity, gained through new varieties andfertilisers which have enabled previouslyunproductive land to be utilised.
In general, market forces have contributed to anexpansion and intensification of farming, resultingin substantial clearing of trees on grazing propertiesin order to develop sown pastures or crops. In somewheat-growing regions, such as south-west WesternAustralia; the mallee wheat lands of South Australia;and the wheatbelt of central New South Wales,expansion and intensification of cropping activitiesresulted in major changes to land cover.
Figure 2: Net value of Farm Production (ABARE 2000)
Figure 2 shows the decline in the value of farmproduction following post World War IIagricultural expansion.
2.3 DISTRIBUTION OF LAND CLEARINGA number of studies have used satellite imagery tomap land cover change, and to provide estimates ofrates of land clearing, both nationally or on anindividual State basis. These studies have generallyincreased our understanding of where clearing hastaken place, providing rates over very broadperiods. Generally different techniques have beenused and it is therefore difficult to compare results.However these studies provide a context for furtherstudy of land clearing, and give an overview of therates and location of major land clearing events.

National Carbon Accounting System Technical Report 11
Jurisdiction Time period Clearing rate (ha/yr) Data Source
Queensland 1980 – 1990 297,560 Graetz, EOC, unpub data
1991 – 1995 263,450 SLATS (QDNR 1997 & 1999)
New South Wales 1980 – 1990 52,230 Graetz, EOC, unpub data
1991 – 1995 16,400 ALCC (Barson 1999)
Australian Capital Territory 1980 – 1990 163 Graetz, EOC, unpub data
1991 – 1995 0 ALCC (Barson 1999)
Victoria 1972 – 1987 10,000 Woodgate & Black 1988
1980 – 1990 21,770 Graetz, EOC, unpub data
1990 – 1993 3,000 Gilbee unpub data
1991 – 1995 2,450 ALCC (Barson 1999)
Tasmania 1980 – 1990 2,410 Graetz, EOC, unpub data
1991 – 1995 940 ALCC (Barson 1999)
South Australia 1980 – 1990 28,800 Graetz, EOC, unpub data
1991 – 1995 1,370 ALCC (Barson 1999)
Western Australia 92,560 Graetz, EOC, unpub data
21,150 ALCC (Barson 1999)
Northern Territory 1980 – 1990 12,840 Graetz, EOC, unpub data
1991 – 1995 3,320 ALCC (Barson 1999)
The major studies undertaken to date are:
• Land Cover Change Analysis 1980-1990(Graetz, EOC, unpublished data). Changewas mapped nationally using Landsat MSSat 80 metre resolution. All clearing isincluded.
• Forest cover change in Victoria 1972-1987.Change was mapped for Victoria, usingLandsat MSS at 80 metre resolution. Coverloss due to fire and clearing for forestrypurposes are identified (Woodgate & Black1988).
• Land cover change in Queensland 1988-1992(SLATS, QDNR 1997 & 1999). Change wasmapped using Landsat TM at 30 metreresolution.
• Vegetation change in the NSW Wheatbelt(Sivertson, unpublished data). Change wasmapped in detail using aerial photographs.
• Agricultural Land Cover Change (ALCC)1991-1995 (Barson 1999). Change wasmapped nationally using Landsat TM at30 metre resolution.
Results of major land cover change analyses,providing clearing rates for each state and territoryare shown below. Results have been obtained usingdifferent techniques, and are therefore not directlycomparable.
Australian Greenhouse Office12
2.4 SELECT REFERENCES
ABARE 2000, Australian Commodities Statistics,ABARE, Canberra, ACT.
ABARE 1999, Commodities: Forecasts and Issues,
ABARE, Canberra, ACT.
ABARE 1997a, Australian Commodity Statistics,ABARE, Canberra, ACT.
ABARE 1997b, Outlook 97: Agriculture, ABARE,Canberra, ACT.
ABARE 1997c, Outlook 97: Commodity Markets and
Resource Management, ABARE, Canberra, ACT.
Barson, M. 1999, Remote Sensing of Agricultural Land
Cover Change 1990-1995 Results, Bureau of RuralSciences: Canberra.http://www.brs.gov.au/apnrb/landcov/alcc_results/
Binning, C. & Young, M. 1999, Conservation hindered:
The impact of local government rates and State land
taxes on the conservation of vegetation, Research
Report 3/99, Environment Australia & LWRRDC,Canberra, ACT.
Brennan. J. 1983, ‘Alternative Specifications for Risk in
the Supply of Wheat in the Victorian Mallee’, inAgricultural Economics Bulletin 3, Department ofAgriculture, NSW.
Brennan, J. & Spohr, L. 1985, ‘A Note on the Effects on
Yields of Shifts in the Australian Wheat Belt’, inAustralian Journal of Agricultural Economics,vol. 29, no. 3, pp. 235-243.
Cripps, E., Binning, C. & Young, M. 1999,Opportunity Denied: Review of the Legislative
Capability of Local Governments to Conserve
Vegetation, Research Report 2/99, EnvironmentAustralia & LWRRDC, Canberra, ACT.
Gilbee, A. (in press). Tree Cover Change in Victoria
c. 1869-1993: An Outline of Methods for Mapping and
Monitoring. Natural Resource Systems,Department of Natural Resources andEnvironment: Melbourne.
Graetz, D. (unpublished data). Earth Observation
Centre, CSIRO, Australia.
Harris, C. 1976, Vegetation Clearance in South
Australia, report of the Interdepartmental Committee
on Vegetation Clearance, South AustralianGovernment Printer, South Australia.
Intergovernmental Panel on Climate Change (IPCC)1996. Greenhouse Gas Inventory Reporting
Instructions, Revised 1996 IPCC Guidelines forNational Greenhouse Gas Inventories, Volumes 1-3.
Jenkins, S. 1998, Native Vegetation on Farms Survey
1996: A Survey of Attitudes to Native Vegetation and
Landcare in the Wheatbelt of Western Australia, for
Agriculture Western Australia and Department of
Conservation and Land Management, Research Report
3/98, Environment Australia & LWRRDC,Canberra, ACT.
Lovett, S. 1997, Revitalising Rural Research and
Development in Australia, Land & Water ResourcesResearch and Development Corporation,Canberra, ACT.
Lovett, S. 1996, A Corporate Conundrum: The Reform of
Australian Rural Research and Development,
PhD thesis, Australian National University,Canberra, ACT.
Mc Donald, W. 1960, ‘The role of the Development Bank
in rural credit’, in Australian AgriculturalEconomic Society, reprinted from the Journal ofAgricultural Economics, pp. 97-147.
Noble, I. 1999, Projections of land-use change and
associated CO2 emissions, Institute of AdvancedStudies, Australian National University,Canberra, ACT.
NSW Department of Land and Water Conservation1998, Guidelines for Clearing Vegetation under the
Native Vegetation Act 1997, Dept. of Land andWater Conservation, NSW.

National Carbon Accounting System Technical Report 13
Queensland Department of Natural Resources 1999.Land Cover Change in Queensland 1995-1997. Draft
only, the Statewide Landcover and Trees Study
(SLATS), Resource Sciences Centre, QueenslandDepartment of Natural Resources: Brisbane.Website address: www.dnr.qld.gov.au/slats.
Queensland Department of Natural Resources 1997.Interim Report October 1997: the Statewide Landcover
and Trees Study (SLATS), Resource Sciences Centre.Queensland Department of Natural Resources:Brisbane. Website address:www.dnr.qld.gov.au/slats.
Siverston, D. (unpublished). The State of Clearing in
NSW. Paper presented to Community Conservation
Strategies Remnant Vegetation for Park ManagersConference, Blackheath, NSW.
Slee, D. & Associates 1998, Remnant Native Vegetation
– Perceptions and Policies: a Review of Legislation and
Incentive Programs, for the South Australian Farmers
Federation, Victorian Farmers Federation and NSW
Farmers Association, National Research andDevelopment Program on Rehabilitation,Management and Conservation of RemnantVegetation, Research Report 2/98, EnvironmentAustralia & LWRRDC, Canberra, ACT.
State of the Environment Advisory Council 1996,State of the Environment, Dept. of EnvironmentSports and Territories, Canberra, ACT.
Tasmanian Public Land Use Commission 1996,Inquiry into Areas to be Reserved under the Tasmania-
Commonwealth Regional Forest Agreement, Tasmania.
Thackway, R. and Cresswell, I.D. (eds) 1995, An
Interim Biogeographic Regionalisation for Australia:
A Framework for Setting Priorities in the National
Reserves System Cooperative Program. AustralianNature Conservation Agency, Canberra, ACT.Version 4, 31 March 1995.
United Farmers & Stockowners of South AustraliaInc. 1985, Submission to the Select Committee of
Inquiry into Native Vegetation. South Australia.
Woodgate, P. & Black, P. 1988. Forest Cover Changes
in Victoria 1869-1987. Remote Sensing Group,Lands and Forest Division, Department ofConservation, Forests and Lands: Melbourne.

Australian Greenhouse Office14
3: QUEENSLAND
3.1 INTRODUCTIONQueensland (Qld) contains the largest remainingarea of forest and woodland in Australia. Thetropical climate is favourable to intensive croppingand improved pastures and the State’s economy isfirmly embedded in primary production. Significantclearing took place between 1970 and 1990, andcontinues to the present day. The great majority ofthis is undertaken either to expand areas underpasture or crops, through the removal of virginforest and woodland, or to maintain previouslycleared areas through the removal ofvigorous regrowth.
Tree clearing is monitored by the StatewideLandcover and Trees Study (SLATS)(e.g. QDNR1997 & 1999), which analyses satellite data forvegetation cover and cover change formanagement planning and greenhouse gasinventory purposes. The latest analysis indicates thatthe clearing rate for the period 1995-1997 was some340 000 ha/year accounting for approximately 80%of all clearing in Australia.
Figure 3: Clearing in Queensland has been motivated by agricultural profits, assisted by a combination ofenvironmental influences, incentive schemes and agricultural R&D.
Environmental and Social Influences• favourable climate• available land• vigorous regrowth• development culture
Economic Factors• land values• new markets• fluctuating commodity prices
Agricultural R&D, New Technologies• cattle, pasture and crop breeds• cleaning techniques• cropping techniques
Incentives• Brigalow scheme• finance• tax• infrastructure – water
Agricultural Profits• expand production• maintain profits• improve land value

National Carbon Accounting System Technical Report 15
Clearing has resulted from a range of interrelatedfactors, each motivated by the pursuit of economicprofit. The availability of cheap, undeveloped landwas a major driver for agricultural expansion,particularly in the beef industry. This was coupledwith new clearing techniques, and agriculturalresearch and development that both enhancedproductivity on existing holdings and enabledprofitable production on lands previously consideredunsuitable. As new markets opened up, commodityprices rose and provided incentive to clear to expandthe agricultural enterprise and increase profits.Equally, when prices of existing commodities fell,there was a further incentive to expand the area ofproductive land simply to maintain income.
The era has been marked by a culture ofdevelopment, and additional impetus came from theavailability of finance from banks and a number ofgovernment incentive programs, particularly theland development schemes. These schemes often ledto the subdivision of large, undeveloped propertiesinto smaller units with proven economic viabilityonce developed by clearing existing vegetation forproduction. Cleared land became an asset in itself,and clearing of regrowth was important tomaintaining that asset.
The most extensively cleared regions are theBrigalow Belt, Desert Uplands, Mulga Lands and theGidgee Lands. These have been developed largelyfor cattle, with some sheep and cotton production.The clearing occurred as a succession of waves thatbegan in the best of the brigalow country in the lasthalf of the 1950s and later moved into the lessproductive land. As new opportunities in thebrigalow diminished, interest turned to thecomparatively undeveloped Desert Uplands andsurrounding regions. By the 1980s and 1990s landclearing had extended to the Gidgee and Blackwoodregions adjacent to the Mitchell Grass Downs.
On the coast, land was cleared for sugar cane,horticulture and urban expansion. Clearing forirrigated cropping occurred around the Burdekin,St. George and Fairbairn Dams.
Figure 4: Areas of major clearing in Queensland.
GidgeeLandsGrasslands
Fairbairn Dam
Burdekin Dam
Brigalow
Desert Uplands
Mulga
3.2 MOTIVATORS FOR LAND CLEARANCE
Environmental and social influences
Qld contains large areas of woodland and forestwith further potential for development. It could besaid that the State is still in an expanding phase ofdevelopment. This is particularly so in lush coastalareas. The climate in many areas is also favourableto plant growth, making it well suited to high valuecrops. This has created increasing demand fordevelopment of the State for rural use and triggeredlarge-scale clearing.
To some, land is viewed as wasted unless it isdeveloped and, in this sense, clearing is often seenas progressive. For example, in the mid-1960s to 70sthere was a major effort to clear and makeproductive the light sandy soils of the coastalwallum lands of the southeast. The use of tropicalpastures, fertilizer and trace elements resulted insome initial success, although the project later faileddue to the high cost of inputs and the beef recession.

Australian Greenhouse Office16
In some areas of open forest and woodland, such asthose in the Desert Uplands and associated eucalyptlands, there has been evidence of an increase indensity of woody plants, often referred to as‘thickening’. This is thought to be a result of eitheror both livestock grazing and reduction in firefrequency (since Aboriginals used the land). Thisboth reduces plant competition and allowsregeneration of unpalatable woody plants to occur.This regrowth reduces stocking rates and thisbecomes a motivation for re-clearing.
Other environmental effects also have a bearing onthe rate of clearing. Because of the vigour ofregrowth, clearing of regeneration is estimated tomake up about 40% of the total clearing in Qldannually. For instance, in the ‘soft mulga’ areas ofsouthwestern Qld, dense regeneration occurs andmust be felled to maintain stocking rates. The fellingof mulga for fodder during drought is also a well-accepted practice.
Availability of land
The large amount of ‘undeveloped’ land withagricultural potential led to significantly cheaperproperty purchase in Qld than in the southernStates. This provided opportunities to both start afarming business and create a demand fromsuccessful landholders in New South Wales, Victoriaand South Australia. The main reasons for thedemand were that the availability of land offered:
• new challenges;
• opportunities for extension of farm area;and
• accommodation of expanding familyenterprises.
A further incentive was the potential value of theland. The value of a cleared property is substantiallyhigher than that of an undeveloped block. Clearingpermits attached to a block also increase value, inadvance of actual clearing. This was particularly sofor blocks acquired through government programssuch as the Brigalow Land Development Schemewhich are discussed later.
Clearing controls
Between 1970 and 1990, no comprehensivelegislation controlled native vegetation managementon all tenures in Qld. The Land Act 1994 and theBroadscale Tree Clearing Policy regulated treeclearing on leasehold tenures, and a range oflegislation applied to vegetation management inspecific situations on freehold tenures. Permits wererequired for clearing of native vegetation, but not forpreviously cleared vegetation. While clearingpermits were generally available, there were isolatedcases where impending controls may have increasedclearing. Early in 1999 the Qld Governmentendorsed the development of a native vegetationmanagement framework to apply consistently acrossall tenures.
Financial and institutional incentives
In the period 1970-1990, a variety of State andCommonwealth incentives and increased availabilityof finance facilitated land clearing. Otherencouragements included initiatives such as thesuperphosphate bounty and drought assistance.
Land development schemes
To encourage land development, a number of majoragriculture infrastructure projects, jointly funded bythe State and Commonwealth Governments, wereintroduced. Of these, the Brigalow LandDevelopment Scheme had the greatest impact. TheScheme commenced in 1962, continued until 1985,and covered some 11.1 million ha. A significant partof the area remained in the control of the existingsettlers, who were granted better land titles ascompensation for having some land resumed fromtheir existing leases. The Scheme provided about 250properties with successful applicants required toprove that they had the capacity to undertakedevelopment. To ensure that the land was broughtinto full production as soon as possible, the leaserequired that a proportion of each holding be clearedwithin a given time frame. Government plannersencouraged landowners to clear in large blocks to

National Carbon Accounting System Technical Report 17
make it easier to meet the clearing requirements.The Scheme was a notable success in developing thebrigalow lands for improved pastures and beefproduction and, later, for intensive cropping.
The clearing of the Brigalow would have taken placewithout the settlement scheme, but it would havetaken much longer. In addition, without the Scheme,it is likely that properties would have been fewer,larger and significantly more wealthy, and less of theland would have been cleared.
Developments such as the Brigalow Scheme and anearlier Soldier Settlement Scheme grew from thesubdivision of larger properties into smallerholdings. During the 1970s, declining terms of tradeon smaller properties meant that greaterproductivity was required from the same land area.This often led to further clearing as a way ofmaintaining or expanding production.
Finance
Between 1925 and 1987, loans for rural developmentwere available from the Rural Credits DevelopmentFund. The Commonwealth Development Bank wasestablished in 1960 and had great success with itsloans for development that included clearing. Thisencouraged other financial institutions to follow suit.Consequently, from the mid-1970s a wide range offinance for property expansion and developmentbecame available. This was further enabled by thederegulation of the financial market around thesame time. Tax concessions through depreciationwere also available for land development. Until 1973the full cost of clearing was deductible in the yearthat it was incurred.
Land rating systems
Land rates may also be an incentive to clear land insome instances. For example, Hinchinbrook Shirehas a system that rates highly land designated asgrowing sugar cane. If a landholder who runs cattledecides to grow sugar cane on part of the property,then the higher rate is applied to the entire holding.This becomes a disincentive to running cattle and
an incentive to allocate more of the property to thehigher value sugar cane, which usuallyentails clearing.
Innovations: new breeds, equipment andpractice
During the 1970s, a range of innovations wereintroduced to agriculture and actively promoted inthe rural community by a skilled and dedicatedgroup of extension officers employed by the StateGovernment. The application of trace elements andfertilisers and the development of new breeds andvarieties of livestock and crops allowed previouslyunproductive land to be developed. The availabilityof heavy machinery facilitated clearing of the land.
New cattle breeds
Although Brahman cattle had been in Australiasince early this century, it was not until the 1960sthat Brahman derived breeds such as SantaGertrudis, Braford and Brangus largely replaced thetraditional British breeds of mainly shorthorn andHereford. The widespread introduction of theseheat-tolerant and tick-resistant cattle contributed tothe success and expansion of the cattle industry, andthe increased profitability provided both funds andincentive for clearing.
New pasture and crop varieties
In the late 1970’s, two new pasture varieties, buffelgrass and stylo, were introduced and considerablyenhanced productivity. For example, with the use ofbuffel grass, grazing capacity in the Brigalow areaincreased up to six-fold. In addition, expansion ofbuffel grass was aided by aerial sowing, allowingmuch easier pasture establishment and enablingfarmers to reach higher stocking rates faster thanwith older sowing methods. New crop varietiesenabled the expansion of wheat, sugar and cottonfarming enterprises. This was accompanied byincreased clearing, funded by theincreased profitability.

Australian Greenhouse Office18
New machinery and techniques
Improved technology was developed for large-scaleclearing. This included innovations such as injectionwith poison (herbicide) and the use of a bladeplough for clearing regrowth. At the same time,large machinery (bulldozers) became availablethrough specialised contractors, who often tookadvantage of the high-quality second-handmachinery available at attractive prices from themining industry.
If several landholders shared in the cost of bringinga bulldozer contractor to the area, costs to theindividual were reduced and this prompted somefarmers to clear in advance of need. In some areas,the introduction of large harvesters and other largeequipment necessitated extra clearing toallow access.
Market forces: new markets, changingcommodity prices
Invariably, the decision of a private landholder toclear can be explained in economic terms and ismotivated by the potential for increased profits.Thus, market forces have an impact on rates ofclearance: increasing demand creates opportunitiesfor expansion of production, whereas fallingdemand causes shifts in land-use, both of which canincrease clearing. For example, the ‘beef crisis’ in theearly 1970s was presumed to decrease the need forland clearing. However, to support the transitionfrom beef to more profitable grain cropping, clearingmay have continued during this period.
In the 1970s and 1980s, new markets for Australianbeef were found in Japan and Korea. The Qld beefindustry was quick to respond by clearing moreland for production. Similarly, from the mid-80s,both the sugar and cotton markets expanded,leading to tree removal in particular areas, forexample, near Cunnamulla in the Mulga Lands.
High prices for wool often encouraged thesubdivision of large properties into smaller holdingsfor closer development. After the ‘wool boom’ of the
mid-70s to mid-80s, declining terms of trade and lowcommodity prices made it difficult for these smallholdings to remain viable. Consequently, furtherland clearing was seen as one way to maintainand/or expand production.
Terms of trade for pastoralists declined between1970 and 1990, but they increased for landholdersgrowing wheat and other grains and, in particular,cottons and horticultural crops, all enterprisesentailing clearing.
New infrastructure
The provision of infrastructure has opened up newareas to development and allowed improved accessto markets. For example, the government built ‘BeefRoads’ to transport cattle from isolated areas toabattoirs closer to the coast. This made clearingpossible and profitable in remote parts of the State.
Increasing urban development has suppliedinfrastructure such as markets, goods and services.This has supported rural development andassociated clearing of the wider surrounding area.
Large-scale mining developments, such as on theopen cut coalfields, have led to the establishment ofroads and services and this has often supportedother land development. In western Qld, there hasbeen some clearing associated new miningoperations on private grazing properties. However,the major impact has been on the surroundinglandscape, through the access provided byinfrastructure associated with the mines to new landfor development by clearing.
Extension of the cane rails that transport sugar canefrom the farm to the mill often leads to increasedclearing in the Wet Tropics. If a mill has a profitableyear and decides to reinvest in the local industry itmay expand the rail system into an entirely newarea. Access to the mill encourages landowners totake up cane quotas and increase clearing to plantcane. An increase in capacity of the mill has asimilar effect.

National Carbon Accounting System Technical Report 19
The supply of cheap, plentiful water for irrigation,offering a viable alternative to the irrigation areas ofNSW, has been a major drawcard to the developmentand clearing of rural Qld. It has also led to a shiftfrom low-intensity grazing to high-intensity cottongrowing in areas such as the Mulga Lands. Closer tothe coast, construction of the Fairbairn and BurdekinDams provided the infrastructure to support thedevelopment of large cotton and horticulturalproduction areas, which have necessitated someclearing. In some drier parts of the State, waterprovided by the sinking of bores may haveencouraged clearing for grazing.
Urban expansion
Over the last few decades, the entire South EastBioregion has been viewed as an area that couldaccommodate major urban expansion and provide asource of revenue for both local and StateGovernment. Regional planning encourageddevelopment. The Sunshine Coast was promoted asa major retirement area and attracted people andcapital from the southern States of New South Walesand Victoria.
Thus, since the 1960s, the area has experienced adevelopment boom. The mainland coastal belt hasbecome increasingly urbanised and land use in andaround Brisbane and the Gold Coast has shifted fromprimary production to residential settlement.Considerable clearing has accommodated thisurbanisation. For example, in the 15-year periodfrom 1974 a total of 33% of the remaining bushlandon the coastal southeast Qld mainland was cleared.
During the same period, on the fringes of the majorcities, rural residential developments proliferated.These small holdings often required clearing, usuallyon a small scale.
3.3 DISTRIBUTION OF LAND CLEARINGSignificant clearing occurred during the period1970–1995 and varied widely in scale betweenregions. Most clearing occurred in four centralbioregions – the Desert Uplands, Mulga Lands,Brigalow Belt North and Brigalow Belt South. There,leasehold land, which requires a permit for clearingnative vegetation, predominates. Clearing wasbroadscale and permits for areas less than 400 hawere rare. By contrast, land in the coastal bioregionsis predominantly freehold, which is not subject toclearing controls. The different title, smallerholdings and pressures such as urban developmentresult in more small area clearing eventson the coast.
Central Brigalow woodlands
This region has a semi arid climate with variable,summer-dominant rainfall, ranging from about480–700 mm. Droughts are frequent: the region istoo far north to receive reliable winter rain and toofar south for the monsoonal wet periods typical ofnorthern Australia. The eastern section of the regionis known as the Brigalow Belt, which supports openforest and woodland communities dominated byBrigalow Acacia harpophylla. This is characterised bycracking clay soils and flat alluvial plains that areideal for cultivation and irrigation (e.g. McCosker &Cox 1996, p. 1; Johnson 1984, p. 41; Lloyd 1984a, p.37). In the far west, Gidgee, Blackwood and opengrasslands predominate.
The predominant land use for the region is sheepand cattle grazing, interspersed with cropping ofcereal and cotton in the Brigalow Belt. The grazingcarrying capacity has been increased mainly throughland clearing and the introduction of non-nativegrass species. Nevertheless, with the exception ofthe Brigalow Belt, low fertility soils are a limitingfactor. Throughout the western region, tenure ismostly leasehold. Settlement schemes have resultedin small land holdings, which required clearing toincrease area and offset declining profitsfrom grazing.

Australian Greenhouse Office20
Summary of land clearing rates and causes in the major zones of activity, Qld, 1970-1990.
Zone
* following Thackway and Cresswell (1995)
Rate of clearing 1980-1990 (ha/yr)
Clearing patternBiogeographic regions(IBRA)*
Central Brigalowwoodlands
200,000–300,000 Mainly beef, with somewool and cottonproduction
Brigalow LandDevelopment Schemeprovided cheap land
Expansion into new landsPatch size: largeVegetation cleared:woodland and openforest
Brigalow Belt (North andSouth), Darling RiverinePlains, Desert Uplands,Mitchell Grass Downs,Mulga Lands, Nandewar
Coastal 100,000–200,000 Sugar cane production,urban expansion, andhorticulture
Expansion, particularlyaround Burdekin,Thompson and FairbairnDams, and urban fringedevelopment. Alsosecondary clearing ofexisting cane growingareas Patch size: smallVegetation cleared:mainly open forest, someclosed forest andwoodland
Central Mackay Coast,NSW North Coast, WetTropics, South Eastern
Northern <10,000 Patch size:
Vegetation cleared:mainly woodland
Cape York Peninsula,Einasleigh Uplands
Primary drivers

National Carbon Accounting System Technical Report 21
Both the North and South Brigalow Belt bioregionshave undergone extensive clearing since the early1960’s, greatly assisted by the Brigalow LandDevelopment Scheme (see earlier). The Brigalow Beltwas cleared from west of Emerald through to PineHill between 1965 and 1975, and to the edge of theDesert Uplands region from 1975 to 1985. Asavailable land in the better-soiled areas of theBrigalow diminished, the focus shifted to thecomparatively undeveloped Desert Uplands, whichwere extensively cleared from 1985. From there theclearing extended into the north-east corner of theMitchell Grass Downs, where the predominantlyGidgee and Boree A. tephrina slopes were heavilycleared between the 1980s and 1990s.
Steady clearing of the Mulga Lands, to manageregrowth and encourage native grasses, continuedthroughout the period. Felling of Mulga foliage fordrought fodder was also common practice.
The Brigalow and Desert Uplands are characterisedby large clearing events. Small area clearing is not afeature of the Mulga Lands either, however, somepermanent loss of small areas may have resultedfrom the cutting of Mulga for fodder.
Coastal zone
The Wet Tropics bioregion comprises wet coastalranges, lowland coastal rainforest and other forestsdominated by Melaleuca spp. On 9 December 1988,the Wet Tropics of Qld World Heritage Area wasinscribed by the World Heritage Committee on thelist of World Heritage properties and described as asite of exceptional beauty and scientific significance(Trott 1996, p. 2). Following the listing, industriessuch as logging and mining ceased with the WorldHeritage area. However, clearing associated withagriculture, particularly sugar cane, and urbandevelopment has continued in parts of the AthertonTableland and the coastal lowlands.
The South Eastern Qld bioregion is humid withEucalyptus-Lophostemon-Syncarpia tall, open forests,eucalyptus open forests and woodlands, rainforests
often with Araucarua cunninghamii emergents,M. quinquenervia wetlands and Banksia lowwoodlands and heaths.
There is a wide variety of land use, comprisingurban development for residential and tourismpurposes, horticulture, sugar cane farming, grazingand some plantation forests. In the southern part ofthe coastal strip, land uses include service industriesand manufacturing. In the 1960s, approximately onemillion people lived in the Moreton and Brisbaneareas. Since then, along the mainland coastal beltaround Brisbane and the Gold Coast, land use hasshifted from primary production toresidential settlement.
Because of the interest in biodiversity conservationin the Wet Tropics there have been a number ofstudies examining vegetation change in differentareas. This data shows that in some areas within theWet Tropics there has been revegetation, but in theagricultural areas and the coastal strip there hasbeen a steady decline in the remaining forest cover.
The removal of forest cover in the Wet Tropicsappears to be a gradual process rather thanepisodic. Johnson et al. (2000a & b) estimates that 40to 60% of lowland rainforest communities have beenlost since 1940 and that the clearing rate has fallenonly recently, due to the slowdown in the expansionof sugar cane farming.
In the South East bioregion, Catterall et al. (1996)reports that, during the 15 year period from 1974-1989, 39% of freehold bushland was cleared. Thisrepresents a rate of 3,312 ha per year.
Overall, individual clearing events in the coastalzone are small scale, but their cumulative impact issignificant.
Northern zone
The North West bioregion is in the dry tropics. Since1980, Gidgee scrubs in the southern areas of theGulf Plains bioregion have been cleared for grazingat a rate of about 1,000-3,000 ha per year.

Australian Greenhouse Office22
3.4 SELECT REFERENCES
Australian Surveying and Land Information Group(AUSLIG) 1990. Atlas of Australian Resources:
Vegetation, Third Series, vol. 6. AGPS: Canberra.
Burrows, W.H., Anderson, E.R. Back, P.C. &Hoffman, M.B. 1998. Regrowth and woody plant
thickening/invasion impacts on the land use change
and forestry inventory. Paper prepared for IPCCWorkshop on Biomass Burning, Land-Use Changeand Forestry, Rockhampton, September, 1997.
Catterall, C.P. & Kingston, M. 1993. Remnant
Bushland of South East Queensland in the 1990’s: its
Distribution, Loss, Ecological Consequences, and
Future Prospects. Institute of AppliedEnvironmental Research, Griffith University &Brisbane City Council: Brisbane.
Catterall, C.P., Storey, R. & Kingston, M. 1996.Assessment and Analysis of Deforestation Patterns in
the SEQ2001 Area 1820-1987-1994: Final Report.
Prepared for South East Queensland RegionalOrganisation of Councils (SEQROC), Faculty ofEnvironmental Sciences,Griffith University: Brisbane.
Gasteen, W.J. 1987. The brigalow lands of eastern
Australia: Agricultural impact and landuse potential
verses biological representation and stability. In: TheRainforest Legacy, Australian National RainforestsStudy, Volume 1, Special Australian HeritagePublication Series No. 7(1). AustralianGovernment Publishing Service:Canberra. pp.143-52.
Government of Queensland (GOQ). 1990. State of the
Environment in Queensland 1990. Department ofEnvironment and Heritage: Brisbane.
Graetz, D. (unpublished data). Earth ObservationCentre, CSIRO, Australia.
Graetz, D., Fisher, R. & Wilson, M. 1992. Looking
Back: The Changing Face of the Australian Continent,
1972-1992. CSIRO Office of Space Science &Applications: Canberra.
Johnson, A.K.L., Ebert, S.P. & Murray, A.E. 2000a.Land cover change and its environmental significance
in the Herbert River Catchment, North-east
Queensland. Australian Geographer, 31:75 – 86.
Johnson, A.K.L., Bramley, R.G.V. & Roth, C.H. 2000b.Landcover and water quality in river catchments of the
Great Barrier Reef Marine Park. In OceanographicProcesses of Coral Reefs: Physical and BiologicalOceanographic processes of the Great BarrierReef. CRC Press LLC, 19-36.
Johnson, R.W. 1984. Flora and Vegetation of the
Brigalow Belt. In: A. Bailey (ed.), The Brigalow Beltof Australia. Royal Society of Queensland:Brisbane.
Lloyd, P.L. 1984a. The Climatic Environment of the
Brigalow Belt of Queensland. In: A. Bailey (ed.),The Brigalow Belt of Australia. Royal Society ofQueensland: Brisbane.
Lloyd, P.L. 1984b. Agricultural and Pastoral Land Use
in the Brigalow Belt of Queensland. In: A. Bailey(ed.), The Brigalow Belt of Australia. RoyalSociety of Queensland: Brisbane, pp. 81-96.
McCosker, J.C. & Cox, M.J. 1996. Brigalow Bioregional
Conservation Strategy: Unpublished Final Report to
ANCA, Queensland Department of Environment:Brisbane.
Morgan, G., Lorimer, M., Perry, T. & Kemp, J. 1997.The Desert Uplands Bioregional Conservation
Strategy. Department of Environment: Townsville.
Mulga Land Use Advisory Group 1992. Mulga
Region Position Paper: A Study of the Inter-
dependence of the Environment, Pastoral Production
and the Economy. Department of Lands: Brisbane.
Nix, H. 1994. The Brigalow. In: S. Dovers (ed.),Australian Environmental History: Essays andCases. Oxford University Press: Melbourne.

National Carbon Accounting System Technical Report 23
Queensland Department of Environment andHeritage 1995. Environmental Considerations
Associated with Tree Clearing on Leasehold and other
Crown Lands in Queensland. Department ofEnvironment and Heritage: Brisbane.
Queensland Department of Natural Resources 1999.Land Cover Change in Queensland 1995-1997. Draft
only, the Statewide Landcover and Trees Study
(SLATS), Resource Sciences Centre, QueenslandDepartment of Natural Resources: Brisbane.Website address: www.dnr.qld.gov.au/slats.
Queensland Department of Natural Resources 1998.DNR Land Facts: The Desert Uplands. Produced by
Land Planning and Management and available on
Resource Net, the Department of Natural Resourcesweb site at: http://www.dnr.qld.gov.au.
Queensland Department of Natural Resources 1997.Interim Report October 1997: the Statewide Landcover
and Trees Study (SLATS), Resource Sciences Centre.
Queensland Department of Natural Resources:Brisbane. Website address:www.dnr.qld.gov.au/slats.
Queensland Department of Natural Resources(unpublished). A Summary of the Local Tree Clearing
Guidelines for Leasehold Land: Alpha-Southern Desert
Uplands, Jerrico Shire and parts of Blackall, Barcaldine,
Aramac and Bellyando. Developed by a workinggroup representing agencies, organisations andinterests.
Smith, D. 1994. An assessment of the extent of clearing
in south-central Queensland, using time and cost
effective methods. ACLEP Newsletter. March, pp.3-5.
Smith, D.M., Shields, P.G. & Danaher, T.J. 1994. An
assessment of the extent of clearing in south-central
Queensland. Land Resources Bulletin. QueenslandDepartment of Primary Industries: Brisbane.
Thackway, R. and Cresswell, I.D. (eds) 1995, An
Interim Biogeographic Regionalisation for Australia: A
Framework for Setting Priorities in the National
Reserves System Cooperative Program. AustralianNature Conservation Agency, Canberra, ACT.Version 4, 31 March 1995.
Trott, L. & Goosem, S. 1996. Wet Tropics in Profile:
a Reference Guide to the Wet Tropics of Queensland
World Heritage Area. Wet Tropics ManagementAuthority: Cairns.
Winter, J.W., Bell, F.C, Pahl, L.I. & Atherton, R.G.1987. Rainforest clearfelling in Northeastern
Australia. Proceedings of the Royal Society ofQueensland 98: 41-57.
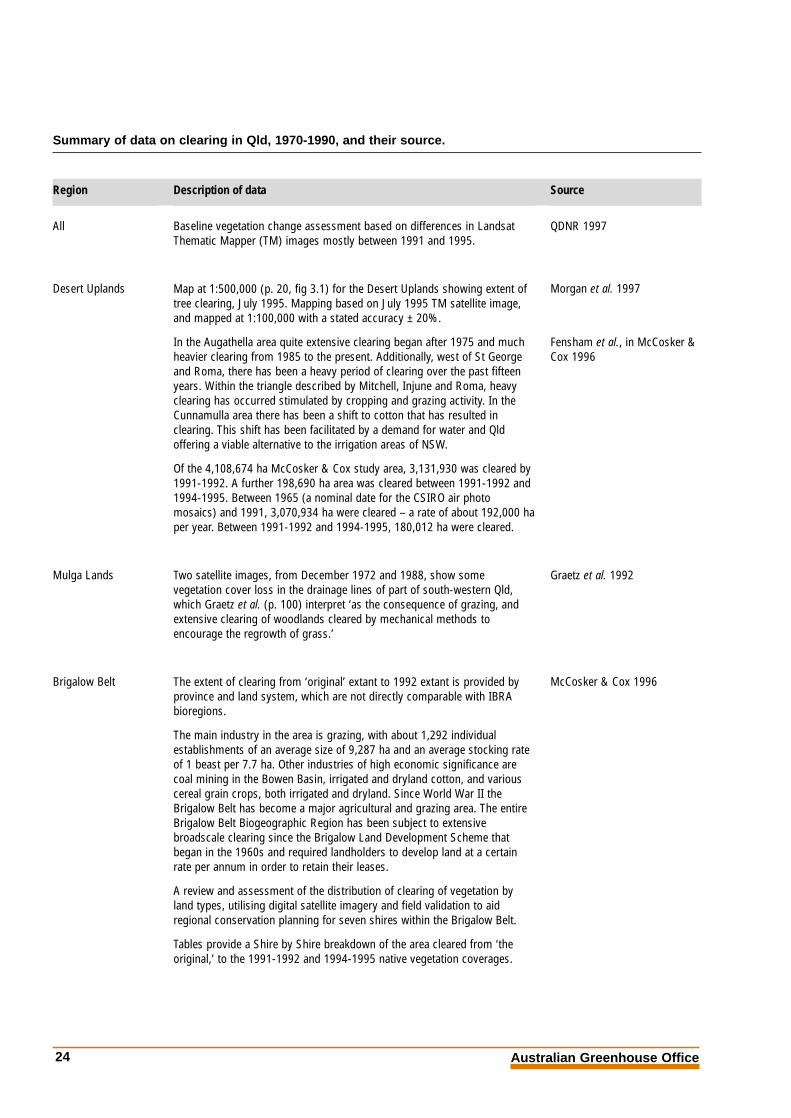
Australian Greenhouse Office24
Region
All
Description of data
Baseline vegetation change assessment based on differences in LandsatThematic Mapper (TM) images mostly between 1991 and 1995.
Map at 1:500,000 (p. 20, fig 3.1) for the Desert Uplands showing extent oftree clearing, July 1995. Mapping based on July 1995 TM satellite image,and mapped at 1:100,000 with a stated accuracy ± 20%.
In the Augathella area quite extensive clearing began after 1975 and muchheavier clearing from 1985 to the present. Additionally, west of St Georgeand Roma, there has been a heavy period of clearing over the past fifteenyears. Within the triangle described by Mitchell, Injune and Roma, heavyclearing has occurred stimulated by cropping and grazing activity. In theCunnamulla area there has been a shift to cotton that has resulted inclearing. This shift has been facilitated by a demand for water and Qldoffering a viable alternative to the irrigation areas of NSW.
Of the 4,108,674 ha McCosker & Cox study area, 3,131,930 was cleared by1991-1992. A further 198,690 ha area was cleared between 1991-1992 and1994-1995. Between 1965 (a nominal date for the CSIRO air photomosaics) and 1991, 3,070,934 ha were cleared – a rate of about 192,000 haper year. Between 1991-1992 and 1994-1995, 180,012 ha were cleared.
Two satellite images, from December 1972 and 1988, show somevegetation cover loss in the drainage lines of part of south-western Qld,which Graetz et al. (p. 100) interpret ‘as the consequence of grazing, andextensive clearing of woodlands cleared by mechanical methods toencourage the regrowth of grass.’
The extent of clearing from ‘original’ extant to 1992 extant is provided byprovince and land system, which are not directly comparable with IBRAbioregions.
The main industry in the area is grazing, with about 1,292 individualestablishments of an average size of 9,287 ha and an average stocking rateof 1 beast per 7.7 ha. Other industries of high economic significance arecoal mining in the Bowen Basin, irrigated and dryland cotton, and variouscereal grain crops, both irrigated and dryland. Since World War II theBrigalow Belt has become a major agricultural and grazing area. The entireBrigalow Belt Biogeographic Region has been subject to extensivebroadscale clearing since the Brigalow Land Development Scheme thatbegan in the 1960s and required landholders to develop land at a certainrate per annum in order to retain their leases.
A review and assessment of the distribution of clearing of vegetation byland types, utilising digital satellite imagery and field validation to aidregional conservation planning for seven shires within the Brigalow Belt.
Tables provide a Shire by Shire breakdown of the area cleared from ‘theoriginal,’ to the 1991-1992 and 1994-1995 native vegetation coverages.
Source
QDNR 1997
Summary of data on clearing in Qld, 1970-1990, and their source.
Desert Uplands
Mulga Lands
Brigalow Belt
Morgan et al. 1997
Fensham et al., in McCosker &Cox 1996
Graetz et al. 1992
McCosker & Cox 1996

National Carbon Accounting System Technical Report 25
Region
Brigalow Belt cont.
Description of data
Collated tree clearing permit data attests that since 1986, 846,109 ha ofnative vegetation and 586,542 ha of regrowth have been approved forclearing. Permits issued for 1994 identify 178,795 ha of native vegetationand 239,131 ha of regrowth.
‘Eight 1991-1992 landsat images were rectified to the AMG zone theycovered (either 55 or 56) using control points taken from 1:100,000topographic maps. ARC/INFO was used to digitise the coverage. The imageswere displayed in standard NIR false colour composites (bands 3, 4 and 7).Using both digital and hardcopy satellite imagery; the whole study area wasdigitised into six disturbance categories…’ (p. 1).
The percentage of remaining natural vegetation occurring in each Shire inthe Brigalow belt by 1995 is given as:
Emerald– 52.8% with 4.5% (41,860 ha) cleared between 1991-1992 and 1994-95;
Peak Downs – 52.8% with 2.5% (21,940 ha) cleared between 1991-92 and 1994-95;
Broadsound – 36% with 3.9% (50,345 ha) cleared between 1991-92 and 1994-9;
Belyando – 49% with 4% (117,494 ha) cleared between 1991-92 and 1994-95;
Jericho – 63% with 7% (134,886 ha) cleared between 1991-92 and 1994-95;
Bauhinia – 57% with 3% (27,366 ha) cleared between 1991-92 and 1994-95 [this data is identified as incomplete];
Duaringa – 41% with 2% (10,951 ha) cleared between 1991-92 and 1994-95 [this data is identified as incomplete].
It is also noted that recent clearing has been most extensive in Belyandoand Jericho Shires.
A comparison of two images of the Clermont area, in August 1972 andAugust 1991. The images show clearing from mining activities, andalthough not large in area, they are discernable. An estimated ‘15% of thescene has lost landcover. By eyeballing the early and late images, you caninterpret these landcover changes as resulting from clearing of woodland.Some of this clearing has been on land of substantial slope’ (p. 154).
The north-east corner of this bioregion experienced heavy clearing of theslopes between the 1980s and 1990s, predominantly Gidgee and Boree.This clearing is believed to be associated with an extension of clearing fromthe Desert Uplands.
Graetz et al. 1992
Source
Mitchell Grass Downs Interviews
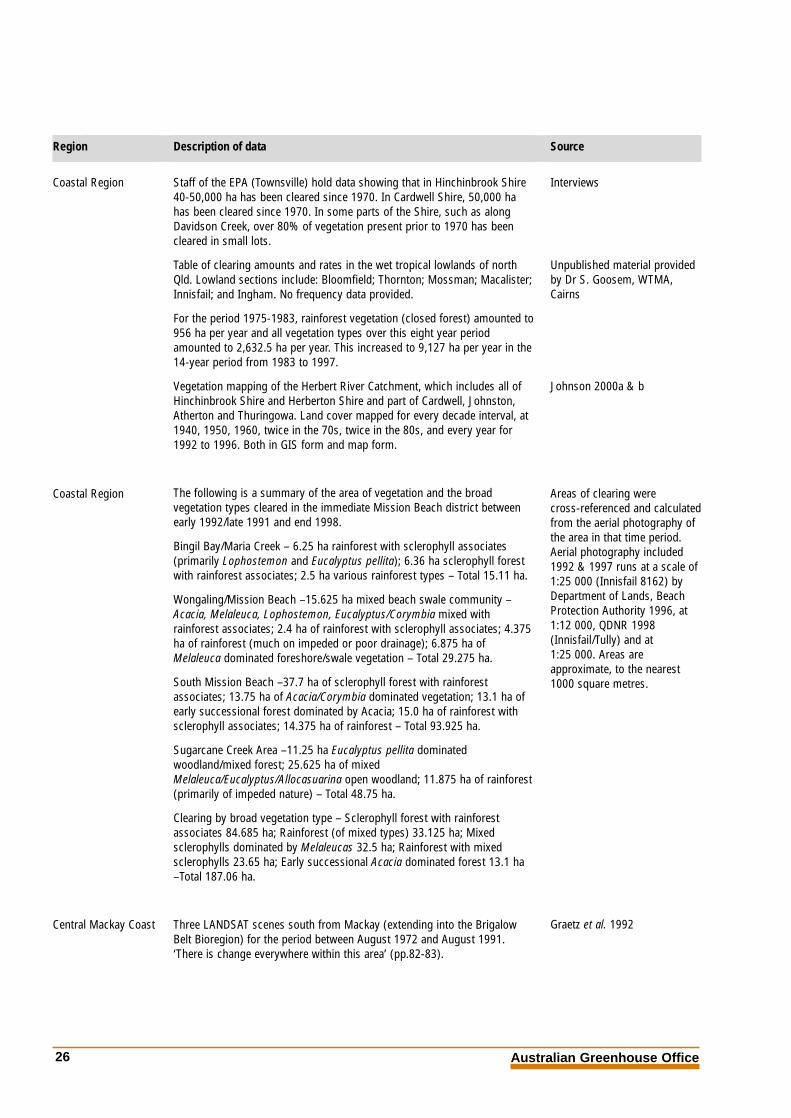
Australian Greenhouse Office26
Description of data
Staff of the EPA (Townsville) hold data showing that in Hinchinbrook Shire40-50,000 ha has been cleared since 1970. In Cardwell Shire, 50,000 hahas been cleared since 1970. In some parts of the Shire, such as alongDavidson Creek, over 80% of vegetation present prior to 1970 has beencleared in small lots.
Table of clearing amounts and rates in the wet tropical lowlands of northQld. Lowland sections include: Bloomfield; Thornton; Mossman; Macalister;Innisfail; and Ingham. No frequency data provided.
For the period 1975-1983, rainforest vegetation (closed forest) amounted to956 ha per year and all vegetation types over this eight year periodamounted to 2,632.5 ha per year. This increased to 9,127 ha per year in the14-year period from 1983 to 1997.
Vegetation mapping of the Herbert River Catchment, which includes all ofHinchinbrook Shire and Herberton Shire and part of Cardwell, Johnston,Atherton and Thuringowa. Land cover mapped for every decade interval, at1940, 1950, 1960, twice in the 70s, twice in the 80s, and every year for1992 to 1996. Both in GIS form and map form.
The following is a summary of the area of vegetation and the broadvegetation types cleared in the immediate Mission Beach district betweenearly 1992/late 1991 and end 1998.
Bingil Bay/Maria Creek – 6.25 ha rainforest with sclerophyll associates(primarily Lophostemon and Eucalyptus pellita); 6.36 ha sclerophyll forestwith rainforest associates; 2.5 ha various rainforest types – Total 15.11 ha.
Wongaling/Mission Beach –15.625 ha mixed beach swale community –Acacia, Melaleuca, Lophostemon, Eucalyptus/Corymbia mixed withrainforest associates; 2.4 ha of rainforest with sclerophyll associates; 4.375ha of rainforest (much on impeded or poor drainage); 6.875 ha ofMelaleuca dominated foreshore/swale vegetation – Total 29.275 ha.
South Mission Beach –37.7 ha of sclerophyll forest with rainforestassociates; 13.75 ha of Acacia/Corymbia dominated vegetation; 13.1 ha ofearly successional forest dominated by Acacia; 15.0 ha of rainforest withsclerophyll associates; 14.375 ha of rainforest – Total 93.925 ha.
Sugarcane Creek Area –11.25 ha Eucalyptus pellita dominatedwoodland/mixed forest; 25.625 ha of mixedMelaleuca/Eucalyptus/Allocasuarina open woodland; 11.875 ha of rainforest(primarily of impeded nature) – Total 48.75 ha.
Clearing by broad vegetation type – Sclerophyll forest with rainforestassociates 84.685 ha; Rainforest (of mixed types) 33.125 ha; Mixedsclerophylls dominated by Melaleucas 32.5 ha; Rainforest with mixedsclerophylls 23.65 ha; Early successional Acacia dominated forest 13.1 ha–Total 187.06 ha.
Three LANDSAT scenes south from Mackay (extending into the BrigalowBelt Bioregion) for the period between August 1972 and August 1991.‘There is change everywhere within this area’ (pp.82-83).
Areas of clearing were cross-referenced and calculatedfrom the aerial photography ofthe area in that time period.Aerial photography included1992 & 1997 runs at a scale of1:25 000 (Innisfail 8162) byDepartment of Lands, BeachProtection Authority 1996, at1:12 000, QDNR 1998(Innisfail/Tully) and at1:25 000. Areas areapproximate, to the nearest1000 square metres.
Central Mackay Coast
Coastal Region Source
Interviews
Unpublished material providedby Dr S. Goosem, WTMA,Cairns
Johnson 2000a & b
Region
Coastal Region
Coastal Region
Graetz et al. 1992
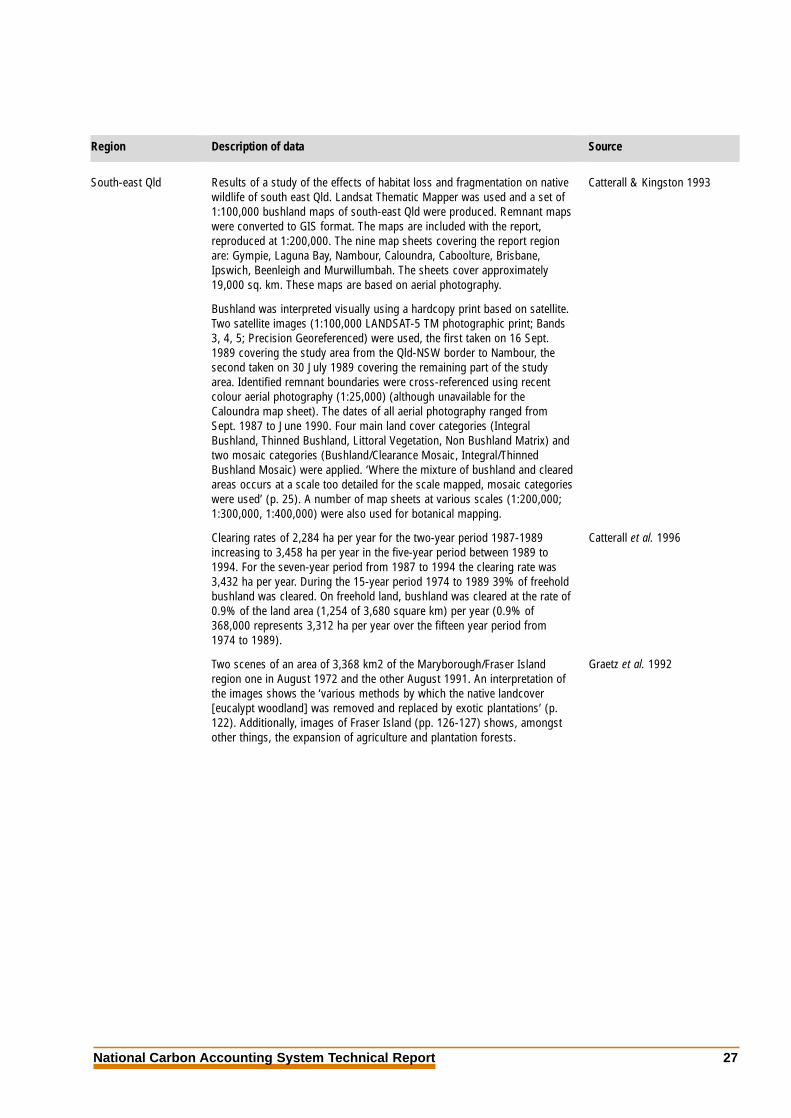
National Carbon Accounting System Technical Report 27
Region
South-east Qld
Description of data
Results of a study of the effects of habitat loss and fragmentation on nativewildlife of south east Qld. Landsat Thematic Mapper was used and a set of1:100,000 bushland maps of south-east Qld were produced. Remnant mapswere converted to GIS format. The maps are included with the report,reproduced at 1:200,000. The nine map sheets covering the report regionare: Gympie, Laguna Bay, Nambour, Caloundra, Caboolture, Brisbane,Ipswich, Beenleigh and Murwillumbah. The sheets cover approximately19,000 sq. km. These maps are based on aerial photography.
Bushland was interpreted visually using a hardcopy print based on satellite.Two satellite images (1:100,000 LANDSAT-5 TM photographic print; Bands3, 4, 5; Precision Georeferenced) were used, the first taken on 16 Sept.1989 covering the study area from the Qld-NSW border to Nambour, thesecond taken on 30 July 1989 covering the remaining part of the studyarea. Identified remnant boundaries were cross-referenced using recentcolour aerial photography (1:25,000) (although unavailable for theCaloundra map sheet). The dates of all aerial photography ranged fromSept. 1987 to June 1990. Four main land cover categories (IntegralBushland, Thinned Bushland, Littoral Vegetation, Non Bushland Matrix) andtwo mosaic categories (Bushland/Clearance Mosaic, Integral/ThinnedBushland Mosaic) were applied. ‘Where the mixture of bushland and clearedareas occurs at a scale too detailed for the scale mapped, mosaic categorieswere used’ (p. 25). A number of map sheets at various scales (1:200,000;1:300,000, 1:400,000) were also used for botanical mapping.
Clearing rates of 2,284 ha per year for the two-year period 1987-1989increasing to 3,458 ha per year in the five-year period between 1989 to1994. For the seven-year period from 1987 to 1994 the clearing rate was3,432 ha per year. During the 15-year period 1974 to 1989 39% of freeholdbushland was cleared. On freehold land, bushland was cleared at the rate of0.9% of the land area (1,254 of 3,680 square km) per year (0.9% of368,000 represents 3,312 ha per year over the fifteen year period from1974 to 1989).
Two scenes of an area of 3,368 km2 of the Maryborough/Fraser Islandregion one in August 1972 and the other August 1991. An interpretation ofthe images shows the ‘various methods by which the native landcover[eucalypt woodland] was removed and replaced by exotic plantations’ (p.122). Additionally, images of Fraser Island (pp. 126-127) shows, amongstother things, the expansion of agriculture and plantation forests.
Source
Catterall & Kingston 1993
Catterall et al. 1996
Graetz et al. 1992

4: NEW SOUTH WALES
4.1 INTRODUCTIONAs the first colony and the centre of colonialexpansion, New South Wales (NSW) experienced amajor impetus of land clearing about 200 years ago.Benson (1991) reports that by the 1920s woodlandand forest across more than 40% of the State hadbeen ringbarked and partially removed foragriculture. Today, much of the former forest andwoodland has been totally cleared or converted toopen woodland. Clearing has been most extensive inparts of the State that contain better soils on flat orundulating land, such as the major river valleys andcoastal plains. Other centres of clearing are thetablelands and the wheatbelt.
Some vegetation clearance to expand agriculturalland continues in NSW, mainly along the relativelyuncleared margins of the wheatbelt. Elsewhere, treeremoval is less extensive but widespread, mainlyaffecting remnant vegetation on existing holdings inthe wheatbelt, irrigation areas, northern tablelandsand along the coastal fringe.
The major driver for land clearing between 1970 and1990 was a change in agricultural focus from grazingto cropping. Profits from grazing were declining,while markets for cotton, wheat and rice wereincreasing. The development of new crop varietiesand availability of irrigation water allowed thesecrops to be grown on land that was previouslyunproductive. Clearing occurred on two fronts:firstly, to expand the agricultural zone into newareas and, secondly, to make more intensive use ofexisting areas.
Venture capital was available for the conversion ofgrazing land to cropping, often encouragingcorporate farming to achieve economies of scale. Theuse of harvesting machinery required areas to becleared uniformly, and expensive clearing machinerybecame available through the corporate enterprise.The availability of processing facilities, such aswheat silos and cotton gins, and associated road and
rail links provided the necessary supportinginfrastructure. The NSW Government furtherencouraged development through an active policy ofreleasing uncleared Crown Land for agriculturalpurposes, and also for urban expansion on theeastern seaboard.
From 1970-1990, the majority of clearing occurred inthe wheatbelt, for wheat and cotton cropping, and inthe Murray irrigation area, for rice cultivation.
4.2 MOTIVATORS FOR LAND CLEARANCE
Environmental and social influences
NSW contains much of the Murray-Darling Basinnetwork of rivers, some of the most productive landin Australia. The alluvial soils of the coastal valleysand plains are also highly productive. Situated justwest of the Great Dividing Range, the tablelandcountry, with temperate climate and relatively fertilesoil, is ideal for both grazing and cropping. Thetableland also contains a major water harvestingcatchment, which directs water to the west throughblack soil plains country that is ideally suited toirrigation for a variety of new and traditional crops.
The conversion of grazing land to cropping wasgreatly facilitated by the development of irrigationschemes that were in place well before the 1970s.Agricultural areas in NSW also have close accessto the highest population density in Australia, in theNewcastle, Sydney and Wollongong urban areas.These cities provide excellent port facilities, bulkgrain handling facilities and access toexport markets.
In the coastal zone, particularly in the north of theState, the temperate climate and relatively easyaccess to the larger metropolitan areas has attractedan increasing demand for rural residentialdevelopments, which entail clearing.
During the 1980s, general attitudes towards landmanagement began to change. New land becamescarce and farmers, faced with declining terms oftrade, needed to clear land to either expand ormaintain production. At the same time, there was a
Australian Greenhouse Office28

National Carbon Accounting System Technical Report 29
growing movement to conserve the land, whichfocussed on the dwindling remnants of nativewoodland and forest. This polarisation of attitudeseither encouraged or discouraged clearing,depending on the prevailing point of view.
Clearing controls
Specific clearing controls were introduced in NSW in1995, using the State Environment Protection Policy,and further cemented in 1996, with the Native
Vegetation Management Act. Other new legislation,such as the Threatened Species Act, introduced in 1995,require conservation assessments before clearing cantake place. Before these specific controls wereintroduced, there were a number of legislativeinstruments, such as the Soils Conservation Act, thePasture Protection Act and the Rural Lands Protection
Act, which could have been used to control clearing.
It is likely that fear of government interventionresulted in clearing action, particularly during thelate 80s. Arising from his work in the NSWwheatbelt, Sivertsen (1995b) reports significantlyincreased clearing in the wheatbelt subsequent to the1985-86 Moree Plains Regional Environmental Study.The Study suggested that clearing regulations mightbe imposed, with the increased rates of clearingobserved being a direct response to fear ofimpending controls.
Availability of land
During the 1970s the availability of cheap croplandin western NSW attracted a large number of wheatfarmers, including many from the Eyre Peninsula inSouth Australia. For a variety of reasons, includingland degradation and insufficient property size,cropping had become unprofitable on the Peninsulaand this triggered the migration.
Financial and institutional incentives
Between 1970 and 1990, the main government actionleading to clearing was a deliberate policy to releaseCrown Land and to facilitate conversion ofleasehold land, which was subject to a degree ofenvironmental control, to freehold land, whereclearing could occur at the discretion of thelandholder. The release of land was motivated by aneed to reduce government responsibility for theland, and was administered through theNSW Land Commission.
In addition, economies of scale meant that smallerholdings were amalgamated into larger corporatefarms, encouraging further development of existingcleared land.
Finance
From 1960, venture capital was available throughthe Commonwealth Development Bank, whichbegan providing low interest loans for landdevelopment to primary producers. Other bankssoon offered similar rural credit. Under thesearrangements clearing was seen as improving landvalue, farm productivity and income.
A variety of tax concessions were also available tofarmers. Until 1983 these included full deductibilityof the costs of removal of timber, scrub andundergrowth in the year incurred.
Land tenure
Land development was actively encouraged by theState Government’s Land Commission, which hada policy of releasing Crown Land for bothagricultural and urban purposes. Vacant CrownLands were a repository of natural vegetation,isolated by the clearing of freehold land aroundthem. There was a limited capacity withingovernment to manage these lands. Consequently,they were often leased out and either treated asfreehold or converted to freehold. Between 1965 and1980 in the Western Division, the area devoted todryland cropping increased tenfold, mainly throughthe release of Crown Land.
New machinery and techniques
Crop farming and new practices such as minimumtillage and the exploitation of heavy clay soils,required the use of large machinery. Equally, heavyequipment such as bulldozers, was required to clearremnants and other marginal lands. The rise ofcorporate farming increased the availability ofsuch equipment.
Improved off-river water distribution techniquesfacilitated the expansion of cotton enterprises.
Market forces: new markets, changingcommodity prices
The great majority of clearing in the period 1970-1990 took place with the expansion of cropping,particularly wheat and cotton. Markets for wooldeclined during the period from 1970-1990, whereascrop markets, particularly for wheat and cotton,expanded. Nevertheless, overall agricultural profitswere declining, leading to a consolidation ofresources, including corporate farming. Grazingland was converted into more intensively clearedcropland, resulting in the clearing of remnants.Both cropping and grazing expanded into newmarginal land, resulting in further clearing ofnatural vegetation.
The development of water harvesting techniques,off-river water storage, and modern pumps andirrigation equipment further facilitated theexpansion of dryland cotton farming, whichcontinues today.
New infrastructure
The existing road, rail and water infrastructure wasan ideal basis for the development of further specificinfrastructure to support the cotton and wheatindustries. Necessary handling facilities, such aswheat silos and cotton gins, were established, witheasy access to markets through road and rail. Theexisting water infrastructure was further utilised tosupport cotton and rice production.
Australian Greenhouse Office30
Zoning controls also facilitated development of theland, particularly for the purpose of urbanexpansion in coastal areas. Existing tenures wereoften subdivided into smaller blocks, leading toclearing of small areas.
Clearing for timber products
Landowners wishing to clear their land, weresometimes able to gain forestry concessions,particularly in coastal areas where freehold landoften carried high quality forest. While they receiveda low royalty for pulpwood, it provided an offset tothe costs of any clearing. This practice mainlyoperated in the south-eastern part of the State,adjacent to general forestry activity associated withthe Eden woodchip mill.
Elsewhere, demand for other timber products, suchas sleepers and landscape materials, resulted in thelogging, and localised clearing, of many remnantstands of mature River Red Gum Eucalyptus
camaldulensis.
Innovations: new breeds, techniques andpractices
New crops and pastures
The development of new wheat varieties in the1960s led to the clearing of land previouslyconsidered too dry for use as cropland. The newdwarf wheat varieties required less moisture thanconventional strains and enabled the expansion ofthe wheatbelt westwards, into drier country.
Research into new varieties of cotton, coupled withthe development of pest management and waterharvesting techniques, led to a substantial expansionof the industry. This resulted in the clearing ofremnant vegetation on land that was previouslycleared for grazing, or on new marginal land. Theclearing of land for dryland cotton farmingcontinues to the present day.

National Carbon Accounting System Technical Report 31
Urban expansion
Between 1970 and 1990, there was continuingclearing of remnant native vegetation for furtherdevelopment in metropolitan areas. A major driverfor clearing of the coast was the rapid urbanexpansion in the Newcastle-Sydney-Wollongongarea. However, in the past 20 years, populationshifted from these centres to the warmer northerncoastal areas, either for retirement purposes or for analternative lifestyle in new land developments.Hence, most coastal clearing accommodated therapid development of non-metropolitan areas. Thiswas particularly intense on the north coast, withhigh demand from people wishing to move fromSydney and Melbourne. Former small towns, such asTweed Heads and Port Macquarie, are now majorurban centres. The trend towards urbanisation isextending to other towns such as Ballina, CoffsHarbour and Forster-Tuncurry.
There was an active policy of releasing Crown Landfor urban development, particularly on the coast.The process slowed in the 1990s because of a stricterassessment process that includes meeting therequirements of the Threatened Species Conservation
Act 1995. Continuing expansion of rural residentialdevelopments around the larger cities often results inclearing, usually of remnant vegetation. On theNorthern Tablelands, many parcels of low fertilityland, such as granites and sandstones, are now beingcleared for hobby farms.
4.3 DISTRIBUTION OF LAND CLEARINGAlthough a number of vegetation mapping projectshave been undertaken, few data on vegetationclearance rates are available for NSW, either at aState or bioregional scale. Sivertsen and Bensoncollated a series of case studies and personalobservations, which have been used previously toprovide indicative rates of clearing.
There are four major zones of clearing whichtogether comprise quite a large proportion of theState (see table over page). In the north-west corner,the vegetation varies from sand dune vegetationcontaining spinifex grassland and sparse Acacia andchenopod shrublands to Acacia dominatedwoodlands known as Mulga. Although heavilygrazed, the region is largely uncleared.
Coastal Zone
The Coastal Region comprises a major escarpment,undulating foothills and coastal plains. Tall openforests, open forests and woodlands dominate thevegetation. Closed forests occur in the wet valleysand freshwater swamps in the extensive coastalfloodplains. Other vegetation types include smallerareas of warm temperate and subtropical closedforests, and coastal heath communities.
Land use in the coastal region is a complex mixtureof intensive grazing, horticulture, dairy farming,conservation and urban development. The grassywoodlands of the coastal foothills valleys andfloodplains, and some northern rainforests havebeen extensively cleared for grazing for wool, beefand milk production. Littoral rainforest was clearedfor sandmining and urban development from the1950s to 1980s. Rapid urbanisation throughout the1970s and 1980s has resulted in clearing of bushlandand wetlands on the coast.
The vegetation of this region has been well sampledalthough little information is available on rates ofclearing. Small area clearing dominates in thecoastal valleys, peri-urban and hobby farm areasadjacent to coastal towns.

Australian Greenhouse Office32
Summary of land clearing rates and causes in the major zones of activity, NSW, 1970-1990.
* following Thackway and Cresswell (1995)
Coastal <10,000 Wool, beef, milkproduction, urbanexpansion, ruralresidential development,hobby farming
Secondary clearing ofremnantsPatch size: smallVegetation cleared:mainly open forest andwoodland, some closedforest
NSW North Coast, SouthEast Corner, SydneyBasin
Mountains 10,000–100,000 Wool, beef and wheatproduction, somehorticulture
Secondary clearing ofremnantsPatch size:Vegetation cleared:open forest andwoodland
Australian Alps, NewEngland Tableland, NSWSouth Western andSouth Eastern Highlands
South-west <10,000 Wool, wheat, rice andorchard fruit production
Secondary clearing ofremnantsPatch size:Vegetation cleared:woodland
Murray-DarlingDepression, Riverina
Wheatbelt 10,000–100,000 Wool, wheat and cottonproduction
Expansion into newlands, and secondaryclearing of remnantsPatch size: rangeVegetation cleared: woodland with someopen forest
Cobar Peneplain, DarlingRiverine Plains,Nandewar, SouthBrigalow
Zone Rate of clearing 1980-1990 (ha/yr)
Clearing patternBiogeographic regions(IBRA)*
Primary drivers

National Carbon Accounting System Technical Report 33
Mountains and slopes
The tablelands consist of elevated hills, steepmountain ranges, dissected gorges and elevatedplains. Tall open forests and open forests, woodlandsand some cool temperate closed forests predominate.
The region comprises some of the longest establishedagricultural lands in Australia. It is used largely forgrazing for wool and beef production, and cropping,with some horticulture. On the rugged escarpmentsand mountain ranges, conservation and forestry areimportant land uses.
Most alpine areas are conserved, either withinKosciusko National Park or other reserves. Thetablelands and slopes were cleared prior to 1970.During the 1980s, many isolated remnant trees wereaffected by dieback. Goldney and Bowie (1986)report that the remaining vegetation in the ‘centralwest’ is divided among some 3,500 individualremnant stands, 90% of which are less than 500 hain area.
Clearing of small remnants was likely to besignificant in the southern part of the region,whereas large scale (>50 ha) clearing eventspredominated in the north.
South-west zone
In the south-west of the State chenopod and Acacia
shrublands largely dominate the vegetation. RiverRed Gums line major watercourses that formextensive floodplains. Black box woodlands occur onthe floodplains and along drainage lines. WhiteCypress Pine, Belah and Rosewood are found onsandier soils associated with former stream channels.
Land use is dominated by grazing and cropping. Inthe Riverina, large irrigation developments supportrice and horticultural crops. The extensive floodplainforests along the Murray River have been cut fortimber over the last 150 years. Clearing has alsooccurred along the Darling River.
Between 1970 and 1990, land clearing occurredmainly around the Murray River, for irrigatedcropping of rice and other horticultural crops.Anecdotal information regarding the Riverinabioregion indicates large scale clearing events(>50 ha) predominated.
Wheatbelt
This region has areas of sedimentary derived soils,high nutrient basalt soils, rocky outcrops andfloodplains. Woodland is the main vegetation type.The major land uses are sheep grazing and croppingof both wheat and cotton.
A large proportion of this region was cleared forgrazing and cropping during the 1970s and 1980s,although the far western section had not beencleared. Much of the region has been heavily grazedand parts, such as the Cobar Peneplain bioregion,are now affected by an increased abundance ofwoody unpalatable native shrubs.
NSW National Parks (Sivertsen, 1995b) undertook adetailed mapping and land clearance project of thenorth-west plains wheatbelt. The recorded clearingrates vary for the different map sheets although aconsistent trend is apparent. Clearing rates in the1980s and 1990s were greatly reduced from thoserecorded for the 1970s. It is likely that large scale(>50 ha) clearing events predominate inthe wheatbelt.

Australian Greenhouse Office34
4.4 SELECT REFERENCES
Barson M. 1999. Remote Sensing of Agricultural Land
Cover Change 1990-1995 Results, Bureau of RuralSciences: Canberra. http://www.brs.gov.au/apnrb/landcov/alcc_results/
Benson, D.H. 1992. The natural vegetation of the
Penrith 1:100 000 map sheet. Cunninghamia 2:541-596.
Benson, D.H. 1986. The vegetation of the Gosford
and Lake Macquarie 1:100 000 map sheets.
Cunninghamia 1:467-490.
Benson, D.H. & Howell, J. 1994. The natural vegetation
of the Sydney 1:100 000 map sheet. Cunninghamia 3:677-722.
Benson, D.H. & Keith, D.A. 1990. The natural
vegetation of the Wallerawang 1:100 000 map sheet.
Cunninghamia 2: 305-336.
Benson, J.S. 1999. Setting the Scene: The Native
Vegetation of New South Wales. Background Paper No
1. Report to Native Vegetation Advisory Council of
New South Wales. Royal Botanic Gardens: Sydney.
Benson, J.S. 1994. The native grasslands of the Monaro
Region: Southern Tableland of NSW.
Cunninghamia 3: 609-650.
Benson, J.S. 1991. The effect of 200 years of European
settlement on the vegetation and flora of New South
Wales. Cunninghamia 2: 343-370.
Benson, J.S. & Ashby, E.M. (in prep.). The natural
vegetation of the Guyra 1:100 000 map sheet.
Cunninghamia.
Benson, J.S., Porteners, M.P. & Ashby, E.M. 1997. The
native grassland of the Riverine Plain, New South
Wales. Cunninghamia 5: 1-49.
Benson, J.S. & Redpath, P.A. 1997. The nature of pre-
European native vegetation in South-Eastern
Australia: a critique of Ryan, D.G., Ryan, J.R. and
Starr, B.J. (1995), The Australian landscape –observations of explorers and early settlers.Cunninghamia 5: 285-328.
Blair, E. 1998. Status Report: Vegetation mapping in the
Barwon Region. In: Australian Land Cover Change
1991-1995. Bureau of Resource Science: Canberra.
Carnahan, J.A. 1990. Australia: natural vegetation. In:
Atlas of Australian Resources. Volume 6: Vegetation.AUSLIG: Canberra.
Clarke, P.J., Copeland, L.M., Hunter, J.T., Nano, C E.,Williams, J.B. & Wills, K.E. 1997. The Vegetation
and Plant Species of Torrington State Recreation Area.Division of Botany, University ofNew England: Armidale.
Cohn, J.S. 1995. The vegetation of Nombinnie and
Round Hill Nature Reserves, Central Western New
South Wales. Cunninghamia 4: 81-102.
Creaser, P.A. & Knight, A.T. (Unpublished report,1996). Bioregional Conservation Strategy for Cobar
Peneplain. Stage 1. NSW National Parks andWildlife Service: Hurstville.
Croft, M., Goldney, D. & Cardale, S. 1997. Forest and
woodland cover in the Central Western Region of New
South Wales prior to European settlement. In: P. Hale& D. Lamb (eds.), Conservation Outside NatureReserves. Centre for Conservation Biology,University of Queensland: Brisbane.
Denny, M.J.S. 1992. Historical and Ecological Study of
the Effects of European Settlement on Inland NSW.NSW Nature Conservation Council: Sydney.
Department of Land and Water Conservation 1996.NSW Status Report on Vegetation Mapping. A report
by Sinclair Knight Merz Pty Ltd for the Vegetation
Forum, Department of Land and WaterConservation: Sydney.

National Carbon Accounting System Technical Report 35
Eardley, K. 1998. Riverina Bioregion Conservation
Assessment. A draft report, NSW National Parks andWildlife Service: Hurstville.
Environmental Research and InvestigationConsortium 1998. Rates of Clearing of Native Woody
Vegetation in New South Wales 1995-1997. A reportto the Department of Land and WaterConservation: Sydney.
Fisher, M., Ryan. & Lembit, R. 1995. The natural
vegetation of the Burragorang 1:100 000 map sheet.
Cunninghamia 4: 143-215.
Flemons P. 1995. Final Report on Mapping of Clearing
in the Natural Resources Audit Council Area. Areport to NSW National Parks and WildlifeService: Hurstville.
Floyd, A.G. 1990. Australian Rainforests in New South
Wales. Surrey Beatty & Sons: Sydney.
Fox, M.D. 1991. The natural vegetation of the Ana
Branch-Mildura 1:250 000 map sheet (New South
Wales). Cunninghamia 2: 443-493.
Goldney, D. & Bowie 1986. The National Trust (NSW)
Scenic and Scientific Survey of the Central West. A draft
report, National Trust of NSW.
Graetz, D., Fisher, R. & Wilson, M. 1992. Looking Back:
the Changing Face of the Australian Continent, 1972-
1992. CSIRO Office of Space Science &Applications: Canberra.
Graetz, R.D., Wilson, M.A. & Campbell, S.K. 1995.Landcover Disturbance Over the Australian Continent:
a Contemporary Assessment. Biodiversity Series, Paper
no. 7. Biodiversity Unit, Department ofEnvironment, Sport and Territories: Canberra.
Gray, J.M. 1995. Land Use Change in the Goran Basin,
1955-1990. Technical Report No. 32. Department ofLand and Water Conservation: Sydney.
Griffith, S. 1993. Conservation Status of Coastal Plant
Communities in Northern New South Wales: a Review.NSW National Parks and Wildlife Service:Hurstville.
Howling, G. 1997. Remnant Vegetation in the Central
West Catchment. Central West CatchmentCommittee: Orange.
Jones P. 1998. Vegetation Data Directory North Coast
Region. Department of Land and WaterConservation: Sydney.
Keith, D.A. & Bedward, M. (1999, in press). Native
vegetation of the South East Forests Region, New
South Wales. Cunninghamia.
Keith, D.A. & Benson, D.H. 1988. The Natural
Vegetation of the Katoomba 1:100,000 Map Sheet.
Cunninghamia 2(1) 107-143.
Keith, D.A., Sivertsen, D.P., Carrit, R. Bolton, M.,Smith, P., Wilson, N., Watt, A., Goody, B, Benson,J., Peacock, R., and Clark, S. 1997. Forest Ecosystem
Classification and Mapping for Eden Comprehensive
Regional Assessment. Unpublished report to CRASteering Committee, National Parks and WildlifeService: Hurstville.
Lott, R.H. & Duggin, J.A. 1993. Conservation
Significance and Long-Term Viability of Subtropical
Rainforest Remnants of the Big Scrub, North-Eastern
New South Wales. A report to the Australian Heritage
Commission and Department of Planning (NEP
90/36), Department of Ecosystem Management:University of New England.
Margules & Partners Pty Ltd, P & J. SmithEcological Consultants and Department ofConservation Forests and Lands Victoria 1990.River Murray Riparian Vegetation Study, Murray-Darling Basin Commission: Canberra.
McRae, R.H.D. & Cooper, M.G. 1985. Vegetation of
the Merriwa Area (1:100 000) map sheet.
Cunninghamia 1: 351-369.
Mid-Lachlan Regional Vegetation Committee 1998.Draft Mid-Lachlan Regional Vegetation Management
Plan. Mid-Lachlan Regional VegetationCommittee: Orange.
Australian Greenhouse Office36
Morgan, G. & Terrey, J. 1990. Land Conservation for the
New England Tableland: a Regional Plan. WorldWide Fund for Nature: Sydney.
Nadolny, C. 1998. Towards integrating farming and
conservation: the role of native pastures. PacificConservation Biology 4: 70-78.
Nadolny, C. 1995. Causes of tree decline/dieback in
NSW. In: Redressing Rural Tree Decline in NSW.
Greening Australia: Sydney.
National Greenhouse Gas Inventory Committee1998. Workbook for Carbon Dioxide from the
Biosphere. Australian Methodology for the Estimation
of Greenhouse Gas Emissions and Sinks – Land Use
Change and Forestry. Workbook 4.2, Revision 2 with
supplements. National Greenhouse Gas InventoryCommittee: Canberra.
National Parks and Wildlife Service of NSW 1997.Urban Bushland Biodiversity Survey: Native Flora of
Western Sydney. National Parks and WildlifeService: Hurstville.
National Parks and Wildlife Service of NSW 1995.Vegetation Survey and Mapping of Upper North-
Eastern New South Wales. A report to the NaturalResource Audit Council, NPWS: Hurstville.
National Parks and Wildlife Service of NSW 1984.Joint Select Inquiry on the Western Division of NSW.A submission by the National Parks and WildlifeService: Sydney.
Porteners, M.F. 1993. The natural vegetation of the Hay
Plain: Booligal-Hay and Deniliquin-Bendigo 1:250 000
maps. Cunninghamia 3: 1-122.
Porteners, M.F., Ashby, E.M. & Benson, J.S. 1997. The
natural vegetation of the Pooncarie 1:250 000 map.
Cunninghamia 5: 139-232.
Pressey, R L., Hager, T.C., Ryan, K.M., Schwarz, J.,Wall, S., Ferrier, S. & Creaser, P.M. (in prep).Terrestrial reserves in New South Wales: gaps, biases
and priorities to minimise further loss of native
vegetation.
Pulsford, I.F. 1984. Conservation status of Brigalow
Acacia harpophylla in New South Wales. In: A. Bailey(ed.), The Brigalow Belt of Australia. RoyalSociety of Queensland: Brisbane.
Reed, P. 1990. An historical perspective on: conserving
what? – the basis for nature conservation reserves in
New South Wales 1967-1989. Australian Zoologist26: 85-91.
Reed, P.C. 1991. An historical analysis of the changes to
the forests and woodlands of NSW. In: D. Lunney
(ed.), Conservation of Australia’s Forest Fauna. RoyalZoological Society of New South Wales: Sydney.
Resource and Conservation Assessment Council1996. Regional Report of Upper North East New
South Wales, Vol. 4: Biodiversity Attributes. A reportinitiated by the Natural Resources Audit Council,Resource and Conservation Council: Sydney.
Ritman, K.T. 1995. Structural Vegetation Data: a
Specifications Manual for the Murray Darling Basin
Project M305. Land Information Centre: Bathurst.
Ryan, K., Fisher, M. & Shaeper, L. 1996. The natural
vegetation of the St Albans, 1:100 000 map sheet.
Cunninghamia 4: 433-482.
Scott, J.A. 1992. The natural vegetation of the Balranald-
Swan Hill Area. Cunninghamia 2: 597-652.
Sivertsen, D.P. (unpublished). The State of Clearing in
NSW. Paper presented to Community Conservation
Strategies Remnant Vegetation for Park ManagersConference, Blackheath, NSW.
Sivertsen D. 1997. Distribution of native woody
vegetation in the northern NSW wheatbelt – trends,
implications and projections. In: Native Vegetation –Managing the Change. Proceedings of the Soil andWater Conservation Association of AustraliaAnnual Conference Moree NSW 6-7 May 1997.
Sivertsen, D.P. 1995a. Habitat loss – its nature and
effects. In: Bradstock, Auld, Keith, Kingsford, Lunney
& Sivertsen (eds.), Conserving Biodiversity: Threats
and Solutions. Surrey Beatty & Sons: Sydney.
National Carbon Accounting System Technical Report 37
Sivertsen D. 1995b. Mapping native vegetation in NSW
wheatbelt – do rapid changes defeat the purpose? Paperpresented at NSW NPWS quarterly seminar series,1995.
Sivertsen, D. 1994. The native vegetation crisis in the
wheatbelt of New South Wales. Search 25: 5-8.
Sivertsen, D, 1993. Conservation of remnant vegetation
in the Box and Ironbark lands of NSW. VictorianNaturalist 110: 24-29.
Sivertsen, D.P. & Cox S.J. (unpublished), Monitoring
Clearing of Sparse Native Woody Vegetation in the
North West Plains of New South Wales Using Visual
Analysis of Landsat TM Satellite Imagery:
Part 1 Methods.
Sivertsen, D.P. & Metcalfe, L. 1995. Natural vegetation
of the southern wheat-belt, Forbes and Cargelligo 1:250
000 map sheet. Cunninghamia 4: 103-128.
Thackway, R. and Cresswell, I.D. (eds) 1995, An
Interim Biogeographic Regionalisation for Australia: A
Framework for Setting Priorities in the National
Reserves System Cooperative Program. AustralianNature Conservation Agency, Canberra, ACT.Version 4, 31 March 1995.
Val, J.D. 1997. Pre-Clearing Natural Vegetation of the
Southern Mallee Planning Region. Draft report,Department of Land and Water Conservation:Sydney.
Walker, J., Bullen, F. & Williams, B G. 1993.Ecohydrological changes in the Murray-Darling Basin.
The number of trees cleared over two centuries. Journalof Applied Ecology 30: 25-273.
Wells, K.F., Wood, N.H. & Laut, P. 1984. Loss of
Forests and Woodlands in Australia. A Summary by
State, Based on Rural Local Government Area. CSIRO
Technical Memorandum 84/4, CSIRO: Canberra.

Australian Greenhouse Office38
Summary of data on clearing in NSW, 1970-1990, and their source.
Region
North coast
Description of data
Data covers private land in the Richmond and Clarence catchments locatedin the northern part of the bioregion. For the 867,700 ha of vegetatedprivately owned land in the study area in 1972, the following clearance rateswere recorded:1972 to 1982 – 2,700 ha per annum; and 1982 to 1994 –1,755 ha per annum.
This project on the upper north east of NSW produced a regional estimatefor the entire Natural Resources Audit Council (NRAC) area with maps ofclearing that occurred between 1972-1982, 1982-1994, and 1972-1994.
The NRAC study area includes the Richmond and Clarence River catchmentsand comprises the northern sector of the NSW North Coast bioregion andsmall areas of the New England Tableland bioregion. The scale of theresultant map, based on a 100m grid cell, was 1:250,000. Area estimatesare provided of the amount of clearing that has occurred on private landsbetween 1972-1994.
The vegetation of the Sydney, Gosford and Lake Macquarie, PenrithWallerawang, Katoomba, Burragorang, Merriwa and St Albans areas hasbeen mapped (1: 100 000) by the Royal Botanic Gardens (RBG), Sydney.The Wollongong, Mittagong and Mount Pomany map sheets are currentlybeing prepared.
During 1996-1997 the National Parks and Wildlife Service (NPWS) surveyedthe flora and mapped, at a fine scale, the vegetation remnants on theCumberland Plain in western Sydney.
A range of studies cover the Illawarra rainforest and dry woodlands.
The southern section of the NSW portion of the bioregion, covering theEden and Bega areas, has been comprehensively surveyed and ecologicallymapped at 1:25,000 scale on GIS to be published at 1:100,000 in a hardcopy form.
The current and pre-1750 vegetation of the northern section of theBioregion in NSW is being mapped and modelled by NPWS as part of theCRA for forests. In part, this mapping is using two decades of modellingdata from the CSIRO Division of Wildlife and Ecology (using over 9,000mainly canopy tree species plots), along with a range of full floristic plotdata and API from Benson (1999).
The RBG has sampled and mapped the vegetation of the Guyra 1:100,000map sheet area at scales of 1:25,000 in a digital format and at 1:100,000 ina hard copy format for publication.
The conservation of land systems and major vegetation types is addressed.
Many of the state forests and conservation reserves have been surveyedand mapped at a fine scale, for example Torrington State Recreation Area.
Source
Flemons 1995 (unpublished)
Sydney basin Benson & Howell 1994;Benson 1986, 1992; Benson &Keith 1990; Keith & Benson1988; Fisher et al. 1995;McRae & Cooper 1985; Ryan,Fisher & Shaeper 1996;Benson 1999
Final Report on Mapping ofClearing in the NRAC area
NPWS 1997
Benson 1999
Coastal: south-easterncorner
Keith and Bedward 1999;NPWS
Northern tablelands:tablelands, mountains& foothills
Benson & Ashby in prep.
Morgan & Terrey 1990
Clarke et al. 1997

National Carbon Accounting System Technical Report 39
Region
South-easternhighlands
Benson 1999
Description of data
Vegetation survey and mapping cover parts of the bioregion at differentscales and quality. Most of the private land has not been mapped orsampled to the same degree as public land. However, the NPWS (SouthernZone) has mapped the native vegetation of the Yass Shire using aerialphotographs.
As part of the CRA for forests, some of the vegetation is being sampled andsubject to air photo interpretation and computer modelling in order toproduce a vegetation map at a scale of 1:100,000.
The vegetation of the Ashford 1:100,000 map sheet has been sampled andis being mapped by the RBG, while DLWC have obtained National HeritageTrust funds for mapping woody vegetation in the bioregion through aerialphotographic interpretation.
The remnant vegetation in the northern section of the South Western Slopesbioregion in the vicinity of Forbes is described and partly mapped at1:250,000 scale. However, there are no published clearance rate data for theForbes sheet. More detailed vegetation maps at 1:100,000 scale have beenproduced on a GIS for the Mid-Lachlan Regional Vegetation ManagementPlan in central-western NSW.
The southern section of the bioregion (east of the Hume Highway), centredon Tumut, has been mapped and classified by the NPWS for the CRA forforests.
NPWS has also used air photo interpretation to map vegetation in theShires of Cootamundra and Young (R. Good, pers. comm.). West of theHume Highway, around Wagga Wagga, several local studies have takenplace.
Rates of clearing for that part of the Goondiwindi 1:250,000 sheet occurringin NSW (representing a small part of the northern NSW section of theBrigalow Belt South bioregion) and western section of the Inverell1:250,000 sheet. Note: Sivertsen (unpublished) and (Sivertsen 1995a) havediffering rates of clearing for the Goondiwindi map sheets.
For that part of the Goondiwindi 1:250,000 sheet occurring in NSW, nativevegetation clearing rates were:
1973 to 1985 – 11,500 ha per annum;
1984 to 1994 – 2,000 ha per annum; and
1994 to 1998 – 250 ha per annum.
For the Inverell 1:250,000 sheet, native vegetation clearing rates vary from:
1970 to 1984 – 8,000 ha per annum
1984 to 1994 – 200 ha per annum; and
1994 to 1998 -130 ha per annum. (NB data tables are inconsistent betweenreferences).
For the whole bioregion the following rate of clearing has been recorded:1995 to 1997 – 1,500 ha per annum.
Source
North-west slopes
Howling 1997; Sivertsen &Metcalfe 1995
Benson 1999
Benson 1999
South-west slopes
Wheatbelt:Brigalow Belt South
Sivertsen unpublished & 1995a

Australian Greenhouse Office40
Region
Cobar Peneplain
Description of data
A detailed mapping project of the Forbes and Cargellico 1:250,000 map sheets.
For part of the Condoblin 1:100,000 sheet the following clearance rates arereported:
1973 to 1991 -1,170 ha per annum; and
1991 to 1995 – 5,000 ha per annum.
Based on only part of the Condoblin 1:100,000 sheet, rates of 1,170 ha perannum from 1973 to 1991 and 5,000 per annum in the period 1991-1995 arereported.
An assessment of this bioregion, that includes vegetation mapping, wasundertaken by the NPWS.
Land systems mapping by Department of Land and Water Conservation(DLWC) covers the section of this bioregion in the Western Division.
For the Moree 1:250,000 sheet map the following native vegetation clearancerates are documented:
1977 to 1985 – 52,200 ha per annum;
1985 to 1994 – 4,800 ha per annum;
1994 to 1996 – 6,200 ha per annum; and
1996 to 1998 – 2,500 ha per annum.
For the Inverell 1:250,000 sheet map the following native vegetation clearingrates are documented:
1970 to 1984 – 8,000 ha per annum;
1984 to 1994 – 200 ha per annum; and
1994 to 1998 130 ha per annum.
For the period 1970-1995, no vegetation clearance data is currently known forthis bioregion within NSW.
The vegetation has been described and mapped at 1:250,000 scale by the RBG.
Land systems mapping by DLWC cover the area. The mallee of Nombinee andRound Hill Nature Reserves in the northern part of the Bioregion has beendocumented and mapped at 1:100 000 scale.
To assist with regional vegetation assessments, DLWC has combined the RBGmapping with the BASINCARE M305 data to produce a 1:100 000 vegetationmap for the southern mallee planning region section of the Bioregion.
Source
Sivertsen & Metcalfe 1995
Sivertsen unpublished
Creaser & Knight 1996
Benson 1999
Darling RiverinePlains
Sivertsen 1995a &unpublished
South-west region:Riverina
Fox 1991; Scott 1992;Porteners et al. 1997
Cohn 1995
Val 1997

National Carbon Accounting System Technical Report 41
5: AUSTRALIAN CAPITAL TERRITORY
5.1 INTRODUCTIONThe Australian Capital Territory (ACT) is totallysurrounded by New South Wales. Although thesmallest jurisdiction in terms of area of land withinAustralia, covering only 2,358 km2 or 0.03% of thelandmass, it has the largest inland city, Canberra.Most land was cleared well before the 1970s, andextensive areas of remaining bushland have been setaside as Public Land with statutory managementobjectives for conservation of the naturalenvironment (ACT Parks and Conservation Service1998, p. 13). These areas include a major part of thesouthern portion of the Territory, as well as reservedland throughout the Canberra cityscape.
The city of Canberra was developed as the NationalCapital, with the public service and other urban-related developments and employment opportunitiesproviding the basis for urban expansion. Much of theurban expansion has been on previously clearedrural land. Rural residential developments associatedwith the city continue to expand into formerfarmland, but these are situated largely insurrounding New South Wales.
5.2 MOTIVATORS FOR LAND CLEARANCE
Urban expansion
Although Canberra is a small city by worldstandards, within the context of the South EasternHighlands region and the jurisdiction of the ACT, itis significant in terms of land use change. Forexample, for the period 1971 to 1986, the populationgrew from 141,000 to 259,000, an increase of over80% in the fifteen-year period. This growth resultedin the development of thirty-one new suburbs,which has resulted in the removal of some smallareas of remnant vegetation, but the city has beenplanned so that much of the remaining woodlandis retained.
The ACT does not have its own distinctivebiogeographical region. Instead, it is predominantlywithin the South Eastern Highlands IBRA region,and a smaller land area is within theAustralian Alps region.
Summary of land clearing rates and causes in the major zones of activity, ACT, 1970-1990.
ACT <1000South Eastern Highlands Urban expansion,some wool production
Secondary clearing ofremnants.Patch size: smallVegetation cleared: openforest and woodland
Zone Rate of clearing 1980-1990 (ha/yr)
Clearing patternBiogeographic regions(IBRA)*
Primary drivers
* following Thackway and Cresswell (1995)

Australian Greenhouse Office42
5.3 DISTRIBUTION OF LAND CLEARINGThe ACT is highly urbanised, with the vast majorityof people within the Territory living in Canberra.Additionally, the majority of the ACT has been setaside as Public Land for conservation of the naturalenvironment. During 1990, agricultural activities inthe ACT utilised only 61,000 ha of land.
Urban development has had the greatest impact onland clearing within the ACT. This impact isreasonably insignificant for the period 1970 to 1995as the development has been, in the main, on areasthat had previously been cleared for primaryproduction purposes.
5.4 SELECT REFERENCES
ACT Parks and Conservation Service 1998. The ACT
Nature Conservation Strategy. ACT Parks andConservation Service, Dept. of Urban Services:Canberra.
Biodiversity Unit 1995. Native Vegetation Clearance,
Habitat Loss and Biodiversity Decline: an Overview of
Recent Native Vegetation Clearance in Australia and
its Implications for Biodiversity. Biodiversity SeriesPaper No. 6, Dept. of the Environment, Sport andTerritories: Canberra.
Castles, I. (Australian Statistician) 1992. Australia’s
Environment: Issues and Facts. Australian Bureau ofStatistics: Canberra.
Graetz, R.D., Wilson, M.A. & Campbell, S.K. 1995.Landcover Disturbance Over the Australian
Continent: a Contemporary Assessment. Biodiversity
Series, Paper no. 7. Biodiversity Unit, Dept. ofEnvironment, Sport and Territories: Canberra.
Graetz, D., Fisher, R. & Wilson, M. 1992. Looking
Back: the Changing Face of the Australian Continent,
1972-1992. CSIRO Office of Space Science &Applications: Canberra.
National Greenhouse Gas Inventory Committee.1994. National Greenhouse Gas Inventory 1988 and
1990. Methodology Supplement. Canberra, ACT.
Thackway, R. and Cresswell, I.D. (eds) 1995, An
Interim Biogeographic Regionalisation for Australia:
A Framework for Setting Priorities in the National
Reserves System Cooperative Program. AustralianNature Conservation Agency, Canberra, ACT.Version 4, 31 March 1995.

National Carbon Accounting System Technical Report 43
Summary of data on clearing in the ACT, 1970-1990, and their source.
Region
All
Description of data
1990-1992 MSS satellite image data were used to map the type, severityand extent of landcover disturbance across Australia, analysed at a scale of500x500m. The ACT falls entirely into the ILZ category, with 48.7% of areauncleared, 13.9% thinned, 37.4%, and 51.3% both thinned and cleared(p. 34).
The ACT Mapping Office (ACTMO) is responsible for the programming,flight planning, acquisition and reproduction of aerial photography overCanberra and the surrounding region. A collection of colour aerialphotography from the past twenty-five years, and a limited black and whitecoverage dating back to the early 1950s is available. The collectioncomprises high level vertical colour photography at a scale of 1:25,000,with overlapped scenes to provide stereoscopic coverage. Adjacent runsalso overlap. Coverage generally extends from Lake George to Bredbo andfrom Wee Jasper to Bungendore. Development records are also available inthe form of vertical colour photography at a scale of 1:10,000, stereoscopiccoverage and overlapping adjacent images. Coverage generally extendsfrom north of the ACT border to Tharwa, and from the Murrumbidgee Riverin the west to Sutton Road in the east and including Queanbeyan. In someyears, coverage was extended past these areas. Oblique photo images arealso available, covering developing areas and sites of special interest.
A Digital Cadastral Data Base (DCDB) of the ACT began in 1972. The systemcurrently exists under the name of ACTMAP with all cadastral data utilisingsurvey calculations to ensure accuracy. All blocks of land created since1992 have been captured from digital data provided by surveyors. ACTMAPis linked to a textual database and is used for land administration purposes.It includes data sets such as: urban and rural blocks with identifiers; unittitle boundaries; topographic information and images includingLANDSAT/SPOT satellite imagery; selected 1:10,000 aerial photography; andselected deposited plans.
Compares vegetation cover for the periods 30 June 1980 and 1990.Demonstrates that there has been no clearing of forest or woodland coverwithin the ACT and that there is a slight increase in plantation forestry (upfrom 14,000 ha to 15,000 ha, a rise from 5.8% of plantation forestry in1980 to 6.3% in 1990 (p. 45).
According to this report, ‘broadscale clearance of woody native vegetationhas ceased…no woody native vegetation was cleared between 1983 and1993’ (p. 36, quoting Rob Corey, ACT Dept. of Environment, Land andPlanning, as cited in the NGGIC 1994, p. 129b).
Includes LANDSAT FCC images of Canberra from August 1972 and January1988. Also includes growth statistics for all Australian capital cities duringthe period 1971 and 1989. Canberra (including Queanbeyan) has thehighest relative growth of 91%. A second considers the proportion of thetotal state population residing in each capital city for the period 1971 and1989. Canberra was the capital with the greater percentage of statepopulation residing in the city: 99% of people in 1971 and 100% in 1989(p. 38).
Source
Graetz et al. 1995
ACT Land Information Centre(ACTLIC) Aerial photographystored at:Planning and LandManagement (PALM),16 Challis Street, DICKSON,ACT, 2605
Castles 1992
Biodiversity Unit 1995
Graetz et al. 1995

Australian Greenhouse Office44
6: VICTORIA
6.1 INTRODUCTIONVictoria (Vic) is the smallest and most denselypopulated and urbanised of the mainland States.Much of the land is suited to agriculture, withintensive farming in the southeast and extensivegrazing in the southwest. The far northwest islargely mallee desert, but there are irrigatedvineyards along the Murray River, and the northeastis mountainous and unsuited to agriculture exceptalong the valleys.
According to a report based on 1990-1992 satelliteimage data, in terms of relative area, Vic hasexperienced the largest level of clearing sinceEuropean settlement of all States and Territories(Graetz et al. 1995, p. 34). Victoria’s forests andwoodlands were estimated to have covered some88% of the State. Since European settlement in the1830s, over 53% of the State has been cleared(Biodiversity Unit 1995, p. 32).
The pattern of clearing closely followed land types,which reflected the capability of land for agriculture.Most clearance occurred on the plains of northernand northwestern Vic and coastal Gippsland,extending into the highlands along the relatively flatand fertile valley floors.
Using satellite image analysis, Woodgate and Black(1988) estimated an annual gross clearing rate(excluding re-forestation) of 15,392 ha per year forthe period 1972 to 1987. This mostly took place onprivate land around Mildura and Horsham, andmainly during the 1980s. Clearing in the Milduraarea was largely for irrigated farming, while inHorsham the activity centred around a shift fromwool to wheat production. In the late 1980s, with ashift in attitude towards conservation, and removalof government incentives, the rate of clearingbegan to decline.
The main driver for land clearing during the 1970sand 1980s was the switch in importance fromgrazing to cropping. Declining terms of trade meantfarmers had to clear remnants to expand the area oftheir properties available for cropping.
6.2 MOTIVATORS FOR LAND CLEARANCE
Environmental and social influences
The pattern of clearing in Vic was well establishedprior to 1970-1990. Land clearing followed theeconomic development of the pastoral industry(Woodgate & Black 1988, p. 3) that began in the1860s and was fostered by land developmentschemes. The establishment of irrigation areas,closer settlement initiatives, and the development oftransport infrastructure further facilitatedagricultural development and, thus, land clearance.This pioneering spirit of developing the landprevailed until the 1970s, supported by governmentincentives. In the early 1980s, with little land left todevelop, and a growing awareness of the effects ofland degradation, there was a swing towardsconservation of remaining woodland and forest.
Clearing controls
Native vegetation clearing controls on private landwere introduced in 1989 as an amendment to thePlanning and Environment Act 1987. Fear ofimpending controls may have lead to some clearingbut, overall, Gilbee (1999) reports that the Actresulted in a significant reduction in clearing.
Financial and institutional incentives
Land development schemes
By 1970, the era of government-backed ruraldevelopment schemes was ending. Early in 1968 aproposal to develop approximately 200,000 ha ofmallee vegetation in the Little Desert area was putforward. The Little Desert Settlement Scheme wasamong the last of many proposals for agriculturalsettlement of Australia’s semi-arid areas (Robin1998, p. 28-29). It was to be a small-holdingsettlement scheme aimed at decentralisation and

National Carbon Accounting System Technical Report 45
agricultural development of unused land. By mid-1969, the proposal was scaled down in response to alobby for the area to be set aside as a National Park.This lobby was significant in Australia’s history, andin terms of land clearing, as it was one of the earlysigns of changing community attitudes towardsthe environment.
Another significant result of the Little Desertcontroversy was the establishment of the LandConservation Council by the Victorian Government.The allocation of Crown Land would besubsequently subject to public hearings, expertadvice and a transparent decision-making process.
Finance
For about twenty years, beginning in the mid 1960s,and initiated by the Commonwealth DevelopmentBank, banks offered easily obtained loans for ruraldevelopment including clearing. During the sameperiod the Government encouraged development byproviding taxation concessions for developmentalcosts. These incentives and concessions ceased in theearly 1980s.
Market forces: new markets, changingcommodity prices
During the period 1970-1990, declining terms oftrade for grazing industries resulted in an expansionof wheat cropping. Much of this expansion tookplace on land that was already cleared and involvedclearing of remnant stands of vegetation. In westernVic, land was also cleared for lupin cropping, from1970 until the introduction of clearing controlsin 1989.
New infrastructure
In the 1970s, construction of the Dartmouth Dam,northeastern Vic, and Thompson Dam, CentralGippsland, resulted in clearing. Although the damswere mainly to produce hydroelectricity, theyreleased some water for irrigation, which allowedmore intensive farming and further clearing ofremnant vegetation.
The Millewa Stock and Domestic Pipeline wasopened in 1975. It provided water to 227,000 ha ofsheep and wheat properties in the Millewa areawest of Mildura and may have contributed to landclearing in the region (Eastburn 1990, p. 49).
Urban expansion
Urban expansion and associated small ruralresidential developments have caused clearing inVic. However, clearing for suburbs did not occur onthe same scale as on the north coast of NSW and inparts of Qld.
6.3 DISTRIBUTION OF LAND CLEARINGA comprehensive statewide study, undertaken byWoodgate and Black (1988), compared satelliteimagery from 1972–1982 and estimated the averageannual clearing rate to be 15,392 ha per year. Mostclearing occurred on freehold land in the westernregions of Mildura, Horsham and Portland.Clearing on public land between 1972 and 1987totalled 36,498 ha while re-forestation totalled 31,568ha, which included tree removal to establish theDartmouth and Thompson Dams (5,914 and 1,900ha, respectively).
A study in eastern Vic, to determine whetherpermits for clearing matched the areas that werebeing cleared, found that permits for the period1989 to 1993 indicated that 15,136 ha were cleared,but there were inconsistencies with actual clearing.
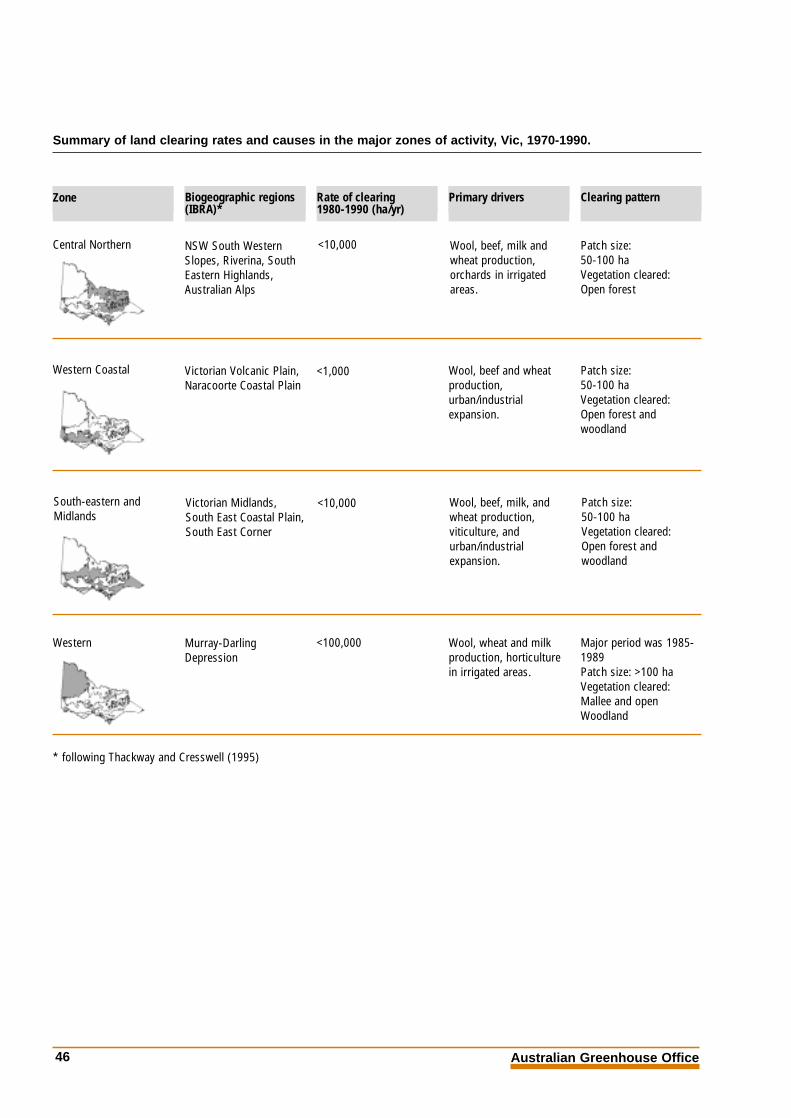
Australian Greenhouse Office46
* following Thackway and Cresswell (1995)
Central Northern <10,000 Wool, beef, milk andwheat production,orchards in irrigatedareas.
Patch size: 50-100 haVegetation cleared: Open forest
NSW South WesternSlopes, Riverina, SouthEastern Highlands,Australian Alps
Western Coastal <1,000 Wool, beef and wheatproduction,urban/industrialexpansion.
Patch size:50-100 haVegetation cleared: Open forest andwoodland
Victorian Volcanic Plain,Naracoorte Coastal Plain
South-eastern andMidlands
<10,000 Wool, beef, milk, andwheat production,viticulture, andurban/industrialexpansion.
Patch size:50-100 haVegetation cleared: Open forest andwoodland
Victorian Midlands,South East Coastal Plain,South East Corner
Western <100,000 Wool, wheat and milkproduction, horticulturein irrigated areas.
Major period was 1985-1989Patch size: >100 haVegetation cleared:Mallee and openWoodland
Murray-DarlingDepression
Summary of land clearing rates and causes in the major zones of activity, Vic, 1970-1990.
Zone Rate of clearing 1980-1990 (ha/yr)
Clearing patternBiogeographic regions(IBRA)*
Primary drivers

National Carbon Accounting System Technical Report 47
Central north
The central northern zone comprises the NSW SouthWestern Slopes, Riverina, South Eastern Highlandsand Australian Alps. The NSW South Western Slopesand the Riverina bioregions were settled in thenineteenth century and remain major farming areas.By contrast, the Victorian Highlands area is generallysparsely settled, despite the efforts of early pioneersto develop agricultural and mining pursuits.
Agriculture and forestry make up the major landuses within the NSW South West Slope bioregion,with sheep and cattle grazing, and some dairyfarming, in the more fertile valleys. Much of theRiverina bioregion’s land is used for cereal croppingand sheep grazing, and some irrigated areas producedairy products and fruit.
The flatter and lower areas of the South EastHighland bioregion have also been used for beefcattle and sheep grazing, and in more heavily settledareas, dairy farming. Tourism and recreation are alsomajor industries. In catchment areas, waterproduction is an important use of public land, someof which is also used for grazing and apiculture.The majority of the Otway Ranges is covered inforest and heath vegetation. In the ranges, timberharvesting, dairying, potato production and beefcattle grazing are major industries.
Generally, clearing has been extensive throughoutthe central north, although some remnants of nativevegetation remain.
In the 1970s, land was cleared for the creation of theDartmouth Dam, in the north-east, and theThompson Dam, in central Gippsland.
Western coastal zone
The Victorian Volcanic and Naracoorte Coastal Plainsare situated in Victoria’s western coastal zone. TheVictorian Volcanic Plain was formed from volcanicactivity in south-western Vic. The climate is mild totemperate with annual rainfall ranging from 500 to700 mm. The Victorian section of the NaracoorteCoastal Plain is located in the south-western corner
of the State, extending for about 230 kilometresalong the coast. This bioregion is mainly flat withparallel dune limestone ridges, swampy areas andlimestone depressions.
The major land use in the Victorian Volcanic regionis sheep and cattle grazing, as well as cropping inthe north. Settlement includes areas on the outskirtsof Melbourne, parts of Geelong and Ballarat. Urbanand industrial developments continue to expandfrom these cities. The region was one of the firstareas of agricultural settlement in Vic. Hence, largeareas have been cleared, most prior to the 1970-1995period. However, remote sensing data andinterviews indicate that clearing was ongoing in thePortland area for the period 1972 to 1987 and, to alesser extent, 1990 to 1993. This recent clearingappears to be predominantly associated with theestablishment of plantations.
On the Naracoorte Coastal Plain, hardwoodforestry within State Forests makes up almost 30%of the bioregion. About half of the bioregion hasbeen cleared for agricultural or plantation purposesand, of the remaining 50% of natural vegetation,40% is made up of National Parks and ConservationReserves.
South-east and midlands
The South East Corner bioregion includes the EastGippsland Uplands and the East GippslandLowlands bioregions. Only a small part of thebioregion has been cleared and the area supportsextensive forests and other native vegetation. TheVictorian Midlands bioregion includes patches ofwoodland and forest, with agricultural pastures andsome crops.
The exception is the South Eastern Highlandsbioregion, where over 75% of the vegetation coverremains. In the Highlands, the river valleys of theDandenong and Strezeleki Ranges, on the edge ofthe region, are the main centres of clearing.

Australian Greenhouse Office48
The major primary industries within the south-eastand midlands are sheep and cattle grazing, croppingand viticulture, mining and timber production andsome dairy farming. In the South East Cornerbioregion, nature conservation is the major land use,although timber harvesting, fisheries and tourismare also important.
Urban land use is associated with Geelong and othercentres in the south-east such as Colac. Brown coal ismined near Anglesea, west of Geelong.
Land use in the Gippsland Plain bioregion includesurban development associated with Melbourne’scentral business district, Mornington Peninsula andthe La Trobe Valley. Dairy farming, sheep, beef,potato production, hardwood and softwoodplantations and brown coal mining are alsoimportant industries. The fertile, flatter land hasbeen largely cleared, for agricultural, urban or otherdevelopment uses.
Western zone
This region is part of the Murray-Darling Depressionbioregion and lies in the corner of Vic between theMurray River and the Avoca River in the east. Itincludes the major regional centres of Horsham,Mildura and Swan Hill.
Within Vic, the Murray-Darling Depression has fewsurface water areas and its soils are highlypermeable. Annual rainfall ranges from 500 mm inthe south to less than 250 mm in the north. Theregion includes two Victorian catchments: the Malleeand the Wimmera. In the Murray Mallee and theWimmera vegetation, communities associated withthe better agricultural soils have been cleared. Thesecommunities include Grassland, Plains GrassyWoodland, Wimmera Mallee Woodland, SlenderCypress-pine and Buloke and Belah woodlands.
The area was settled early and has been heavilycleared and farmed. Cereal and coarse graincropping, and livestock industries are dominant inthe dryland areas. Irrigated horticulture occursalong the Murray and Wimmera Rivers.
Approximately 70% of Victoria’s mallee vegetationhas been cleared. Gilbee (1999) reports that, for the1990-1993 period, the Mildura area has the greatestloss of permanent tree cover on freehold landin Australia.
Woodgate and Black (1988) report that the Milduraand Horsham areas contributed a large proportionof clearing for the period 1972 to 1987. In bothregions, clearing was predominantly on privatelyowned land for agricultural purposes – for irrigatedfarming in the case of Mildura, and wheat croppingin the case of Horsham. The peak of this activity isthought to be in the mid-1980s, up until theintroduction of controls in 1989. Over the sameperiod, no decrease in permanent tree cover wasrecorded on public land.
Gilbee (1999) demonstrates that controls wereeffective – between 1990 and 1993, tree cover loss onfreehold land due to agricultural clearing wasrecorded as 1,773 ha in the Mildura region and746 ha around Horsham, which were substantiallyreduced rates.

National Carbon Accounting System Technical Report 49
6.4 SELECT REFERENCES
Biodiversity Unit 1995. Native Vegetation Clearance,
Habitat Loss and Biodiversity Decline: an Overview of
Recent Native Vegetation Clearance in Australia and
its Implications for Biodiversity. Biodiversity Series
Paper No. 6. Department of the Environment, Sportand Territories: Canberra.
Dept. of Natural Resources 1997, Victoria’s
Biodiversity: Directions in Management, Departmentof Natural Resources: East Melbourne.
Eastburn, 1990. The River Murray: History at a Glance,
Murray-Darling Basin Commission, Canberra, ACT.
Frisina, R. Goodson, P. & Woodgate, P. 1991. Forest
Cover Changes and Carbon Dioxide Emissions: a
Remote Sensing Study in Western Victoria, 1987-1990.
Dept of Conservation and Environment and Officeof the Environment: Melbourne.
Gilbee, A. (1999). Tree Cover Change in Victoria
c. 1869–1993: an Outline of Methods for Mapping and
Monitoring. Natural Resource Systems,
Department of Natural Resources andEnvironment: Melbourne.
Graetz, R.D., Wilson, M.A. & Campbell, S.K. 1995.Landcover Disturbance Over the Australian Continent:
a Contemporary Assessment, Biodiversity Series, Paper
no. 7, Department of the Environment, Sport andTerritories: Canberra.
Menkhorst, P.W. (ed.) 1995. Mammals of Victoria:
Distribution, Ecology and Conservation. OxfordUniversity Press in association with theDepartment of Conservation andEnvironment: Melbourne.
National Greenhouse Gas Inventory Committee1998. Workbook for Carbon Dioxide from the
Biosphere. Australian Methodology for the Estimation
of Greenhouse Gas Emissions and Sinks – Land Use
Change and Forestry, Workbook 4.2, Revision 2 with
supplements. National Greenhouse Gas InventoryCommittee: Canberra.
Office of Environment (1990). “State of the
Environment – Agriculture”. Report for Victoria byPeter Chrisfoff
Powell, J.M. 1993. The Emergence of Bioregionalism in
the Murray-Darling Basin. Murray-Darling BasinCommission: Canberra.
Ritman, K.T 1995, Structural Vegetation Data: a
Specifications Manual for the Murray Darling Basin
Project M305, NSW Dept. of Land and WaterConservation, Land Information Centre: Bathurst.
Robin, L.1998. The Little Desert Case. Eureka Street,vol. 8, no. 8, October, pp. 28-31.
Thackway, R. and Cresswell, I.D. (eds) 1995, An
Interim Biogeographic Regionalisation for Australia:
A Framework for Setting Priorities in the National
Reserves System Cooperative Program. AustralianNature Conservation Agency, Canberra, ACT.Version 4, 31 March 1995.
Whelan, B.R. 1996. Victorian Overview of Conservation
Achievements on Private Land. In: T. Dendy and J.Murray (eds.), From Conflict to Conservation:Native Vegetation Management in Australia –a Focus on the South Australian Program andOther Australian Initiatives – Past Present andFuture. Seminar proceedings, Adelaide, 21November 1995, South Australian Department ofEnvironment and Natural Resources: Adelaide.
Woodgate, P. & Black, P. 1988. Forest Cover Changes
in Victoria 1869-1987. Remote Sensing Group,Lands and Forest Division, Department ofConservation, Forests and Lands: Melbourne.

Australian Greenhouse Office50
Summary of data on clearing in Vic, 1970-1990, and their source.
Region
All
Description of data
State forest type map at a scale of 1:1,000,000, the result of an examinationof all forest type maps, with gaps filled with mapping from aerialphotographs and hardcopy LANDSAT imagery.
In 1988 the Remote Sensing Group undertook the first comprehensive treecover study, designed to give a strategic picture of woody vegetation acrossthe State. The study used LANDSAT MSS hardcopy transparencies(1:1,000,000), which were visually interpreted to provide information aboutthe extent of tree cover in 1972 and 1987 and to document the changebetween these two years. The mapping was at a scale of 1:500,000 with aminimum mapping unit of about 15 ha. The report provides acomprehensive review of its method, a map, and a historic account ofclearing.
Tree Vic commissioned a study in 1993 to compare the changes in woodyvegetation in 1990 and 1993 across the State. A finding of the study wasthe majority of changes tended to be dynamic changes within the nativeforest, such as those resulting from fire and seasonal change. It utiliseddigital LANDSAT TM data allowing the whole State to be mapped at thescale of 1:100,000 with a minimum mapping unit of one ha. Computer-based classifications were used to interpret images, which reduced relianceon manual interpretation. This study also provides an excellent critique ofproblems associated with the collection, comparison and interpretation ofremote sensing data.
A second study was commissioned by the Victorian Greenhouse Unit toidentify tree cover change in 1987 and 1990, in the western division of Vic.This area was selected because of the land clearing that had taken place inrecent times and because of the small amount of tree cover available onfreehold land and the rate at which it was being cleared. LANDSAT TM datawere used, allowing for a minimum mapped area of about 6 ha and anoutput scale of 1:250,000. The study also went back over the entire Stateand quantified forest loss by type between 1972 and 1987 using existingsources such as Edwards (1983) as cited in Gilbee (1999).
Source
Edwards 1983 cited in Gilbee(1999, p. 11)
Woodgate & Black 1988
Gilbee (1999)
Western Division andentire State
Frisina et al. 1991 cited inGilbee (1999)

National Carbon Accounting System Technical Report 51
7: TASMANIA
7.1 INTRODUCTIONTasmania (Tas) has plentiful water, rich soil andextensive forests. Minerals, forestry andhydroelectricity for industry are the State’s mainresources. Since European settlement about one-quarter of the native vegetation cover in Tas has beencleared, mainly for grazing. Much of Tas ismountainous, and plains suitable for agriculture arefound only in the northeast, midlands, centralhighlands and far northwest.
In Tas 39% of the land is private land and of theremaining 60% public land. Some 40% of the landmass is in reserves and 20% managed by the State formultiple use forestry. The public areas managed bythe State for multiple use forestry are required bylaw to be regenerated following harvest.
In the 1970s and 1980s, significant clearance of nativevegetation occurred for agricultural purposes.Nevertheless, the rate of clearing declined by morethan 40% over the period. Most conversion of forestto pasture occurred along the margins of alreadycleared land or in remnant patches of nativevegetation. Clearing was undertaken almost totallyin dry eucalypt forests in the east and north east ofthe State. There was also some clearing forhydroelectric impoundments.
7.2 MOTIVATORS FOR LAND CLEARANCE
Environmental and social influences
Until the mid-70s land clearing was seen asprogressing the State’s economic interests. Very fewrural councils had planning schemes and there was amarked reluctance to enforce stricter control on landclearance. This philosophy permeated governmentpolicies and programs up to the mid-1980s. In themid-1980s it was recognised that the potential for theprivate forest estate to continue to supply wood wasbeing compromised by the level of harvest, theconversion of forests to other uses and the failure toproperly manage the private forested estate.
The Everett Gentle (1977) report recommended theintroduction of a Forest Practices Act to regulateoperations in the forest and a quota system toregulate the total pulpwood yield from private land.The Forest Practices Act was introduced in 1985 andthe pulpwood yield regulated by export licenses.
During the 1980s, with the removal of manyeconomic incentives to clear and a scarcity ofpotential farmland, a shift in attitude occurred.Many landholders viewed the presence of nativevegetation on their property as a benefit rather thana disadvantage. Only occasionally was it seen as arefuge for pests and a potential fire hazard, thatwould be better cleared.
The rate of clearance decreased by about 40%between the periods 1972-80 and 1980-88. Thisdecline could possibly reflect the reducedavailability of natural vegetation and deep soils onrelatively flat private land.
Financial and institutional incentives
Finance
In the early 1970s land owners were able to sellwood to a woodchip export company. Prior to thisonly land owners close to the two domestic papermills were able to sell pulpwood. In many cases,especially along the east coast, owners receivedpayments for the sale of their wood under contractsthat allowed the buyer to harvest the wood decadesinto the future. This cash income was veryimportant during a period of exceptionaleconomic stress.
Various taxation concessions provided under theCommonwealth Income Tax Assessment Act providedeconomic drivers for clearing. These werereduced over a number of years, finally beingremoved in 1983.
Australian Greenhouse Office52
The establishment of the CommonwealthDevelopment Bank in 1965 made finance readilyavailable to farmers for land development, includingclearing. Other financial institutions soon began tooffer similar support for rural development and thiscontinued until the early 1980s.
Land tenure
The advent of the woodchip industry in the 1970spresented those landholders, with native forest, anopportunity to sell timber and use the funds tofinance the conversion of harvested areas toagricultural and pastoral uses.
The export woodchip operators were requiredunder their export license to regenerate forestsharvested. Under the first license issued in the 1970sto Northern Woodchips, a company relying whollyon the private forest estate for supply, regenerated aset area each year. By 1986 all export licensesrequired that for each 1,000 tonnes of conventionalpulpwood harvested, 1 ha of plantation was to beestablished anywhere in the State and 4 haregenerated in the Forwood zone or region wherethe wood was harvested.
The license holders were required to report on theareas regenerated and planted. Both theregenerated and plantation areas had to be surveyedto ensure they were adequately regenerated orestablished as plantation.
To encourage land owners to regenerate their land,an extra regeneration payment was made inaddition to the base payment, for the woodharvested from areas that were to be reforested. Theexport license holder also undertook the necessaryoperations to regenerate the forest. Similar incentiveschemes were also available if the land ownerwished to establish a plantation on an areaharvested. During this period the State Governmentalso funded incentive schemes to encourage landowners to establish plantations or actively managetheir native forest.
Innovations: new breeds, techniques andpractices
Agriculture in Tas underwent significant change inthe two decades before 1970, when extra revenuefrom increasing commodity prices enabled farmersto reinvest in their land. Fertilisers and other traceelements were used to boost productivity and makepoorer land productive for grazing. In the midlandsarea, for example, most farmers used molybdenumphosphate to improve pasture production. In coastalareas, cattle failed to thrive until the trace elementcobalt was applied.
New crops and pastures
In the 1970s apples ceased to be an important cropwhen Tas lost its British markets, but new varietieswere developed for the mainland market. Thisentailed only a small increase in the clearing.
Market forces: new markets, changingcommodity prices
The grassy woodlands of the State are ideal forproducing fine wool. In the late 1960s to early 1970sa rise in commodity prices for fine wool became adriver for clearing to expand pasture and for the useof woodlands and dry forest areas for grazing. Firewas used to modify the woodland and forestunderstorey to favour the grasses and herbs. Oncethe land had been cleared, the conditions thatfavoured the production of fine wool were lost.
By 1973/74 there was an oversupply ofagricultural land, so only limited conversion ofnative vegetation areas to improved pasture orcropping was occurring. The only district where thiswas not the case was the north west area, whereconversion from broadscale sheep and beefenterprises to more intensive dairy farming tookplace in the mid 1970s and late 1980s and involvedsome clearing to expand existing pasture.

National Carbon Accounting System Technical Report 53
Urban expansion
The coastal fringe of Tasmania’s north and someareas around the major population centres of Hobartand Launceston were developed for small-scalesettlements such as hobby farms. Land was clearedfor houses and associated buildings and paddocks.For example, in the north east region of the State,heath and dry sclerophyll were cleared for urban andhobby farming activities. Around the urban fringesnorth of Hobart, forest was cleared for large housingdevelopments in the 1980s.
7.3 DISTRIBUTION OF LAND CLEARINGThe most comprehensive data for Tas as a whole isKirkpatrick’s and colleague’s work, which recordsnative vegetation removal from 1972-1980(Kirkpatrick & Dickenson 1982), from 1980-1988(Kirkpatrick 1991) and from 1988-1994 (Kirkpatrick &Jenkin 1996). However, concern has been raised byPrivate Forests Tas regarding the accuracy of thedata, especially the efficacy of the techniques used todistinguish between clearing for agriculture asopposed to clearing for forest plantation or areasharvested and being regenerated.
The following clearing rates reported for Tas showthat clearing declined significantly during the 1980s:
• 1972-1980: 14,000 ha per annum (excludingclearing for forestry purposes and hydro-electric impoundments) (Kirkpatrick &Dickenson 1982);
• 1980-1988: 6,000 ha per annum (nativevegetation clearance rates for each ofTasmania’s vegetation types) with the higherrates (greater than 1,000 ha per annum) inthe lower biomass open forests andwoodlands (Kirkpatrick 1991); and,
• 1988-1994: 3,525 ha through damimpoundment and 5,000 ha from clearing foragriculture (Kirkpatrick & Jenkin 1996).
Useful data sets in relation to size distribution ofpatches cleared, especially in the smaller sizecategories, are not available at a State or bioregionallevel. Any data sets that include information aboutsize distributions tend to be based on techniqueswhich mask small area clearing event sizes. A dataset for private forest land is available, but the nativevegetation cover changes are based on widelydisparate time frames.
Although no accurate bioregional assessment ispossible with Kirkpatrick and Dickenson’s (1982)data, a generalised distribution map in Kirkpatrickand Dickenson (1982) shows the areas converted topasture are predominantly in the Woolnorth, BenLomond, and Tasmanian Midlands bioregions.

Australian Greenhouse Office54
7.4 SELECT REFERENCES
Department of Environment, Sport & Territories,1996. Taxation and the Environment. EnvironmentalEconomics Series: Canberra.
Duncan, F. & Stadler, T. 1991. Retention of Native
Woody Vegetation on Farms. In: J. Scanlan et al.
(eds.), Management of Native Vegetation onFarms in Australia.
Everett, M & Gentle, S. 1977. Report of the Board of
Inquiry into Private Forestry Development in
Tasmania: Hobart.
Forestry Commission 1994. State of the Forests Report:
Tasmania
Forestry Commission 1983. Tasmania Survey of
Regeneration on Private Lands.
Graetz, D., Wilson, M. & Campbell, S. 1995.Landcover Disturbance over the Australian Continent.
Biodiversity Series, Paper no. 7, Department ofEnvironment Sports and Territories: Canberra.
Kirkpatrick. J.B. 1997. Changing a culture of clearance.
Australian Farm Journal, BUSH.
Kirkpatrick. J.B. 1991. The magnitude and significance
of land clearance in Tasmania in the 1980s.
Tasmanian Forests 3: 1-14.
Kirkpatrick, J.B., Barker, P., Brown , M.J., Harris, S &Mackie, R., 1995. Reservation Status of Tasmanian
Vascular Plant Communities. Wildlife ScientificReport 95/4 Parks and Wildlife Service Tasmania.
Kirkpatrick, J.B. & Dickinson, J.M. 1982. Recent
destruction of natural vegetation in Tasmania.
Search 13(7-8): 186-87.
Summary of land clearing rates and causes in the major zones of activity, Tas, 1970-1990.
Zone Rate of clearing 1980-1990 (ha/yr)
Clearing patternBiogeographic regions(IBRA)*
Northern <10,000 Wool production Patch size:
Vegetation cleared:
open forest
Woolnorth
Western <10,000 Wool production, damimpoundment
Patch size:
Vegetation cleared:
open forest and someclosed forest
West and South West
Primary drivers
* following Thackway and Cresswell (1995)

National Carbon Accounting System Technical Report 55
Kirkpatrick, J. & Dickenson, K., 1991. Management of
Native Vegetation on Farms in Australia.
In: J. Scanlan et al. (eds.), The proceedings of TheRole of Trees in Sustainable Agriculture.
Kirkpatrick, J.B. & Jenkin, E. 1996. Land Clearance and
Inundation in Tasmania 1988-1994. Report to theLand and water Resources DevelopmentCouncil and Australian Nature ConservationAgency: Canberra.
Peters, D. &Thackway, R. 1998. A New Biogeographic
Regionalisation for Tasmania. Report prepared for the
National Reserves System Program of the Natural
Heritage Trust, Tasmanian Parks and WildlifeService, GIS Section: Tasmania.
Private Forest Council 1989. Review of the Private
Forest Resource, Private Forestry Council: Tasmania.
Private Forests Tasmania 1996. Private TimberResources within Tasmania. A Report to PrivateForests Tasmania.
Tasmanian Sustainable Development AdvisoryCommittee 1996. State of the Environment Tasmania.
Volume 1 – Conditions and trends. Compiled by theState of the Environment Unit Land InformationServices, Department of Environment and LandManagement: Tasmania.
Taylor, P. 1996. Private Timber Resources within
Tasmania. A Report to Private Forests Tasmania.
Thackway, R. and Cresswell, I.D. (eds) 1995, An
Interim Biogeographic Regionalisation for Australia:
A Framework for Setting Priorities in the National
Reserves System Cooperative Program. AustralianNature Conservation Agency, Canberra, ACT.Version 4, 31 March 1995.

Australian Greenhouse Office56
Summary of data on clearing in Tas, 1970-1990, and their source.
Region Description of data
In the 1970s the rate of logging on private land expanded to supply the newexport pulpwood market. Between 1973 and 1975 the Silvicultural Branch ofthe Forestry Commission carried out sample surveys to determine the postharvest land use. In 1979 the Private Forestry Division surveyed land loggedbetween 1975 and 1978. A third survey was undertaken in 1983 of theareas logged between July 1978 and June 1983. In all cases the areasampled were visited and the landowner interviewed. The surveys were onlyconducted on areas logged by the export woodchip operators. No surveyswere undertaken of areas where logging supplied wood to domestic paperproducers (ANM at Boyer and APPM at Burnie).
On 45,120 ha logged to the end of 1974, 18,630ha (some 40 %) wasconverted to agricultural and pastoral development. In the period mid 1975to mid 1978, 31,730 ha were logged with 11,740 ha (37 %) being convertedto agricultural and pastoral development. In the period mid 1978 to mid1982, 51,680 ha were logged with 21,754 ha (42%) was converted toagricultural and pastoral development.
Almost half of the logging by area occurring between 1978 and 1982 hasoccurred in the South East with most of the remainder in the North East. Ofthe logged area, about 40% is being converted to pasture, split almostevenly between the North East and the South East. No information wasavailable for unlogged private forest being converted to pasture.
LANDSAT images at 1:250,000 were visually inspected and differencesbetween the 1972 and 1980 images traced onto acetate overlays. Areasunder 25 ha were considered difficult to distinguish. Areas of clearance onboth private and public land for Pinus radiata plantations were calculatedusing Tasmanian Forest Commission data.
Analysis of the satellite imagery, revealed that in the period 1972-198074,000 ha of native vegetation was converted to improved pasture. Of this,69,500 ha was previously dry eucalypt forest with the remainder beingheath country. 24,000 ha were cleared for forestry purposes and 51,800 hainundated by hydro-electric impoundments. Based on these figures andexcluding clearing for forestry purposes and hydro-electric impoundments,the annual clearing rate between 1972-1980 was approximately 14,000 haper annum.
No accurate bioregional assessment is possible with this data. However, ageneralised distribution map shows the areas converted to pasture aspredominantly in the Woolnorth, Ben Lomond, and Tasmanian Midlandsbioregions.
A Statewide value for loss of each of the vegetation types since 1802.
Native vegetation clearance rates for each of Tasmania’s vegetation types –an average of 6,000 ha per annum with the higher rates (greater than1,000 ha per annum) in the lower biomass open forests and woodlands.A small scale map showing areas of vegetation clearance and thegeneralised size distribution of the clearing is provided.
Source
Forestry Commission Tas 1993& 1994
Kirkpatrick & Dickenson 1982
Kirkpatrick et al. 1995
Kirkpatrick 1991

National Carbon Accounting System Technical Report 57
Region Description of data
Vegetation clearance for agriculture, forest establishment and inundation inthe period 1988-1994; 30,560 ha were cleared for agriculture and 3,525 hathrough dam impoundment – a rate of clearing for agriculture ofapproximately 5,000 ha per annum. Highest rates of clearing were in thehigher biomass forests but these were predominantly for forest plantationestablishment. Predominantly, dry forest types were cleared for agricultureduring this period.
Although inundation of native vegetation from dam impoundment has beenincluded as vegetation clearance in the literature, its impact on greenhousegas production is equivocal.
From analysis of satellite imagery, in the period 1972-1980, 51,800 ha wereinundated by hydro-electric impoundments in West South West bioregion.From 1988-1994, 3,525 ha inundated.
1:500,000 black and white map of agricultural clearance and vegetation loss1988-1994 accompanies.
Aerial photography was used to delineate areas where the land cover hadchanged.
Photography used for the 1989 review (Private Forest Council 1989) of theprivate forest resource was compared with more recent photography. Thenumber of years between the air photographs used varied considerablyacross Tas.
Field visits were undertaken to verify boundaries, to determine the new landcover and owner intentions. In total 5,740 individual areas had changedforest cover. A database of the changes was complied from the field data.This database records actual changes in land cover and the reason for thatchange. It is not possible to link the change in land cover with actual areachanged. The database records individual incidents of change only and notthe area changed.
The holdings owned by North Forest Products were not included in the fieldsurvey. The survey records that 35% of changes resulted in thedevelopment for pasture/agriculture.
Detailed information on the previous land cover was not available for all5740 changes. Of the 5740 changes:
• in 1,285 incidents, forest was changed to plantation (57incidents), or converted to agriculture (1,108) or residential orsimilar uses (120); and.
• in 636 incidents, areas fire damaged, bracken, pine plantation,scrub or secondary species were converted to plantation(15 incidents), agricultural (433), selectively harvested (162),or residential or similar uses (26).
Source
Kirkpatrick & Jenkin 1996
Kirkpatrick & Jenkin 1996;Kirkpatrick & Dickenson 1982
Kirkpatrick & Jenkin 1996
Taylor 1996
Australian Greenhouse Office58
Region Description of data
In addition, a database of the actual area changed was established as partof the process to prepare the report.
On 162 1:25,000 scale map sheets the area changed from one type of forestcover to another type of cover was measured. On the 162 map sheets forestchanges had occurred on 115,253 ha:
• of the 115,253 ha, 30,756 ha of forest was removed and replacedby agricultural cover.
• on 29,263 ha the forest cover was replaced by plantation.
• approximately 7,000 ha of forest cover was changed but theintended use was not recorded; and,
• in total, areas converted to agriculture plus the areas partlyconverted, there were 31,735 ha of forest affected.
The database records individual patches of forest cleared for use asagriculture on a map sheet by map sheet basis. These patches may spanmany landowners and could also be contiguous with cleared areas ofadjoining map sheets. The largest patches of clearing for agricultureoccurred on the map sheets with the longest gap between base year andupdate year photography. The largest 43 patches, all greater than 101 ha intotal covered 8,812 ha. There were 117 patches, 50 ha or more in sizecovering in total 13,896 ha.
Only 13,434 ha of the area converted were recorded as having pasture orcrops on the land. The rest was either rough grazing with and without someminor cover retained (Peter Taylor Private Forest Tas, June 1999 pers.comm.).
Source

National Carbon Accounting System Technical Report 59
8: SOUTH AUSTRALIA
8.1 INTRODUCTIONSouth Australia (SA) is the State with the least areaof woodland and forest. Since European settlement,it has been extensively cleared for agriculturalproduction. Most of the clearing has been in theagricultural zone, about one-fifth of the State that hashigher rainfall and is generally suitable for pastureand crops. In 1975, about 75% of the zone had longbeen cleared. Over the next decade or so this rose to80%, mainly through clearing of remnants.
During the 1970s and early 1980s, the major areas ofclearance, and the main areas where pressurecontinued for clearing approval, were EyrePeninsula, especially the far west and north, theUpper and Lower Southeast and Kangaroo Island.
By the 1970s, the pioneering era of extensive landclearing for agricultural development had waned, inpart because of a severe scarcity of undevelopedarable land for expansion. Nevertheless, many leasesstill had a requirement to clear and there weretaxation incentives to do so. Other powerfulincentives to clear included a desire to expand thearea of productive land to accommodate the familyor simply to remain profitable. In addition, researchand development identified trace elements that, insmall amounts, could make poor soils on marginallands suitable for crops and pasture.
The period of rapid urban expansion had also ended.Although there was a greater demand for ruralresidential developments, these were often on landpreviously developed for agriculture and the needfor further clearing was minimal.
In the early 1980s Commonwealth taxationincentives were removed. About the same time,pressure increased from a public concerned at themassive scale of destruction of native vegetation andloss of its associated fauna. This resulted in theintroduction of State Government controls, whichgreatly slowed the rate of clearing. Under the Native
Vegetation Management Act of 1985, the Government
began offering financial assistance to landholdersprepared to protect remnant native vegetation. Morerecently, in 1991, the Native Vegetation Act waspassed. These measures were aimed at retainingnative vegetation and have effectively put an end tobroadscale clearing in SA.
Applications for clearing are now largely confinedto scattered remnant trees on land being developedfor vineyards, crops such as potatoes with pivotirrigation, and some olive orchards. The areaapproved for this type of clearing between April1991 and June 1995 was 147 ha.
8.2 MOTIVATORS FOR LAND CLEARANCE
Environmental and social influences
The 1950s and 1960s were a period of agriculturalexpansion by clearing in SA. A fairly common beliefwas that the bush harboured native and introducedpests, increased fire risk and was useful only asfirewood and rough farm timber, and this alsofavoured clearing.
This expansive period, when commodity priceswere high, continued into the 1970s. The need toexpand the family farm to accommodate childrenleaving school, but staying in the district to marryand establish families, was an important socialmotivator to clear. Such social patterns may nothave contributed as dramatically to the amount ofvegetation cleared as legal, economic andtechnological drivers, but they were generaland significant.
Availability of land
Most arable land had been cleared and developedprior to the period 1970-1990, which wasconsequently marked by a general scarcity of arableland for development.
Australian Greenhouse Office60
Clearing controls
In the early 1980s, removal of some of the economicconcessions reduced the incentive to clear. However,legislative controls introduced as a result ofwidespread concern by the urban community at theloss of wildlife habitat and plant and animal specieswere the main reasons for a dramatic reduction invegetation clearance.
The introduction of these controls was not greetedwarmly by many of the rural community and manyin the bureaucracy responsible for primary industry.This resulted in numerous meetings, negotiations, aHigh Court challenge and considerable stress formany farmers and their families.
Nevertheless, in 1983 the Crown Lands Act wasamended to remove the requirement in existinglease conditions to clear vegetation. Regulations tocontrol vegetation clearance were introduced underthe Planning Act 1982. The Native Vegetation
Management Act 1985 offered financial assistance tolandholders prepared to enter a Heritage Agreementto protect remnant native vegetation.
The Native Vegetation Act 1991 addressed the issuesof incentives and assistance to landholders tomanage native vegetation on their properties and tolimit clearing to circumstances that would facilitatethe efficient use of land for primary production.From April 1991 to June 1995 approval was given togeneral clearance for property management ononly 204 ha.
Re-vegetation is now generally a requirement of anyclearance approvals and there are financialincentives through Heritage Agreements andNatural Heritage Trust funding to encouragetree planting.
Financial and institutional incentives
Land development schemes
War Service Land Settlement schemes were in placelong before 1970. However, some of these were smallholdings which, beginning in the 1980s, may have
suffered from declining terms of trade, necessitatingmore extensive clearing and or amalgamation withneighbouring properties to expand the farmingenterprise.
Finance
Various taxation concessions and incentivesprovided under the Commonwealth Income Tax
Assessment Act provided economic drivers forclearing. Concessions under the Income Tax
Assessment Act were reduced over a number of years,finally being removed in the August Budget in 1983.
The establishment of the CommonwealthDevelopment Bank in 1965 made finance readilyavailable to farmers for land development, includingclearing. The success of this initiative saw otherfinancial institutions offer similar support of ruraldevelopment until the early 1980s.
Land tenure
Perpetual leases and agreements with covenant topurchase, which applied to almost 55% of theagricultural lands of the State, included arequirement to clear and maintain for cultivation orgrazing a specified area (generally the bulk of thelease) within ten years of allotment. The requirementwas repealed in 1983.
Local government rates were also levied and variedfrom district to district; the highest were generallyfor land adjacent to urban or suburban areas. Theincreased capital value of farmlands adjacent tosuburbs did not benefit landowners wishing toremain on the land. Indeed, the high rates oftenforced premature subdivision and/or clearance.
Land Tax was collected by the State Governmentand was based on an assessment of the unimprovedvalue of land. The value placed on land reflected itsdevelopment potential rather than its existing uses.For example, land used for primary productionreceived a statutory exemption of $40 000, but landheld for conservation purposes received no relief.

National Carbon Accounting System Technical Report 61
Succession and gift duty were also based on thevaluation of a property according to its developmentpotential, and in some instances the amount owingwas sufficiently large to force sale of all or part of aproperty. Subsequent pressures for land clearance tomet this potential were often inevitable.
Innovations: new breeds, techniques andpractices
New crops and pastures
Large parts of the agricultural regions of SA aredeficient in trace elements. The discovery thatapplication of small amounts of trace elements couldincrease productivity substantially was a majorbreakthrough for agriculture and contributed tomuch of the land clearance and development of theperiod 1970-1990. Experimentation with pasturecultivars led to the selection of new strains, whichenabled pastures to be established in areasunsuitable for existing strains.
New machinery and techniques
Technological improvements in machinery for broadscale clearance and cultivation on stony soilsimproved the economics of land clearance and led toan increase in the rate of clearing.
Market forces: new markets, changingcommodity prices
The 1950s and 1960s were decades of high prices formany rural commodities, and general nationalgrowth led to an expansion and intensification offarming. In some wheat-growing regions, such as themallee lands of SA, expansion and intensification ofcropping activities resulted in major clearing. Afterthe ‘wool boom’ of the mid-70s to mid-80s, decliningterms of trade and low commodity prices made itdifficult for small holdings to remain viable.Consequently, further land clearing was seen as oneway to maintain and/or expand production.
Terms of trade for pastoralists declined between 1970and 1990, but they increased for landholdersgrowing wheat, other grains and horticultural crops,
all enterprises entailing clearing for the conversionof grazing land.
New infrastructure
Most of the infrastructural support systems foragriculture were in place before the 1970s. Theseinclude access to major ports, storage and loadingfacilities, and irrigation systems on the MurrayRiver.
Urban expansion
The main period of urbanisation occurred before the1970s, but the demand for hobby farms has grown,for example, on Kangaroo Island. This has entailedsome clearing for housing and associated firehazard reduction, which is controlled by localgovernment regulation rather than the Native
Vegetation Act 1991.
8.3 DISTRIBUTION OF LAND CLEARINGBy comparison with other States and Territories,data on vegetation clearance in SA is substantial.Since the 1970s the State has collected remnantvegetation data to support vegetation managementpolicy initiatives. However, only rarely is therequantitative data available to make temporally andspatially accurate comparisons. It is not until theadvent of rigorous vegetation mapping from largescale (less than 1:60,000) air photography in the midto late 1980s and 1990s that quantitative informationbecame available. This mapping program however,has not been repeated to make a temporallycomparable analysis possible.
Information on the size distribution of clearingevents is also lacking. Early (1970s) informationtended to not include small (less than 25–100 ha)blocks in original or derived mapping exercises.More recent mapping programs have not beenrepeated. Size distribution of existing remnants isavailable from the more recent intensive mappingprograms, but is of little value in describing pastclearing event size distributions.

Australian Greenhouse Office62
Digital data sets covering the woody vegetation inSA are available for:
• 1976, based on air photo mosaics from 1967-1974;
• 1980, based on air photos (possibly includedair photo mosaics) from 1967-1978;
• 1989, based on visual interpretation of 19881:250,000 LANDSAT images; and
• 1998, based on air photos from 1984-1997/98
As all the data sets, except for 1998, did not includesmall areas (less than 100 ha), the distribution andfrequency of small area clearing eventsremain equivocal.
A detailed metadata of environmental data setsheld in South Australian Government agenciesis available.
Summary of land clearing rates and causes in the major zones of activity, SA, 1970-1990.
* following Thackway and Cresswell (1995)
<10,000 Wheat and woolproduction
Expansion of agriculturalarea, and somesecondary clearing ofremnants
Patch size: large
Vegetation cleared:mainly woodland
Eyre and Yorke Blocks
Eastern Ranges 10,000–100,000 Wool and wheatproduction; horticulturein the southern partaround the Murray River
Secondary clearing ofremnants
Patch size: mainly largepatch size
Vegetation cleared: woodland
Flinders and OlaryRanges, Murray DarlingDepression
Western <10,000 Wool production Patch size: large
Vegetation cleared:mainly woodland
Great Victoria Desert,Nullabor
South-east <10,000 Wool, beef and wheatproduction, someintensive horticulture,urban expansion
Secondary clearing ofremnants.
Patch size: mainly large,but small patch sizeassociated with urbanexpansion
Vegetation cleared:mainly woodland
Lofty Block, NaracoorteCoastal Plain
Zone Rate of clearing 1980-1990 (ha/yr)
Clearing patternBiogeographic regions(IBRA)*
Primary drivers
South-west

National Carbon Accounting System Technical Report 63
South-west zone
The south-west zone is an area of 6,066,100 haencompassing the Yorke Peninsula and EyrePeninsula. It is typified by undulating to occasionallyhilly calcarenite and calcrete plains and areas ofaeolian sands, with low open woodlands, malleewoodlands, shrublands and heaths.
Cereal cultivation and livestock grazing dominaterural land use in the Eyre and Yorke Block bioregion.Rotational cereal cultivation and livestock grazing ismore intensive in Yorke Peninsula than in Eyre.There is a small but important area of marketgardening on the northern plains adjacent Adelaide.
By the turn of the century, the upper part of theYorke Peninsula was all but cleared for cerealgrowing and grazing. The foot of the YorkePeninsula had been only patchily cleared by 1945and post-war developments for livestock and somecereal growing greatly extended the clearance.Similarly, the Eyre Peninsula underwent extensivepost-war clearance and development. Technologicalchanges brought clearance to the edges of the stonysheet calcrete country to open it for grazing. Much ofthe clearance represented intensification ofagriculture in established farming districts onbetter soils.
For the Yorke Peninsula, native vegetation clearancerates varied from 750 ha to 2,000 ha per annum, fromthe early-mid 1970s to mid 1980s, to 600 ha perannum, from the early-mid 1970s to late 1980s. Forthe mid 1980s to late 1980s, a rate of 100 ha perannum was reported.
For the Eyre Peninsula, native vegetation clearingrates varied from 23,000 to 38,000 ha per annumfrom the mid-late 1960s and mid 1970s to the mid1980s, to 20,000 ha per annum from the mid-late1960s and mid 1970s to the late 1980s. A rate of1,000 ha per annum was recorded for the mid 1980sto late 1980s.
Quantitative information on the size distribution ofclearing events in the Eyre and Yorke Blocksbioregion is not available in the pre-1980s data setsbecause information tended to not be collected forsmall (less than 25-100 ha) blocks. From anecdotalinformation, however, it is apparent that large scale(>50 ha) clearing events predominated up to themid 1980s for the Eyre Peninsula. Some minor, smallscale clearing took place in the 1970s and 1980s onYorke Peninsula, predominantly towards the south.
Eastern ranges
Murray-Darling Depression
Of the 197,480 ha of the Murray-Darling DepressionIBRA bioregion, 47,103 ha are located within SA.The Murray-Darling Depression is a gentlyundulating, sand and clay plain frequently overlainby aeolian dunes and vegetated with semi aridwoodlands, mallee shrublands and heath.
Much of the zone is marginal for cereal growing, theMurray-Darling Depression bioregion is mainlyused for sheep grazing and cereal growing. Irrigatedhorticulture and grazing dominate the alluvial flatsof the Murray River.
Large areas of the Murray-Darling Depressionbioregion, generally south of the River Murray,were extensively cleared immediately before andafter the Second World War, for livestock, mainlysheep grazing and more recently cereal cultivation.Stony ground south of Waikerie and east ofEudunda was cleared in the 1950s and 1960s, aswere the deep infertile sands north of Lameroo andPinnaroo. North of the River Murray, irrigatedhorticulture and viticulture and some cerealcropping in favourable years have extendedclearance to the north.
For the Murray-Darling, native vegetation clearancerates varied from 7,000 ha per annum from theearly 1970s to mid 1980s, and 3,000 ha per annum

Australian Greenhouse Office64
from the early 1970s to late 1980s, to 3,500 ha perannum from early 1970s to mid 1980s. For the mid1980s to late 1980s a rate of 1,500 ha per annum hasbeen documented.
Quantitative information on the size distribution ofclearing events in the Murray-Darling bioregion isnot available because few records were kept onblocks less than 25-100 ha in area. From anecdotalinformation, however, it is apparent that large scale(>50 ha) clearing events predominated in all areasup to the mid 1980s.
Western zone
The western zone comprises the Great VictoriaDesert and Nullabor Plain, where the climate is aridand the sparse woodland vegetation has been lightlycleared for sheep grazing, mainly to produce wool.
South-eastern zone
Lofty Block
The Lofty Block is a bioregion comprising 2,375,200ha of temperate uplands which include the AdelaideHills, Fleurieu Peninsula, Kangaroo Island and Midand Upper North (Thackway & Cresswell 1995).Once dominated by eucalypt open forests,woodlands and heaths, it is now largely cleared foragriculture and urban settlement. The Lofty Blockbioregion includes areas referred to in the literatureas the Mount Lofty Ranges, Kangaroo Island andMid North. Although considered to be part of thesouth-western zone, Eyre and Yorke Blocksbioregion, the Adelaide Plains have usually beenincluded as part of the Lofty Ranges bioregiondata sets.
The Lofty Block includes some of the mostproductive and intensively used agricultural landsin SA. Major land uses range from intensivehorticulture, conservation and cropping to extensivelivestock grazing. Urban, recreation, water storageand introduced pine plantation forestry are minoruses within the bioregion.
The Adelaide Plains were largely cleared by theearly twentieth century. The Mt Lofty Ranges andFleurieu Peninsula were cleared extensively, forsheep, cattle grazing and some improved pasture,after the Second World War. Clearance of KangarooIsland for improved sheep pasture also accelerateddramatically after the Second World War with WarService Land Settlement, and in the 1960s and 1970sthrough private development. In the Mid and UpperNorth, with the exception of the crests and upperslopes of ridges, good-soiled land was cleared forcereal growing and grazing.
For the Mt Lofty Ranges, native vegetation clearingrates varied from 2,500 ha per annum in the 1940s tolate 1960s, to 1,800 ha per annum in the late 1960s tomid 1970s, 1,400 ha per annum in the mid 1970s tomid 1980s, 250 ha per annum in the mid 1970s to late1980s, and 10 ha per annum in the mid 1980s to late1980s. Consents to clear broadacre native vegetationamounted 107 ha in the period 1983 to 1995, with67 ha of this approved to be cleared in 1983.
Native vegetation clearance rates on KangarooIsland varied from 2,250 ha per annum in the mid1970s to mid 1980s, to 4,200 ha per annum in themid 1970s to mid 1980s, 3,500 ha per annum fromthe mid 1970s to late 1980s, and 500 ha per annumfrom the mid 1980s to late 1980s.
Native vegetation clearing rates in the mid-north ofthe Lofty Block bioregion varied from 5,500 ha perannum in the mid 1960s to mid 1970s, to 1,000 haper annum in the mid 1960s to mid 1970s and 500 haper annum in the mid to late 1980s.
Quantitative information on the size distribution ofclearing events in the Lofty Block bioregion is notavailable for the pre-1980s because collatedinformation tended to not include small blocks.From anecdotal information, however, it is apparentthat up to the late 1970s, large scale (>50 ha) clearingevents predominated in all areas except the AdelaideHills. Small scale clearing predominated in the smallcadastral-sized blocks close to Adelaide, and whereremnant patch size was already small. Since the mid1980s, there has only been small area clearing.

National Carbon Accounting System Technical Report 65
Naracoorte coastal plain
Of the 2,890,500 ha Naracoorte Coastal Plainbioregion, 2,368,800 ha lie within the south-east ofSA. South Australian data normally refers to thisbioregion as the Lower and Upper South East. TheNaracoorte Coastal Plain is a broad coastal plain ofTertiary and Quaternary sediments with a regularseries of calcareous sand ridges separated by interdune swales. Vegetation is dominated by woodlandswith healthy understoreys and mallee shrublandswith wet heaths in the inter-dune swales(Thackway & Cresswell 1995).
Land use is dominated by livestock grazing, withdairying in the higher rainfall areas of the south,sheep grazing over much of the bioregion,especially the north, and beef cattle over theremainder. Horticulture is centred around MtGambier and increasing areas are turned toviticulture in the Coonawarra and Padthawaydistricts. Plantation forestry occurs in the higherrainfall areas of the south.
By the late 1940s, clearance in the South Australianpart of the Naracoorte Coastal Plain was of limitedextent, the majority being used for low intensitypastoralism on unimproved lands. Post-war thischanged dramatically. The combined State andCommonwealth War Service Land SettlementSchemes and AMP schemes, along with privatedevelopment for grazing, led to clearance ofover 350,000 ha.
For the Lower South East, native vegetation clearingrates varied from 1,700 to 3,000 ha per annum in theearly-mid 1970s to mid 1980s, to 1,500 ha perannum from the early-mid 1970s to late 1980s. A rateof 200 ha per annum was recorded for the mid 1980sto late 1980s.
In the Upper South East, native vegetation clearancerates varied from 9,500 to 10,500 ha per annum in thelate 1960s and early 1970s to mid 1980s, to 9,000 haper annum from the late 1960s and early 1970s to late1980s. From the mid 1980s to late 1980s a rate of700 ha per annum was recorded.
Quantitative information on the size distribution ofclearing events in the Naracoorte Coastal Plainbioregion is not available in the pre-1990s data setsbecause information was not often collected onsmall blocks. However, from anecdotal information,it is apparent that large scale clearing eventspredominated up to the mid 1980s.

Australian Greenhouse Office66
8.4 SELECT REFERENCES
Barson M. 1999. Remote Sensing of Agricultural Land
Cover Change 1990-1995 Results, Bureau of RuralSciences: Canberra.http://www.brs.gov.au/apnrb/landcov/alcc_results/
Best, L. 1996. The management of native vegetation: the
current situation. In: T. Dendy and J. Murray (eds.),From Conflict to Conservation Native VegetationManagement in Australia. South AustralianDepartment of Environment and NaturalResources: Adelaide.
Caldicott, R.C. 1980. Vegetation clearance in the Mount
Lofty Ranges, Mt Lofty Ranges Association Inc.Newsletter, August 1980.
Dendy, T. (no date). The impact of settlement on
Australian native vegetation and initiatives taken to
minimise negative impact – South Australia as a case
study. In: Xeric Australia Landscape Design andManagement.
Dendy, T. 1984. South Australian Heritage Agreement
Scheme and Clearance Controls. Paper to a symposium
on Small Natural Areas, Their Conservation and
Management. Newcastle, NSW.
Dendy, T. & Murray, J. (eds.) 1996. From Conflict to
Conservation. Native Vegetation Management in
Australia. Seminar proceedings Adelaide 21 November
1995, South Australian Department ofEnvironment and Natural Resources: Adelaide.
Environmental Protection Council of South Australia1993. The State of the Environment Report for South
Australia 1993, South Australian GovernmentPrinter: Adelaide.
Flavel, R. 1998. Vegetation of SA – 1998. Reportcompiled for Bureau of Resource Sciences as SAinput to Barson 1999.
Government of South Australia (GOSA) 1988. The
State of the Environment Report for South Australia.
South Australian Government Printer: Adelaide.
Graetz, D., Fisher, R. & Wilson, M 1992. Looking Back:
the Changing Face of the Australian Continent, 1972-
1992. CSIRO Office of Space Science &Applications,: Canberra.
Harris, C. 1976. Vegetation Clearance in South
Australia. Report of the Interdepartmental Committee
on Vegetation Clearance, South AustralianGovernment Printer: Adelaide.
Laut P., Heyligers, P.C., Keig, G., Loffler, E.,Margules, C. & Scott, R. M. 1977. Environments of
South Australia. Division of Land Use ResearchCSIRO: Canberra.
Lothian, J.A, (unpublished Mimeograph). Submission
to House of Representatives Select Committee on
Wildlife Conservation April 1971.
Lothian, J.A, 1985. Vegetation Clearance – Analysis of
Applications June 1983 – April 1985. SouthAustralian Department of Environment andPlanning: Adelaide.
Matheson W.E. (ed.) 1983. Annual Report of the
Advisory Committee on Soil Conservation 1982-1983.
Minister of Environment and Planning SouthAustralia 1983. News Release on Vegetation Clearance
Controls 12 May 1983.
Native Vegetation Council Annual Reports 1991-1992
to 1997-1998.
Native Vegetation Authority Annual Reports 1985-
1986 to 1993-1994.
Natural Resource Management Consultants(no date). Vegetation Clearance and Tree Decline.
First report to the Australian EnvironmentCouncil.
Nicolson, C. & Channon, B. (eds.) 1996.Environmental data sets held in South Australian
Agencies, 1996. Department of Housing and UrbanDevelopment, State of the EnvironmentReporting, Department of Environment andNatural Resources, and Department of theEnvironment, Sport and Territories.

National Carbon Accounting System Technical Report 67
Slee, D. 1976. Farmer Reaction to the Introduction of the
SA Clearance Controls. In: T. Dendy and J. Murray(eds.), From Conflict to Conservation NativeVegetation Management in Australia. SouthAustralian Department of Environment andNatural Resources: Adelaide.
South Australian Native Vegetation AuthorityAnnual Reports 1985-1986 to 1993-1994.
South Australian Native Vegetation Council Annual
Reports 1991-1992 to 1997-1998.
South Australian Government 1989. Vegetation
Clearance in South Australia, October 1989 (Third
Edition), South Australian Government Printer.
South Australian Government 1980. Vegetation
Clearance in South Australia, June 1980 (Second
Edition), South Australian Government Printer.
State of the Environment Report for South Australia
1998.
State of the Environment Report for South Australia
1993.
Thackway, R. and Cresswell, I.D. (eds) 1995, An
Interim Biogeographic Regionalisation for Australia:
A Framework for Setting Priorities in the National
Reserves System Cooperative Program. AustralianNature Conservation Agency, Canberra, ACT.Version 4, 31 March 1995.
Tideman, A.F. 1990. Half a Century of Soil
Conservation: a Brief History of the South Australian
Advisory Committee on Soil Conservation 1940-1990.
Department of Agriculture: South Australia.
United Farmers & Stockowners of South AustraliaInc. 1985. Native Vegetation Report to the Select
Committee of Enquiry into the Supplementary
Development Plan.
Williams, M. & Goodwin, D. 1989. Conservation of
Biological Diversity on the Fleurieu Peninsula II.
South Australian Naturalist 63 (3).
Williams, M. & Goodwin, D. 1988. Conservation of
Biological Diversity on the Fleurieu Peninsula I.
South Australian Naturalist 63 (2).

Australian Greenhouse Office68
Summary of data on clearing in SA, 1970-1990, and their source.
Region
All
Source
Matheson 1983
Description of data
Table 2 provides a summary from 1945-1983 of the annual soilconservation works under the Soil Conservation Act, sourced from SoilConservation Act Annual Reports. Information is provided on areasinspected, based on areas for which an application had been made to clearunder the Soil Conservation Act. No details are currently available on areasgiven permission to clear.
Records remaining vegetation based on air photo mosaics, 1967-1974, forall Hundreds in southern agricultural regions of SA, arranged by County andregion. Harris holds original detailed cadastral plans showing remainingvegetation.
Map at 1:1,000,000 scale based on air photos mosaics from 1967-1974,showing cleared and uncleared agricultural land. Exact distribution of datesof air photo mosaics used difficult to determine.
Digital data set based on Harris (1976) and 1967-1978 aerial photographyand updated in some areas with more recent 1978 aerial photography forthe South East, Kangaroo Island, Lower Eyre Peninsula and with 1975 aerialphotography for northern Murray Mallee, Northern Yorke Peninsula andNorthern agricultural. Map does not show remnant areas less thanapproximately 100 ha.
Digital data set based on visual interpretation of February and March 1988LANDSAT 1:250,000 images, and map produced at 1,000,000 scale.Remnant areas less than approximately 25 ha not captured. Map does notshow remnant areas less than approximately 100 ha. The 1989 map hasadditional information showing degraded vegetation and areas cleared.
Compiled vegetation map from a range of datasets ranging from 1985onwards, based on detailed air photo analysis at 1:25,000 to 1;40,000scales.
Detailed spatial and temporal data set on Access database of areas forwhich permission has been granted to clear with and without conditions.Data classified into broadacre, wood collecting, brush collecting andscattered trees. Data for broadacre consent with and without conditionsrepresents most appropriate data for Greenhouse gas inventory analysis.Broadacre consents with or without conditions from Native VegetationAuthority Annual Reports are: 127,500 ha/annum from May 1983 to Nov1985, 21,000ha/annum from November 1985-1990 and 5,000 ha/annum for1991-1995. Spatial analysis of the data are somewhat difficult due tochanges in the digital cadastral data base. Many sections of nativevegetation for which a clearance application has been granted have beensubdivided and are no longer recorded in the DCDB. A trial (Craig WhissonDEHAA, pers. comm.) indicated that approx 40% of the Lower South-Eastclearance permit data could not be mapped accurately. However, all datacould be placed into IBRA bioregions based on Hundreds rather thanSection numbers.
Harris 1976
Harris 1976
SA Government 1980
SA Government 1989
Flavel 1998
Vegetation clearance in SA(DEHAA data base)

National Carbon Accounting System Technical Report 69
Region
All
Source
State of Environment Report1993
Description of data
Table 7.5 in SoE Report provides regional data for native vegetationremaining in Agricultural districts of SA for 1975, and that remainingoutside NPWS Reserves January 1988. Information is probably based ondigital data sets for 1978 and 1988. The 1978 digital data is based on1967–1978 air photographs and air photo mosaics. Records approximately651,600 ha (54,000 ha per annum) of native vegetation cleared over this12 year period or approximately 65,000 ha per annum if a ten year intervalis used. The SoE also reports (page 106) that 478,000 ha was clearedbetween 1975 and introduction of clearance controls in November 1983;a maximum rate of approximately 60,000 ha per annum over this 8 yearperiod. The SoE data is sourced and updated from Vegetation Clearance inSA in 1985-86 – Native Vegetation Authority’s Annual Report (Table 3)covering the years 1976-1985. The clearing rate of 651,000 ha over this9 year period is approximately 72,400 ha per annum. Table 3 in VegetationClearance in SA in 1985-86 – Native Vegetation Authority’s Annual Report islikely to be generally comparable with 1988 data in SoE 1993 to provide anindicative rate from 1985 to 1988 the first three years after the introductionof clearance controls.
Table 3 records a reduction from 3,767,000 ha of native vegetation outsideNPWS reserves in 1976 (based on Harris air photo mosaics from1967–1974) to 3,126,400 ha in 1985.
Table 3 NVA Annual Report records a reduction from 3,126,400 ha in 1985to 3,115,373 ha in 1988 (SOE Report 1993) – a rate of approximately4,500 ha over this 2.5 year period.
Provides regional data for native vegetation remaining in Agriculturaldistricts of SA for 1974 and 1984, based on data sets from Harris 1976(who used 1967-1974 air photo mosaics) and an extrapolated figure of 33%clearing for all regions from Nature Conservation Society’s 1981 vegetationsurveys in Lower South East. On these assumptions an annual clearancerate for Agricultural Districts of SA would be approximately 100,000 ha perannum for the 10 year period 1974–1984.
Chronoflex maps of Mt Lofty Ranges in 1945 and 1968 showing nativevegetation transposed from 1:63,360 Military Ordnance maps, ‘all but twoof the twelve maps were produced immediately prior to or during the lastwar’ (green layer interpretation; about late 1930s to early 1940s), and1965-1968 air photos of unknown scale for 1968 maps transposed fromair photos on to 1:63,360 scale maps and then reduced to 1:250,000 scale.
Very detailed 1:250,000 maps held by Andrew Lothian (DEHAA). Used asbasis for updated work by Caldicott 1980.
Approximately 1,800 ha per annum clearance of native vegetation inMt Lofty region in the 6 year period from 1968-1974, a reduction from2,500 ha in the 23 year period from 1945-1968. Information based onLothian submission above and resurveyed by Caldicott in 1974.
Digital data set: derived information for which may be available on requestfrom SA Planning. Based on this 1985 data set, 379 patches (larger than0.5 ha) of native vegetation 10 ha or under and 280 patches 5 ha or underwere recorded on the Fleurieu Peninsula (southern part of Lofty Block IBRABioregion).
Native Vegetation Authority’sAnnual Report 1986
Native Vegetation Authority’sAnnual Report 1985-1986;State of Environment Report1993
Dendy 1984
Lofty Block –Mt Lofty Ranges partof Lofty Block
Andrew Lothian Submission toHouse of RepresentativesSelect Committee on WildlifeConservation April 1971.
Caldicott 1980
Williams & Goodwin 1989

Australian Greenhouse Office70
Description of data
Records a reduction from 41,000 ha in 1974 to 27,000 in 1984 for Mt LoftyRanges; a rate of approximately 1,400 ha per year, though the date of theair photos sources is not given. The 1974 data is based on Harris data(1976), although the air photo mosaics for this area are likely to be 1972and 1973.
Table 7.5 records a reduction from 39,700 ha to 36,787 ha in the period1975 (Harris, 1976) to January 1988; a rate of approximately 250 ha peryear. These data do not include areas less than approximately 100 ha.
Table 3 NVA Annual Report records a reduction from 36,800 ha in 1985 to36,787 ha in 1988 (SOE Report 1993) – a rate of less than 10 ha perannum over this 2.5 year period.
For Mt Lofty Ranges: Table 3 records a reduction from 39,700 ha of nativevegetation outside NPWS reserves in 1976 (based on Harris air photomosaics of c. 1974) to 36,800 ha in 1985 – a rate of approximately 250 haper annum over this 11 year period.
Consents for broadacre clearance of native vegetation from 1983 – 1995 inthe Mt Lofty Ranges amount to a total of 107 ha, with 67 ha of thisapproved to be cleared in 1983.
Graetz’s 1980-1990 clearance rate data supplied by AGO for Lofty Blockbioregion (a larger area than the Mt Lofty Ranges region as used in thistable) is an order of magnitude greater than that provided by SAinterviewees and published information for 1945 through to 1995. Graetzrecords (as supplied by AGO) an annual average rate of clearing in the LoftyBlock bioregion of 23,400 ha per annum.
Reports a reduction from 68,203 ha (outside NPWS Reserves) to 45,969 hain the years 1974 (Harris data based on c. 1974 air photo mosaics) to 1984– a rate of 2,250 ha per annum over this 10 year period.
Table 7.5 records a reduction from 95,000 ha in 1975 (Harris data based on1974 air photo mosaics) to 47,730 ha in 1988 – a rate of approximately3,500 ha per annum over this 14 year period.
For Kangaroo Island: Table 3 records a reduction from 95,000 ha of nativevegetation outside NPWS reserves in 1976 (based on Harris air photomosaics of 1974) to 48,800 ha in 1985 – a rate of approximately 4,200 haper annum over this 11 year period.
Table 3 NVA Annual Report records a reduction from 48,800 ha in 1985 to47,730 ha in 1988 (SOE Report 1993) – a rate of approximately 500 ha overthis 2.5 year period
Mid and Upper North: a reduction from 483,168 ha (outside NPWSReserves) in 1974 (Harris data based on 1967 air photo mosaics) to390,723 ha in 1984 – a rate of approximately 5,500 ha per annum over this17 year period.
Table 7.5 records a reduction for the Mid-North from 987,200 ha in 1975(Harris data based on 1967 air photo mosaics) to 968,009 ha in 1988 –a rate of approximately 1,000 ha per annum over this 21 year period.
Region
Lofty Block –Mt Lofty Ranges partof Lofty Block
Source
Dendy 1984
State of Environment Report1993
Native Vegetation Authority’sAnnual Report 1985-1986;State of Environment Report1993
Native Vegetation Authority’sAnnual Report 1985-1986
Vegetation clearance in SA(DEHAA data base)
Graetz, EOC, unpublished data
Lofty Block –Kangaroo Island part
Dendy 1984
State of Environment Report1993
Native Vegetation Authority’sAnnual Report 1985-1986
Native Vegetation Authority’sAnnual Report 1985-1986;State of Environment Report1993
Lofty Block –Mid North
Dendy 1984
State of Environment Report1993

National Carbon Accounting System Technical Report 71
Description of data
For Mid North, Table 3 records a reduction from 987,200 ha of nativevegetation outside NPWS reserves in 1976 (based on Harris air photomosaics of 1967) to 969,200 ha in 1985 – a rate of approximately 1,000 haper annum over this 18 year period.
Table 3 NVA Annual Report records a reduction from 969,200 ha in 1985 to968,009 ha in 1988 (SOE Report 1993) – a rate of approximately 500 haover this 2.5 year period.
Murray Mallee: a reduction from 245,011 ha (outside NPWS Reserves) in1974 (Harris data based on early 1970s air photo mosaics) to 164,157 ha in1984 – a rate of approximately 7,000 ha per annum over this approximately12 year period.
Table 7.5 records a reduction for the Murray Mallee from 529,000 ha in1975 (Harris data based on early 1970s air photo mosaics) to 481,256 ha in1988 – a rate of approximately 3,000 ha per annum over this 16 yearperiod.
For Murray Mallee Table 3 records a reduction from 529,000 ha of nativevegetation outside NPWS reserves in 1976 (based on Harris air photomosaics of early 1970s) to 485,300 ha in 1985 – a rate of approximately3,500 ha per annum over this 13 year period.
Table 3 NVA Annual Report records a reduction from 485,300 ha in 1985 to481,256 ha in 1988 (SOE Report 1993) – a rate of approximately 1,500 haover this 2.5 year period.
Records for Lower South-East: reduction from 53,447 ha (outside NPWSReserves) in 1974 (Harris, based on 1973 air photo mosaics) to 29,100 hain 1984 (based on Nature Conservation Society of SA figures, 1981, fromon air photos of unknown age) – a rate of approx. 3,000 ha per annum overan approximate 8 year period.
Upper South-East: a reduction from 408,225 ha (outside NPWS Reserves)in 1974 (Harris data based on 1967 and 1973 air photo mosaics) to273,531 ha in 1984 – a rate of approx. 9,500 ha per annum over this 14year period.
Table 7.5 records a reduction for the Lower South east from 69,400 ha in1975 (Harris data based on 1973 air photo mosaics) to 48,540 ha in 1988 –a rate of approximately 1,500 ha per annum over the 15 year period.
Table 7.5 records a reduction for the Upper South East from 256,900 ha in1975 (Harris data based on 1967 and 1973 air photo mosaics) to 98,015 hain 1988 – a rate of approximately 9,000 ha per annum over this 18 yearperiod.
For Lower South East, Table 3 records a reduction from 69,400 ha of nativevegetation outside NPWS reserves in 1976 (based on Harris air photomosaics of 1973) to 48,900 ha in 1985 – a rate of approximately 1,700 haper annum over the 12 year period.
For Upper South East, Table 3 records a reduction from 256,900 ha ofnative vegetation outside NPWS reserves in 1976 (based on Harris airphoto mosaics of 1967 and 1973) to 99,700 ha in 1985 – a rate ofapproximately 10,500 ha per annum over this 15 year period.
Region
Lofty Block –Mid North
Source
Native Vegetation Authority’sAnnual Report 1985-1986
Native Vegetation Authority’sAnnual Report 1985-1986;State of Environment Report1993
Murray-DarlingDepression
Dendy 1984
State of Environment Report1993
Native Vegetation Authority’sAnnual Report 1985-1986
Native Vegetation Authority’sAnnual Report 1985-1986;State of Environment Report1993
Naracoorte CoastalPlain
Dendy 1984
Dendy 1984
State of Environment Report1993
State of Environment Report1993
Native Vegetation Authority’sAnnual Report 1985-1986
Native Vegetation Authority’sAnnual Report 1985-1986

Australian Greenhouse Office72
Description of data
Table 3 NVA Annual Report records a reduction for Lower South East from48,900 ha in 1985 to 48,540 ha in 1988 (SOE Report 1993) – a rate ofapproximately 200 ha over this 2.5 year period.
Table 3 NVA Annual Report records a reduction for Upper South East from99,700 ha in 1985 to 98,015 ha in 1988 (SOE Report 1993) – a rate ofapproximately 700 ha over this 2.5 year period.
Dendy records for Yorke Peninsula a reduction from 57,878 ha (outsideNPWS Reserves) in 1974 (Harris data based on 1974 air photo mosaics) to38,778 ha in 1984 – a rate of approximately 2,000 ha per annum over this10 year period.
For the Eyre Peninsula: a reduction from 1,590,584 ha (outside NPWSReserves) in 1974 (Harris data based on 1967 to 1974 air photo mosaics)to 1,065,691 ha in 1984 – a rate of approximately 38,000 ha per annumover a c. 14 year period.
Table 7.5 records a reduction for the Yorke Peninsula from 67,400 ha in1975 (Harris data based on 1974 air photo mosaics) to 59,140 ha in 1988 –a rate of approximately 600 ha per annum over this 14 year period.
Table 7.5 records a reduction for Eyre Peninsula from 1,722,400 ha in 1975(Harris data based on 1967 to 1974 air photo mosaics) to 1,375,596 ha in1988 – a rate of approximately 20,000 ha per annum over a c. 18 yearperiod.
For Yorke Peninsula, Table 3 records a reduction from 67,400 ha of nativevegetation outside NPWS reserves in 1976 (based on Harris air photomosaics of 1974?) to 59,300 ha in 1985 – a rate of approximately 750 haper annum over this 11 year period.
For Eyre Peninsula, Table 3 records a reduction from 1,722,400 ha of nativevegetation outside NPWS reserves in 1976 (based on Harris air photomosaics of 1967 to 1974) to 1,378,400 ha in 1985 – a rate of approximately23,000 ha per annum over a c. 15 year period.
Table 3 NVA Annual Report records a reduction for Yorke Peninsula from59,300 ha in 1985 to 59,140 ha in 1988 (SOE Report 1993) – a rate ofapproximately 100 ha over this approximately 2.5 year period.
Table 3 NVA Annual Report records a reduction for Eyre Peninsula from1,378,400 ha in 1985 to 1,375,596 ha in 1988 (SOE Report 1993) – a rateof approximately 1,000 ha over this 2.5 year period.
Source
Native Vegetation Authority’sAnnual Report 1985-1986;State of Environment Report1993
Region
Naracoorte CoastalPlain
Native Vegetation Authority’sAnnual Report 1985-1986;State of Environment Report1993
Eyre and YorkeBlocks
Dendy 1984
Dendy 1984
State of Environment Report1993
State of Environment Report1993
Native Vegetation Authority’sAnnual Report 1985-1986
Native Vegetation Authority’sAnnual Report 1985-1986
Native Vegetation Authority’sAnnual Report 1985-1986;State of Environment Report1993
Native Vegetation Authority’sAnnual Report 1985-1986;State of Environment Report1993

National Carbon Accounting System Technical Report 73
9: WESTERN AUSTRALIA
9.1 INTRODUCTIONWestern Australia (WA) has a distinctive history ofagricultural development characterised by large-scale releases of Crown Land in relatively recenttimes. There have been numerous incentives forpeople to take up the new land and commence landclearing. In the early 1960’s the Government of WAhad a stated policy of developing and releasing‘a million acres a year’, and a buoyant culture ofdevelopment prevailed until the 1980s.
Private economic gain was the primary driver forclearing at the farm level, but in many areas clearingmay not have occurred at all, and certainly not at thesame rate, without the support of a constellation ofsubstantial government incentives. Nevertheless,land development was fundamentally driven byagricultural research and development, whichidentified trace elements, fertilisers and new cropvarieties that enabled poorer lands to be releasedand cleared for production. Agricultural expansionwas further aided by increased availability ofreticulated water, through water supply schemes.
Almost all native vegetation clearance in the statehas been in the wheatbelt, woolbelt and coastalagricultural zones of the southwest. Nevertheless,significant clearance has also occurred in the PerthMetropolitan Region.
By contrast, clearing for cropping or grazing isgenerally not allowed in the Pastoral Zone, whichmore-or-less comprises all but the southwest cornerof the State. There are small areas of clearingassociated with horticulture in the Ord RiverIrrigation Scheme and on the Fitzroy River but theseare insignificant in terms of the total area of thePastoral Zone. The Zone also supports a number ofmining enterprises but these do not involvesignificant clearing.
A substantial portion of the southwest was clearedquite recently, between 1945 and 1982. From the late1960s, the scale of land clearing in the AgriculturalZone – centred around the Avon Wheatbelt, theMallee and the Esperance Plain – was vast. Profitsfrom cropping were lucrative and there were alsomore sources of finance through sources such as thenewly-established Commonwealth DevelopmentBank. Incentives to clear included the availability ofcheap land, large machinery and a waterinfrastructure, combined with the development ofsoil science enabling the cultivation of poorer lands.
Declining profit margins in the 1980s led to newlarger holdings, with ‘industrial-scale’ farming thatfavoured broadacre clearing of new land, orconsolidation and rationalisation of existingholdings. In the late 1980s, with a dramatic declinein availability of arable land and much of theremaining vegetation fragmented, the rate ofclearing began to decrease.
The development of the southwest has left anindelible legacy of change to the native vegetationof WA. Associated with the change are a plethora ofproblems, such as salinity and soil loss, that threatenboth the production and conservation values of thefragile land. As a result, the 1980s saw theintroduction of clearing controls, which reflectedaltered attitudes to land management, bringing anend to the era of expansion. The focus shifted fromclearing to expand productive land, to protection forboth production and conservation.
9.2 MOTIVATORS FOR LAND CLEARANCE
Environmental and social influences
Until the emergence of the minerals boom in the1960s, agriculture was the only major primaryindustry that could produce significant wealth forWA. After World War I, agriculture was seen as theonly way of decreasing dependence on theCommonwealth Government, perceived by WesternAustralians to favour the eastern states. Thus, aculture of independence grew up, based on apioneering attitude toward development of the land

Australian Greenhouse Office74
for agricultural production. There was a perceptionthat crops and livestock could thrive even on the lightsandy soils and a widespread feeling of invincibility.
Successful landholders stood for election to localgovernment and became a dominant voice on ruralcouncils that would then lobby State Governments formore development in their area. Local governmentdecision making, ranging from road maintenance tothe issuing of fire permits to burn large areas ofpulled native vegetation, also reflected a favourableattitude to agricultural development.
The ready availability of land often meant that it wasbought by inexperienced farmers. There was littleappreciation of natural resource management orproperty planning, so farmers cleared entirepaddocks without fencing out any remnantvegetation. The failure rate of farming enterprises washigh, resulting in amalgamation of neighbouringproperties, which sometimes led to further clearing torecover the costs of the takeover.
From the time of establishment of the livestockindustry, in many parts of southern WA there havebeen heavy stock losses through the ingestion ofpoisonous plants. Among other toxins, there are highamounts of naturally occurring toxin 1080 in thenative vegetation of this part of the State.Shepherding of sheep through native vegetationproved impossible, so extensive clearing and fencingbecame the only way to keep livestock alive. In theearlier settled regions, such as the Avon Wheatbeltand Western Coolgardie, some areas of poisonousplants were left uncleared because they were fencedoff or otherwise avoided. These areas have remaineduncleared, and many have now been reserved. Onproperties developed during the era of expansion,when it became easy and economically feasible toclear large tracts, wholesale clearing was used toremove areas of poisonous plants. This was the casein the Mallee and Esperance Plains bioregions, wherepoisonous plants were a major disincentive formaintaining windbreaks and other patches ofremnant vegetation as part of the landscape.
Availability of land
The availability of large areas of uncleared land fortotally new development was a major driver forclearing, eventually attracting farmers from theeastern States. Land development schemes, taxationincentives and ready finance all facilitated theprocess. By the 1980s the scarcity of unused arableland and degradation of existing farmland, led to theimposition of clearing controls and a dramaticdecrease in the rate of clearing.
Clearing controls
Between 1980 and 1983 there were severe dust stormsin many parts of the wheatbelt. These storms and thevery evident soil erosion they caused received a greatdeal of media attention. Public concern led to achange in attitude to land clearing and naturalresource management.
The government began to actively promote soilconservation and land care activities allowing fargreater community involvement in land managementpolicies. Clearing controls were gradually introducedfirstly to protect water catchments from salinity, andlater to halt the processes of land degradationmore broadly.
As early as the 1960s, clearing controls wereintroduced to protect water supplies against salinityin some major water catchments. These early bans onalienation of Crown Land were followed by thegradual introduction, beginning in 1976, of clearingcontrols to prevent further land degradation, imposedon private lands. In some cases, it was reported thatimpending clearing controls had a perverse effect,leading to a temporarily increased rate of clearing.For example, in the Jarrah-Forest bioregion(Thackway & Cresswell 1995), anecdotal evidencesuggests that the more stringent controls applied in1976 were preceded by increased clearing aslandholders were aware that a license to clear wouldbecome difficult to obtain.

National Carbon Accounting System Technical Report 75
Financial and institutional incentives
Land development schemes
The Conditional Purchase scheme (CP) was a majorincentive for land development. First introduced inthe early period of settlement to encourageagriculture, the scheme was reinvigorated in 1961 andcontinued until 1982. Under the CP scheme, largeareas of land were released in the Agricultural Zone.In the early years, it was possible for nearly allapplicants to be granted a farming property. Sir DavidBrand, premier of WA in the 1960s, proudly claimedthat, under the CP scheme, ‘a million acres a year’were released.
Properties in the scheme came at an extremely lowcost, the equivalent of twenty-five cents per ha in 1999currency. Each block was also heavily supported byState Government funds in that:
• it had been fully surveyed and all legal workcompleted;
• it had road access provided by Government;and
• a telephone service was extended to all newdevelopment blocks.
Towards the end of the 1960s demand increased aslandholders and others in the east became aware ofthe CP scheme and saw it as a golden opportunity toestablish themselves or their children on the land.Ballots were introduced to deal with the increasein applicants.
A condition of taking up a property was that a certainproportion had to be cleared within a given period.This requirement often led to over-clearing. Thepresence of plants that were poisonous to stock meantthat remaining native vegetation had to be fenced offand such extra expenditure was not seen as necessary.Thus, some farmers cleared entire paddocks.
Initially, some lands of poorer quality were excludedfrom the CP. However, the demand for moreagricultural land and successful clearing of the bettercountry encouraged eventual expansion into marginal
land. There was also an emerging awareness thatsome lands should be set aside and this was done.However, it meant that landholders could clear all ofthe larger holdings they obtained without anyexpectations of leaving marginal land undernative vegetation.
It is said that during the height of the CP schemethere was more land being released and farmscreated than there were skilled farmers to managethem. Consequently, there was a high failure rateand many of the initial landholders sold theirproperties to successful neighbours. Frequently,these neighbours had borrowed heavily and had toclear rapidly and plant crops to pay their debts.
The CP scheme continued until 1982 when the lastland was released. A realisation that landdegradation was a real issue and the concern toconserve the last remnants of the large tract of landinitially involved for biodiversity conservationbrought the CP scheme to a relatively recent close.
Throughout the 1970s, major agricultural expansionoccurred in the Mallee and Esperance Plain regions.Corporate farming was actively encouraged by theState Government, and particularly aided in theEsperance Plain by the passing of the EsperanceLand Development Act 1968. This granted specialprivileges to a private United States consortiumincluding the Chase Manhattan Bank, allowing it todevelop large areas and then sell holdingsto individuals.
Development of Avon Wheatbelt and WesternCoolgardie area occurred largely prior to the 1970s,aided by many of the earlier War Service and GroupSettlement schemes. In these areas land clearing wasa slower process because the area was settled earlierwhen clearing was more difficult and the holdingswere smaller. Third class land was classified asmarginal and it was expected that landholderswould not clear it. Invariably, they did clear toincrease the area of productive land on theirsmall holdings.
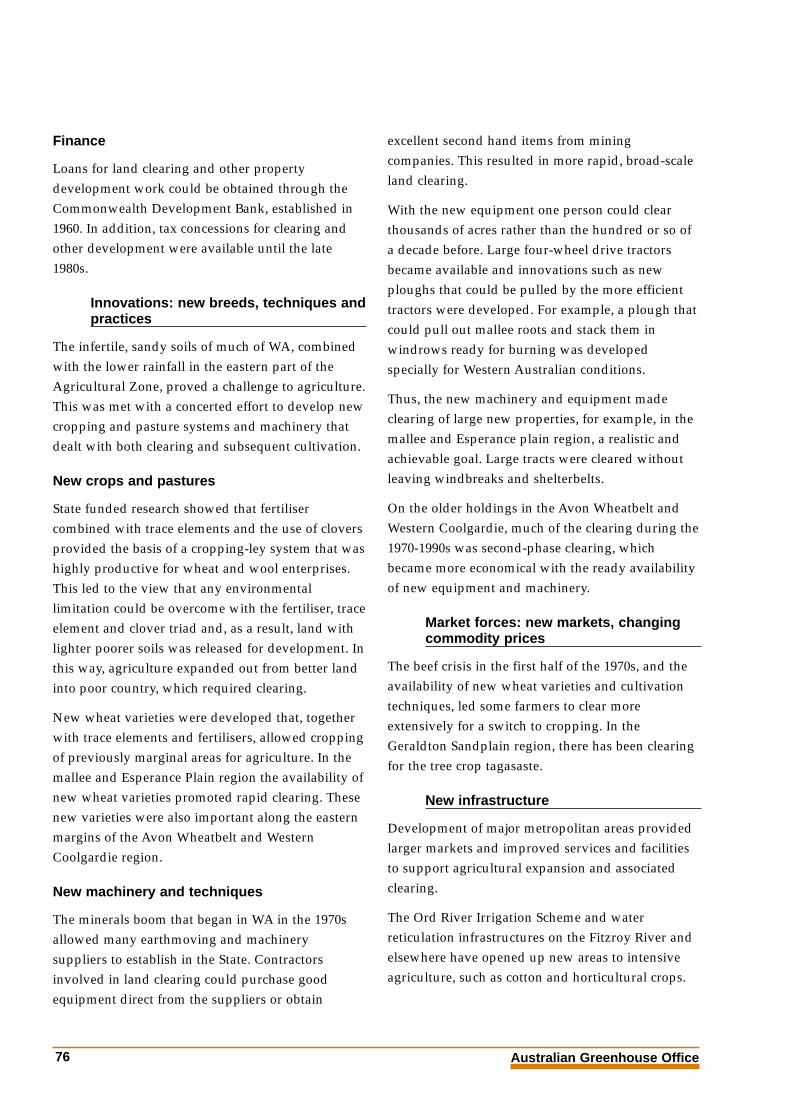
Australian Greenhouse Office76
Finance
Loans for land clearing and other propertydevelopment work could be obtained through theCommonwealth Development Bank, established in1960. In addition, tax concessions for clearing andother development were available until the late1980s.
Innovations: new breeds, techniques andpractices
The infertile, sandy soils of much of WA, combinedwith the lower rainfall in the eastern part of theAgricultural Zone, proved a challenge to agriculture.This was met with a concerted effort to develop newcropping and pasture systems and machinery thatdealt with both clearing and subsequent cultivation.
New crops and pastures
State funded research showed that fertilisercombined with trace elements and the use of cloversprovided the basis of a cropping-ley system that washighly productive for wheat and wool enterprises.This led to the view that any environmentallimitation could be overcome with the fertiliser, traceelement and clover triad and, as a result, land withlighter poorer soils was released for development. Inthis way, agriculture expanded out from better landinto poor country, which required clearing.
New wheat varieties were developed that, togetherwith trace elements and fertilisers, allowed croppingof previously marginal areas for agriculture. In themallee and Esperance Plain region the availability ofnew wheat varieties promoted rapid clearing. Thesenew varieties were also important along the easternmargins of the Avon Wheatbelt and WesternCoolgardie region.
New machinery and techniques
The minerals boom that began in WA in the 1970sallowed many earthmoving and machinerysuppliers to establish in the State. Contractorsinvolved in land clearing could purchase goodequipment direct from the suppliers or obtain
excellent second hand items from miningcompanies. This resulted in more rapid, broad-scaleland clearing.
With the new equipment one person could clearthousands of acres rather than the hundred or so ofa decade before. Large four-wheel drive tractorsbecame available and innovations such as newploughs that could be pulled by the more efficienttractors were developed. For example, a plough thatcould pull out mallee roots and stack them inwindrows ready for burning was developedspecially for Western Australian conditions.
Thus, the new machinery and equipment madeclearing of large new properties, for example, in themallee and Esperance plain region, a realistic andachievable goal. Large tracts were cleared withoutleaving windbreaks and shelterbelts.
On the older holdings in the Avon Wheatbelt andWestern Coolgardie, much of the clearing during the1970-1990s was second-phase clearing, whichbecame more economical with the ready availabilityof new equipment and machinery.
Market forces: new markets, changingcommodity prices
The beef crisis in the first half of the 1970s, and theavailability of new wheat varieties and cultivationtechniques, led some farmers to clear moreextensively for a switch to cropping. In theGeraldton Sandplain region, there has been clearingfor the tree crop tagasaste.
New infrastructure
Development of major metropolitan areas providedlarger markets and improved services and facilitiesto support agricultural expansion and associatedclearing.
The Ord River Irrigation Scheme and waterreticulation infrastructures on the Fitzroy River andelsewhere have opened up new areas to intensiveagriculture, such as cotton and horticultural crops.
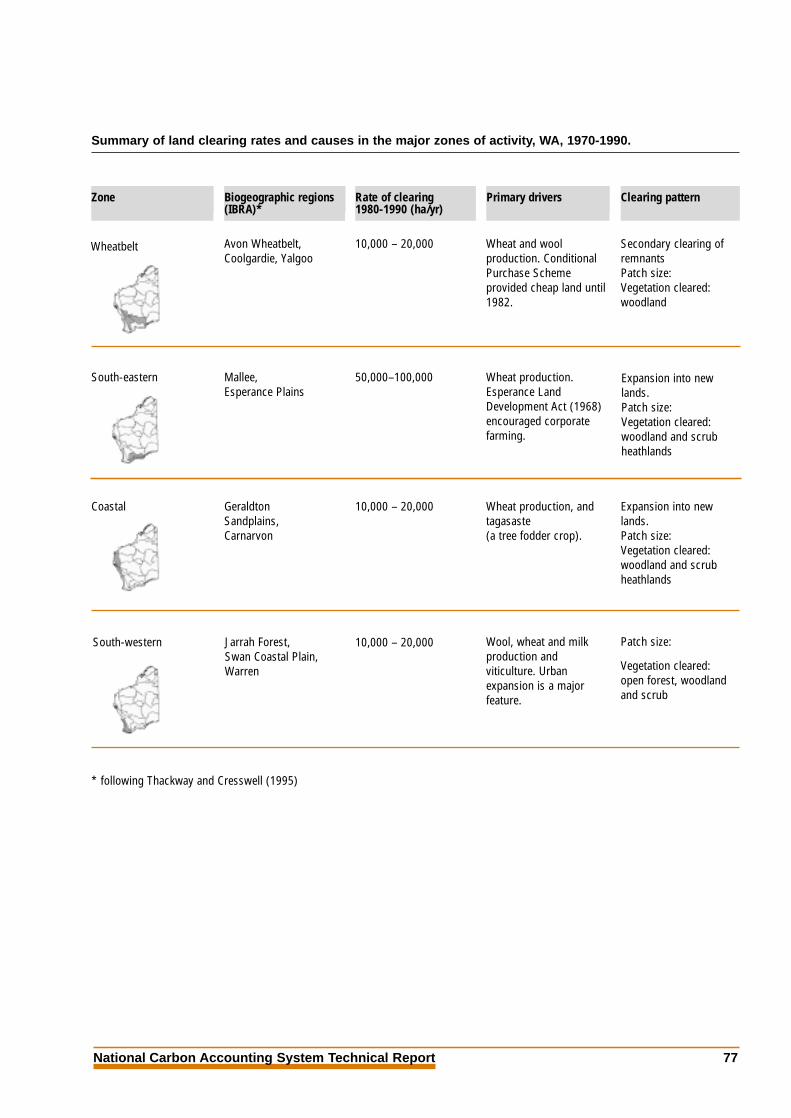
National Carbon Accounting System Technical Report 77
Summary of land clearing rates and causes in the major zones of activity, WA, 1970-1990.
* following Thackway and Cresswell (1995)
Wheatbelt 10,000 – 20,000 Wheat and woolproduction. ConditionalPurchase Schemeprovided cheap land until1982.
Secondary clearing ofremnantsPatch size:Vegetation cleared:woodland
Avon Wheatbelt,Coolgardie, Yalgoo
South-eastern 50,000–100,000 Wheat production.Esperance LandDevelopment Act (1968)encouraged corporatefarming.
Expansion into newlands. Patch size:Vegetation cleared:woodland and scrubheathlands
Mallee,Esperance Plains
Coastal 10,000 – 20,000 Wheat production, andtagasaste (a tree fodder crop).
Expansion into newlands.Patch size:Vegetation cleared:woodland and scrubheathlands
Geraldton Sandplains,Carnarvon
South-western 10,000 – 20,000 Wool, wheat and milkproduction andviticulture. Urbanexpansion is a majorfeature.
Patch size:
Vegetation cleared: open forest, woodlandand scrub
Jarrah Forest,Swan Coastal Plain,Warren
Zone Rate of clearing 1980-1990 (ha/yr)
Clearing patternBiogeographic regions(IBRA)*
Primary drivers

Australian Greenhouse Office78
Urban expansion
Around ninety per cent of the population of WAresides on the Swan Coastal Plain. It has beenextensively cleared since the establishment of thecolony in 1829.
Between 1970 and 1990, significant urban expansionand rural residential development occurred in thesouthwestern coastal areas of the State. This is likelyto have involved substantial clearing of small areasof land. There are a variety of continuing reasons forclearing, including intensive agriculture, particularlyhorticulture and viticulture.
With the introduction of clearing controls and theend of the expansion era of the 1960s and 70s, therate of clearing for agriculture has declined. Hence,clearing for urban expansion and rural residentialdevelopment may now exceed that for agriculture.
9.3 DISTRIBUTION OF LAND CLEARINGAlmost all native vegetation clearing has occurred inthe south-west region of WA, particularly in theAvon Wheatbelt, Jarrah Forest, Esperance Plains,Warren, Mallee, Swan Coastal Plain and Gascoynebiogeographic regions. These regions include thewheatbelt, woolbelt and coastal agricultural zones.
According to Beeston (1996), since the introductionof regulations under the Soil and Land Conservation
Act 1986, clearing has decreased and is ‘becoming amarginal activity in the context of remnantvegetation decline … since 1986 clearing has totalledabout 213,000 ha and added only 1.25% to theagricultural resource base’.
Wheatbelt
Development of this area occurred largely prior tothe 1970s, aided by many of the earlier War Serviceand Group Settlement schemes. Land clearing was aslower process because the area was settled earlierand in smaller holdings.
This region contains the major sheep and wheatproducing area of the Agricultural Zone. Much ofthe clearing was second phase clearing because most
of the land had been cleared earlier in the history ofthe State. However, there were undoubtedly largerremnants that were cleared in the period 1970-95and the cumulative impact would have beensignificant.
South-east
Major agricultural expansion occurred in thesebioregions between 1970 and 1990. Larger landholdings and new equipment became available and,together with the new wheat varieties and R&D intotrace elements and fertilizers, promoted rapidclearing. These bioregions contained the majorexpansion of the wheat industry as it moved east.They are almost exclusively agricultural bioregionsthat experienced major clearing events.
Coastal Zone
This region displays a similar pattern to the Malleeand Esperance Plain regions, with an additionalrecent clearing for the tree crop tagasaste.
South-west
Because many of the urban water catchments arelocated in the Jarrah Forest bioregion there has beena gradual imposition of clearing controls. Anecdotalevidence provided from interviews suggested thatthe more stringent controls applied in 1976 werepreceded by increased clearing, as landholders wereaware that a license to clear would become difficultto obtain.
These Swan Coastal Plain contains nearly all of thepopulation of WA and includes all the major urbancentres, including Perth. There is some intensiveagriculture. All clearing now requires a permit, andthe area being cleared for agriculture has declinedbecause of the introduction of clearing controls.

National Carbon Accounting System Technical Report 79
9.4 SELECT REFERENCES
Arnold 1998. Possible Effects of Climate Change on
Wildlife in Western Australia. In: Pearman, G.I.,Greenhouse Planning for Climate Change,Division of Atmospheric Research CSIRO,Brill, NY.
Australian Conservation Foundation 1984. Diversity
or Dust: a Review of the Impact of Agricultural Land
Clearance Programmes in South West Australia, ACF:Hawthorn.
Australian Surveying and Land Information Group(AUSLIG) 1990. Atlas of Australian Resources:
Vegetation. Third Series, vol. 6. AustralianGovernment Publishing Service: Canberra.
Beeston, G. 1996. Initiatives to Protect Native Vegetation
on Private Land in Western Australia. In: Dendy, T.,Murray, J., From Conflict to Conservation: NativeVegetation Management in Australia – A Focus onthe South Australian Program andOther Australian Initiatives, Past, Present andFuture, Seminar Proceedings, Adelaide, November1995, Dept. of Environment and NaturalResources: Adelaide.
Beeston, G., Mlodawski, G., Saunders, A. & True, D.1994. Remnant Vegetation Inventory in the Southern
Agricultural Areas of Western Australia. WesternAustralia Department of Agriculture ResourceManagement Technical Report No. 149.
Biodiversity Unit 1995. Native Vegetation Clearance,
Habitat Loss and Biodiversity Decline: an Overview of
Recent Native Vegetation Clearance in Australia and
its Implications for Biodiversity. Biodiversity SeriesPaper No. 6, Department of the Environment,Sport and Territories: Canberra.
Castles, I. (Australian Statistician) 1992. Australia’s
Environment: Issues and Facts. Australian Bureau ofStatistics: Canberra.
Cooper, E. (unpub.). Clearing Controls for Stream
Salinity Protection in the South West of Western
Australia: A History of the Involvement of the Public
Works Department of Western Australia.
Government of Western Australia (GoWA) 1992.State of the Environment Report. GoWA: Perth.
Graetz, D., Fisher, R. & Wilson, M. 1992. Looking
Back: the Changing Face of the Australian Continent,
1972-1992. CSIRO Office of Space Science &Applications: Canberra.
Jarvis, N (ed.) 1986. Western Australia: an Atlas of
Human Endeavour. Department of Lands andSurveys, in assistance with the Education Dept. ofWestern Australia: Perth.
Moir, R.J. 1968. Opening Address. Proc. Eleventh
Annual Conference, Australian Association ofAgricultural Faculties, Uni. Western Australia,p 10.
Nabben, T. 1992. Broadscale clearance of native
vegetation in Western Australia 1986-1992,
discussion paper, Australian ConservationFoundation: Perth.
Rutherford, D., Valuer Generals Office, Bunbury,WA (unpub.). Historical Aspects to Compensation for
Clearing Controls. The Remnant Vegetation Debate,
Australian Property Institute Seminar.
Thackway, R. and Cresswell, I.D. (eds) 1995, An
Interim Biogeographic Regionalisation for Australia:
A Framework for Setting Priorities in the National
Reserves System Cooperative Program. AustralianNature Conservation Agency, Canberra, ACT.Version 4, 31 March 1995.
Waters and Rivers Commission , Land Managementand Clearing Controls, Regional Support Branch,Regional Services Division,1966. Policy and
Guidelines: Granting of Licenses to Clear Indigenous
Vegetation in Catchments Subject to Clearing Control
Legislation: Western Australia.

Australian Greenhouse Office80
Description of data
Two maps, the first of the shires in WA that have less than 20% of theirtotal area as public or private vegetation (see p. 39), and the second of thelocation and spread of land development in WA to 1870; 1871 to 1900;1901 to 1930; 1931 to 1984; and also reserves and Crown Land (see p. 40).Also includes a summary of cases dealt with under Notices of Intention toClear Regulations from 1986/87 to 1993/94 and a summary of RemnantVegetation Protection Scheme grants from 1989 to 1995 (see p. 38). Sincethe introduction of regulations under the Soil and Land Conservation Act1986, clearing has decreased and is ‘becoming a marginal activity in thecontext of remnant vegetation decline … since 1986 clearing has totalledabout 213,000 ha and added only 1.25% to the agricultural resource base’(pp. 33-34).
Map (from Arnold 1988), which describes the possible changes in thewheatbelt of the south-west of WA (no scale provided).
Includes maps describing the spread of farming from 1850, 1890, 1919 and1939 at a scale of 1:10,000,000 (p. 76) and growth of the timber industryfrom 1899 to 1984, including: total log production figures for 1984; andextent and additions to the State Forest in the periods 1924 to 1930, 1930to 1954, 1954 to 1959, 1959 to 1969, and 1969 to 1984. The map is at ascale of 1:2,000,000 (p. 68). The publication also includes a breakdown ofrural establishments in the State for 1984/85 in terms of activity (nurseries,vineyards, sheep, cereal grain etc.) and the number of production units (p.83).
Debate on woodchip licenses began in 1986, with reference to private land,stimulating the presentation of the first mapping of remnants on privateland.
In 1991 the majority of aerial photographs were interpreted and mapped,marking the establishment of a database and data analysis.
A report on private remnants.
Includes a table of land permitted to be cleared by district for 1986-1987 to1989-1990 (p. 34). Also states that ‘Of an estimated total cover of over24.693 million ha, about 20.124 million ha have been cleared … Asubstantial portion was cleared between 1945 and 1982 … Significantclearance has also occurred in the Perth Metropolitan Region where some270,000 ha of the total estimated area of 530,000 ha have been lost …Ithas been calculated that from 1986-87 to May 1992, about 194,800 ha ofnative vegetation were permitted to be cleared’ (p. 34).
Two scenes of agricultural areas near Esperance during the period October1978 and January 1991. The images show a ‘pattern of expansion at themargins as well as the loss of native vegetation remnants within theestablished croplands’ (p. 68). The CD ROM supporting this publicationfeatures a full Esperance scene.
Region
All
Source
Beeston 1996
Castles 1992
Jarvis 1986
Beeston 1996
Beeston 1996
Beeston et al. 1994
Biodiversity Unit 1995
Esperance Plain Graetz et al. 1992
Summary of data on clearing in WA, 1970-1990, and their source.

National Carbon Accounting System Technical Report 81
Description of data
Presents a map of vegetation clearance across the continent for the periods1860, 1920 and 1980 (see p. 54), adapted from maps in Australians: aHistorical Atlas 1987, and 1:5 million ‘Present Vegetation’. The mapdescribes considerable clearing for the south-west region, particularly forthe areas mostly cleared by 1980.
Additionally, a continent map of ‘Major Vegetation Changes’ (p. 55)describes the clearance of predominantly woodland and scrubland withinthese bioregions (scale of 1:20,000,000; source: 1:5 million maps‘Natural Vegetation’.
Includes a table of land permitted to be cleared by district for 1986-1987 to1989-1990 (p. 34). ‘Of an estimated total cover of over 24.693 million ha,about 20.124 million ha have been cleared … A substantial portion wascleared between 1945 and 1982 … Significant clearance has also occurredin the Perth Metropolitan Region where some 270,000 ha of the totalestimated area of 530,000 ha have been lost … It has been calculated thatfrom 1986-87 to May 1992, about 194,800 ha of native vegetation werepermitted to be cleared’(p. 34).
Region Source
AUSLIG 1990
Biodiversity Unit 1995

Australian Greenhouse Office82
10: NORTHERN TERRITORY
10.1 INTRODUCTIONThe Northern Territory (NT) has a large beef cattleindustry and differs from the States in that so much ofits agriculture is based on rangeland pastoralism.The rangelands are suitable for grazing in theirnatural state. Thus, pastoralism in the NT is basedmostly on ecosystems that need little or no clearing tobe productive.
Vacant Crown Land that could be taken up as pastorallease has not been available in the NT since the early1960s. Since then, the only way to take up a newagricultural enterprise has been to make moreintensive use of land that has already been allocated.
Nevertheless, it has been estimated less than two percent of the woody vegetation of the NT has beencleared. This clearance took place mostly betweenabout 1975 and 1995, to make way for localised urbandevelopment and creation of fruit blocks aroundDarwin, the establishment of some pine plantations onMelville Island, and more intensive use of pastoralleases in the Daly and Finniss River Basins. Significantland clearing occurred in only three bioregions:Top End Coastal; Daly Basin; and Pine-Creek Arnhem.
As part of the Territory Government fundedagricultural development scheme, there were severalepisodes of clearing in the Daly Basin. There wasbroadscale clearing in the late 1960s and early 1970son the Scott Creek and Willeroo leases in the southand again, between 1967 and 1973, on TipperaryStation in the north, and selective clearing of theDouglas Daly farms in the 1980s.
Several relatively small-scale clearing events duringthe 1970s and 1980s were associated with largeintensive cropping schemes, such as the sorghumdevelopment at Tipperary. These schemes largelyfailed, and had a profound impact on developmentaspirations in the NT. Much of the land wassubsequently converted to improved pasture forgrazing purposes. In other cases, bush was allowedto regenerate.
A more cautious approach was taken to theAgriculture Development Marketing Authority(ADMA) scheme, which was developed during the1980s and involved broadscale clearing. Thisdiffered from the earlier land development schemesin that it was based on dryland farming, and nothorticulture, and was subject to detailed resourceassessment and property planning. Successfuldevelopment of agriculture was achieved in someareas, through the evolution from a cropping basedexercise to mixed farming and subsequently tograzing of improved pasture.
The development boom that accompaniedreconstruction following Cyclone Tracy in the 1974gave an added boost to the area. Small areas werecleared around Katherine and Darwin, wherehorticultural crops, such as mangos and bananas,were successfully established, usually on a scale oftwenty hectares or less. The success of these smallerscale horticultural developments has pointed theway for more carefully planned largerdevelopments. These smaller projects also drewattention to some of the locational advantagesenjoyed by Darwin and its proximity to Asia.
10.2 MOTIVATORS FOR LAND CLEARANCE
Environmental and social influences
The dry-tropical climate and vegetation of the NTare mainly suitable for cattle grazing, although therehas been some development of horticultural cropsaround population centres.
The pioneering era came to an abrupt end with thefailure of the large-scale intensive-farming initiativesof the 1970s and early 1980s. Some of these schemessuffered from a lack of financial analysis and landuse planning before they were implemented.Notwithstanding, the failed schemes had a profoundimpact. Subsequent development was based onmore critical assessment of resource andeconomic constraints.

National Carbon Accounting System Technical Report 83
It is the continuing policy of the NT Government todevelop and intensify its agricultural industries.Development has been facilitated by the provision ofstrategic assistance such as infrastructure (roads)and advice on property planning and development.Property management planning is a voluntaryprocess, supported by training modules organisedby various government agencies.
Some sectors of the community now hope thatDarwin might become the export capital for a widerange of products specially designed for the Asianmarket, and a major food producer for Australia.Efficient air, road and rail transport to other parts ofAustralia is also included in this vision.
Availability of land
The days of finding vacant Crown Land that couldbe taken up as pastoral lease came to an end in thelate 1950s and early 1960s. After this, the only waythat budding agricultural entrepreneurs could makeprofits in the NT was to use land that had alreadybeen allocated in more intensive ways, which mayhave involved some small-scale clearing.Nevertheless, land was relatively cheap compared toother areas of Australia.
Landowners continue to subdivide and develop onthe basis of commercial decisions. Land continues tobe subdivided and cleared for agricultural purposes,indicating that there is a market for such enterprises.
Financial and institutional incentives
Land development schemes
The large land development schemes of the 1970sand 1980s, such as the Humpty Doo rice project andthe Tipperary sorghum development, offered cheapland supported by irrigation and other Territoryfunded infrastructure. The failure of these schemesresulted in the land reverting to grazing so that acertain amount of regrowth occurred.
A more cautious approach was taken to TheAgriculture Development Marketing Authorityscheme, which was developed during the 1980s and
involved broadscale clearing. The scheme was basedon dryland farming and subject to detailed resourceassessment and property planning. The originalobjective to develop agricultural enterprises basedon intensive cropping were not met, but the areaevolved first into mixed farming and then intograzing on improved pasture to supply the livecattle to Asia.
In the Daly Basin, starting in the late 1960s andending in the 1980s, there were several waves ofTerritory Government assisted clearing to bring thearea into agricultural production.
Finance
Between the late 1960s and early 1980s the banks,led by the newly formed CommonwealthDevelopment Bank, made finance readily availablefor agricultural development, including clearing.During this period, the CommonwealthGovernment also allowed the costs of clearing to befully tax deductable in the year they were incurred.These were strong incentives to clear during aperiod when land development for agriculturewas encouraged.
Innovations: new breeds, techniquesand practices
New cattle breeds
The widespread introduction of heat-tolerant andtick-resistant Brahman derived breeds of cattle inthe late 1960s contributed to the success andexpansion of the cattle industry.
Market forces: new markets, changingcommodity prices
The development of the Asian live cattle trade hasbestowed significant profits to those sectors of thenorthern Australian cattle industry able to takeadvantage of it. Since the 1980s some pastoralistshave cleared areas on the Sturt Plateau because ofincreased profitability from this demand from Asiafor live cattle.
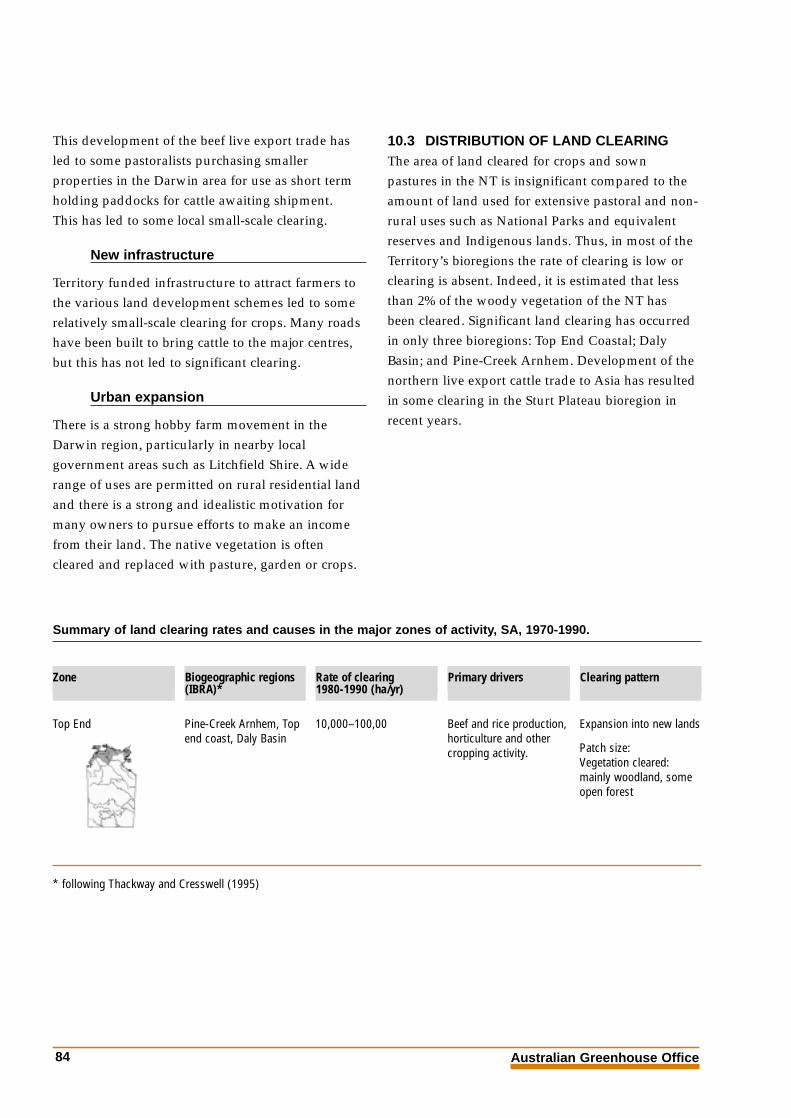
Australian Greenhouse Office84
This development of the beef live export trade hasled to some pastoralists purchasing smallerproperties in the Darwin area for use as short termholding paddocks for cattle awaiting shipment.This has led to some local small-scale clearing.
New infrastructure
Territory funded infrastructure to attract farmers tothe various land development schemes led to somerelatively small-scale clearing for crops. Many roadshave been built to bring cattle to the major centres,but this has not led to significant clearing.
Urban expansion
There is a strong hobby farm movement in theDarwin region, particularly in nearby localgovernment areas such as Litchfield Shire. A widerange of uses are permitted on rural residential landand there is a strong and idealistic motivation formany owners to pursue efforts to make an incomefrom their land. The native vegetation is oftencleared and replaced with pasture, garden or crops.
10.3 DISTRIBUTION OF LAND CLEARINGThe area of land cleared for crops and sownpastures in the NT is insignificant compared to theamount of land used for extensive pastoral and non-rural uses such as National Parks and equivalentreserves and Indigenous lands. Thus, in most of theTerritory’s bioregions the rate of clearing is low orclearing is absent. Indeed, it is estimated that lessthan 2% of the woody vegetation of the NT hasbeen cleared. Significant land clearing has occurredin only three bioregions: Top End Coastal; DalyBasin; and Pine-Creek Arnhem. Development of thenorthern live export cattle trade to Asia has resultedin some clearing in the Sturt Plateau bioregion inrecent years.
Summary of land clearing rates and causes in the major zones of activity, SA, 1970-1990.
10,000–100,00 Beef and rice production,horticulture and othercropping activity.
Expansion into new lands
Patch size:Vegetation cleared: mainly woodland, someopen forest
Pine-Creek Arnhem, Topend coast, Daly Basin
Zone Rate of clearing 1980-1990 (ha/yr)
Clearing patternBiogeographic regions(IBRA)*
Primary drivers
Top End
* following Thackway and Cresswell (1995)
National Carbon Accounting System Technical Report 85
Top End
The Top End Coastal bioregion is centred on theundulating plains that surround Darwin. Itcomprises open forest with sorghum grassunderstorey on loamy red and yellow earths andsandy alluvial soils. The region has a marked,monsoonal climate with distinctive wet anddry seasons.
Around the urban Darwin, rural residentialdevelopments dedicated to horticulture are a feature.However, larger commercial horticulturalenterprises, mainly mangoes and bananas, havebecome more significant in recent times. Smallproperties with intensive cropping provide shortterm holding facilities for cattle destined for liveexport to Asia.
Land clearing in this bioregion has beenpredominantly associated with urban developmentand horticultural establishments.
10.4 SELECT REFERENCES
Australian Surveying and Land Information Group(AUSLIG) 1990. Atlas of Australian Resources:
Vegetation. Third Series, vol. 6. AustralianGovernment Publishing Service: Canberra.
Biodiversity Unit 1995. Native Vegetation Clearance,
Habitat Loss and Biodiversity Decline: an Overview of
Recent Native Vegetation Clearance in Australia and
its Implications for Biodiversity. Biodiversity SeriesPaper No. 6. Department of the Environment,Sport and Territories: Canberra.
Castles, I. (Australian Statistician) 1992. Australia’s
Environment: Issues and Facts. Australian Bureau ofStatistics: Canberra.
Gillard, P., Williams, J. & Monypenny, R. 1989.Clearing trees from Australia’s semi-arid tropics.
Agricultural Science 2:134-39.
Graetz, D., Fisher, R. & Wilson, M. 1992. Looking
Back: the Changing Face of the Australian Continent,
1972-1992. CSIRO Office of Space Science andApplications: Canberra.
Scanlon, J.C., Prinsley, R., Pigott, J.P., Prescott, A.,Bishop, G. Wakefield, S., van der Sommen, F.,Duncan, F., Stadler, T., McLellan, R. & Farago, A.1991. Management of native vegetation on farms. In:Proceedings of the Role of Trees in SustainableAgriculture: A National conference. 30 September-3 October 1991, Albury.
Thackway, R. and Cresswell, I.D. (eds) 1995, An
Interim Biogeographic Regionalisation for Australia:
A Framework for Setting Priorities in the National
Reserves System Cooperative Program. AustralianNature Conservation Agency, Canberra, ACT.Version 4, 31 March 1995.
Woinarski, J. & Dawson, F. (in press). Limitless Lands
and Limited Knowledge: Coping with Uncertainty and
Ignorance in Northern Australia. In: T.W. Norton,J.W. Handmer & S.R. Dovers (eds.), Ecology,Uncertainty and Policy: Managing Ecosystems forSustainability. Longmans: London
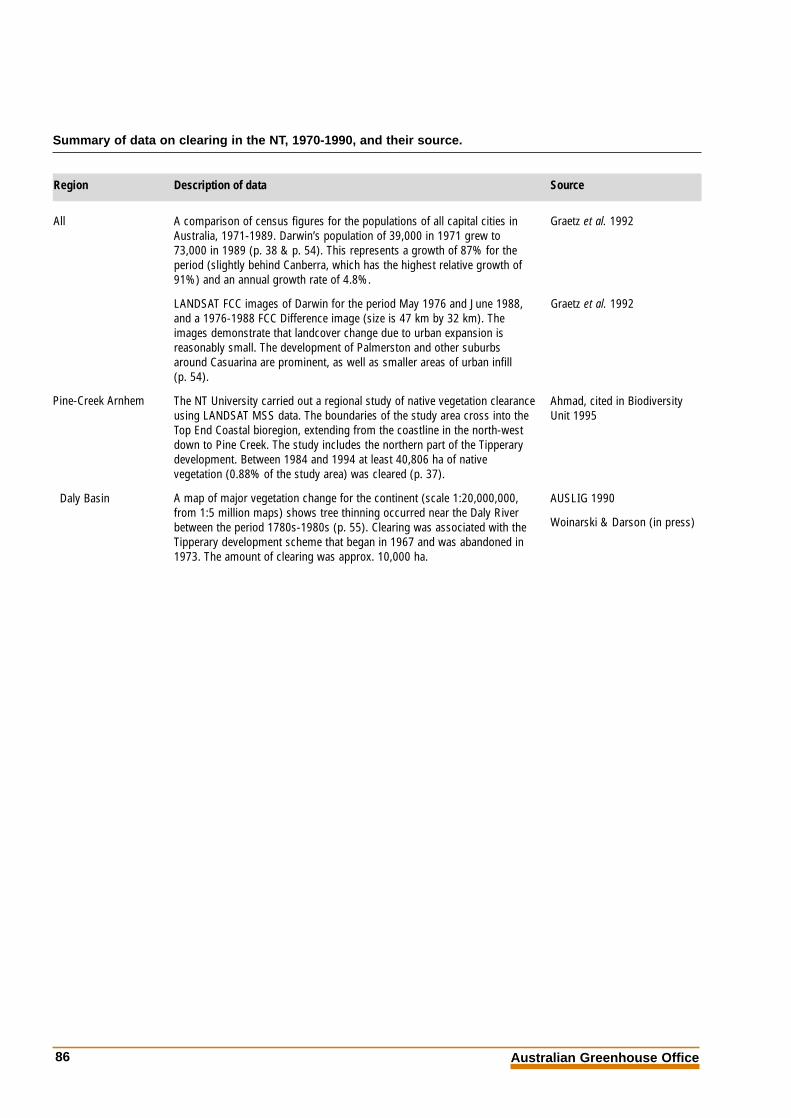
Australian Greenhouse Office86
Description of data
A comparison of census figures for the populations of all capital cities inAustralia, 1971-1989. Darwin’s population of 39,000 in 1971 grew to73,000 in 1989 (p. 38 & p. 54). This represents a growth of 87% for theperiod (slightly behind Canberra, which has the highest relative growth of91%) and an annual growth rate of 4.8%.
LANDSAT FCC images of Darwin for the period May 1976 and June 1988,and a 1976-1988 FCC Difference image (size is 47 km by 32 km). Theimages demonstrate that landcover change due to urban expansion isreasonably small. The development of Palmerston and other suburbsaround Casuarina are prominent, as well as smaller areas of urban infill(p. 54).
The NT University carried out a regional study of native vegetation clearanceusing LANDSAT MSS data. The boundaries of the study area cross into theTop End Coastal bioregion, extending from the coastline in the north-westdown to Pine Creek. The study includes the northern part of the Tipperarydevelopment. Between 1984 and 1994 at least 40,806 ha of nativevegetation (0.88% of the study area) was cleared (p. 37).
A map of major vegetation change for the continent (scale 1:20,000,000,from 1:5 million maps) shows tree thinning occurred near the Daly Riverbetween the period 1780s-1980s (p. 55). Clearing was associated with theTipperary development scheme that began in 1967 and was abandoned in1973. The amount of clearing was approx. 10,000 ha.
Region
All
Source
Graetz et al. 1992
Summary of data on clearing in the NT, 1970-1990, and their source.
Graetz et al. 1992
Ahmad, cited in BiodiversityUnit 1995
AUSLIG 1990
Woinarski & Darson (in press)
Pine-Creek Arnhem
Daly Basin

The National Carbon Accounting System:
• Supports Australia's position in the international development ofpolicy and guidelines on sinks activity and greenhouse gas emissionsmitigation from land based systems.
• Reduces the scientific uncertainties that surround estimates of landbased greenhouse gas emissions and sequestration in the Australian context.
• Provides monitoring capabilities for existing land based emissionsand sinks, and scenario development and modelling capabilities thatsupport greenhouse gas mitigation and the sinks development agendathrough to 2012 and beyond.
• Provides the scientific and technical basis for internationalnegotiations and promotes Australia's national interests ininternational fora.
http://www.greenhouse.gov.au/ncas
For additional copies of this report phone 1300 130 606
Series 1 Publications
1. Setting the Frame
2. Estimation of Changes in Soil Carbon Due to Changes in Land Use
3. Woody Biomass: Methods for Estimating Change
4. Land Clearing 1970-1990: A Social History
5a. Review of Allometric Relationships for Estimating Woody Biomass for Queensland, the NorthernTerritory and Western Australia
5b. Review of Allometric Relationships for Estimating Woody Biomass for New South Wales, theAustralian Capital Territory, Victoria, Tasmania and South Australia
6. The Decay of Coarse Woody Debris
7. Carbon Content of Woody Roots: Revised Analysis and a Comparison with Woody ShootComponents (Revision 1)
8. Usage and Lifecycle of Wood Products
9. Land Cover Change: Specification for Remote Sensing Analysis
10. National Carbon Accounting System: Phase 1 Implementation Plan for the 1990 Baseline
11. International Review of the Implementation Plan for the 1990 Baseline (13-15 December 1999)
Series 2 Publications
12. Estimation of Pre-Clearing Soil Carbon Conditions
13. Agricultural Land Use and Management Information
14. Sampling, Measurement and Analytical Protocols for Carbon Estimation in Soil, Litter and CoarseWoody Debris
15. Carbon Conversion Factors for Historical Soil Carbon Data
16. Remote Sensing Analysis Of Land Cover Change - Pilot Testing of Techniques
17. Synthesis of Allometrics, Review of Root Biomass and Design of Future Woody Biomass SamplingStrategies
18. Wood Density Phase 1 - State of Knowledge
19. Wood Density Phase 2 - Additional Sampling
20. Change in Soil Carbon Following Afforestation or Reforestation
21. System Design
22. Carbon Contents of Above-Ground Tissues of Forest and Woodland Trees
23. Plant Productivity - Spatial Estimation of Plant Productivity and Classification by Vegetation Type
24. Analysis of Wood Product Accounting Options for the National Carbon Accounting System
25. Review of Unpublished Biomass-Related Information: Western Australia, South Australia, NewSouth Wales and Queensland
26. CAMFor User Manual

national carbonaccounting system
tech
nica
l rep
ort n
o. 4
Land Clearing:A Social History
The National Carbon Accounting System provides a complete
accounting and forecasting capability for human-induced sources and
sinks of greenhouse gas emissions from Australian land based
systems. It will provide a basis for assessing Australia’s progress
towards meeting its international emissions commitments.
http://www.greenhouse.gov.au
The lead Commonwealth agency on greenhouse
matters
Australian Greenhouse Office
technical report no. 4 Land Clearing: A Social History