Embed Size (px)
Citation preview

THE NATIONAL INCOME: SECOND QUARTER OF 1950
(All tables contain figures in millions at annual rates. For notes ondefinitions and methods see the BULLETIN for May, 1950, and earliernumbers.)
TABLE INational Income at Current Factor Cost, Seasonally Corrected
TABLE IINational Income at Average 1949 Factor Cosi, Seasonally Corrected
THE AGGREGATE
The national income appears to have continued to increase at a rate ofsome £7oo-800 millions per annum, at current prices, almost entirelybecause of increases in the industrial sector. The output of the Governmentsector continued to fall slightly, because of reductions in numbers employedin central Government service.
Tabie H shows that the increase is still predominantly (about two-thirds)a 'real' one, and this is wholly due to higher industrial output. This con-tinued expansion is the more satisfactory in that manpower in the industrialsector is hardly rising. The movements of output and manpower have beenas follows :-
1948 1949 I1949
II III 1V1950
I II
Agriculture ... 580 590 600 580 600 590 600 600Industry ... 5,470 5850 5,650 5,840 5,880 6,040 6,180 6,320Services ... 3,040 3,130 3.100 3,130 3,130 3,160 3,160 3,160
Total Business 9,090 9,570 9,350 9,550 9,610 9,790 9,940 10,080Government ... 1,105 1,130 1,140 1,140 1,130 1,120 1,115 1.105Other ...... 420 425 425 425 425 425 430 430
Gross NationalIncome ... 10,615 11,125 10,915 11,115 11,165 11,335 11,485 11,615
Less Depreciation -935 -975 -960 -970 -980 -990 -.1,000 -1,010Net National
Income ,.. 9.680 10.150 9.95.5 10.145 10.185 10.345 10.485 10.605
1948 1949 I1949
II III IV1950
I II
Agriculture ... 550 590 570 580 610 610 610 610Industry ... 5,380 5,850 5,570 5,830 5,890 6,120 6,330 6,490Services ... 2,890 3.130 3,070 3,100 3,160 3,190 3,190 3,220
Total Busjness 8,820 9,570 9,210 9,510 9,660 9,920 10,130 10,320Government 1,060 1,130 1,125 1,135 1,125 1,125 1,120 1,115Other ...... 420 425 425 425 425 425 430 430
Gross NationalIncome ... 10,300 11,125 10,760 11,070 11,210 11,470 11,680 11,865
Less Depreciation -935 -975 -960 -970 -980 -990 -1,000 -1.010Net National
Income ... 9,365 10,150 9,800 10,100 10,230 10,480 10,680 10,855
z6z THE BULLETIN
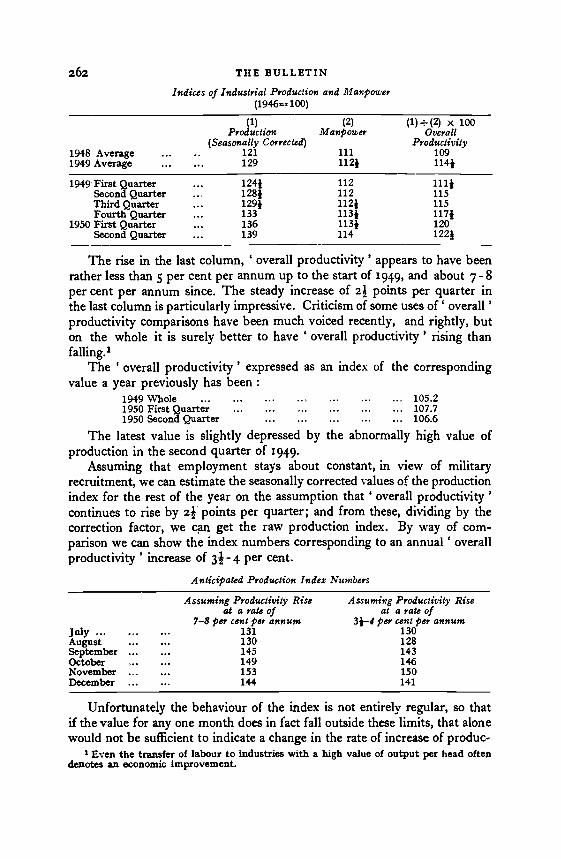
Indices of Indus trial Production and Manpower(1946'-. lOO)
The rise in the last column, 'overall productivity' appears to have beenrather less than 5 per cent per annum up to the start of 1949, and about 7-8per cent per annum since. The steady increase of 2k points per quarter inthe last column is particularly impressive. Criticism of some uses of' overall'productivity comparisons have been much voiced recently, and rightly, buton the whole it is surely better to have 'overall productivity' rising thanfalling.1
The ' overall productivity' expressed as an index of the correspondingvalue a year previously has been
1949 Whole ..- ... ... 105.21950 First Quarter ... ... 107.71950 Second Quarter ... 106.6
The latest value is slightly depressed by the abnormally high value ofproduction in the second quarter of 1949.
Assuming that employment stays about constant, in view of militaryrecruitment, we can estimate the seasonally corrected values of the productionindex for the rest of the year on the assumption that 'overall productivity'continues to rise by ak points per quarter; and from these, dividing by thecorrection factor, we can get the raw production index. By way of com-parison we can show the index numbers corresponding to an annual' overallproductivity' increase of 3k-4 per cent.
Anticipated Production Index Numbers
Assuming Productivity Rise Assuming Productivity Riseat arateof at arateof
7-8 per cent er annum 3f-4 er cent er annumJuly 131 130August 130 128September 145 143October 149 146November 153 150December 144 141
Unfortunately the behaviour of the index is not entirely regular, so thatif the value for any one month does in fact fall outside these limits, that alonewould not be sufficient to indicate a change in the rate of increase of produc-
'Even the transfer of labour to industries with a high value of output per head oftendenotes an economic improvement.
1948 Average194-9 Average
(1)Production
(Seasonally Corrected)121129
(2)Manpower
111112f
(l)±(2) x looOverall
Productivity109114f
1949 FirstQuarter 1241 112 1111Second Quarter 128f 112 115Third Quarter 129f 112f 115Fourth Quarter 133 113f 117f
1950 First Quarter 136 113f 120Second Quarter 139 114 122f

THE NATIONAL INCOME: SECOND QUARTER OF 1950 263
tivity: only a sequence outside would signify that productivity increases werebelow 3 or above 8 per cent per annum. A succession of values between thelimits would indicate a productivity rise of 3 - 8 per cent per annum. (Ifemployment change,s by more than a few thousand, the above figures shouldof course be adjusted accordingly).
To see where, within the industrial sector, the increase has occurred wecan make the same calculation, only this time taking four months (March-June) because of the greater instability of indices for smaller groups.'
Implied
The corresponding 'productivity' indices previously calculated for theperiod December, 1949February, 1950 were as follows2: Mining 105,Ivlanufacturing 107, Building io-, Utilities 99in each case almost exactlythe same. The continued tendency for the 'utilities' to recruit staff fasterthan output rises is now worth noting. It may be because the increased staffis being allocated to development rather than production, but certainly someexplanation is worth seeking. The rise in output per head in mining hasbeen more than enough to offset the falling labour force, but the wastageprevents a fast enough expansion to solve our coal problems. In individualsectors of manufacturing industry we at last have complete employmentstatistics for a five-month period in each year, enabling a fairly precise'productivity' analysis to be made for January to May, 1950 :
Output, Employment and Productivity in various Industries in January-May, 1950compared with January-May 1940 (Jan.-May, 1949= 100)
*Jan.-April only. tJan.-March only.
The employment data are actually for 5 months: end-February to end-J une.BULLETIN, Vol. 12, p. 140.As before, the employment data start at the end of the previous month and end at
the end of the period.
Output Employment 'Productivity'China ... ... 101* 101 1001Glass ......... 100* 103+ 97Bricks. Cement, etc. ... 105f 103* 1011Ferrous metals ... 1031 100 103*Non-Ferrous metals ... 1041 100 104Engineering ... ... 106 99* 1061Vehicles ... 118* 101* 116*Metal Goods ... 105 100* 1041Preçision jnstrumentst 137 103* 132*Chemicals ... ... 107 103 104Textiles ... 111 1041 106Clothing ... 1071 105 102*Leather goods ... 108* 105 103jFood .......,. 108* 103* 105Drink and Tobacco 99 101 98Wood manufactures 111* 104* 106*Paper, printing ... 123 105 117Other industries* ... 116 102 113}
(March-June, 1949= 100) Output Employment ProductivityMining ... . 102 97* 104*Manufacturing 109+ 102 107*Building ... 105* 100* 105Utilities ... 104* 106 99

264 THE BULLETIN
The last analysis made' was based on incomplete employment data,and overlapped with the above. However, it is slightly encouraging tosee that the analysis above suggests a higher 'productivity 'than the formerone for most industries, signifying rising rates of productivity growth. Thefigures for major industries such as metals, chemicals, engineering andtextiles are noteworthy and suggest a more solid growth of productivity thandid the last analysis.
TABLE IIINational Income by Distributive Shares, Seasonally Corrected
DISTRIBUTIVE SHARES
Since it is most unlikely that wage and salary increases absorbed morethan a small part of the quarterly increase of some L2oom. in the aggregate,the bulk must be attributable to profits. Some of this no doubt went toproprietors in distribution as a result of the higher turnover of consumers'goods, but the greater part has obviously been flowing into company reserves.2The continuation of this tendency is evidently introducing a significantchange in the country's income structure in favour of undistributed profits.
TABLE IVForeign Trade at Current Prices, NOT Seasonally Corrected
BULLETIn, Vol. 12, p. 141.2 A rough allocation of inventory gains may allow us in future estimates to restore the
estimates of changes in personal income.
1948 1949 I1949
II III IV1950
I II
Visible Imports 1,770 1,970 1,845 2,005 1.990 2,040 2,105 2,320Invisible Imports 455 530 515 510 570 525 530 550
Total Payments 2,225 2,500 2.360 2,515 2,560 2,565 2,635 2.870
Visible Exports 1,555 1,790 1,850 1.770 1.730 1,810 2,030 2,035Invisible Exports 565 640 600 595 675 690 670 700
Total Receipts 2,120 2,430 2,450 2,365 2,405 2,500 2,700 2,735
Deficit (-) orSurplus(+l ... -105 -70 ±90 -150 -155 -65 -1-65 -135
1948 1949 I1949
II III IV1950
I II
Wages 4050 4,280 4,190 4.280 4,290 4,360 4,415 4,445Salaries 2,140 2,250 2,225 2,245 2,260 2,270 2,280 2,290Forces' Pay 245 245 250 245 240 235 230 220Rent ...... 465 470 470 470 470 475 475 480Profits andInterest ... (2,465) (2.905) (2,665) (2,860) (2,970) (3,140) (3,280) (3,420)
Net NationalIncome ... 9,365 10,150 9,800 10,100 10,230 10,480 10,680 10,855
THE NATIONAL INCOME: SECOND QUARTER OF 1950 z6
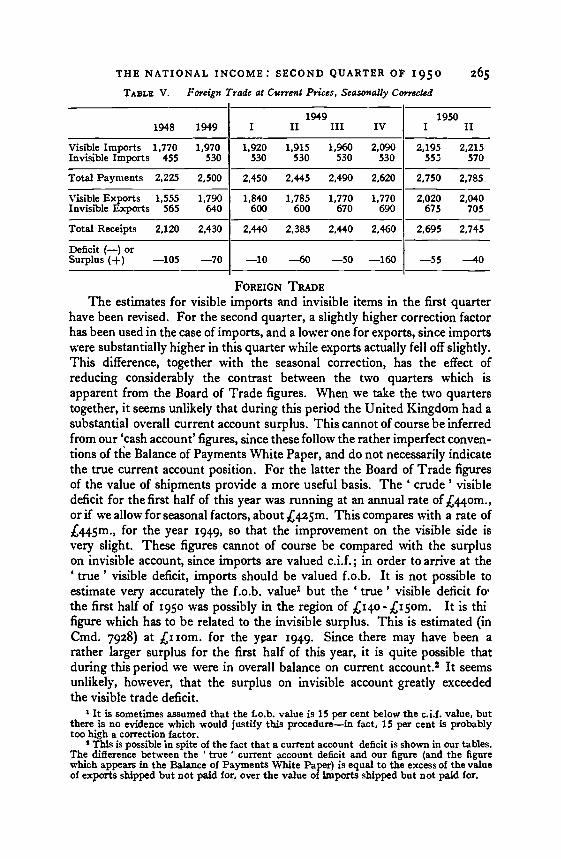
TABLE V. Foreign Trade at Current Prices. Seasonally Corrected
FOREIGN TRADEThe estimates for visible imports and invisible items in the first quarter
have been revised. For the second quarter, a slightly higher Correction factorhas been used in the case of imports, and a lower one for exports, since importswere substantially higher in this quarter while exports actually fell off slightly.This difference, together with the seasonal correction, has the effect ofreducing considerably the contrast between the two quarters which isapparent from the Board of Trade figures. When we take the two quarterstogether, it seems unlikely that during this period the United Kingdom had asubstantial overall current account surplus. This cannot of course be inferredfrom our 'cash account' figures, since these follow the rather imperfect conven-tions of the Balance of Payments White Paper, and do not necessarily indicatethe true current account position. For the latter the Board of Trade figuresof the value of shipments provide a more useful basis. The 'crude' visibledeficit for the first half of this year was running at an annual rate of £om.,or if we allow for seasonal factors, about £425m. This compares with a rate ofL445m., for the year 1949, so that the improvement on the visible side isvery slight. These figures cannot of course be compared with the surpluson invisible account, since imports are valued c.i.f.; in order to arrive at the'true' visible deficit, imports should be valued f.o.b. It is not possible toestimate very accurately the f.o.b. value' but the 'true' visible deficit fo'the first half of 1950 was possibly in the region of £14o-LIsom. It is thifigure which has to be related to the invisible surplus. This is estimated (inCmd. 7928) at Lilom. for the ycar Since there may have been arather larger surplus for the first half of this year, it is quite possible thatduring this period we were in overall balance on current account.2 It seemsunlikely, however, that the surplus on invisible account greatly exceededthe visible trade deficit.
1 It is sometimes assumed that the f.o.b. value is 15 per cent below the c.i.f. value, butthere is no evidence which would justify this procedurein fact, 15 per cent is probablytoo high a correction factor.
This is possible in spite of the fact that a current account deficit is shown in our tables.The difference between the 'true' current account deficit and our figure (and the figurewhich appears in the Balance of Payments White Paper) is equal to the excess of the valueof exports shipped but not paid for, over the value of imports shipped but not paid for,
1948 1949 I1949
II III IV1950
I II
Visible Imports 1,770 1,970 1,920 1,915 1,960 2,090 2,195 2,215Invisible Imports 455 530 530 530 530 530 55.3 570
Total Payments 2,225 2,500 2,450 2.445 2,490 2.620 2,750 2.785
Visible Exports 1,555 1,790 1,840 1,785 1,770 1.770 2,020 2,040Invisible Exports 565 640 600 600 670 690 675 705
Total Receipts 2,120 2,430 2,440 2,385 2,440 2,460 2,695 2,745
Deficit f) orSurplus (+) 105 70 10 60 50 160 55 40

266 THE BULLETIN
TABLE VI. Final Consumption at Current Prices, Seasonally Corrected
*Detail does not add to total because of rounding.
TABLE VII. Final Consumption at average 1949 Prices, Seasonally Corrected
])etail does not add to total because of rounding.
CONSUMPTION
The seasonally corrected estimates of consumption expenditure atcurrent prices, presented in Table VI, show that the high level of expenditureattained in the first quarter of 1950 has been maintained, with larger expendi-tures on Drink and Tobacco offsetting slightly smaller expenditures on severalother items.
A major change has been made in the construction of the fixed-priceestimates in Table VII. The Central Statistical Office now publish consump-tion estimates at average 1948 prices,1 and our fixed-price series are obtainedby converting the C.S.O. estimates to average 1949 prices and applyingseasonal correction factors. Previously we have been using price-indicesfrom the Interim Index of Retail Prices, which were rather unsatisfactory,because of their limited coverage and their pre-war quantity weights. Theprice-indices implied by the Central Statistical Office estimates are, however,somewhat unstable : an instability which must be at least partly due toseasonal factors. For example, the price-indices for food and clothing moveas follows :- 1949 1950 Average
I iI III IV I II 1948lOOFood .. 97.4 105.7 105.5 102.1 108.2 114.2Clothing ... 106.5 106.8 106.9 106.2 106.8 113.4
See for example, Monthly Digest of Statistics for August, 1950. Table 156 (ii).
1948 1949 I1949
II III IV1950
I II
Food ... 2,280 2,380 2,365 2,290 2,340 2,530 2,500 2,350Drink 755 720 680 735 730 730 685 755Tobacco 785 765 730 770 820 740 730 770Rent and Rates 600 615 610 610 615 615 620 620Fuel and Light 345 350 345 350 340 355 355 365Household Gds 525 580 555 580 580 610 640 620Clothing 895 950 920 960 915 1,000 955 900Other ...... 2,075 2,050e 2,055 2,060 2,045 2,045 2,085 2,030
Total 8,260 8,405' 8,260 8,355 8,385 8,625 8,570 8,410
1948 1949 I1949
II III IV1950
I II
Food ...... 2,220 2,380 2,250 2,365 2,395 2,515 2,635 2,610Drink ... 760 720 700 730 725 725 685 730Tobacco .,. 775 765 725 770 820 745 730 775Rent and Rates 600 615 610 610 615 615 620 630Fuel and Light 340 350 355 340 340 355 365 370Household Goods 520 580 555 580 580 610 640 630Clothing 855 950 925 960 960 990 950 945Other ...... 2,045 2,050 2,050 20,55 2,055 2,045 2.085 2,040
Total ...... 8,110' 8,405 8,170 8,410 8,445 8,600 8,710 8,730
THE NATIONAL INCOME: SECOND QUARTER OF 1950 267
Such movements cause our price-corrected consumption estimates to berather erratic, and, in particular, they indicate a large fall in ' real' consump-tion between the first and second quarters of this year. This fall is probablyat least partly a 'statistical' one, in the sense that our seasonal correctionsare no longer strictly accurate now that we use the C.S.O. implied price-index. There is reason to suppose that the C.S.O. Paasche-type indices aremore susceptible to seasonal influences than are the series implied by theInterim Index of Retail Prices. And since our seasonal correction factors arederived from fixed-price series obtained by deflating value rises by theInterim Index of Retail Prices, any greater seasonality of the C.S.O. impliedindex will have the effect of introducing a larger seasonal element into ourprice-corrected series. This seasonal element cannot be eliminated until wehave a sufficient range of C.S.O. fixed-price estimates to enable seasonalcorrection factors to be calculated directly from this data. The specialproblems involved in the use of this implied price-index will be furtherconsidered before the next set of estimates is presented.
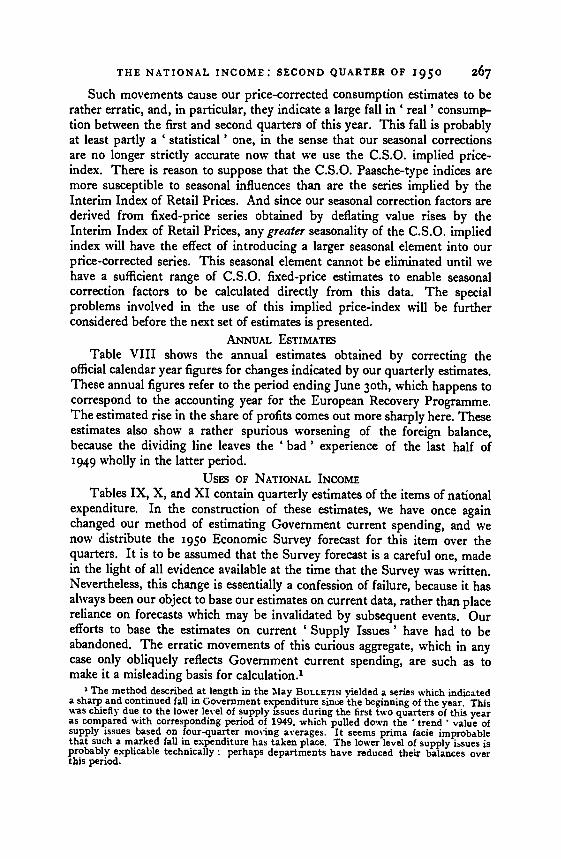
ANNUAL ESTIMATESTable VIII shows the annual estimates obtained by correcting the
official calendar year figures for changes indicated by our quarterly estimates.These annual figures refer to the period ending June 3oth, which happens tocorrespond to the accounting year for the European Recovery Programme.The estimated rise in the share of profits comes out more sharply here. Theseestimates also show a rather spurious worsening of the foreign balance,because the dividing line leaves the 'bad ' experience of the last half of1949 wholly in the latter period.
Usrs OF NATIONAL INCOMETables IX, X, and XI contain quarterly estimates of the items of national
expenditure. In the construction of these estimates, we have once againchanged our method of estimating Government current spending, and wenow distribute the 1950 Economic Survey forecast for this item over thequarters. It is to be assumed that the Survey forecast is a careful one, madein the light of all evidence available at the time that the Survey was written.Nevertheless, this change is essentially a confession of failure, because it hasalways been our object to base our estimates on current data, rather than placereliance on forecasts which may be invalidated by subsequent events. Ourefforts to base the estimates on current 'Supply Issues' have had to beabandoned. The erratic movements of this curious aggregate, which in anycase only obliquely reflects Government current spending, are such as tomake it a misleading basis for calculation.1
1 The method described at length in the May BULLETIN yielded a series which indicateda sharp and continued fall in Government expenditure since the beginning of the year. Thiswas chiefly due to the lower level of supply issues during the first two quarters of this yearas compared with corresponding period of 1949. which pulled down the trend value ofsupply issues based on four-quarter moving averages. It seems prima facie improbablethat such a marked fall in expenditure has taken place. The lower level of supply issues isprobably explicable technically: perhaps departments have reduced their balances overthis period.
TA
BL
E V
III
Nat
iona
l Inc
ome
and
Exp
endi
ture
for
E.R
.P. Y
ears
TA
BL
E I
XN
atio
nal E
xpen
ditu
re a
t Cur
rent
Pri
ces
NO
T S
easo
na2l
y C
orre
cted
t.) 00
1949
1950
1948
1949
III
III
1VI
II
Con
sum
ptio
n ...
8,11
08.
405
7,68
08,
350
8,61
08.
990
8,22
58,
690
Gov
t. cu
rren
tsp
endi
ng...
1,77
02,
035
1,94
02,
015
2,07
52.
120
2,17
02,
210
Net
Inv
estm
ent
1,20
51,
415
(1,5
20)
(1,5
40)
(1.2
10)
(1,3
80)
(1,7
55)
(1.9
45)
Exp
ort d
efic
it (-
)or
sur
plus
(+
) -1
05-7
0+
90-1
50-1
55-6
5+
65-1
35N
et N
atio
nal
Prod
uct
...10
,980
11,7
8511
,230
11.7
5511
.740
12.4
2512
,215
12,7
10L
ess
Net
In-
dire
ct T
axes
-1,
615
-1,6
35 -
1,49
0 -1
,585
-1,
750
-1.7
45 -
1.56
5 -1
.760
Net
Nat
iona
lIn
com
e...
9,36
510
,150
9,74
010
,170
9,99
010
.680
10.6
5010
,950
1948
-9 1
949-
5019
48-9
194
9-50
1948
-9 1
949-
50
Agr
icul
ture
570
610
Wag
es4,
170
4,38
0C
onsu
mpt
ion
......
8,23
08,
630
Indu
stry
5,60
06,
200
Sala
ries
2,21
02,
270
Gov
t. C
urre
nt S
pend
ing
1,89
02,
145
Serv
ices
2,99
03.
190
Forc
es' P
ay24
023
0N
et I
nves
tmen
t,..
(1;2
30)
(1,5
45)
Tot
al B
usin
ess.
9,16
010
,000
Ren
t ..
470
475
Gov
ernm
ent
1,10
51,
120
Prof
its a
nd I
nter
est.,
.(2
,640
)(3
,195
)E
xpor
t Def
icit
(-)
Oth
er42
543
0or
Surp
lus
(+)
...+
10-7
0G
ross
Nat
iona
l Inc
ome
10,6
9011
,550
Net
Nat
iona
l Pro
duct
11,3
6012
,255
Les
s D
epre
ciat
ion
... -
960
-1,0
00L
ess
Net
Ind
irec
t Tax
es -
1,63
0 -1
,705
Net
Nat
iona
l Inc
ome
...9.
730
10,5
50N
et N
atio
nal I
ncom
e9,
730
1,05
50N
et N
atio
nal I
ncom
e9,
730
10,5
50

THE NATIONAL INCOME: SECOND QUARTER 1950 269
TABLE XNational Expenditure a Current Prices, Seasonally corrected
TABLE XINational Expenditure at Average 1949 Prices, Seasonally Corrected
It is, of Course, particularly disturbing that we have to make this changeat a time when changes in Government expenditure seem likely to exert amajor influence on economic developments. It emphasises that the inform-ation supplied in the conventional exchequer returns is so inadequate that itis practically impossible for the public to discover what is happening to oneof the major items of national expenditure.
Interpretation of the shape of national expenditure has therefore to beeven more cautious than formerly. It can be reduced to the problem ofaccounting for the (seasonally corrected) rise of £zoom. per quarter in thenational income. However much Government spending rose, it could hardlyhave accounted for the major portion of this rise, and if we correct for seasonalinfluences, there seems little change in the foreign balance. Consumptionrose, but not by enough to account for the remainder, and presumably theremust be some real basis for the rise in the residual, investment at home,probably a continued rise in stocks. Apparel stocks were continuing to rise,
1948 1949 I1949
II III IV1950
I II
Consumption ... 8,260 8,405 8,260 8,355 8,385 8,625 8,570 8,410Govt. current
spending ... 1,840 2,035 1,950 2,025 2,085 2,100 2,135 2,155Net Investment (1,300) 1,415 (1,310) (1,490) (1,550) (1,345) (1,310) (1,550)Export deficit (-)
or surplus (+) -90 -70 +20 -70 -150 -85 +80 +150
Net NationalProduct ... 11,310 11,785 11,540 11,800 11,870 11,985 12,095 12,265
Lcss Net In-direct Taxes -1,630 -1,635 -1,585 -1,655 -1,685 -1,640 -1,610 -1,660
Net NationalIncome ... 9.680 10,150 9,955 10,145 10,185 10,345 10,485 10,605
1948 1949 I1949
II III 1V1950
I II
Consumption ... 8,110 8,405 8,170 8,410 8,445 8,600 8,710 8,730Govt. current
spending ... 1,770 2,035 1,940 2,015 2,075 2,120 2,170 2,210Net Investment 1,205 1,415 (1,275) (1,365) (1.460) (1,590) (1,490) (1,715)Export deficit (-)
or surplus (+) -105 -70 -10 -60 -50 -160 -55 -40Net National
Product ... 10,980 11,785 11,375 11,730 11,930 12,145 12,315 12,615Less Net In-
direct Taxes -1,615 -1,635 -1,575 -1,630 -1,700 -1,665 -1,635 -1,760Net National
Income ... 9,365 10,150 9,800 10,100 10,230 10,480 10.680 10.855
270 THE BULLETIN
and so were metal stocks, though there were falls elsewhere (notably forrubber).1 Government stock-building of food may also have continued,judging from the rather high imports (relative to consumption) in May andJune.
The economic position thus on the whole continues to be a strong one.The crucial question is whether it is strong enough to carry the defence pro-gramme. It is still not clear how much of the increase is to be financed by theUnited States, but it looks as if U.K. spending on defence may increase at arate of something like £2oo million per annum. At first sight, this wouldseem fairly easy to cope with, in view of the present rate of increase of' realnational income of some £500 million per annum. If the defence programmeabsorbs an additional £2oo million of real resources per annum, then £300million will be available for other purposes: exports, consumption, non-military investment, and non-military government expenditure On presentform, (allowing for wage and dividend stabilisation, and the high marginalincidence of present tax rates), less than half of an increase in national incomewill impinge on the consumption-good market. Thus the present programmewould seem to be just manageable out of current resources, without recourseto additional taxation. The implication of this argument is that consumptionincreases and the defence programme will absorb the greater part of theincrease in 'real' national income, and that any substantial increase inexports, non-military investment (e.g. housebuilding) or non-militarygovernment expenditure (e.g. social services) will lead to a resurgence ofinflationary pressures: unless an increase in one is offset by a reduction else-where.
But there is one essential qualification which must be made, and thisconcerns the effect of rearmament on 'overall productivity'. As we havenoted above, the rise in 'real' national income is almost entirely (in theabsence of manpower increases) dependent upon 'productivity' increases.Although the movements of 'productivity' over the past year have beenencouraging, it is possible that rearmament will have a marked (adverse)effect on 'productivity' in some industries. Bottlenecks, both in materialsand labour, may appear, checking the 'productivity ' increases and thereforethe rise in 'real' national income. For example, the spectacular 'produc-tivity' increases in vehicles, and in paper and printing, have been largelydue to improved material supplies, which may be cut abruptly by the militaryprogramme. The real cost of the defence programme is production for otherpurposes foregone, and this is likely to be greater than would correspond tothe nominal value of additional military expenditure.
DUDLEY SEERSIn association with P. D. HENDERSON and D, G. HOLLAND
1Though the sharp rise in imports of rubber may mean a corresponding rise in stocksin transit'. now excluded from the official returns.