Embed Size (px)
Citation preview

UKCSI trends As Chart 1 shows, customer satisfaction has grown steadily across the four years of the UKCSI from 65.6 in the first wave to
its current level of 76.7. Since the UK has been in recession for much of that period, it may seem counter-intuitive that custom-er satisfaction has continued to rise, but I don’t think it is, for several reasons.
THE NATIONALMEASURE OFCUSTOMERSATISFACTION
Stephen HampshireClient ManagerThe Leadership Factor
If you have any thoughts about this article you can contact Stephen at [email protected]
Robert CrawfordExecutive DirectorInstitute of Customer Service
www.instituteofcustomerservice.com
UKCSI January 2011
60Wave 1 Wave 2 Wave 3 Wave 4 Wave 5 Wave 6 Wave 7 Wave 8
65
70
75
80
Chart 1: Growing UK customer satisfaction
The latest UK Customer Satisfaction Index (UKCSI), which is the National Measure of Customer Satisfaction for UK organisations, has recorded a good increase from 75.6 to 76.7. Based on a representative sample of 26,000 adults surveyed over the internet, the research is conducted by The Leadership Factor on behalf of the Institute of Customer Service. The latest wave is the 8th bi-annual UKCSI survey that has been conducted so we now have enough data to start making reliable comments on trends and one of the most remarkable outcomes of the UKCSI over that period is the consistent upward trend in customer satisfaction.
20 customerINSIGHT March 2011 | www.customer-insight.co.uk
Customer

In a recession, companies find it much more difficult to win new busi-ness. When they’re feeling the pinch, consumers are more likely to continue with existing spending patterns than to adopt new products or services.
This makes it sensible for companies
to switch resources from winning new customers to keeping existing ones. (We would say it’s always sensible to do that but when customer acquisition is easier, marketing departments tend to focus on it even though evidence shows that on average it’s 5 times more costly to win a new customer than to keep an existing one).
To keep existing customers you have to
deliver a consistently flawless custom-er experience. In other words make them very satisfied, not just satisfied.
Bodies like the ICS have successfully spread the customer service message, so there are very few organisations in the UK that don’t now appreciate the benefits of high customer satisfaction.
This is especially relevant in explaining the increase in the UKCSI in the public and regulated sectors as well as more competitive markets.
Trends by sector Customer satisfaction has generally risen across sectors too, albeit not at a uniform rate. Surprisingly, the sectors with the best customer satisfaction have tended to improve more slowly in recent waves. One obvious explanation for this is the simple fact that the higher your customer satis-faction goes, the more difficult it becomes to improve it further.
A related factor, particularly in explain-ing some of the very good gains made by the public sector and some privatised industries, is the product life cycle of customer satisfaction in the UK, which goes back to the 1980s when the first companies started taking notice of the growing focus on customer service in the USA. During that decade, the auto-
motive sector, at least for new car sales, was one of the earliest adopters in the UK, as were retailers. It was well into the 1990s, often after the turn of the Millen-nium, before customer focus started to make an impact on utilities and the public sector, especially the latter.
During the growth phase of the customer focus life cycle in organisations, significant gains are often made from a low base. It’s well established that when organisations undertake their first two or three customer satisfaction surveys, they usually iden-
tify ‘quick wins’ – areas of low customer satisfaction that can be addressed with relatively low difficulty and cost. As this low hanging fruit is picked, further oppor-tunities to improve customer satisfaction tend to be higher up the tree with cor-respondingly greater difficulty and cost attached to addressing them. Examples of quick wins would be ‘keeping cus-tomers informed’ or ‘calling back when promised’, compared with more difficult priorities for improvement such as ‘quality of product’ or ‘lead times’ that are more costly to address and take longer.
60
65
70
75
80
Chart 2: Non-food retail and automotive trends
Wave 1 Wave 2 Wave 3 Wave 4 Wave 5 Wave 6 Wave 7 Wave 8
Retail - non-food Automotive
Launch
Cu
stom
er s
atis
fact
ion
Growth
Utilities
Retail
Automotive
Local government
Maturity
Chart 3: Customer satisfaction and the product life cycle
21www.customer-insight.co.uk | March 2011 customerINSIGHT
Customer

Although it’s had a bumpy ride, and suf-fered a big drop between the first two waves, local government has improved more than any other sector, especially over the last 7 waves. Its rise from 60.1 to 73.7 over this time is a gain of 13.6 or 23%. Utilities have not improved as much, but their overall sector gain of 15% dur-ing the life of the UKCSI still represents an excellent rate of improvement.
Not all sectors have achieved similar levels of improvement. Chart 5 shows that the insurance sector, which was one of the best for customer satisfaction in the early days of the UKCSI, has made a total gain of only 2.6 points (3%) to date. Is this due to the very strong focus on price that pre-vails within the industry?
The January 2011 results As shown in chart 6, the overall UK cus-tomer satisfaction index has improved by 1.1 points this wave to 76.7. All sectors have improved this month. In line with our product life cycle theory, the sec-tors improving the most are Utilities (by 2.2), Government services (national) by 1.9 and local government by 1.6 points. The two retail sectors have improved the least – food by 0.6 and non-food by 0.4. However, both remain over 80 – food at 80.8 and non-food at 80.3. Also on 80.3 is tourism, but at the top of the UKCSI sector league is the services sector with a very good customer satisfaction index of 81.
The top 10Across all sectors, 54 named organisa-tions achieved a CSI over 80; eight are over 85. The 10 highest scoring named organisations are:
John Lewis (89)
Waitrose (89)
BUPA (88)
Marks & Spencer (food) (87)
Lloyds Pharmacy (86)
Marriott (86)
SAGA Holidays (85)
Enterprise Rent-A-Car (85)
Boots (84)
P&O Cruises (84)
Overall
Services
Retail - food
Retail - non-food
Tourism
Automotive
Leisure
Finance - insurance
Finance - banks and building societies
Public Services (local)
Telecommunications
Transport
Public Services
Utilities
50 55 60 65 70 75 80 85 90 95 100
Chart 6: January 2011 results
Jan - 11Jul - 10
60Wave 1 Wave 2 Wave 3 Wave 4 Wave 5 Wave 6 Wave 7 Wave 8
65
70
75
80Chart 4: Trends in utilities and local government
Utilities Local government
Finance - insurance
60Wave 1 Wave 2 Wave 3 Wave 4 Wave 5 Wave 6 Wave 7 Wave 8
65
70
75
80Chart 5: Insurance trends
22 customerINSIGHT March 2011 | www.customer-insight.co.uk
Customer
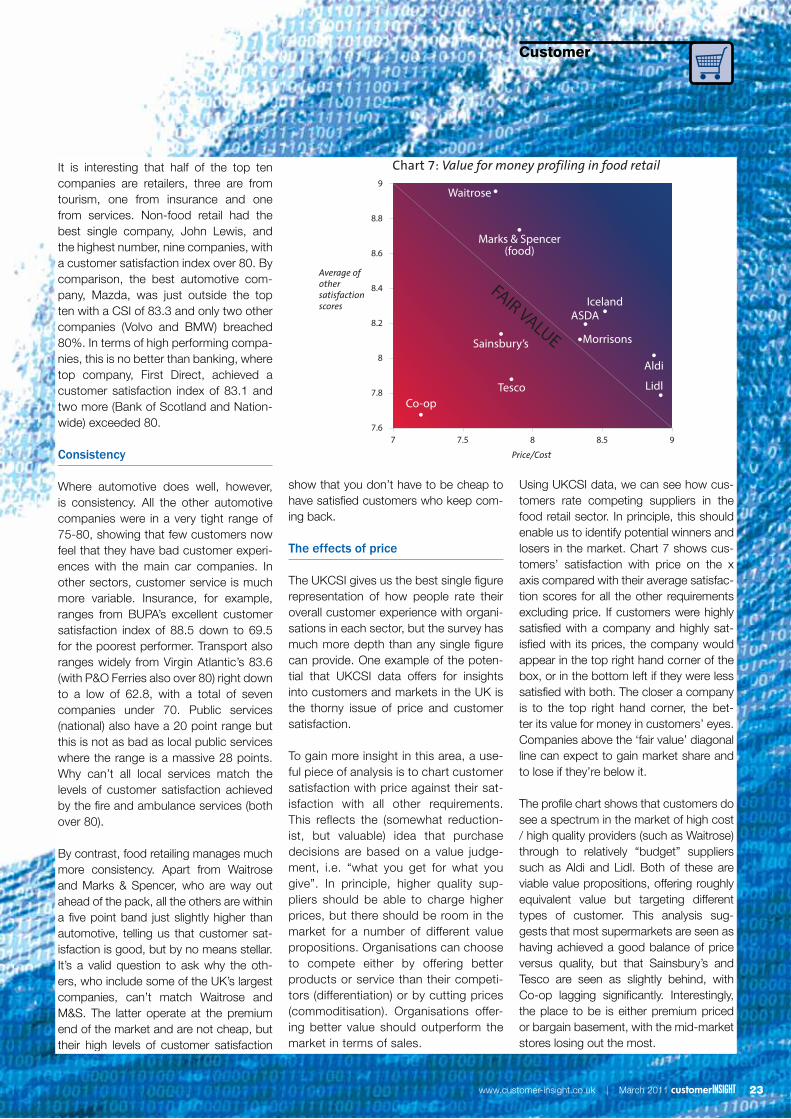
It is interesting that half of the top ten companies are retailers, three are from tourism, one from insurance and one from services. Non-food retail had the best single company, John Lewis, and the highest number, nine companies, with a customer satisfaction index over 80. By comparison, the best automotive com-pany, Mazda, was just outside the top ten with a CSI of 83.3 and only two other companies (Volvo and BMW) breached 80%. In terms of high performing compa-nies, this is no better than banking, where top company, First Direct, achieved a customer satisfaction index of 83.1 and two more (Bank of Scotland and Nation-wide) exceeded 80.
Consistency Where automotive does well, however, is consistency. All the other automotive companies were in a very tight range of 75-80, showing that few customers now feel that they have bad customer experi-ences with the main car companies. In other sectors, customer service is much more variable. Insurance, for example, ranges from BUPA’s excellent customer satisfaction index of 88.5 down to 69.5 for the poorest performer. Transport also ranges widely from Virgin Atlantic’s 83.6 (with P&O Ferries also over 80) right down to a low of 62.8, with a total of seven companies under 70. Public services (national) also have a 20 point range but this is not as bad as local public services where the range is a massive 28 points. Why can’t all local services match the levels of customer satisfaction achieved by the fire and ambulance services (both over 80).
By contrast, food retailing manages much more consistency. Apart from Waitrose and Marks & Spencer, who are way out ahead of the pack, all the others are within a five point band just slightly higher than automotive, telling us that customer sat-isfaction is good, but by no means stellar. It’s a valid question to ask why the oth-ers, who include some of the UK’s largest companies, can’t match Waitrose and M&S. The latter operate at the premium end of the market and are not cheap, but their high levels of customer satisfaction
show that you don’t have to be cheap to have satisfied customers who keep com-ing back.
The effects of price
The UKCSI gives us the best single figure representation of how people rate their overall customer experience with organi-sations in each sector, but the survey has much more depth than any single figure can provide. One example of the poten-tial that UKCSI data offers for insights into customers and markets in the UK is the thorny issue of price and customer satisfaction.
To gain more insight in this area, a use-ful piece of analysis is to chart customer satisfaction with price against their sat-isfaction with all other requirements. This reflects the (somewhat reduction-ist, but valuable) idea that purchase decisions are based on a value judge-ment, i.e. “what you get for what you give”. In principle, higher quality sup-pliers should be able to charge higher prices, but there should be room in the market for a number of different value propositions. Organisations can choose to compete either by offering better products or service than their competi-tors (differentiation) or by cutting prices (commoditisation). Organisations offer-ing better value should outperform the market in terms of sales.
Using UKCSI data, we can see how cus-tomers rate competing suppliers in the food retail sector. In principle, this should enable us to identify potential winners and losers in the market. Chart 7 shows cus-tomers’ satisfaction with price on the x axis compared with their average satisfac-tion scores for all the other requirements excluding price. If customers were highly satisfied with a company and highly sat-isfied with its prices, the company would appear in the top right hand corner of the box, or in the bottom left if they were less satisfied with both. The closer a company is to the top right hand corner, the bet-ter its value for money in customers’ eyes. Companies above the ‘fair value’ diagonal line can expect to gain market share and to lose if they’re below it.
The profile chart shows that customers do see a spectrum in the market of high cost / high quality providers (such as Waitrose) through to relatively “budget” suppliers such as Aldi and Lidl. Both of these are viable value propositions, offering roughly equivalent value but targeting different types of customer. This analysis sug-gests that most supermarkets are seen as having achieved a good balance of price versus quality, but that Sainsbury’s and Tesco are seen as slightly behind, with Co-op lagging significantly. Interestingly, the place to be is either premium priced or bargain basement, with the mid-market stores losing out the most.
Chart 7: Value for money profiling in food retail
77.6
7.8
8
8.2
8.4
8.6
8.8
9
7.5
Co-opTesco
Sainsbury’s
Waitrose
Marks & Spencer(food)
IcelandASDA
Morrisons
Aldi
Lidl
8 8.5 9
FAIR VALUE
Price/Cost
Average ofothersatisfactionscores
23www.customer-insight.co.uk | March 2011 customerINSIGHT
Customer

Concern over public sector spending This time we asked people how con-cerned they were about the impact of the Government’s recent Comprehensive Spending Review on four local services: health services (hospitals, GP surgeries, etc.), policing, local authority services (roads, waste collections, etc.), and edu-cation.
People answered on a scale of 1 to 10, where 10 means very concerned and 1 means not at all concerned; so higher scores show more concern. We asked people how concerned they were about the impact on the quality of services, on responsiveness, and on access.
As Chart 8 shows, there is comparatively little distinction between levels of con-cern across the three aspects of service delivery. There are important differences between the four different services, with Education seeming to be of much less concern. Taking the scores for quality, we can dive into the data in more depth to understand if there are any significant variations according to the type of people responding. In other words, do different types of people have different concerns?
There is a clear interaction between the age of respondents and the level of concern they show about the impact on each service. Not surprisingly, education becomes less of a concern with age, whilst other services tend to become more of a concern.
Women are more concerned than men about all aspects of local service, and this difference is more pronounced for Educa-tion and Health services.
Region also makes a difference, with peo-ple in Wales the most concerned about the likely impact of spending cuts on public services and the English the least concerned. The order of concern is con-sistent except for Northern Ireland, where people are much less concerned about the potential impact on Local Authority services.
Chart 8: Level of concern about public services
Chart 9: Level of concern by age
Chart 10: Level of concern by gender
Chart 11: Level of concern by region
Health services
Policing
Local Authority services
Education
Quality of frontlineservice delivery? Responsiveness?
18-24 25-34
Female
England Scotland Wales NorthernIreland
Region
Male
35-44 45-54
Age
Gender
55-64 65+
Access toservices?
Health servicesPolicing
Local Authority services
Education
Health servicesPolicingLocal Authority services
Education
Health services
Policing
Local Authority services
Education
24 customerINSIGHT March 2011 | www.customer-insight.co.uk
Customer
Ci