Embed Size (px)
Citation preview
The National Minimum Wage in 2020
Uprating Report April 2020Low Pay Commission
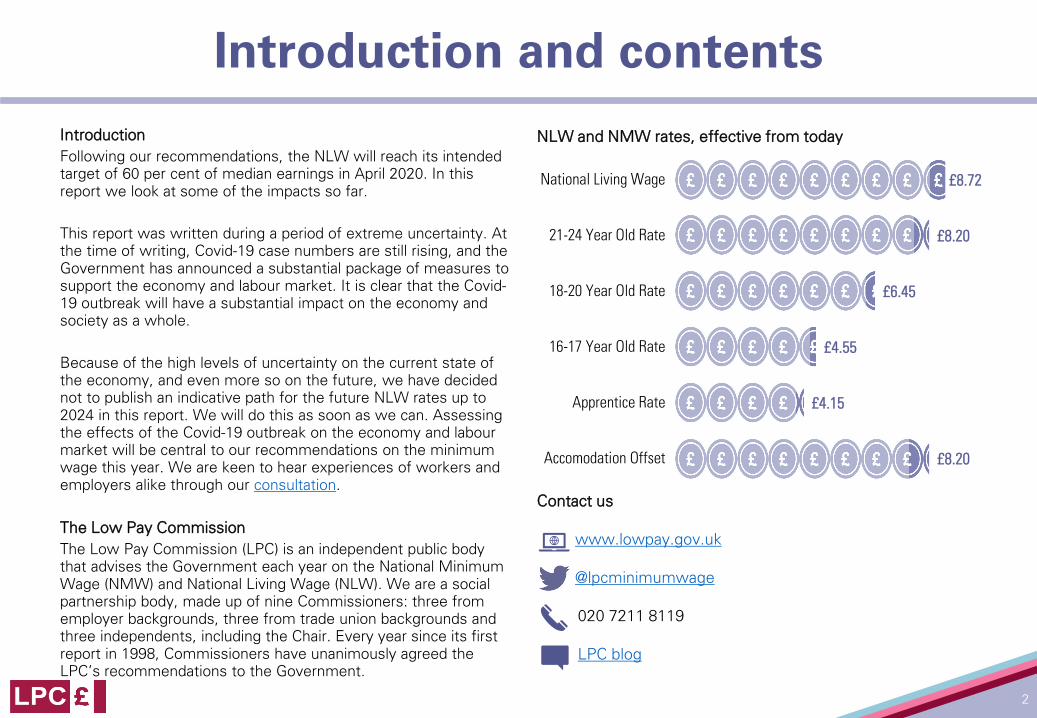
Introduction and contentsIntroductionFollowing our recommendations, the NLW will reach its intended target of 60 per cent of median earnings in April 2020. In this report we look at some of the impacts so far.
This report was written during a period of extreme uncertainty. At the time of writing, Covid-19 case numbers are still rising, and the Government has announced a substantial package of measures to support the economy and labour market. It is clear that the Covid-19 outbreak will have a substantial impact on the economy and society as a whole.
Because of the high levels of uncertainty on the current state of the economy, and even more so on the future, we have decided not to publish an indicative path for the future NLW rates up to 2024 in this report. We will do this as soon as we can. Assessing the effects of the Covid-19 outbreak on the economy and labour market will be central to our recommendations on the minimum wage this year. We are keen to hear experiences of workers and employers alike through our consultation.
The Low Pay CommissionThe Low Pay Commission (LPC) is an independent public body that advises the Government each year on the National Minimum Wage (NMW) and National Living Wage (NLW). We are a social partnership body, made up of nine Commissioners: three from employer backgrounds, three from trade union backgrounds and three independents, including the Chair. Every year since its first report in 1998, Commissioners have unanimously agreed the LPC’s recommendations to the Government.
£8.72
£8.20
£6.45
£4.55
£4.15
£8.20
National Living Wage
21-24 Year Old Rate
18-20 Year Old Rate
16-17 Year Old Rate
Apprentice Rate
Accomodation Offset
2
NLW and NMW rates, effective from today
Contact us
www.lowpay.gov.uk
@lpcminimumwage
020 7211 8119
LPC blog

The National Living WageThe minimum wage before the National Living WageThe National Minimum Wage (NMW) was introduced in April 1999. The LPC was asked to make recommendations to raise the minimum wage as high as possible each year without causing unemployment. At the introduction of the NMW, the main rate applied to workers aged 22 and over and there was a separate rate for those aged 18-21. A 16-17 Year Old Rate was introduced in 2004, while in 2010 the Apprentice Rate was introduced and 21 year olds became eligible for the adult rate of the NMW.
History of the National Living WageThe NLW was originally announced in the July 2015 Budget, a new statutory minimum wage for workers aged 25 and over, set at £7.20 per hour from April 2016. The Government asked the LPC to recommend increases in the NLW to reach a target of 60 per cent of median earnings by 2020, which represented a change from our approach up to that point (the previous approach is still used for the rates applying to workers under 25).
What conditions were there for this ambition?Increases towards this target were subject to the condition of sustained economic growth, but there was a tolerance for some job loss.
We used the Government’s then fiscal rule definition for normal economic conditions – GDP growth of above 1 per cent – as the criterion for sustained economic growth.
In 2015, the Office for Budget Responsibility (OBR) estimated that the NLW’s introduction would mean between 20,000 and 110,000 fewer jobs by 2020 than in its absence. We took this to mean that the Government would tolerate job losses from the NLW in, but not beyond, this range.
Reaching the targetIn our October 2019 recommendations to the Government, we recommended that the NLW increase to £8.72 from April 2020, meeting the 60 per cent target.
While GDP growth has slowed since the announcement of the NLW, it has remained above the 1 per cent annual growth threshold. We have therefore judged that the economy has met the condition of sustained economic growth in every year of the NLW so far.
Overall employment has reached record levels in recent years. While there has been some evidence of decreased employment in some groups from the NLW as set out on page 9, these effects are small and not consistent across years. We have not found any clear evidence of overall job losses and nothing to suggest job losses beyond the Government’s range of tolerance.
Therefore over the four years we have made recommendations on the NLW, we have not decided to deviate from the path to the 60 per cent target.
3
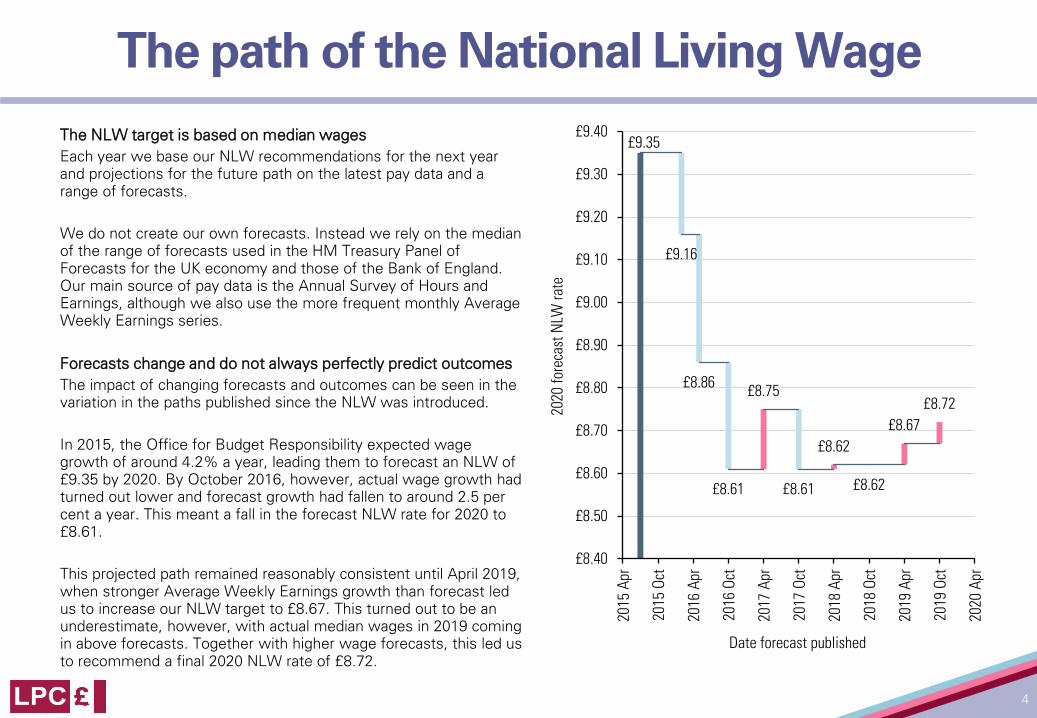
The path of the National Living Wage The NLW target is based on median wagesEach year we base our NLW recommendations for the next year and projections for the future path on the latest pay data and a range of forecasts.
We do not create our own forecasts. Instead we rely on the median of the range of forecasts used in the HM Treasury Panel of Forecasts for the UK economy and those of the Bank of England. Our main source of pay data is the Annual Survey of Hours and Earnings, although we also use the more frequent monthly Average Weekly Earnings series.
Forecasts change and do not always perfectly predict outcomesThe impact of changing forecasts and outcomes can be seen in the variation in the paths published since the NLW was introduced.
In 2015, the Office for Budget Responsibility expected wage growth of around 4.2% a year, leading them to forecast an NLW of £9.35 by 2020. By October 2016, however, actual wage growth had turned out lower and forecast growth had fallen to around 2.5 per cent a year. This meant a fall in the forecast NLW rate for 2020 to £8.61.
This projected path remained reasonably consistent until April 2019, when stronger Average Weekly Earnings growth than forecast led us to increase our NLW target to £8.67. This turned out to be an underestimate, however, with actual median wages in 2019 coming in above forecasts. Together with higher wage forecasts, this led us to recommend a final 2020 NLW rate of £8.72.
£9.35
£9.16
£8.86
£8.61
£8.75
£8.61
£8.62
£8.62
£8.67£8.72
£8.40
£8.50
£8.60
£8.70
£8.80
£8.90
£9.00
£9.10
£9.20
£9.30
£9.40
2015
Apr
2015
Oct
2016
Apr
2016
Oct
2017
Apr
2017
Oct
2018
Apr
2018
Oct
2019
Apr
2019
Oct
2020
Apr
2020
fore
cast
NLW
rate
Date forecast published
4
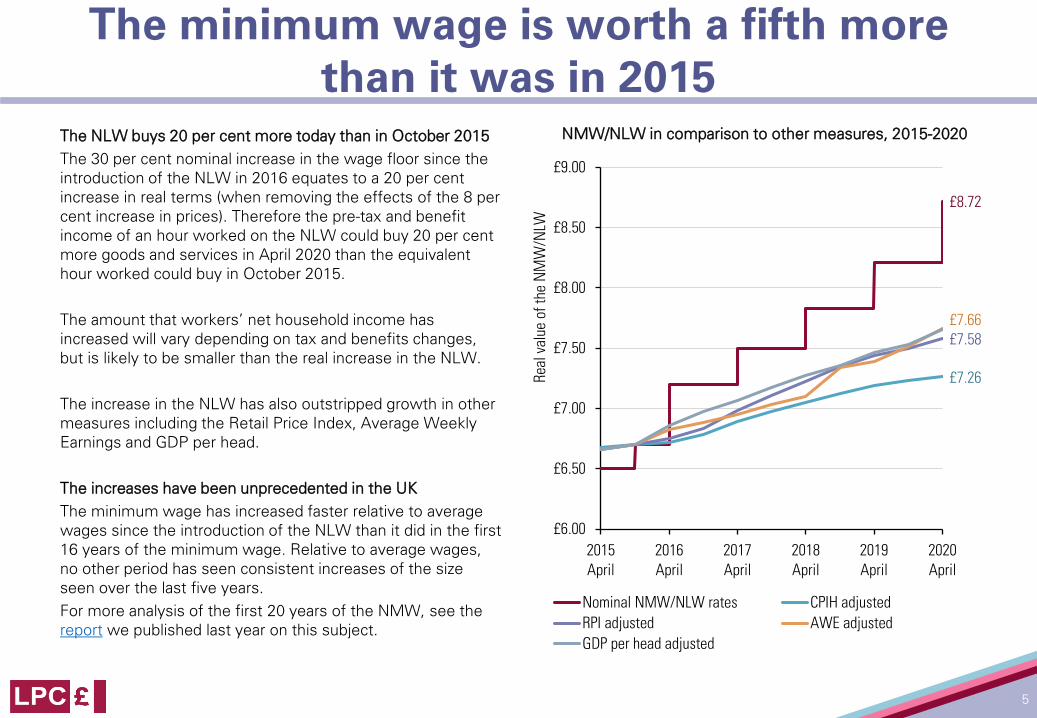
The minimum wage is worth a fifth more than it was in 2015
The NLW buys 20 per cent more today than in October 2015The 30 per cent nominal increase in the wage floor since the introduction of the NLW in 2016 equates to a 20 per cent increase in real terms (when removing the effects of the 8 per cent increase in prices). Therefore the pre-tax and benefit income of an hour worked on the NLW could buy 20 per cent more goods and services in April 2020 than the equivalent hour worked could buy in October 2015.
The amount that workers’ net household income has increased will vary depending on tax and benefits changes, but is likely to be smaller than the real increase in the NLW.
The increase in the NLW has also outstripped growth in other measures including the Retail Price Index, Average Weekly Earnings and GDP per head.
The increases have been unprecedented in the UKThe minimum wage has increased faster relative to average wages since the introduction of the NLW than it did in the first 16 years of the minimum wage. Relative to average wages, no other period has seen consistent increases of the size seen over the last five years.For more analysis of the first 20 years of the NMW, see the report we published last year on this subject.
£8.72
£7.26
£7.58£7.66
£6.00
£6.50
£7.00
£7.50
£8.00
£8.50
£9.00
2015April
2016April
2017April
2018April
2019April
2020April
Real
val
ue o
f the
NM
W/N
LW
Nominal NMW/NLW rates CPIH adjustedRPI adjusted AWE adjustedGDP per head adjusted
5
NMW/NLW in comparison to other measures, 2015-2020

The number of workers who earn the NLW is considerably below predictions…
In every year of the NLW so far, the number paid the NLW has remained constantEvery year since 2016, around 6.5 per cent of workers aged 25 and over have been covered by the rate (earning up to 5p above the NLW). In 2016 we anticipated that the number paid the rate would increase over the period, with coverage of up to 14 per cent of workers aged 25 and over by the time it reached 60 per cent of median pay in 2020. However, these predictions have not been borne out.
Our view is that the upper-bound of coverage this year is 9.5 per cent, but it is likely to be much closer to the current level, at around half what was predicted in 2016.
We now think of these coverage predictions as capturing a ‘minimum number who will be directly affected’ by NLW increases; their pay has to rise faster than it otherwise would, to stay ahead of the rising wage floor.
This is because the NLW has led to wage ‘spillovers’We look at this further overleaf, but in summary the NLW has led to increases for workers earning above the minimum, as employers try to keep their workers’ pay above the wage floor.
0
2
4
6
8
10
12
14
2015 2016 2017 2018 2019 2020W
orke
rs a
ged
25 a
nd o
ver c
over
ed b
y th
e N
LW (p
er c
ent)
Out-turnForecasts in the 2016 Spring reportForecasts in the 2016 Autumn reportForecasts in the 2017 reportForecasts in the 2018 reportForecasts in the 2019 report
6
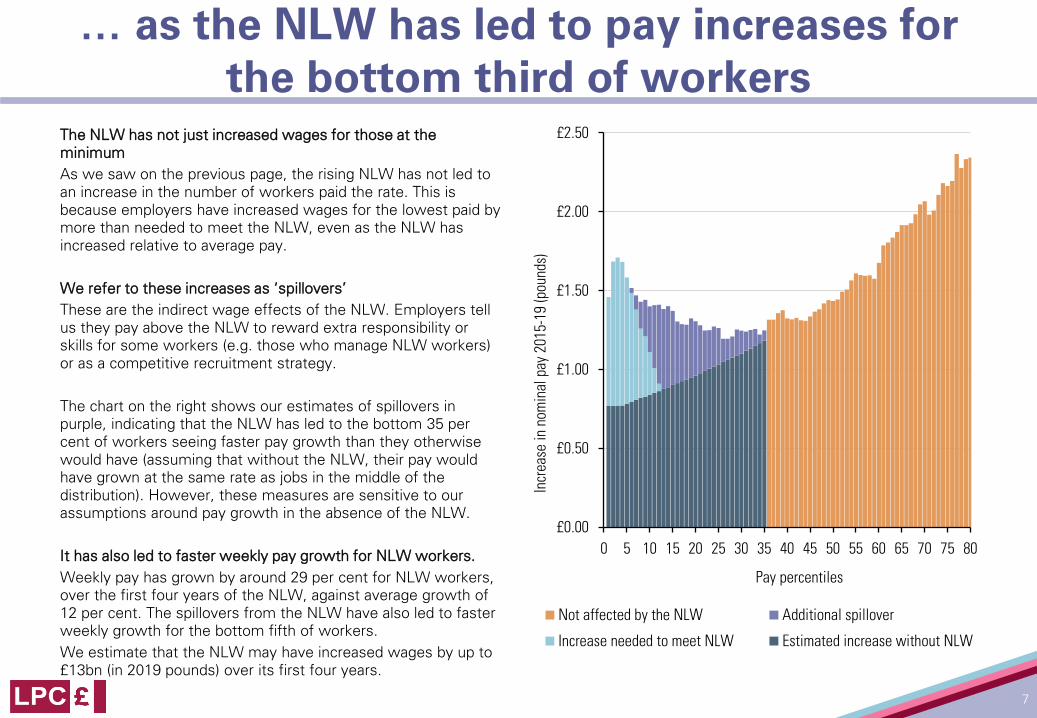
… as the NLW has led to pay increases for the bottom third of workers
The NLW has not just increased wages for those at the minimumAs we saw on the previous page, the rising NLW has not led to an increase in the number of workers paid the rate. This is because employers have increased wages for the lowest paid by more than needed to meet the NLW, even as the NLW has increased relative to average pay.
We refer to these increases as ‘spillovers’These are the indirect wage effects of the NLW. Employers tell us they pay above the NLW to reward extra responsibility or skills for some workers (e.g. those who manage NLW workers) or as a competitive recruitment strategy.
The chart on the right shows our estimates of spillovers in purple, indicating that the NLW has led to the bottom 35 per cent of workers seeing faster pay growth than they otherwise would have (assuming that without the NLW, their pay would have grown at the same rate as jobs in the middle of the distribution). However, these measures are sensitive to our assumptions around pay growth in the absence of the NLW.
It has also led to faster weekly pay growth for NLW workers. Weekly pay has grown by around 29 per cent for NLW workers, over the first four years of the NLW, against average growth of 12 per cent. The spillovers from the NLW have also led to faster weekly growth for the bottom fifth of workers.We estimate that the NLW may have increased wages by up to £13bn (in 2019 pounds) over its first four years.
£0.00
£0.50
£1.00
£1.50
£2.00
£2.50
0 5 10 15 20 25 30 35 40 45 50 55 60 65 70 75 80In
crea
se in
nom
inal
pay
201
5-19
(pou
nds)
Pay percentiles
Not affected by the NLW Additional spillover
Increase needed to meet NLW Estimated increase without NLW
7
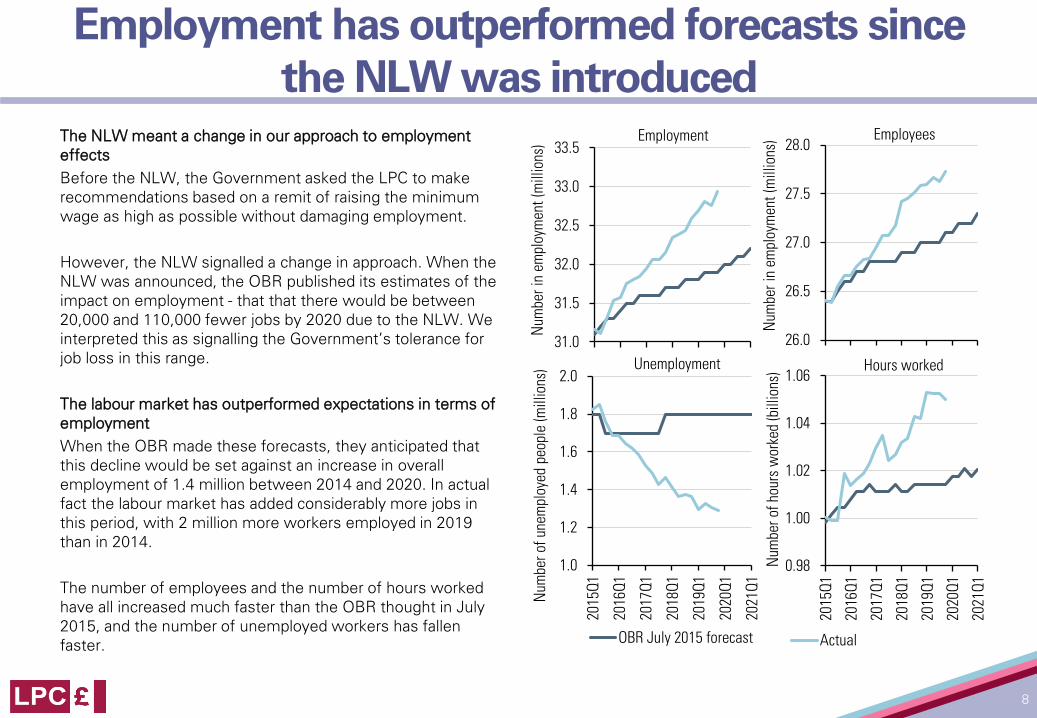
Employment has outperformed forecasts since the NLW was introduced
The NLW meant a change in our approach to employment effectsBefore the NLW, the Government asked the LPC to make recommendations based on a remit of raising the minimum wage as high as possible without damaging employment.
However, the NLW signalled a change in approach. When the NLW was announced, the OBR published its estimates of the impact on employment - that that there would be between 20,000 and 110,000 fewer jobs by 2020 due to the NLW. We interpreted this as signalling the Government’s tolerance for job loss in this range.
The labour market has outperformed expectations in terms of employmentWhen the OBR made these forecasts, they anticipated that this decline would be set against an increase in overall employment of 1.4 million between 2014 and 2020. In actual fact the labour market has added considerably more jobs in this period, with 2 million more workers employed in 2019 than in 2014.
The number of employees and the number of hours worked have all increased much faster than the OBR thought in July 2015, and the number of unemployed workers has fallen faster.
31.0
31.5
32.0
32.5
33.0
33.5Employment
Num
beri
n em
ploy
men
t (m
illio
ns)
8
26.0
26.5
27.0
27.5
28.0Employees
Num
beri
n em
ploy
men
t (m
illio
ns)
1.0
1.2
1.4
1.6
1.8
2.0
2015
Q1
2016
Q1
2017
Q1
2018
Q1
2019
Q1
2020
Q1
2021
Q1
Num
ber o
f une
mpl
oyed
peo
ple
(mill
ions
) Unemployment
OBR July 2015 forecast
0.98
1.00
1.02
1.04
1.06
2015
Q1
2016
Q1
2017
Q1
2018
Q1
2019
Q1
2020
Q1
2021
Q1
Num
ber o
f hou
rs w
orke
d (b
illio
ns) Hours worked
Actual

There is no strong evidence of overall employment effects from the NLW
We measure the employment effects of minimum wages mainly through econometric analysis.We have commissioned three research projects examining the effect of the NLW on employment and received evidence from another project.
Aitken, Dolton, and Riley (2018) examined how the introduction of the NLW and the first uprating in 2017 affected employment retention. They found evidence that the introduction of the NLW had a small negative effect on employment retention for women working part-time, but no strong evidence of an overall effect or an effect in 2017.
Capuano, Cockett, Gray, and Papoutsaki (2019) built on the work of Aitken, Dolton, and Riley (2018) and examined the effect of the introduction of the NLW and the 2017 and 2018 upratings. They found that the introduction of the NLW reduced employment retention for both male and female part-time workers, but little evidence of an effect on hours worked. They found no evidence of an employment effect in 2017 and some evidence of a positive effect in 2018 for part-time women.
McGuinness, McVicar, and Park (2017) examined the effect of the introduction of the NLW in Northern Ireland, using the Republic of Ireland as a control, and found no effect on employment.
Ongoing work by Dickens and Lind found that the 2017 increase in the NLW reduced employment for female part-time workers, but found no effect from the introduction in 2016.
In each of these studies the effects on jobs were small and were not found in all specifications of the research.
Furthermore, the employment rates of groups of workers more exposed to the NLW has increased more quickly than for all workers.
9
Men
Women
White
Ethnic minorities
With qualifications
No qualifications
2016
Q120
16Q3
2017
Q120
17Q3
2018
Q120
18Q3
2019
Q120
19Q3
8
6
4
2
0
8
6
4
2
0
8
6
4
2
0
Four quarters to
Grow
th o
n fo
ur q
uarte
rs to
201
6Q1
(per
cent
age
poin
t)Not
disabled
Disabled
UK-born
Non-UK born
30-5925-29
2016
Q120
16Q3
2017
Q120
17Q3
2018
Q120
18Q3
2019
Q120
19Q3
8
6
4
2
0
8
6
4
2
0
8
6
4
2
0
Four quarters to
Young workers have seen fast increases in their pay floor over the NLW period
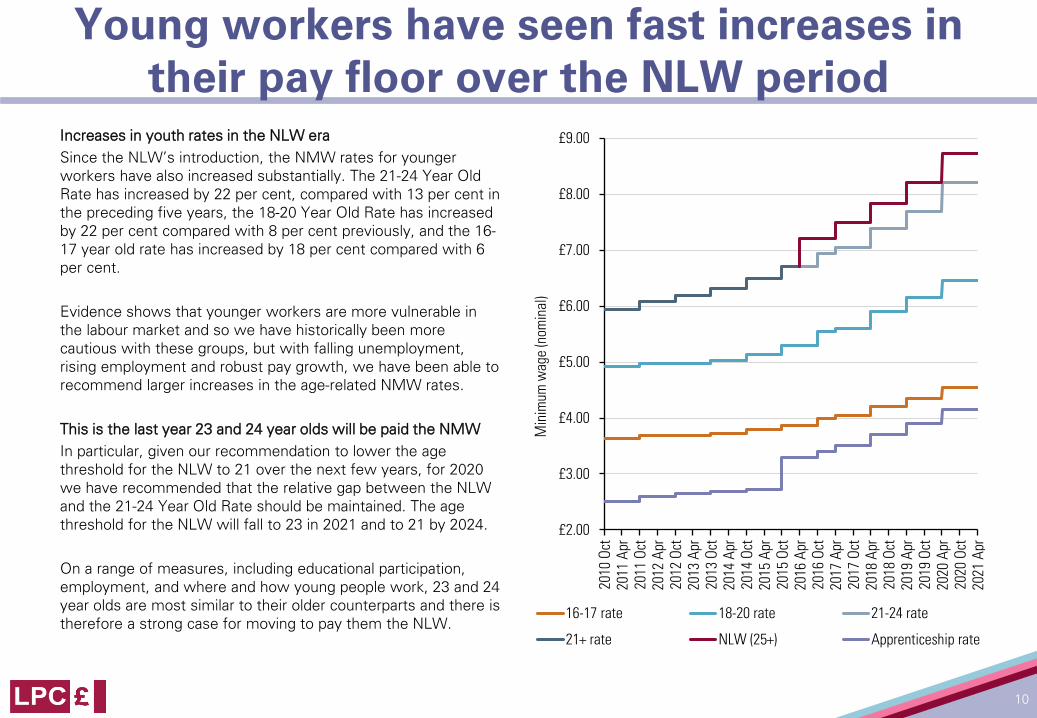
Increases in youth rates in the NLW eraSince the NLW’s introduction, the NMW rates for younger workers have also increased substantially. The 21-24 Year Old Rate has increased by 22 per cent, compared with 13 per cent in the preceding five years, the 18-20 Year Old Rate has increased by 22 per cent compared with 8 per cent previously, and the 16-17 year old rate has increased by 18 per cent compared with 6 per cent.
Evidence shows that younger workers are more vulnerable in the labour market and so we have historically been more cautious with these groups, but with falling unemployment, rising employment and robust pay growth, we have been able to recommend larger increases in the age-related NMW rates.
This is the last year 23 and 24 year olds will be paid the NMWIn particular, given our recommendation to lower the age threshold for the NLW to 21 over the next few years, for 2020 we have recommended that the relative gap between the NLW and the 21-24 Year Old Rate should be maintained. The age threshold for the NLW will fall to 23 in 2021 and to 21 by 2024.
On a range of measures, including educational participation, employment, and where and how young people work, 23 and 24 year olds are most similar to their older counterparts and there is therefore a strong case for moving to pay them the NLW.
£2.00
£3.00
£4.00
£5.00
£6.00
£7.00
£8.00
£9.00
2010
Oct
2011
Apr
2011
Oct
2012
Apr
2012
Oct
2013
Apr
2013
Oct
2014
Apr
2014
Oct
2015
Apr
2015
Oct
2016
Apr
2016
Oct
2017
Apr
2017
Oct
2018
Apr
2018
Oct
2019
Apr
2019
Oct
2020
Apr
2020
Oct
2021
Apr
Min
imum
wag
e (n
omin
al)
16-17 rate 18-20 rate 21-24 rate
21+ rate NLW (25+) Apprenticeship rate
10
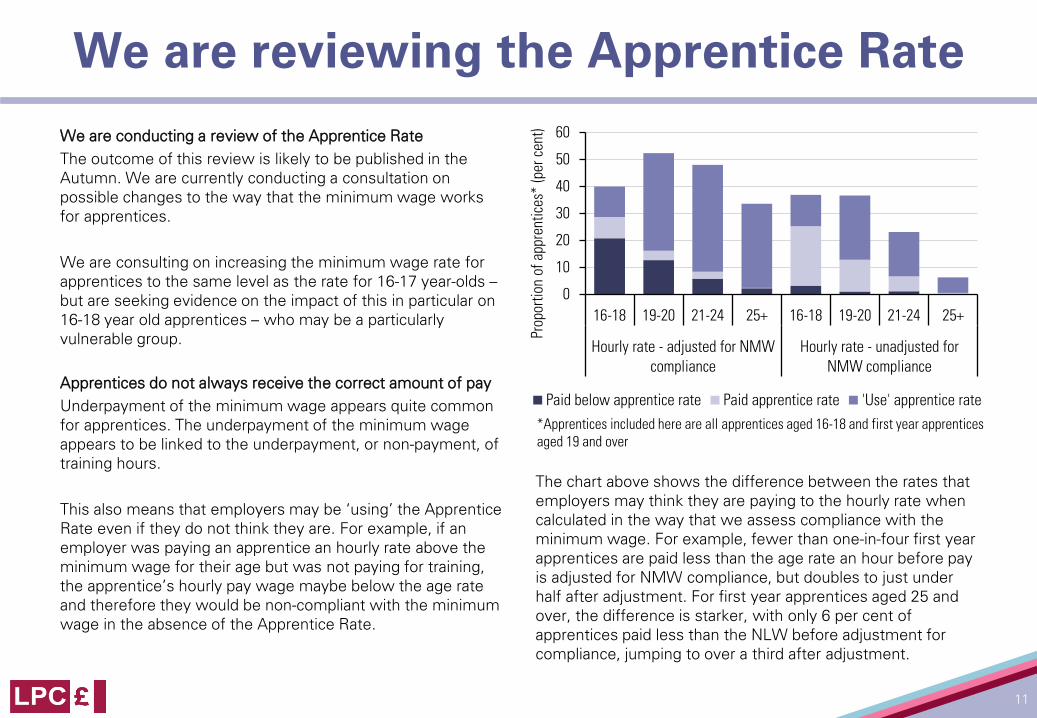
We are reviewing the Apprentice RateWe are conducting a review of the Apprentice RateThe outcome of this review is likely to be published in the Autumn. We are currently conducting a consultation on possible changes to the way that the minimum wage works for apprentices.
We are consulting on increasing the minimum wage rate for apprentices to the same level as the rate for 16-17 year-olds –but are seeking evidence on the impact of this in particular on 16-18 year old apprentices – who may be a particularly vulnerable group.
Apprentices do not always receive the correct amount of payUnderpayment of the minimum wage appears quite common for apprentices. The underpayment of the minimum wage appears to be linked to the underpayment, or non-payment, of training hours.
This also means that employers may be ‘using’ the Apprentice Rate even if they do not think they are. For example, if an employer was paying an apprentice an hourly rate above the minimum wage for their age but was not paying for training, the apprentice’s hourly pay wage maybe below the age rate and therefore they would be non-compliant with the minimum wage in the absence of the Apprentice Rate.
The chart above shows the difference between the rates that employers may think they are paying to the hourly rate when calculated in the way that we assess compliance with the minimum wage. For example, fewer than one-in-four first year apprentices are paid less than the age rate an hour before pay is adjusted for NMW compliance, but doubles to just under half after adjustment. For first year apprentices aged 25 and over, the difference is starker, with only 6 per cent of apprentices paid less than the NLW before adjustment for compliance, jumping to over a third after adjustment.
11
0
10
20
30
40
50
60
16-18 19-20 21-24 25+ 16-18 19-20 21-24 25+
Hourly rate - adjusted for NMWcompliance
Hourly rate - unadjusted forNMW compliance
Prop
ortio
n of
app
rent
ices
* (p
er c
ent)
Paid below apprentice rate Paid apprentice rate 'Use' apprentice rate
*Apprentices included here are all apprentices aged 16-18 and first year apprentices aged 19 and over
Up to 2.8 million workers will benefit directly from our recommendations
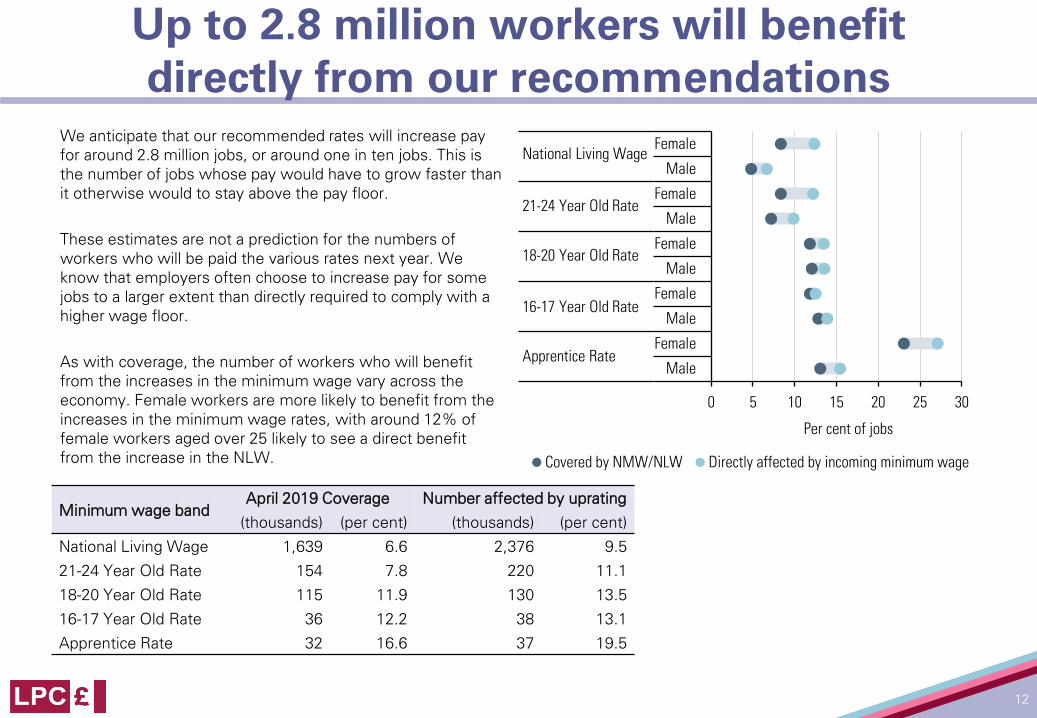
We anticipate that our recommended rates will increase pay for around 2.8 million jobs, or around one in ten jobs. This is the number of jobs whose pay would have to grow faster than it otherwise would to stay above the pay floor.
These estimates are not a prediction for the numbers of workers who will be paid the various rates next year. We know that employers often choose to increase pay for some jobs to a larger extent than directly required to comply with a higher wage floor.
As with coverage, the number of workers who will benefit from the increases in the minimum wage vary across the economy. Female workers are more likely to benefit from the increases in the minimum wage rates, with around 12% of female workers aged over 25 likely to see a direct benefit from the increase in the NLW.
0 5 10 15 20 25 30
Male
Female
Male
Female
Male
Female
Male
Female
Male
Female
Per cent of jobs
Covered by NMW/NLW Directly affected by incoming minimum wage
National Living Wage
21-24 Year Old Rate
18-20 Year Old Rate
16-17 Year Old Rate
Apprentice Rate
12
Minimum wage bandApril 2019 Coverage Number affected by uprating
(thousands) (per cent) (thousands) (per cent)National Living Wage 1,639 6.6 2,376 9.521-24 Year Old Rate 154 7.8 220 11.118-20 Year Old Rate 115 11.9 130 13.516-17 Year Old Rate 36 12.2 38 13.1Apprentice Rate 32 16.6 37 19.5
The Government’s remit to the LPCThe National Living WageOn March 11 the Government announced a new remit for the LPC, which you can find here. This asks us to recommend the rate to apply from April 2021 following a path that reaches two-thirds of median earnings by 2024, taking economic conditions into account. In line with recommendations we made to the Government last August, from April 2021 the NLW will apply to workers aged 23 and over, and by 2024 it will apply to workers aged 21 and over.
In our new remit, the Government also asked us to set out our evidence strategy to monitor and evaluate the NLW’s impact as we move towards the two-thirds target. This includes commissioning policy evaluations from leading researchers and expanding our own use of standardised evaluation tools, using new methods and evidence sources to assess the policy’s impacts, in line with the recommendations of Professor Arin Dube’s review of international evidence.
An ‘emergency brake’Our new remit asks us to monitor the labour market, advise on any emerging risks and – if the economic evidence warrants it – recommend that the Government reviews its target or timeframe.
This ‘emergency brake’ is a fundamental part of the new NLW target, and means the LPC has the ability to recommend reconsidering the target if the evidence suggests it would be damaging for the lowest-paid workers.
The ongoing Covid-19 pandemic clearly represents a very challenging set of circumstances for workers and employers alike, and will require us to review whether an emergency brake is required. But to make this decision, the quality of the evidence we collect will be vital.
Other National Minimum Wage rates Our remit with regard to the other rates, for workers aged under 23 and apprentices, remains the same as before the NLW was introduced: we are tasked with helping as many low-paid workers as possible without damaging their employment prospects. In addition, we were asked to recommend the level of the Accommodation Offset rate that should apply from April 2021.
Our evidence baseWe make recommendations based on a variety of evidence sources. This year our evidence-gathering will be disrupted by the ongoing Covid-19 outbreak, and the travel disruption it entails. We have for, example, suspended our planned programme of regional visits, and will be making extensive use of remote meeting options.
Nevertheless, it remains more important than ever for us to collect evidence on the labour market and the economy, and we will continue to work to fulfil our remit, taking into account the ongoing impacts of the pandemic. This includes our written consultation (currently open and available here) as well as a range of meetings, research and analysis.
13
We are lowering the NLW age threshold
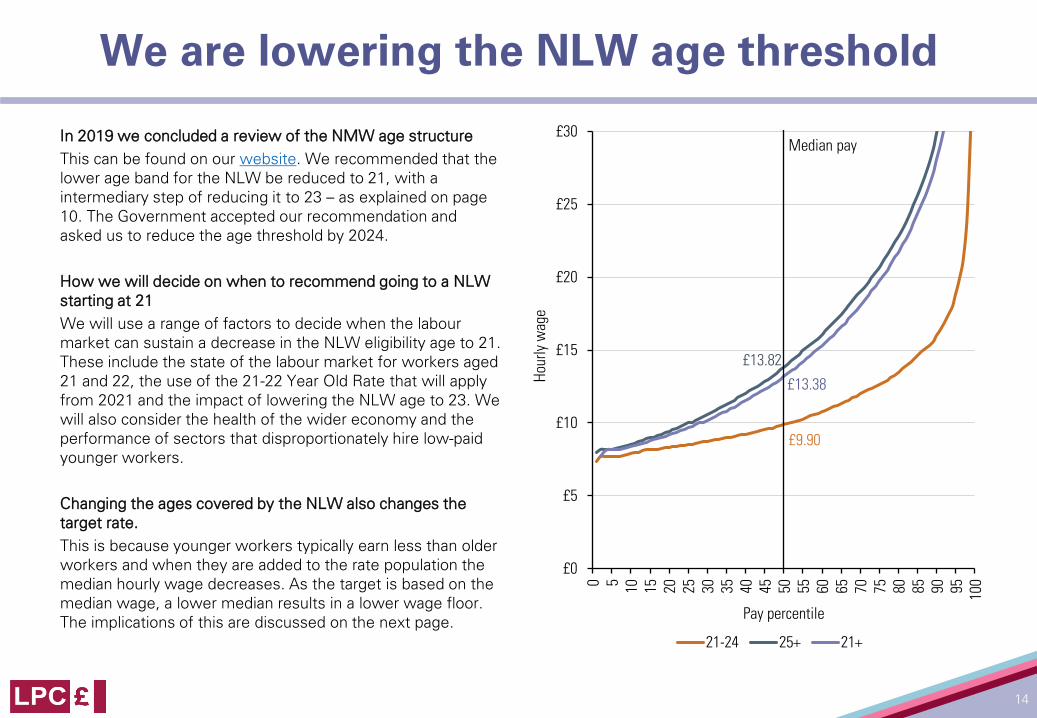
In 2019 we concluded a review of the NMW age structureThis can be found on our website. We recommended that the lower age band for the NLW be reduced to 21, with a intermediary step of reducing it to 23 – as explained on page 10. The Government accepted our recommendation and asked us to reduce the age threshold by 2024.
How we will decide on when to recommend going to a NLW starting at 21We will use a range of factors to decide when the labour market can sustain a decrease in the NLW eligibility age to 21. These include the state of the labour market for workers aged 21 and 22, the use of the 21-22 Year Old Rate that will apply from 2021 and the impact of lowering the NLW age to 23. We will also consider the health of the wider economy and the performance of sectors that disproportionately hire low-paid younger workers.
Changing the ages covered by the NLW also changes the target rate.This is because younger workers typically earn less than older workers and when they are added to the rate population the median hourly wage decreases. As the target is based on the median wage, a lower median results in a lower wage floor. The implications of this are discussed on the next page.
£9.90
£13.82
£13.38
£0
£5
£10
£15
£20
£25
£30
0 5 10 15 20 25 30 35 40 45 50 55 60 65 70 75 80 85 90 95 100
Hour
ly w
age
Pay percentile
21-24 25+ 21+
Median pay
14

The NLW towards 2024Our intention had been to set out some initial thinking on the future path of the NLW up to 2024, but given the lack of clarity on the current state of the labour market and on the future we have decided not to do this. However, we will do so as soon as we can.
The Future Path of the NLWOur approach to the new NLW target will mirror our approach up until now. If we judge that economic conditions allow, we will aim to increase the ratio of the NLW to average earnings of the group eligible for the minimum wage evenly across the period to 2024.
As discussed previously, this means the NLW would increase more quickly in the first few years, as the target will be based on the median wage of those aged 23 and over. We may choose to recommend lowering the eligibility age for the NLW in 2023, in which case the NLW will be lower than if we decide to wait until 2024, hence the multiple estimates for that year.
We will produce and regularly update estimates of the path, to minimise unexpected changes in the on-course rates. We will aim to provide some certainty to employers, while making clear the potential variability of the path.
How we will respond to changing economic circumstancesIn our remit we were asked to recommend that the Government reviews its target or timeframe if the evidence warrants it. The indicators of the state of the economy we will look at include: the overall output of the economy, the level of employment (particularly in low-paying sectors) and growth in earnings and productivity.
If we decide that, in response to the effects of Covid-19, or another economic shock, that it was time to pull our ‘emergency brake’ this could take two forms:
1. We could choose to reduce the increase in a given year, but still commit to reaching the two-thirds target in 2024. This means that increases in the NLW in subsequent years would be higher.
2. We could choose to recommend that the Government delay the target year, so we aim for a NLW at two-thirds of median wages in 2025 or later. This would mean that increases in each year could be smaller than if we decided not to delay.
The choice between these two options would depend on the anticipated size and length of any effects on pay and employment and the Government’s appetite for risk.
15
Forthcoming LPC publicationsFuture LPC publications and consultations• We will publish a report on non-compliance and
enforcement next month.• Our consultation on the 2021 NLW and NMW rates is
currently open and can be found on our website.• Our programme of regional visits around the country has
now been suspended, given the impact of Covid-19.• In the autumn we will make our recommendations to the
Government and on the 2021 minimum wage rates and conclude our review of apprentice minimum wage rates.
The data for the charts in this report are published on our website here.
© Crown copyright 2020
This publication is licensed under the terms of the Open Government Licence v3.0 except where otherwise stated. To view this licence, visit nationalarchives.gov.uk/doc/open-government-licence/version/3 or write to the Information Policy Team, The National Archives, Kew, London TW9 4DU, or email: [email protected].
Where we have identified any third-party copyright information you will need to obtain permission from the copyright holders concerned.
Any enquiries regarding this publication should be sent to us at: [email protected]
16
Contact us
www.lowpay.gov.uk
@lpcminimumwage
020 7211 8119
LPC blog