Embed Size (px)
Citation preview
www.elsevier.com/locate/jhep
Journal of Hepatology 47 (2007) 37–45
The natural history of hepatitis C with severe hepatic fibrosis q,qq
Adam Lawson1, Simone Hagan2, Kara Rye3, Nader Taguri4, Sonia Ratib4,Abed M. Zaitoun5, Keith R. Neal6, Stephen D. Ryder1,
William L. Irving4,*, The Trent HCV Study Group1Wolfson Digestive Disease Foundation, University Hospital, Queens Medical Centre, Nottingham, UK
2Department of Gastroenterology, Royal Hallamshire Hospital, Sheffield, UK3Department of Gastroenterology, Derby City General Hospital, Derby, UK
4Division of Microbiology, University Hospital, Queens Medical Centre, Nottingham, UK5Division of Histopathology, University Hospital, Queens Medical Centre, Nottingham, UK
6Division of Epidemiology and Public Health, University Hospital, Queens Medical Centre, Nottingham, UK
Background/Aims: To examine the morbidity and mortality of patients with severe fibrosis secondary to HCV infection,within a population unbiased by tertiary referral.
Methods: One hundred and fifty HCV infected patients were identified from the Trent HCV study with a liver biopsy
taken before 2002 demonstrating severe fibrosis (Ishak stage P 4). Follow-up data were extracted from the database
and hospital records.
Results: Median follow-up was 51 months. Of the 131 patients with no prior history of decompensation, 33 (25%) died
(n = 25) or were transplanted (n = 8), after a median interval of 42 months. The probability of survival without liver trans-
plantation was 97%, 88%, and 78% at 1, 3, and 5 years, respectively. Hepatocellular carcinoma and /or decompensation
was diagnosed in 33 (25%), after a median interval of 41 months. In multivariate analysis, combination antiviral therapywas associated with improved survival. Prognosis was not affected by the Ishak stage at index biopsy. There was a worse
prognosis for the 19 patients with previous decompensation; 17 (89%) having either died (n = 15) or been transplanted
(n = 2).
Conclusions: This study demonstrates that severe liver fibrosis (Ishak stage P 4) secondary to hepatitis C is associated
with a poor prognosis, that may be improved following combination antiviral treatment.
� 2007 European Association for the Study of the Liver. Published by Elsevier B.V. All rights reserved.
Keywords: Liver; Severe fibrosis; Hepatitis C; Cirrhosis; Antiviral drugs; Mortality; Morbidity
0168-8278/$32.00 � 2007 European Association for the Study of the Liver.
doi:10.1016/j.jhep.2007.02.010
Received 6 December 2006; received in revised form 30 January 2007;
accepted 14 February 2007; available online 7 March 2007q Funding: The Trent HCV study group has received funding from
the Department of Health in support of this study.qq The authors who have taken part in this study declared that theyhave no relationship with the manufacturers of the drugs involvedeither in the past or present and did not receive funding from themanufacturers to carry out their research. The authors receivedfunding from the Department of Health (UK) which enabled them tocarry out their study.
* Corresponding author. Tel.: +44 115 823 0752; fax: +44 115 8230759.
E-mail address: [email protected] (W.L. Irving).
1. Introduction
Hepatitis C (HCV) is a leading cause of liver diseasewith an estimated 170 million infected people worldwide[1], 20–30% of whom will develop cirrhosis [2,3]. A betterunderstanding of the clinical course and prognosis ofpatients with HCV infection and severe fibrosis is impor-tant in aiding patient management decisions, and ininforming mathematical models of disease progressionand cost-benefit analyses of different therapeutic strate-gies. Epidemiological studies of disease progression haveshown that the patient population selected has an impor-tant bearing on the results [4]. The majority of studies
Published by Elsevier B.V. All rights reserved.
38 A. Lawson et al. / Journal of Hepatology 47 (2007) 37–45
examining the natural history of cirrhosis secondary toHCV have come from tertiary referral centres, haveincluded predominantly those infected following bloodtransfusion and are largely from an era before the adventof effective therapy [5–8]. With the elimination of blood asa route of transmission in the majority of western coun-tries, patients who acquired hepatitis C from injectingdrug use are now the main source of new referrals. Thisstudy describes the natural history of HCV with severefibrosis within a broad patient population that typifiesthose patients currently attending hepatitis clinics.
2. Patients and methods
The Trent HCV cohort study, established in 1991, addresses theepidemiology and natural history of HCV infection in a defined andrepresentative area of the UK (Trent Health Care region: population5.1 million). None of the participating clinics operate as a tertiaryreferral centre for areas outside the region. The study has approvalfrom a Multi-centre Research Ethics Committee.
Patients are enrolled with informed consent. Risk factor data arecategorised hierarchically as: (1) injecting drug use, (2) receipt of blood(pre-1991) or blood product (pre-1986) transfusion, (3) other risk fac-tor (born abroad, non-professional tattoo, professional tattoo pre-1982), (4) none of the above risk factors, and (5) risk factor data miss-ing. Duration of infection is estimated on the assumption that infectionwas acquired at the first exposure to risk. Information is also collectedon past alcohol consumption at enrolment and subsequently on alco-hol consumption over the week prior to clinic attendance. Therapy isoffered to patients with moderate or severe disease [9]. Patients withknown human immunodeficiency virus infection or inherited coagula-tion disorders are identifiable within the cohort but excluded fromanalysis as the natural history may differ in these groups.
Patients are flagged with the National Health Service Central Reg-ister (NHSCR). This identifies deaths and cancer registrations, andforwards the information regularly to the study group.
2.1. Study population
As of December 2001, 2003 patients had been enrolled into theTrent study of which 1003 had at least one liver biopsy with an Ishakdisease severity score [10]. For this study we included all chronicallyHCV-infected patients with a liver biopsy (the index biopsy) prior toJanuary 1st 2002 demonstrating severe fibrosis, defined as Ishakstage P 4 (n = 155). Patients were then excluded if they had (1) evi-dence of hepatocellular carcinoma (HCC) at or within 6 months ofentry into the study (n = 1); or (2) co-existing liver disease that couldpotentially have caused severe fibrosis (n = 4: 3 with active HBV infec-tion, 1 haemachromatosis). The final cohort (n = 150) contained 3patients with a positive HBV surface antigen, but an undetectableHBV DNA. Nineteen patients had evidence of decompensated liverdisease (defined below) prior to the index biopsy.
2.2. Follow-up
Entry into the study was defined as the date of the index biopsy. Fol-low-up was until the date of death or liver transplantation, or the lastrecorded clinic visit prior to data collection. Data on patients were gath-ered from the Trent HCV study database and from review of hospitalrecords, including laboratory databases. Baseline laboratory values wereaccepted if within 6 months of the index biopsy and were used in con-junction with the clinical information to calculate a retrospectiveChild–Pugh grade. The primary endpoint was death or liver transplanta-tion, with death judged as being related to HCV infection if it was asso-ciated with a progressive impairment of liver function, acute varicealhaemorrhage, or the result of HCC. Secondary endpoints were HCC
(diagnosed by imaging modalities) and decompensation, defined as thefirst appearance of jaundice (bilirubin > 50 lmol/L with no other identi-fiable cause), ascites (proven by paracentesis or imaging), endoscopicallyproven variceal haemorrhage, or hepatic encephalopathy.
109/150 patients had received at least one course of antiviral ther-apy, with 92 (84%) starting treatment after the index biopsy. A sus-tained virological response (SVR) was defined as a lack of detectableHCV RNA 6 months after completing therapy.
2.3. Statistical analysis
SPSS V13 was used for all the statistical analyses. Survival analyseswere performed using Life Tables to estimate 1, 3, and 5 year survival,Kaplan–Meier plots were used for the survival curves and Cox propor-tional hazards for predictors of death. In the Cox models survival anal-yses were calculated using death or liver transplant as the outcome. Allvariables were included in at least one model. Tests for proportionalitywere performed.
3. Results
3.1. Patient details
Table 1 shows the baseline characteristics of the 150patients, split into those with no prior history of decom-pensation (n = 131, Group A), and those with clinicalevidence of decompensation prior to the index biopsy(n = 19, Group B). Overall, the median length of fol-low-up was 51 months (range 1–185).
3.1.1. Group A
Within Group A, 69% were male. Median age at thetime of index biopsy was 48 years (range 30–76), with amedian estimated duration of infection of 22.2 years.Alcohol intake at biopsy varied considerably betweenindividuals, with 10 (8%) patients consuming in excessof 80 g/day. The majority of patients reduced their alco-hol intake following the index biopsy, with the meanconsumption falling from 22.7 to 7.8 g/day.
Treatment data are shown in Table 2. An SVR wasachieved in 32/101 (32%) patients (23% genotype 1patients compared with 37% of genotype 2 or 3), with28%, 33%, and 33% of patients with Ishak stages 4, 5,and 6, respectively, having an SVR.
3.1.2. Group B
The main differences between Groups A and B were inalcohol consumption and in the severity of the underlyingliver disease (Table 1). At the time of the index biopsy,mean daily alcohol consumption was more than twicethat of Group A patients. 16/19 (84%) Group B vs 65/131 (50%) Group A patients were Ishak stage 6 and morewere Child–Pugh grade B (24% vs 6%) and C (18% vs 0%).
3.2. Mortality/liver transplantation
During follow-up 50 (33%) patients reached thedefined end-points of death (n = 40) or liver transplanta-
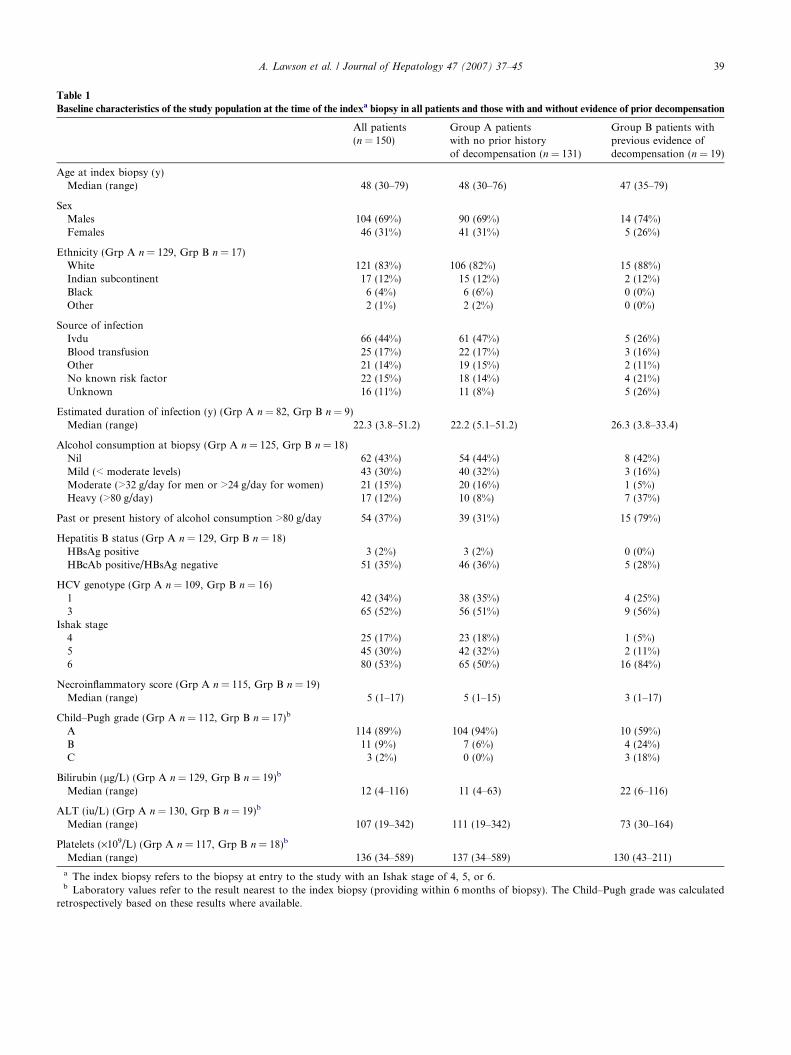
Table 1
Baseline characteristics of the study population at the time of the indexa biopsy in all patients and those with and without evidence of prior decompensation
All patients(n = 150)
Group A patientswith no prior historyof decompensation (n = 131)
Group B patients withprevious evidence ofdecompensation (n = 19)
Age at index biopsy (y)Median (range) 48 (30–79) 48 (30–76) 47 (35–79)
SexMales 104 (69%) 90 (69%) 14 (74%)Females 46 (31%) 41 (31%) 5 (26%)
Ethnicity (Grp A n = 129, Grp B n = 17)White 121 (83%) 106 (82%) 15 (88%)Indian subcontinent 17 (12%) 15 (12%) 2 (12%)Black 6 (4%) 6 (6%) 0 (0%)Other 2 (1%) 2 (2%) 0 (0%)
Source of infectionIvdu 66 (44%) 61 (47%) 5 (26%)Blood transfusion 25 (17%) 22 (17%) 3 (16%)Other 21 (14%) 19 (15%) 2 (11%)No known risk factor 22 (15%) 18 (14%) 4 (21%)Unknown 16 (11%) 11 (8%) 5 (26%)
Estimated duration of infection (y) (Grp A n = 82, Grp B n = 9)Median (range) 22.3 (3.8–51.2) 22.2 (5.1–51.2) 26.3 (3.8–33.4)
Alcohol consumption at biopsy (Grp A n = 125, Grp B n = 18)Nil 62 (43%) 54 (44%) 8 (42%)Mild (< moderate levels) 43 (30%) 40 (32%) 3 (16%)Moderate (>32 g/day for men or >24 g/day for women) 21 (15%) 20 (16%) 1 (5%)Heavy (>80 g/day) 17 (12%) 10 (8%) 7 (37%)
Past or present history of alcohol consumption >80 g/day 54 (37%) 39 (31%) 15 (79%)
Hepatitis B status (Grp A n = 129, Grp B n = 18)HBsAg positive 3 (2%) 3 (2%) 0 (0%)HBcAb positive/HBsAg negative 51 (35%) 46 (36%) 5 (28%)
HCV genotype (Grp A n = 109, Grp B n = 16)1 42 (34%) 38 (35%) 4 (25%)3 65 (52%) 56 (51%) 9 (56%)
Ishak stage4 25 (17%) 23 (18%) 1 (5%)5 45 (30%) 42 (32%) 2 (11%)6 80 (53%) 65 (50%) 16 (84%)
Necroinflammatory score (Grp A n = 115, Grp B n = 19)Median (range) 5 (1–17) 5 (1–15) 3 (1–17)
Child–Pugh grade (Grp A n = 112, Grp B n = 17)b
A 114 (89%) 104 (94%) 10 (59%)B 11 (9%) 7 (6%) 4 (24%)C 3 (2%) 0 (0%) 3 (18%)
Bilirubin (lg/L) (Grp A n = 129, Grp B n = 19)b
Median (range) 12 (4–116) 11 (4–63) 22 (6–116)
ALT (iu/L) (Grp A n = 130, Grp B n = 19)b
Median (range) 107 (19–342) 111 (19–342) 73 (30–164)
Platelets (·109/L) (Grp A n = 117, Grp B n = 18)b
Median (range) 136 (34–589) 137 (34–589) 130 (43–211)
a The index biopsy refers to the biopsy at entry to the study with an Ishak stage of 4, 5, or 6.b Laboratory values refer to the result nearest to the index biopsy (providing within 6 months of biopsy). The Child–Pugh grade was calculated
retrospectively based on these results where available.
A. Lawson et al. / Journal of Hepatology 47 (2007) 37–45 39
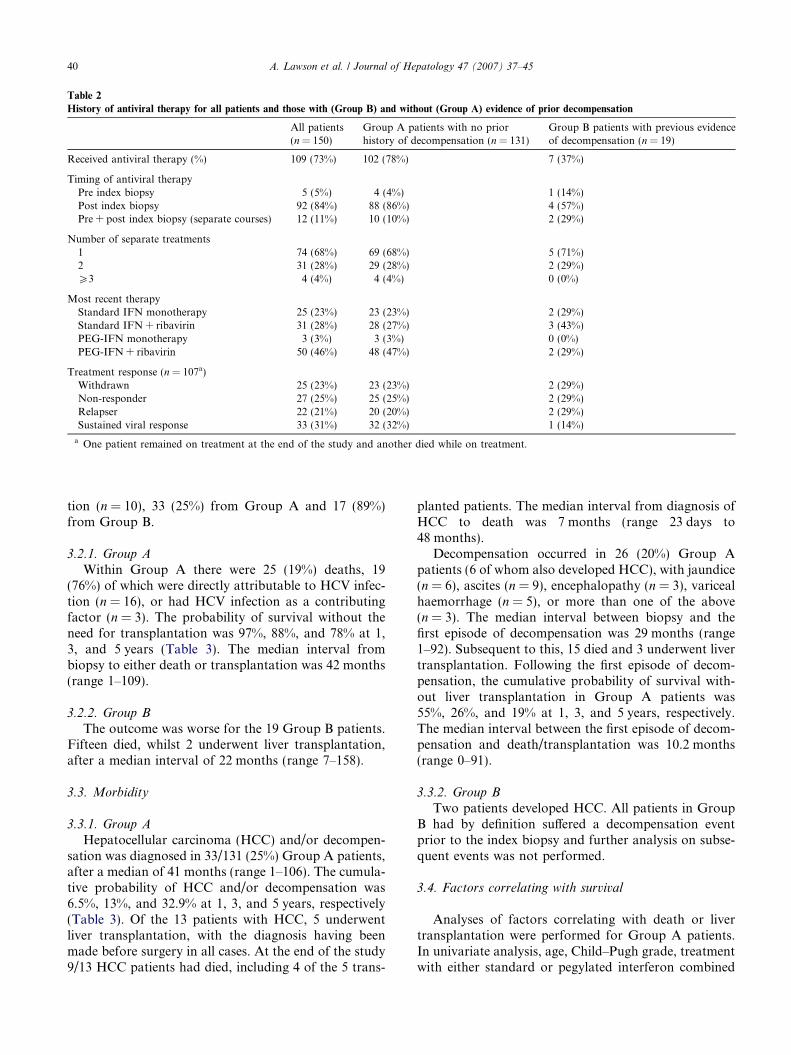
Table 2
History of antiviral therapy for all patients and those with (Group B) and without (Group A) evidence of prior decompensation
All patients(n = 150)
Group A patients with no priorhistory of decompensation (n = 131)
Group B patients with previous evidenceof decompensation (n = 19)
Received antiviral therapy (%) 109 (73%) 102 (78%) 7 (37%)
Timing of antiviral therapyPre index biopsy 5 (5%) 4 (4%) 1 (14%)Post index biopsy 92 (84%) 88 (86%) 4 (57%)Pre + post index biopsy (separate courses) 12 (11%) 10 (10%) 2 (29%)
Number of separate treatments1 74 (68%) 69 (68%) 5 (71%)2 31 (28%) 29 (28%) 2 (29%)P3 4 (4%) 4 (4%) 0 (0%)
Most recent therapyStandard IFN monotherapy 25 (23%) 23 (23%) 2 (29%)Standard IFN + ribavirin 31 (28%) 28 (27%) 3 (43%)PEG-IFN monotherapy 3 (3%) 3 (3%) 0 (0%)PEG-IFN + ribavirin 50 (46%) 48 (47%) 2 (29%)
Treatment response (n = 107a)Withdrawn 25 (23%) 23 (23%) 2 (29%)Non-responder 27 (25%) 25 (25%) 2 (29%)Relapser 22 (21%) 20 (20%) 2 (29%)Sustained viral response 33 (31%) 32 (32%) 1 (14%)
a One patient remained on treatment at the end of the study and another died while on treatment.
40 A. Lawson et al. / Journal of Hepatology 47 (2007) 37–45
tion (n = 10), 33 (25%) from Group A and 17 (89%)from Group B.
3.2.1. Group A
Within Group A there were 25 (19%) deaths, 19(76%) of which were directly attributable to HCV infec-tion (n = 16), or had HCV infection as a contributingfactor (n = 3). The probability of survival without theneed for transplantation was 97%, 88%, and 78% at 1,3, and 5 years (Table 3). The median interval frombiopsy to either death or transplantation was 42 months(range 1–109).
3.2.2. Group B
The outcome was worse for the 19 Group B patients.Fifteen died, whilst 2 underwent liver transplantation,after a median interval of 22 months (range 7–158).
3.3. Morbidity
3.3.1. Group A
Hepatocellular carcinoma (HCC) and/or decompen-sation was diagnosed in 33/131 (25%) Group A patients,after a median of 41 months (range 1–106). The cumula-tive probability of HCC and/or decompensation was6.5%, 13%, and 32.9% at 1, 3, and 5 years, respectively(Table 3). Of the 13 patients with HCC, 5 underwentliver transplantation, with the diagnosis having beenmade before surgery in all cases. At the end of the study9/13 HCC patients had died, including 4 of the 5 trans-
planted patients. The median interval from diagnosis ofHCC to death was 7 months (range 23 days to48 months).
Decompensation occurred in 26 (20%) Group Apatients (6 of whom also developed HCC), with jaundice(n = 6), ascites (n = 9), encephalopathy (n = 3), varicealhaemorrhage (n = 5), or more than one of the above(n = 3). The median interval between biopsy and thefirst episode of decompensation was 29 months (range1–92). Subsequent to this, 15 died and 3 underwent livertransplantation. Following the first episode of decom-pensation, the cumulative probability of survival with-out liver transplantation in Group A patients was55%, 26%, and 19% at 1, 3, and 5 years, respectively.The median interval between the first episode of decom-pensation and death/transplantation was 10.2 months(range 0–91).
3.3.2. Group B
Two patients developed HCC. All patients in GroupB had by definition suffered a decompensation eventprior to the index biopsy and further analysis on subse-quent events was not performed.
3.4. Factors correlating with survival
Analyses of factors correlating with death or livertransplantation were performed for Group A patients.In univariate analysis, age, Child–Pugh grade, treatmentwith either standard or pegylated interferon combined
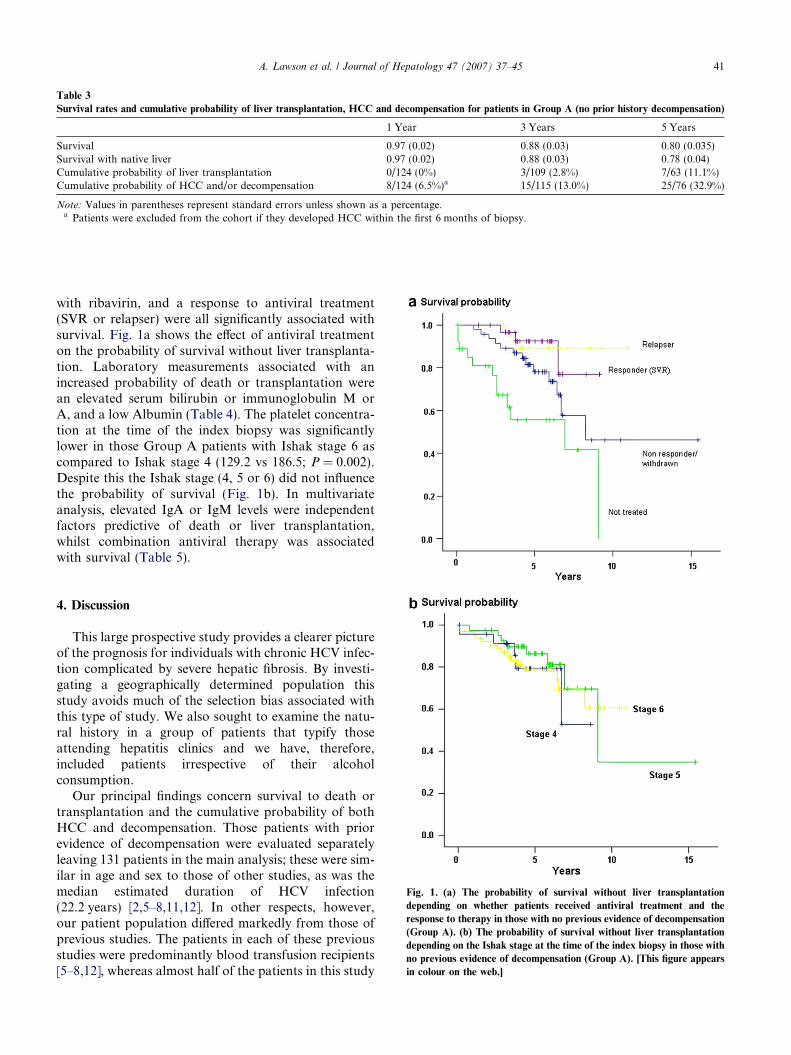
Table 3
Survival rates and cumulative probability of liver transplantation, HCC and decompensation for patients in Group A (no prior history decompensation)
1 Year 3 Years 5 Years
Survival 0.97 (0.02) 0.88 (0.03) 0.80 (0.035)Survival with native liver 0.97 (0.02) 0.88 (0.03) 0.78 (0.04)Cumulative probability of liver transplantation 0/124 (0%) 3/109 (2.8%) 7/63 (11.1%)Cumulative probability of HCC and/or decompensation 8/124 (6.5%)a 15/115 (13.0%) 25/76 (32.9%)
Note: Values in parentheses represent standard errors unless shown as a percentage.a Patients were excluded from the cohort if they developed HCC within the first 6 months of biopsy.
A. Lawson et al. / Journal of Hepatology 47 (2007) 37–45 41
with ribavirin, and a response to antiviral treatment(SVR or relapser) were all significantly associated withsurvival. Fig. 1a shows the effect of antiviral treatmenton the probability of survival without liver transplanta-tion. Laboratory measurements associated with anincreased probability of death or transplantation werean elevated serum bilirubin or immunoglobulin M orA, and a low Albumin (Table 4). The platelet concentra-tion at the time of the index biopsy was significantlylower in those Group A patients with Ishak stage 6 ascompared to Ishak stage 4 (129.2 vs 186.5; P = 0.002).Despite this the Ishak stage (4, 5 or 6) did not influencethe probability of survival (Fig. 1b). In multivariateanalysis, elevated IgA or IgM levels were independentfactors predictive of death or liver transplantation,whilst combination antiviral therapy was associatedwith survival (Table 5).
Fig. 1. (a) The probability of survival without liver transplantation
depending on whether patients received antiviral treatment and the
response to therapy in those with no previous evidence of decompensation
(Group A). (b) The probability of survival without liver transplantation
depending on the Ishak stage at the time of the index biopsy in those with
no previous evidence of decompensation (Group A). [This figure appears
in colour on the web.]
4. Discussion
This large prospective study provides a clearer pictureof the prognosis for individuals with chronic HCV infec-tion complicated by severe hepatic fibrosis. By investi-gating a geographically determined population thisstudy avoids much of the selection bias associated withthis type of study. We also sought to examine the natu-ral history in a group of patients that typify thoseattending hepatitis clinics and we have, therefore,included patients irrespective of their alcoholconsumption.
Our principal findings concern survival to death ortransplantation and the cumulative probability of bothHCC and decompensation. Those patients with priorevidence of decompensation were evaluated separatelyleaving 131 patients in the main analysis; these were sim-ilar in age and sex to those of other studies, as was themedian estimated duration of HCV infection(22.2 years) [2,5–8,11,12]. In other respects, however,our patient population differed markedly from those ofprevious studies. The patients in each of these previousstudies were predominantly blood transfusion recipients[5–8,12], whereas almost half of the patients in this study
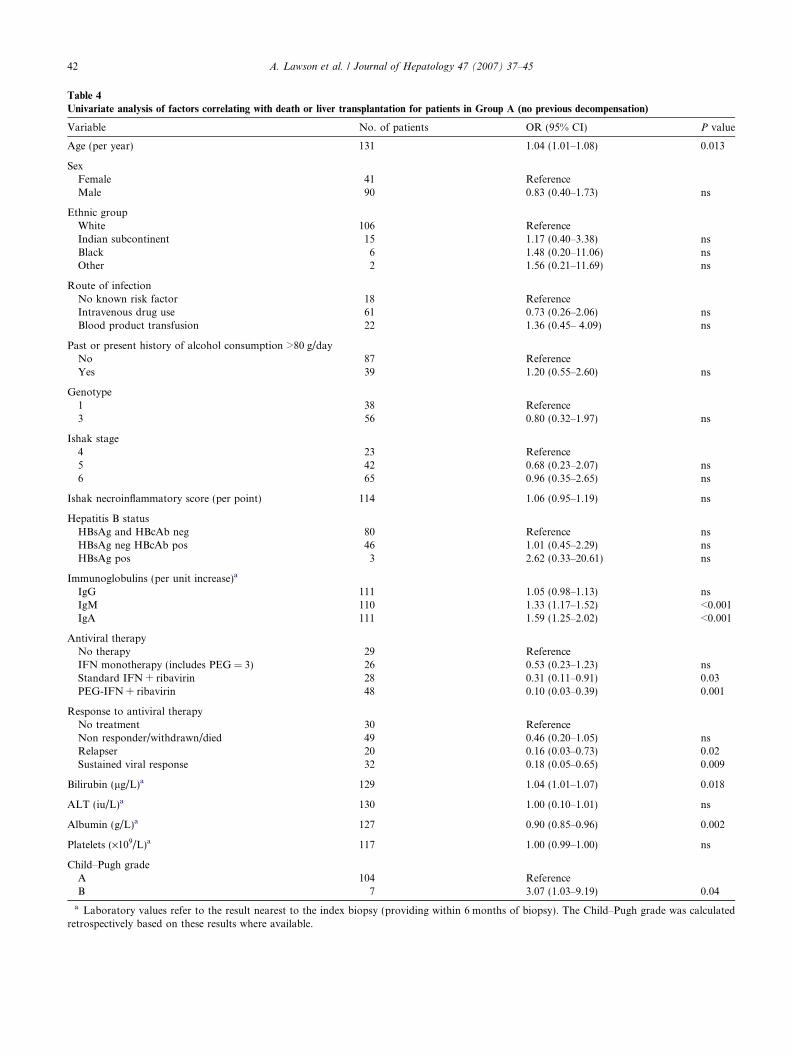
Table 4
Univariate analysis of factors correlating with death or liver transplantation for patients in Group A (no previous decompensation)
Variable No. of patients OR (95% CI) P value
Age (per year) 131 1.04 (1.01–1.08) 0.013
SexFemale 41 ReferenceMale 90 0.83 (0.40–1.73) ns
Ethnic groupWhite 106 ReferenceIndian subcontinent 15 1.17 (0.40–3.38) nsBlack 6 1.48 (0.20–11.06) nsOther 2 1.56 (0.21–11.69) ns
Route of infectionNo known risk factor 18 ReferenceIntravenous drug use 61 0.73 (0.26–2.06) nsBlood product transfusion 22 1.36 (0.45– 4.09) ns
Past or present history of alcohol consumption >80 g/dayNo 87 ReferenceYes 39 1.20 (0.55–2.60) ns
Genotype1 38 Reference3 56 0.80 (0.32–1.97) ns
Ishak stage4 23 Reference5 42 0.68 (0.23–2.07) ns6 65 0.96 (0.35–2.65) ns
Ishak necroinflammatory score (per point) 114 1.06 (0.95–1.19) ns
Hepatitis B statusHBsAg and HBcAb neg 80 Reference nsHBsAg neg HBcAb pos 46 1.01 (0.45–2.29) nsHBsAg pos 3 2.62 (0.33–20.61) ns
Immunoglobulins (per unit increase)a
IgG 111 1.05 (0.98–1.13) nsIgM 110 1.33 (1.17–1.52) <0.001IgA 111 1.59 (1.25–2.02) <0.001
Antiviral therapyNo therapy 29 ReferenceIFN monotherapy (includes PEG = 3) 26 0.53 (0.23–1.23) nsStandard IFN + ribavirin 28 0.31 (0.11–0.91) 0.03PEG-IFN + ribavirin 48 0.10 (0.03–0.39) 0.001
Response to antiviral therapyNo treatment 30 ReferenceNon responder/withdrawn/died 49 0.46 (0.20–1.05) nsRelapser 20 0.16 (0.03–0.73) 0.02Sustained viral response 32 0.18 (0.05–0.65) 0.009
Bilirubin (lg/L)a 129 1.04 (1.01–1.07) 0.018
ALT (iu/L)a 130 1.00 (0.10–1.01) ns
Albumin (g/L)a 127 0.90 (0.85–0.96) 0.002
Platelets (·109/L)a 117 1.00 (0.99–1.00) ns
Child–Pugh gradeA 104 ReferenceB 7 3.07 (1.03–9.19) 0.04
a Laboratory values refer to the result nearest to the index biopsy (providing within 6 months of biopsy). The Child–Pugh grade was calculatedretrospectively based on these results where available.
42 A. Lawson et al. / Journal of Hepatology 47 (2007) 37–45
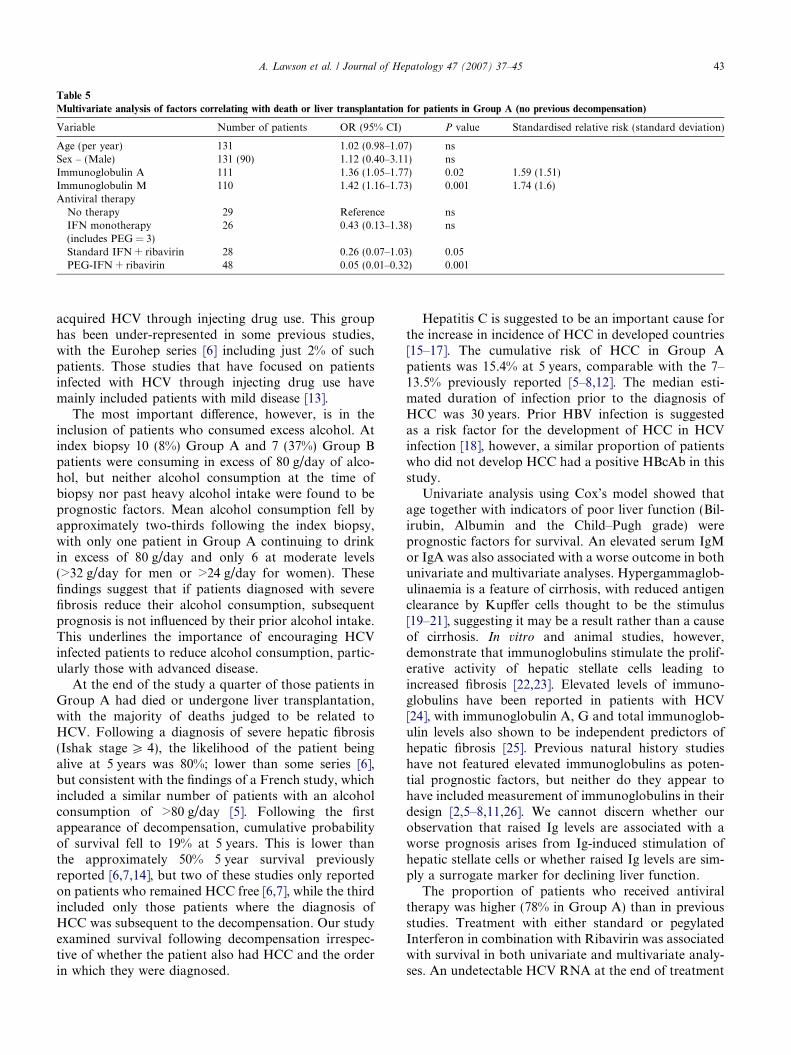
Table 5
Multivariate analysis of factors correlating with death or liver transplantation for patients in Group A (no previous decompensation)
Variable Number of patients OR (95% CI) P value Standardised relative risk (standard deviation)
Age (per year) 131 1.02 (0.98–1.07) nsSex – (Male) 131 (90) 1.12 (0.40–3.11) nsImmunoglobulin A 111 1.36 (1.05–1.77) 0.02 1.59 (1.51)Immunoglobulin M 110 1.42 (1.16–1.73) 0.001 1.74 (1.6)Antiviral therapy
No therapy 29 Reference nsIFN monotherapy 26 0.43 (0.13–1.38) ns(includes PEG = 3)Standard IFN + ribavirin 28 0.26 (0.07–1.03) 0.05PEG-IFN + ribavirin 48 0.05 (0.01–0.32) 0.001
A. Lawson et al. / Journal of Hepatology 47 (2007) 37–45 43
acquired HCV through injecting drug use. This grouphas been under-represented in some previous studies,with the Eurohep series [6] including just 2% of suchpatients. Those studies that have focused on patientsinfected with HCV through injecting drug use havemainly included patients with mild disease [13].
The most important difference, however, is in theinclusion of patients who consumed excess alcohol. Atindex biopsy 10 (8%) Group A and 7 (37%) Group Bpatients were consuming in excess of 80 g/day of alco-hol, but neither alcohol consumption at the time ofbiopsy nor past heavy alcohol intake were found to beprognostic factors. Mean alcohol consumption fell byapproximately two-thirds following the index biopsy,with only one patient in Group A continuing to drinkin excess of 80 g/day and only 6 at moderate levels(>32 g/day for men or >24 g/day for women). Thesefindings suggest that if patients diagnosed with severefibrosis reduce their alcohol consumption, subsequentprognosis is not influenced by their prior alcohol intake.This underlines the importance of encouraging HCVinfected patients to reduce alcohol consumption, partic-ularly those with advanced disease.
At the end of the study a quarter of those patients inGroup A had died or undergone liver transplantation,with the majority of deaths judged to be related toHCV. Following a diagnosis of severe hepatic fibrosis(Ishak stage P 4), the likelihood of the patient beingalive at 5 years was 80%; lower than some series [6],but consistent with the findings of a French study, whichincluded a similar number of patients with an alcoholconsumption of >80 g/day [5]. Following the firstappearance of decompensation, cumulative probabilityof survival fell to 19% at 5 years. This is lower thanthe approximately 50% 5 year survival previouslyreported [6,7,14], but two of these studies only reportedon patients who remained HCC free [6,7], while the thirdincluded only those patients where the diagnosis ofHCC was subsequent to the decompensation. Our studyexamined survival following decompensation irrespec-tive of whether the patient also had HCC and the orderin which they were diagnosed.
Hepatitis C is suggested to be an important cause forthe increase in incidence of HCC in developed countries[15–17]. The cumulative risk of HCC in Group Apatients was 15.4% at 5 years, comparable with the 7–13.5% previously reported [5–8,12]. The median esti-mated duration of infection prior to the diagnosis ofHCC was 30 years. Prior HBV infection is suggestedas a risk factor for the development of HCC in HCVinfection [18], however, a similar proportion of patientswho did not develop HCC had a positive HBcAb in thisstudy.
Univariate analysis using Cox’s model showed thatage together with indicators of poor liver function (Bil-irubin, Albumin and the Child–Pugh grade) wereprognostic factors for survival. An elevated serum IgMor IgA was also associated with a worse outcome in bothunivariate and multivariate analyses. Hypergammaglob-ulinaemia is a feature of cirrhosis, with reduced antigenclearance by Kupffer cells thought to be the stimulus[19–21], suggesting it may be a result rather than a causeof cirrhosis. In vitro and animal studies, however,demonstrate that immunoglobulins stimulate the prolif-erative activity of hepatic stellate cells leading toincreased fibrosis [22,23]. Elevated levels of immuno-globulins have been reported in patients with HCV[24], with immunoglobulin A, G and total immunoglob-ulin levels also shown to be independent predictors ofhepatic fibrosis [25]. Previous natural history studieshave not featured elevated immunoglobulins as poten-tial prognostic factors, but neither do they appear tohave included measurement of immunoglobulins in theirdesign [2,5–8,11,26]. We cannot discern whether ourobservation that raised Ig levels are associated with aworse prognosis arises from Ig-induced stimulation ofhepatic stellate cells or whether raised Ig levels are sim-ply a surrogate marker for declining liver function.
The proportion of patients who received antiviraltherapy was higher (78% in Group A) than in previousstudies. Treatment with either standard or pegylatedInterferon in combination with Ribavirin was associatedwith survival in both univariate and multivariate analy-ses. An undetectable HCV RNA at the end of treatment
44 A. Lawson et al. / Journal of Hepatology 47 (2007) 37–45
was also associated with survival in the univariate anal-ysis. A potential confounding factor is that theuntreated group may include some patients judged toounwell for treatment. Untreated patients were morelikely to be Child–Pugh grade B at biopsy (13% vs5%), genotype 1 (44% vs 5%), and to consume >80 g/day of alcohol (17% vs 6%), suggesting that physiciansmay be more inclined to recommend therapy if thecourse of treatment was shorter and the likelihood ofsuccess greater. It is noteworthy, however, that treatedpatients with a viral response, whether sustained ornot, fared better than non-responders. This suggests thatinterruption of viral replication, even if only temporary,is associated with an improved prognosis, possiblythrough a reduction in liver fibrosis and inflammation[27,28], and/or reduced portal hypertension [29].
Our study included patients with a spectrum of severeliver diseases, from portal fibrosis with marked bridging(stage 4) to probable (stage 5) or definite cirrhosis (stage6). The Ishak stage did not, however, significantlyimpact on the probability of survival, suggesting pro-gression to severe fibrosis is universally associated witha poor prognosis. Sampling error is an inherent problemto staging on liver biopsy [30,31]. In 4/19 patients withprior decompensation, the subsequent index biopsy didnot demonstrate definite cirrhosis. This could indicatesampling error, though an alternative explanation is thatdecompensation was secondary to alcoholic hepatitis,given that all 4 patients previously consumed alcoholin excess of 80 g/day. The significant difference in themean platelet concentration between Group A patientswith Ishak stages 4 and 6, at the time of the indexbiopsy, suggests that these are distinct groups of patientsand that mis-scoring through sampling error was not asignificant problem. Physicians need to be aware, there-fore, that patients with bridging fibrosis but not yet def-inite cirrhosis are also at significant risk of morbidityand mortality from liver disease in the short as well aslong term. Extending the study to include patients withIshak stage 3 would have incorporated a further 73patients. During an average of more than 6 years of fol-low-up six of these patients died, but none throughHCV-related causes. No patients were diagnosed withHCC or underwent liver transplantation. This suggeststhat Ishak stage 4 is the threshold at which significantmorbidity and mortality from liver disease occurs.
A number of our patients had evidence of decompen-sation prior to the index biopsy (Group B). Patients withadvanced liver disease will often present with complica-tions before a defining biopsy has been performed andthis is, therefore, an important group to consider. Notsurprisingly, these patients had a worse prognosis, with89% (compared with 25% in Group A) having died orundergone liver transplantation by the end of the study.
In conclusion, this prospective study adds to ourunderstanding of the natural history of severe hepatic
fibrosis secondary to HCV in a geographically deter-mined population. It demonstrates a worse prognosisthan has been reported from earlier studies using moreselected patient populations. It confirms that oncedecompensation develops, HCV infection is associatedwith a high mortality rate. Indicators of poor syntheticliver function and hypergammaglobulinaemia wereimportant prognostic factors for mortality, while combi-nation antiviral therapy was associated with improvedsurvival. This study also demonstrates the importanceof using data collected from a broad patient populationwhen planning the allocation of resources to the man-agement of hepatitis C.
Competing interests
None declared.
Trent HCV Study Group (n = number of patients in
study)Derby City Hospital (n = 24)Dr. A. Austin, Consultant Gastroenterologist, Dr.J.G. Freeman, Consultant Gastroenterologist, Mrs.M. Jackson, Hepatitis Specialist Nurse.Leicester Royal Infirmary/University of Leicester
(n = 14)
Dr. A. McGregor, Consultant Histopathologist, Ms.J. Laurenti, Specialist Hepatitis Nurse, Prof. K.R.Nicholson, Consultant in Infectious Diseases, Dr.M. Wiselka, Senior Lecturer in Infectious Diseases.Lincoln County Hospital (n = 2)
Dr. J. Harvey, Consultant Histopathologist,Dr. B.B. Scott, Consultant Gastroenterologist.Nottingham University Hospital/University of Notting-
ham (n = 72)
Dr. D.A. Ansell, Consultant Histopathologist, Pro-fessor R.G. Finch, Professor of Infectious Diseases,Ms. K. Jack, Specialist Hepatitis Nurse, Mrs. M.Holliday, Specialist Hepatitis Nurse, Professor W.L.Irving, Professor of Virology (Chair), Dr. K.R. Neal,Reader in P H Medicine & Epidemiology, Ms. M.Nicholls, Specialist Hepatitis Nurse, Ms. S. Ratib,Trent HCV Study Co-ordinator, Dr. S.D. Ryder,Consultant Hepatologist, Dr. B.J. Thomson, Associ-ate Professor in Infectious Diseases, Dr. A. Zaitoun,Consultant Histopathologist.National Blood Authority, Trent Centre
Dr. D.A. Jones, Associate Specialist in TransfusionMedicine.Royal Hallamshire Hospital, Sheffield/University of
Sheffield (n = 38)
Dr. J. Bremner, Consultant Virologist, SheffieldVirology Consortium, Dr. A. Dube, Consultant Hist-opathologist, Ms. J. Fryer, Specialist HepatitisNurse, Dr. D. Gleeson, Consultant Gastroenterolo-
A. Lawson et al. / Journal of Hepatology 47 (2007) 37–45 45
gist, Prof. S. Green, Consultant in Infectious Dis-eases, Mr. G. Harrison, Data Manager, Prof. G.Kudesia, Consultant Virologist, Sheffield VirologyConsortium, Ms. E. McFarlane, Specialist HepatitisNurse, Prof. M.W. McKendrick, Consultant in Infec-tious Diseases, Mr. R. Poll, Consultant Nurse Spe-cialist, Mrs. F. Rayner, Specialist Hepatitis Nurse,Professor Sir J.C.E. Underwood, Professor of Pathol-ogy, Dr. S. Whittaker, Clinical Psychologist.St. James’s University Hospital, Leeds (n = 0)
Dr. C. Millson, Consultant Hepatologist, Mrs. S.Sheridan, Specialist Hepatitis Nurse, Ms. C. Wiggles-worth, Specialist Hepatitis Nurse, Dr. J. Wyatt, Con-sultant Histopathologist.
References
[1] Anon. Hepatitis C: global prevalence. Wkly Epidemiol Rec,1997;72:341–344.
[2] Poynard T, Bedossa P, Opolon P. Natural history of liver fibrosisprogression in patients with chronic hepatitis C. The OBSVIRC,METAVIR, CLINIVIR, and DOSVIRC groups. Lancet1997;349:825–832.
[3] Tong MJ, El-Farra NS, Reikes AR, Co RL. Clinical outcomesafter transfusion-associated hepatitis C. N Engl J Med1995;332:1463–1466.
[4] Freeman AJ, Dore GJ, Law MG, et al. Estimating progression tocirrhosis in chronic hepatitis C virus infection. Hepatology2001;34:809–816.
[5] Degos F, Christidis C, Ganne-Carrie N, et al. Hepatitis C virusrelated cirrhosis: time to occurrence of hepatocellular carcinomaand death. Gut 2000;47:131–136.
[6] Fattovich G, Giustina G, Degos F, et al. Morbidity and mortalityin compensated cirrhosis type C: a retrospective follow-up studyof 384 patients. Gastroenterology 1997;112:463–472.
[7] Hu KQ, Tong MJ. The long-term outcomes of patients withcompensated hepatitis C virus-related cirrhosis and history ofparenteral exposure in the United States. Hepatology1999;29:1311–1316.
[8] Serfaty L, Aumaitre H, Chazouilleres O, et al. Determinants ofoutcome of compensated hepatitis C virus-related cirrhosis.Hepatology 1998;27:1435–1440.
[9] Mohsen AH on behalf of the Trent Hepatitis C Study Group. Theepidemiology of hepatitis C in a UK health regional population of5.12 million. Gut 2001;48:707–713.
[10] Ishak K, Baptista A, Bianchi L, et al. Histological grading andstaging of chronic hepatitis. J Hepatol 1995;22:696–699.
[11] Ryder SD on behalf of the Trent Hepatitis C StudyGroup. Progression of hepatic fibrosis in patients withhepatitis C: a prospective repeat liver biopsy study. Gut2004;53:451–455.
[12] Benvegnu L, Gios M, Boccato S, Alberti A. Natural history ofcompensated viral cirrhosis: a prospective study on the incidenceand hierarchy of major complications. Gut 2004;53:744–749.
[13] Thomas DL, Astemborski J, Rai RM, et al. The natural historyof hepatitis C virus infection: host, viral, and environmentalfactors. JAMA 2000;284:450–456.
[14] Planas R, Balleste B, Alvarez MA, et al. Natural history ofdecompensated hepatitis C virus-related cirrhosis. A study of 200patients. J Hepatol 2004;40:823–830.
[15] Deuffic S, Poynard T, Valleron AJ. Correlation between hepatitisC virus prevalence and hepatocellular carcinoma mortality inEurope. J Viral Hepat 1999;6:411–413.
[16] El-Serag HB, Davila JA, Petersen NJ, McGlynn KA. The contin-uing increase in the incidence of hepatocellular carcinoma in theUnited States: an update. Ann Intern Med 2003;139:817–823.
[17] Davila JA, Morgan RO, Shaib Y, McGlynn KA, El-Serag HB.Hepatitis C infection and the increasing incidence of hepatocel-lular carcinoma: a population-based study. Gastroenterology2004;127:1372–1380.
[18] Imazeki F, Yokosuka O, Fukai K, Hiraide A, Saisho H.Significance of prior hepatitis B virus infection in the developmentof hepatocellular carcinoma in patients with chronic hepatitis C.Dig Dis Sci 2003;48:1786–1792.
[19] Triger DR, Alp MH, Wright R. Bacterial and dietary antibodiesin liver disease. Lancet 1972;i:60–63.
[20] Triger DR, Wright R. Hyperglobulinaemia in liver disease. Lancet1973;i:1494–1496.
[21] Thomas HC, McSween RN, White RG. Role of the liver incontrolling the immunogenicity of commensal bacteria in the gut.Lancet 1973;i:1288–1291.
[22] Shen H, Huang G, Zhang M, Kaita K, Minuk G, Gong Y. Effectsof immunoglobulin G on cell proliferation and expression ofsmooth muscle alpha-actin in rat hepatic stellate cells. Hepatology2001;34:A403.
[23] Yokoyama H, Nagata S, Moriya S, et al. Hepatic fibrosisproduced in guinea pigs by chronic ethanol administration andimmunization with acetaldehyde adducts. Hepatology1995;21:1438–1442.
[24] El-Kady IM, Lotfy M, Nasif WA, El-Kenawy A, Badra GA.Hepatitis C infection correlates with alteration of serum immu-noglobulins pattern in chronic liver disease. Indian J Gastroen-terol 2005;24:83–84.
[25] Watt K, Uhanova J, Gong Y, et al. Serum immunoglobulinspredict the extent of hepatic fibrosis in patients with chronichepatitis C virus infection. J Viral Hepat 2004;11:251–256.
[26] Ghany MG, Kleiner DE, Alter H, et al. Progression of fibrosis inchronic hepatitis C. Gastroenterology 2003;124:97–104.
[27] Poynard T, McHutchison J, Manns M, et al. Impact of pegylatedinterferon alfa-2b and ribavirin on liver fibrosis in patients withchronic hepatitis C. Gastroenterology 2002;122:1303–1313.
[28] Shiratori Y, Imazeki F, Moriyama M, et al. Histologic improve-ment of fibrosis in patients with hepatitis C who have sustainedresponse to interferon therapy. Ann Intern Med2000;132:517–524.
[29] Rincon D, Ripoll C, Catalina MV, Salcedo M, Banares R. Doesinterferon improve portal hypertension? J Antimicrob Chemother2006;58:7–12.
[30] Bedossa P, Dargere D, Paradis V. Sampling variability of liverfibrosis in chronic hepatitis C. Hepatology 2003;38:1449–1457.
[31] Regev A, Berho M, Jeffers LJ, et al. Sampling error andintraobserver variation in liver biopsy in patients with chronicHCV infection. Am J Gastroenterol 2002;97:2614–2618.