Embed Size (px)
Citation preview

The Nature and Distribution of Particulate Matterin the Mandovi Estuary, Central West Coast of India
Pratima Mohan Kessarkar &
Venigalla Purnachandra Rao & Ranjan Shynu &
Prakash Mehra & Blossom E. Viegas
Received: 20 August 2008 /Revised: 29 July 2009 /Accepted: 22 September 2009 /Published online: 16 October 2009# Coastal and Estuarine Research Federation 2009
Abstract Systematic seasonal variations of suspendedparticulate matter (SPM) along a 44-km transect of theMandovi estuary reveal that the concentrations of SPM arelow at river-end stations, increase generally seaward, andare highest at sea-end stations of the estuary. An estuarineturbidity maximum (ETM) occurs at sea-end stations duringJune–September when river discharge is high and also inFebruary–May when river discharge is low. These are thetwo windiest times of year, the former associated with thesouthwest monsoon and the latter characterized by apersistent sea breeze. The salinity vs. SPM plot shows thathigh SPM is a seaward deposit and skewed landward.Suspended matter comprised of floccules, fecal pellets, andaggregates that consist of clay and biogenic particles occureverywhere in the estuary. Diatoms are the most commonand are of marine type at the sea-end and freshwater-dominated at river-end stations of the estuary. SPM ischaracterized by kaolinite- and smectite-rich clay mineralsuites at the river- and sea-end stations, respectively.Smectite concentrations increase seawards with the increasein SPM content and are not influenced by salinity. Wind-driven waves and currents and biogeochemical processes atthe mouth of estuary likely play an important role in theformation of ETM in resuspension and transformation ofSPM into floccules and aggregates and in their upkeep orremoval.
Keywords Suspended particulate matter .
Turbidity maximum . Estuarine sedimentation .
Biogeochemical processes . Clay minerals
Introduction
The erosion, transport, and deposition of fine-grained sedi-ments in estuaries are complex processes and are largelycontrolled by three influencing factors: estuarine mixing,aggregation (flocculation), and primary particle properties(Edzwald and O’Melia 1975). Estuarine-type circulation andriver flow are traditionally considered to be the mostimportant transport processes as they can advect particlesout onto the continental shelf, retain sediment within, and/ortransport sediments from the continental shelf into estuaries(Postma 1967; Allen et al. 1980; Castaing and Allen 1981;Kennedy 1984; Verlaan et al. 1997; Hossain and Eyre 2001).Tidal currents can also be effective at moving sediment viatidal asymmetry and/or from areas of higher wave or currentenergy towards areas of lower energy via settling or scourlag (Brydsten 1992; Sanford 1994; Schoelhamer 2001; Chenet al. 2006; Scully and Friedrichs 2007). The effect of wind-induced circulation has not only received less attention butmay also play a role in suspending and advecting sedimentin estuaries (Weir and McManus 1987; Pattiaratchi et al.1997). The efficiency of trapping within the estuary dependson the capacity of an estuary in relation to the rate ofsedimentation and energy available for transport. Winterwerp(2002) reported the influence of turbulence on the floccula-tion process of cohesive sediment and concentrations ofsuspended matter on the settling velocity of sediment. Thepresence of colloids, organic matter, and stability of certainminerals with reference to the salinity affects flocculationand rapid settling of minerals (Eisma 1986).
Concise and informative title: distribution of particulate matter in theMandovi estuary
P. M. Kessarkar :V. Purnachandra Rao (*) :R. Shynu :P. Mehra :B. E. ViegasNational Institute of Oceanography (CSIR),Dona Paula 403 004 Goa, Indiae-mail: [email protected]
Estuaries and Coasts (2010) 33:30–44DOI 10.1007/s12237-009-9226-0

Tropical estuaries of the west coast of India experienceseasonal changes in climate and physical oceanographicprocesses. Rainfall is maximum and rivers carry abundantfine-grained material into the estuaries and coastal regionsduring the southwest (SW) monsoon (June–September).The intense river flow during this season is counteracted bythe strong westerly winds, wind-induced waves andcurrents, and tides. On the other hand, rainfall betweenOctober and May is negligible; therefore, terrigenoussediment discharge is the least. Winds are moderate at thistime and are dominated by the sea breeze cycle. Weakeasterly winds prevail during the northeast (NE) monsoon(November to February). The currents in the estuaryhowever are tidally dominated, and saline waters occurseveral kilometers upstream from the river mouth duringthe dry season (Shetye et al. 1995). Thus, the channels ofthe estuary turn from mainly riverine during the SWmonsoon to highly saline for several kilometers from themouth during the remaining 8 months. Although theMandovi has been well characterized in terms of physicaloceanography, ecology, and contaminants (Shetye et al.2007), less research has been reported regarding itssuspended particles. The aim of the paper is to report forthe first time systematic seasonal variations on the concen-trations, constituents, and mineralogy of the suspendedmatter in the Mandovi estuary, Goa, India and provideinsight into the processes that control them.
Study Area and Background Data
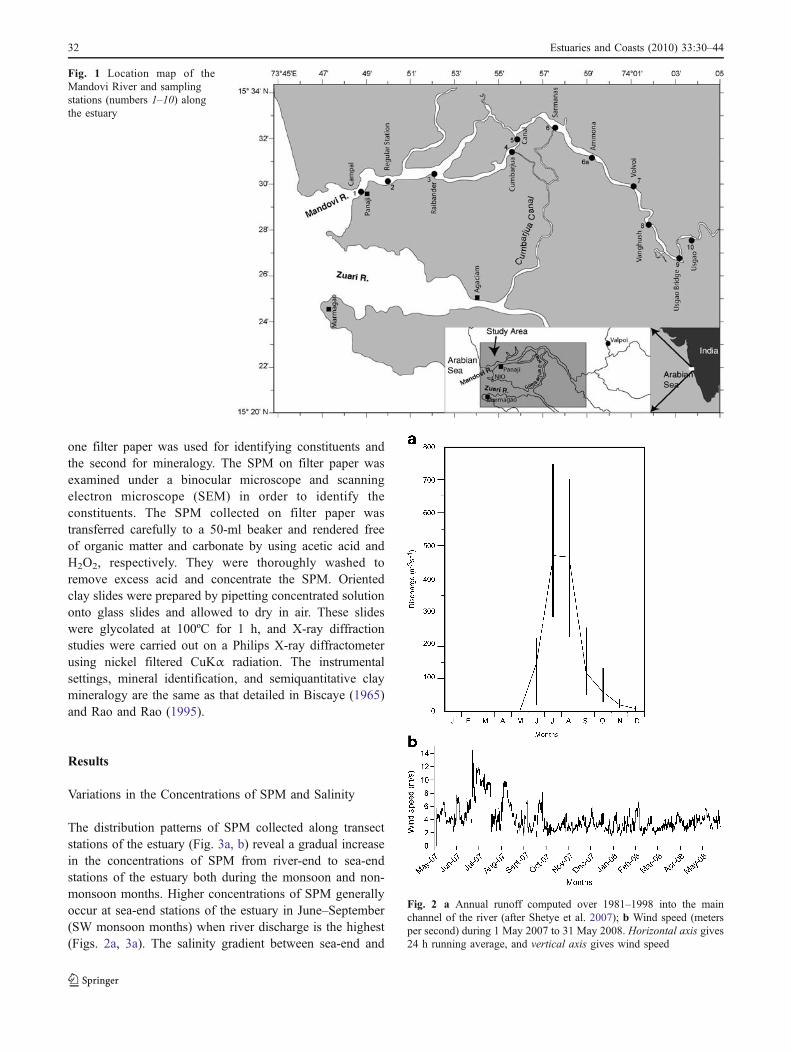
The Mandovi and Zuari rivers (and interconnecting canal)form an important estuarine system on the central westcoast of India, in the state of Goa. It is classified as acoastal plain, monsoonal estuary (Shetye et al. 2007). TheMandovi River is ~75 km long with a drainage basin of~1,895 km2 (Qasim and Sengupta 1981). The width of theriver at the mouth (in the Bay) is ~4 km, and the averagedepth is 5 m. The width of the main channel at its mouth is3.2 km and gets progressively narrower (to 0.25 km) andshallower upstream. The annual rainfall along the course ofthe river varies considerably from 660 cm at the upstreamend of the river in the Western Ghats to 290 cm at Panaji,~6 km from the mouth of the river (Shetye et al. 2007).Virtually all of the freshwater discharge occurs only duringthe SW monsoon (see Fig. 2a). The wind speed of ∼4–7 m s−1 and tidal range of 2 to 2.5 m were reported (Shetyeet al. 1995; Sundar and Shetye 2005). The runoff of theRiver in the remaining 8 months is almost negligible, andthe Mandovi estuary increasingly becomes an extension ofsea (Shetye et al. 2007). During these 8 months, the windfield is dominated by sea breeze (Neetu et al. 2006) withstrongest sea breezes from February–May (see Fig. 2b).
The currents in the estuarine channel are primarily tidal andcontinue to be so until the onset of the next SW monsoon.Moreover, industrial and mining activities are at a peakduring October–May at several points along the estuary anddischarge nutrients, heavy metals, and other pollutants inthe form of organic and inorganic industrial waste into theestuary (Alagarsamy 2006; Ramaiah et al. 2007). The dailyto-and-fro traffic of numerous mechanized fishing boatsand barges carrying Fe–Mn ores may induce someadditional turbidity within the estuarine system. Thehuman-induced activities may, therefore, affect the energyconditions and fauna of the estuary and play an importantrole in perturbing the health of the estuary.
The Mandovi River drains through the Western Ghats,which is part of the Western Dharwar Craton (WDC) ofMeso-archaean age. The WDC is predominantly made upof greenstone belts and tonalite–trondhjemite gneisses andis characterized by high-Mg basalts and komatites withmetavolcanics and meta-sedimentary rocks. The mainconstituents are mafic and ultramafic volcanic rocks,arenites, phyllites, polymictic and oligomictic conglomer-ates, graywackes, banded iron formations, and carbonates(Naqvi 2005). The rocks weather under humid tropicalconditions and are extensively ferruginized with thicklateritic cappings.
Materials and Methods
Two types of data were collected in the Mandovi estuaryunder the framework of the “Mandovi Monsoon Experi-ment 2007,” conducted during June 2007–May 2008. (1)Salinity data and surface waters were collected every day atone station in the mid-channel of the Mandovi estuary fromJune to September, 2007. This station is referred to here asthe “regular” station, which is located ~6.3 km away fromthe mouth of the Mandovi River (Fig. 1). (2) Salinity data,surface water, and bottom sediments were also collectedfortnightly at five stations along the main channel of theMandovi estuary (hereafter referred to as “transect”stations) during June–September 2007, using a mechanizedboat. From October 2007 to May 2008, stations toward theriver-end of the estuary were added in such a way that thelast station sampled on the day of collection would bewhere the salinity of the surface waters was ≤5‰. Surfacewaters and their salinity were also collected at six sea-endstations along the main channel during January–May 2009in order to verify the repeatability of SPM at these stations.
Five liters of surface water collected at each station werefiltered through 0.4-μm Millipore filter paper. Three filterpapers were used for each station, and the SPM retained onfilter papers was dried and weighted. SPM is expressed asmilligram per liter. Of the three filter papers, the SPM on
Estuaries and Coasts (2010) 33:30–44 31
one filter paper was used for identifying constituents andthe second for mineralogy. The SPM on filter paper wasexamined under a binocular microscope and scanningelectron microscope (SEM) in order to identify theconstituents. The SPM collected on filter paper wastransferred carefully to a 50-ml beaker and rendered freeof organic matter and carbonate by using acetic acid andH2O2, respectively. They were thoroughly washed toremove excess acid and concentrate the SPM. Orientedclay slides were prepared by pipetting concentrated solutiononto glass slides and allowed to dry in air. These slideswere glycolated at 100ºC for 1 h, and X-ray diffractionstudies were carried out on a Philips X-ray diffractometerusing nickel filtered CuKα radiation. The instrumentalsettings, mineral identification, and semiquantitative claymineralogy are the same as that detailed in Biscaye (1965)and Rao and Rao (1995).
Results
Variations in the Concentrations of SPM and Salinity
The distribution patterns of SPM collected along transectstations of the estuary (Fig. 3a, b) reveal a gradual increasein the concentrations of SPM from river-end to sea-endstations of the estuary both during the monsoon and non-monsoon months. Higher concentrations of SPM generallyoccur at sea-end stations of the estuary in June–September(SW monsoon months) when river discharge is the highest(Figs. 2a, 3a). The salinity gradient between sea-end and
Fig. 1 Location map of theMandovi River and samplingstations (numbers 1–10) alongthe estuary
Fig. 2 a Annual runoff computed over 1981–1998 into the mainchannel of the river (after Shetye et al. 2007); b Wind speed (metersper second) during 1 May 2007 to 31 May 2008. Horizontal axis gives24 h running average, and vertical axis gives wind speed
32 Estuaries and Coasts (2010) 33:30–44

river-end stations is high in June, decreases gradually, andis the least during September (Fig. 3b). Highest concen-trations of SPM coincide with salinities of 10–20‰ at sea-end stations during this period. SPM is significantly lowerat all stations during October–January, and the lowestconcentrations of SPM occur in November. The salinity ofthe waters at sea-end stations quickly return to ~30‰immediately after the monsoon (see October) and increasegradually within the estuary from October to May (Fig. 3a).Low concentrations of SPM at sea-end stations along with
high salinities occur during October to November. Theconcentrations of SPM at sea-end stations again increaseduring February–May (non-monsoon months) when riverdischarge is the least. The SPM concentrations at sea-endstations are often two to four times greater than those at theriver-end during this period (Fig. 3a, b). Changes in salinityat different stations are much sharper than that of SPMconcentrations during most of the year. The salinitygradient between the sea-end and river-end stations isrelatively steeper during February/March and gentler during
Fig. 3 Seasonal distribution of SPM (histograms) and salinity (line) along transect stations during June 2007–May 2008 (a) and January 2009–May 2009 (b). Numbers 1–10 correspond to stations shown in Fig. 1. c A plot on Salinity vs. SPM
Estuaries and Coasts (2010) 33:30–44 33

April/May. Highest concentrations of SPM, however,coincide with high salinity (32‰ to 34‰) during February–May at the sea-end stations.
Constituents of SPM
The SPM at sea-end stations during the SW monsoonexhibits the least differences in grain size or foreignmaterial. The SPM at sea-end stations shows rounded andirregular floccules and fine fragments of carbonate shellmaterial. SEM images show that floccules of 50–60 μmsize are abundant at the seaward stations (Fig. 4a, b).Several individual floccules may also become aggregatedand become larger and denser (Fig. 4c–e). Flocculesadhered to diatom frustules can be seen in Fig. 4f–h. Theaggregates consist of clay particles, diatoms, organic, andfecal pellet material and occur as irregular to elongatedparticles (Fig. 4g, h). Diatoms are the most common andshow evidence of dissolution when admixed with clays.Both centric and pennate diatoms are present. Whenfloccules or aggregates are abundant, especially in Juneand February, the identification of diatoms at sea-endstations is restricted to genera level and includes marinecentric (Thalassiosira sp., Coscinodiscus sp., Triceratiumsp., Skeletonema sp., Actinoptychus sp., Chaetoceros sp.Amphora sp.) and pennate (Nitzschia sp.) diatoms. Themarine diatoms dominated by Chaetoceros curvisetus,Skeletonema costatum, Thalassiosira sp., Thalassionemanitzschioides, and Fragilariopsis sp. occur at sea-endstations in November or April.
Floccules and irregular to rounded or elongated fine-sediment aggregates also occur at river-end stations of theestuary (Fig. 5a–d). They are, however, fewer and more
loosely structured than those at the sea-end. Freshwaterdiatoms (Cyclotella stelligera, Diploneis sp., and Cymbellasp.) are dominant together with a few marine (Coscinodis-cus sp., Nitzschia sp., and Amphiprora sp.) diatoms at theriver-end of the estuary. Abundant fecal pellet materialstogether with Coscinodiscus sp. (Fig. 5e, f) are character-istic of SPM in Cumbarjua canal (station 5), 18 km awayfrom the river mouth. Iron and manganese ores are handledextensively at stations 6 (Sarmanas) and 6a (Ammona),which are about 23 and 27 km, respectively, away from theriver mouth. The SPM at these points showed aggregationof fine-grained materials together with microfilaments(Fig. 5g) and floccules adhered to diatoms (Fig. 5h). Marinediatoms (Coscinodiscus radiates, S. costatum, Nitzschia sp.,Chaetoceros sp., Thalassiosira sp.) dominate along with afew freshwater diatoms (C. stelligera) at these stations.
Mineralogy of the SPM
Regular Station
The various SPM samples contain kaolinite, illite, smectite,and chlorite as clay minerals and gibbsite, goethite, andquartz as non-clay minerals. The proportions of clayminerals, however, change with the concentrations ofSPM. Kaolinite is the dominant clay mineral, followed bytraces of illite, smectite, and chlorite at low SPM concen-trations. The proportions of smectite and illite increase fromtraces to 35% and 20%, respectively, with an increase inSPM from 4 to 58 mg/l in June during which the salinitiesrange between 11.5‰ and 34‰ (see Fig. 6a; Table 1). InJuly and August, the salinities of the surface waters at theregular station vary between 0.05‰ and 29‰ on differentdays. High kaolinite, illite, gibbsite, and goethite and tracesof smectite and chlorite are present at high SPM concen-trations and low salinities (see July and August in Fig. 6a;Table 1). Fig. 6b shows that the increase in salinity has noeffect on the overall concentrations of smectite, illite, andchlorite, as long as SPM concentrations remain low(<10 mg/l). Kaolinite followed by illite and traces ofsmectite are present at low salinities and low SPM (Table 1).Smectite content increases to 30% with an increase in SPMcontent to >10 mg/l and salinity to >13‰ (Fig. 6b).Although gibbsite and goethite are present in all samples,their reflections become prominent at very high SPMconcentrations and low salinities (see July and August inFig. 6a).
Transect Stations
Kaolinite, followed by minor illite, chlorite, gibbsite, andgoethite along with traces of smectite are present at theriver-end stations of the estuary, where SPM concen-
Fig. 3 (continued)
34 Estuaries and Coasts (2010) 33:30–44

trations and salinities are low (Table 2). Smectite contentincreases gradually seaward, is high at sea-end stations,and corresponds with an increase in SPM and salinities(Fig. 7; Table 2). The salinity of the surface water variesonly between 0.04‰ and 0.42‰ at different stationsduring the peak monsoon day in August (see Table 2).
Despite minor salinity change, smectite content increasesfrom traces at the river-end to 20% at the sea-end and iscorrelated with the increase in SPM concentrations from10 to 38 mg/l (see Fig. 7; Table 2). SPM concentrations inNovember range between 1.5 and 4.4 mg/l, with highervalues at the river-end (Table 2). SPM is dominated by
Fig. 4 Scanning electron micro-scope photographs of SPM atsea-end stations 1 and 2 of theestuary. a Low magnificationphoto showing abundant floccu-les, b large floccules togetherwith diatom; c–e aggregation offloccules in different months; felongated aggregate togetherwith diatoms; g, h flocculesadhered to diatom frustules
Estuaries and Coasts (2010) 33:30–44 35

kaolinite and minor illite and chlorite at river-end stationsand by trace concentrations of all clay minerals at sea-endstations (Table 2). However, from February to April, highkaolinite, illite, and chlorite, with traces of smectite atriver-end stations, increased smectite (up to 35%), andkaolinite and illite are present at sea-end stations (Fig. 7;Table 2).
Discussion
SPM Concentrations, Turbidity Maximum, and Sourcesof Sediments
The SPM concentrations at the sea-end stations are notablygreater than those at the river-end during two different
Fig. 5 Scanning electron micro-scope photographs of SPM fromriver-end stations (a–d) andfrom stations 5, 6, and 6a (e–h).a–d Floccules and aggregatestogether with centric andpennate diatoms. e Fecal pelletsand centric diatoms, f highmagnification photo of fecalpellet, g aggregate withmicrobial filaments (top right);h floccules adhered to marinediatom
36 Estuaries and Coasts (2010) 33:30–44

periods, namely June–September and February–April(Fig. 3a). This is contrary to the usual distribution ofSPM in estuaries, i.e., a decrease of SPM from the river-endto sea-end, and may suggest that the sea-end part of thechannel represents an unusual estuarine turbidity maximum(ETM). The ETM is a well known feature in a large number
of estuaries throughout the world (Schubel 1968; Buller1975; Festa and Hansen 1978; Allen et al. 1980; Officer1980; Schubel and Kennedy 1984; Le Bris and Glemarec1996; Grabemann et al. 1997; Chen et al. 2005; McManus2005). The magnitude and location of the ETM have beenshown to depend upon the settling velocity of the sediment,
Fig. 6 X-ray diffractograms ofthe SPM collected at the regularstation in June 2007 (a) andAugust 2007 (b), arranged withincreasing SPM. S smectite, Kkaolinite, Ch chlorite, I illite, Gigibbsite, Go goethite
Regular station Salinity (‰) SPM (mg/l) Clay minerals
S (%) K (%) I (%) Ch (%)
08.06.07 31.8 3.9 8 30 46 14
21.06.07 11.5 7.5 23 33 28 15
15.06.07 33.9 32 27 42 19 13
17.06.07 31.5 58 25 37 22 16
06.08.07 0.05 129 8 67 18 7
09.07.07 0.05 158 5 71 21 3
20.08.07 2.1 5.7 13 44 38 6
18.08.07 5.9 6.7 12 44 31 13
14.08.07 13 13 23 48 20 9
26.08.07 27 5.7 22 42 27 9
28.08.07 29 11 20 37 31 12
Table 1 Distribution of majorclay minerals along with salinityand suspended particulate matter(SPM) concentrations at the“regular station” on differentdates of June–August 2007
S smectite, K kaolinite, I illite,Ch chlorite
Estuaries and Coasts (2010) 33:30–44 37

Table 2 Distribution of major clay minerals along with salinity and suspended particulate matter (SPM) concentrations at the “transect stations”from June 2007 to May 2008
Month Stations Salinity (‰) SPM (mg/l) Clay minerals
S (%) K (%) I (%) Ch (%)
June ‘07 1 21.6 20.0 16 33 31 20
2 15.7 19.8 11 35 35 19
3 13.5 5.3 7 37 35 13
4 6.1 0.3 4 49 39 8
5 10.9 0.3 3 45 32 20
July ‘07 1 19.2 8.3 16 53 23 8
2 17.9 5.2 19 56 17 8
3 16.1 – 16 59 19 6
4 7.4 3.5 8 41 43 8
5 7.4 0.1 8 45 37 10
August ‘07 1 38.1 0.4 13 63 17 7
2 21.4 0.2 11 69 13 7
3 9.5 0.1 7 41 46 11
4 6.4 0.1 3 51 40 6
5 9.6 0.0 6 71 20 3
September ‘07 1 4.5 8.7 10 39 32 19
2 1.0 8.9 8 45 29 17
3 0.1 9.8 4 53 26 17
4 0.1 5.4 6 58 29 8
5 0.1 5.4 3 67 16 14
October ‘07 1 28.8 2.5 6 34 49 11
2 19.1 2.5 8 33 52 7
3 13.9 3.9 5 27 54 15
4 3.6 3.3 4 28 60 8
5 2.4 3.2 5 32 50 13
November ‘07 1 1.4 1.5 7 35 41 17
2 22.3 2.9 7 38 36 19
3 16.2 2.4 6 31 43 20
4 5.5 3.8 3 40 33 24
5 4.1 4.2 7 41 38 14
December ‘07 1 29.5 8.7 14 43 30 12
2 27.9 4.5 6 36 36 23
3 23.2 5.9 6 52 26 15
4 13.3 4.4 8 33 33 26
5 14.2 4.6 2 34 56 8
January ‘08 1 33.1 5.8 11 31 39 19
2 31.5 9.9 6 38 40 16
3 27.6 5.1 5 40 40 15
4 19.4 11.8 2 54 18 26
5 17.9 5.2 4 39 31 26
February ‘08 1 33.4 30.7 35 45 15 5
2 32.0 29.8 20 50 20 10
3 27.9 6.9 18 33 34 14
4 21.6 7.8 6 43 29 23
5 20.1 7.1 12 38 35 16
March ‘08 1 33.8 10.4 15 49 22 14
38 Estuaries and Coasts (2010) 33:30–44

the amount of sediment introduced at both the ocean andriver source, and the nature of estuarine circulation and tidalresuspension (Festa and Hansen 1978).
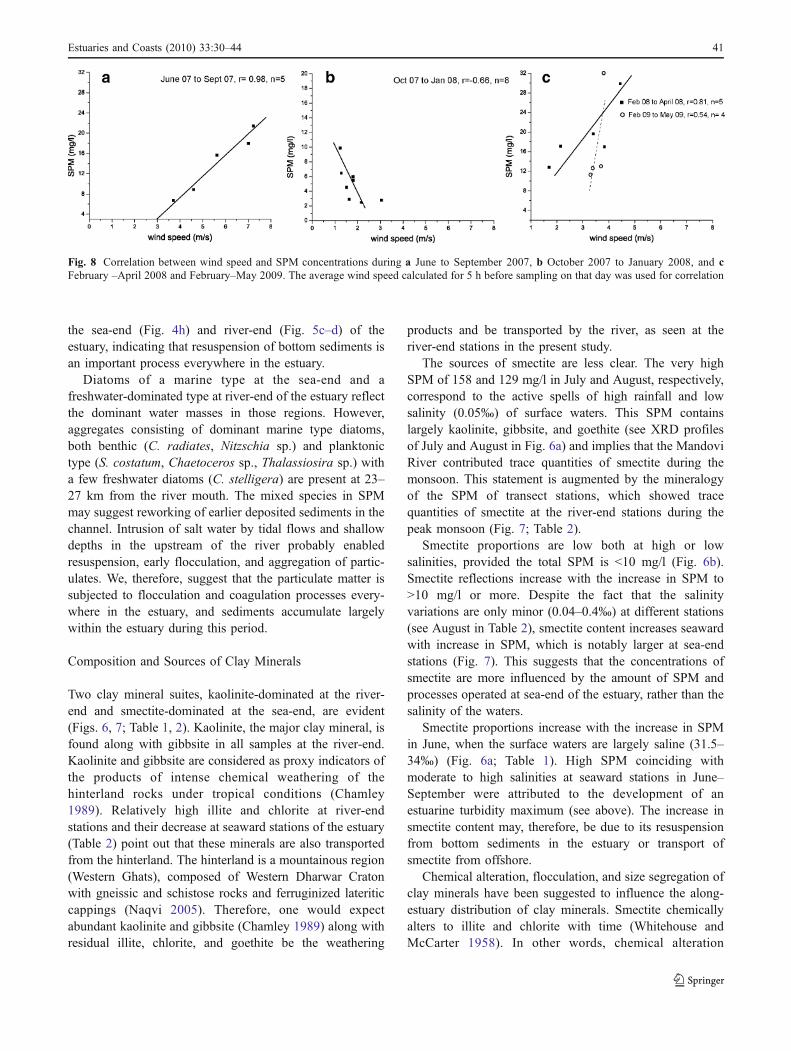
The ETM of June–September is present far downstreamand is associated with relatively low salinities and highriver discharge (Fig. 3a). The average wind speed calculat-ed for 5 h before sampling on that day was used forcorrelation. The wind speed measured during June–September 2007 ranged between 5.1 and 5.6 m s−1
(Fig. 2b). Moreover, the wind speed is strongly correlated(r=0.98) with the concentrations of SPM (Fig. 8a). The tidalrange varies between 2 to 2.5 m during this period (Shetye etal. 1995). The formation of the sea-end ETM can beexplained by resuspension due to the combined effects ofstrong westerly winds, wind-induced waves and currents,and stirring by tidal currents, with seaward moving riverflow concentrated at the surface. A combination of landwardadvection by estuarine-type circulation and landward-directed settling or scour lag away from high energy windsand waves favored movement of sediment up the estuary.
In contrast to the June–September ETM, the SPMconcentrations during October–November are low seawardand marginally high at river-end stations (Fig. 3a). Riverdischarge is negligible (Fig. 2a), and weak easterly windswith a speed of 1.8 to 2.6 m s−1 prevail during this period.A moderate negative correlation (r=−0.66) exists betweenwind speed and concentrations of SPM (Fig. 8b). Theabsence of convergent transport processes or strongresuspension at the sea-end (negligible river discharge andweak winds) and rapid intrusion of salt water into the
estuary may have suppressed turbulence, as was reportedby Hamblin (1989) and Geyer (1993), while estuarine-typecirculation continued to favor up-estuary sediment trans-port. The low SPM concentrations at sea-end stations inOctober and November (Fig. 3a) further suggest that thefine-grained sediments that remained in suspension mayhave settled in association with the return of salinity of~30‰ immediately after the SW monsoon.
The ETM occurring in February–April 2008 andFebruary–May 2009 at the sea-end stations is conspicuousand coincides with salinities of 25–35‰ and negligibleriver discharge. Therefore, this ETM is not simply relatedto the one usually reported in the literature at the estuarinefreshwater–seawater interface. The occurrence of ETM isan annual phenomenon, as seen in 2008 and 2009 (Fig. 3a,b). The wind during this period is dominated by sea breeze(Neetu et al. 2006) and blows NW and SW directions at aspeed of 3.2–3.7 m s−1. A positive correlation (r=0.54 to0.8) exists once again between wind speed and concen-trations of SPM (Fig. 8c). Several workers have reportedthe impact of wind (Weir and McManus, 1987), tidalcurrents (Geyer 1993; Scully and Friedrichs 2007), and seabreeze (Pattiaratchi et al. 1997) causing sediments toresuspend and generate turbidity maxima in other estuaries.As weak tidal currents (2–2.5-m range) prevail in thisregion, it is likely that this ETM is caused by the impact ofa stronger sea breeze and wind-induced waves near themouth of the estuary, resulting in sediments being resus-pended from the bottom and/or transport of wave-suspended oceanic sediments into the estuary.
Table 2 (continued)
Month Stations Salinity (‰) SPM (mg/l) Clay minerals
S (%) K (%) I (%) Ch (%)
2 33.2 17.0 8 46 24 22
3 31.0 12.2 7 63 16 15
4 26.1 13.1 7 68 17 9
5 24.9 9.8 3 49 35 13
April ‘08 1 33.8 16.8 28 41 23 8
2 33.2 12.8 15 41 27 16
3 29.5 11.9 4 67 21 8
4 23.8 6.7 9 42 28 21
5 22.4 7.3 9 56 27 8
May ‘08 1 34.5 6.7 2 53 27 19
2 33.9 6.0 3 50 26 21
3 32.4 13.5 2 64 12 22
4 25.5 5.6 1 41 43 15
5 23.9 2.9 1 48 35 16
See Fig. 1 for stations 1–5
S smectite, K kaolinite, I illite, Ch chlorite
Estuaries and Coasts (2010) 33:30–44 39

The river discharge is maximum during the SWmonsoon (June–September) but negligible during NEmonsoon (October–January) and pre-monsoon (February–May). High SPM is a persistent seaward deposit duringFebruary–May (Fig. 3a, b). The salinity vs. SPM plot(Fig. 3c) indicates that SPM is skewed landward. Althoughboth salinity and SPM decrease progressively from sea-endto river-end of the estuary, the decrease in SPM concen-trations can be seen at salinities >15‰, and SPM concen-
trations are low and consistently uniform at salinities<15‰. Waves and tidal currents contribute to a process ofdiffusive transport of sediment, which in turn depends onsettling velocity of particles and concentrations of SPM inthe water. The weak tidal currents (2–2.5-m range)prevailing in the estuary may not be sufficient enough toexport sediment farther landward from the deposit. Themaximum SPM concentration during February–May is upto 35 mg/l (Figs. 3a, b). As high SPM during this period islargely due to resuspension of bottom sediment, particlesizes in resuspended sediments must be larger and couldhave settled faster. Therefore, the impact of sediment byhorizontal diffusive transport can only be seen closer to thedeposit. Ross and Mehta (1991) suggested that the freesettling velocity of cohesive sediment occurs at the lowSPM concentrations of <0.4 g/l, the enhanced settling atmoderate concentrations 0.4–2 g/l, and the hindered settlingat the high concentrations >2 g/l.
Sedimentary Processes in the Estuary
The constituents in the SPM provide insight into theprocesses operating in the estuary. Broken fragments ofcarbonate skeletals are most probably derived from resus-pension of bottom sediments. Pennate diatoms and diatomfrustules (Fig. 4g) and elongated aggregates (Fig. 4f) mayalso support resuspension. Marine centric planktonicdiatoms may indicate biological productivity. Sharp et al.(1984) suggested that the peak production of phytoplanktonin the estuary coincides with large dilution of seawaterwhich is often associated with enrichment of nutrients.Diatoms are associated with aggregates both at the sea-endand river-end stations of the estuary (Figs. 4e–h, 5b, d).Zimmermam-Timns et al. (1998) studied the seasonaldynamics of aggregates and suggested that larger aggre-gates were found in the presence of diatoms. Theaggregates are usually rich in nutrients and enhancecolonization and subsequent growth of organisms. Micro-bial filaments associated with aggregates (Fig. 5h) indicatethe role of organic matter associated with bacterial surfaces.Bacterial mediation in sedimentation was noted by Zabawa(1978), who showed that bacteria by attaching to suspendedsolids secrete a mucus slime of sticky polysaccharides thatnot only holds particulates together (see Fig. 5g) but alsotraps isolated mineral grains as they collide with agglom-erated particles (see Biggs and Howell 1984). Pelletizationof fine-grained material into agglomerated fecal pellets(Fig. 5e–f) is a distinct process and suggests the effect offilter-feeding organisms in the packaging or biologicalmediation in sedimentation of particles. In other words,biological and biogeochemical processes appear active insedimentation and trapping sediment particulates. Flocculesand aggregates enclosing benthic diatoms are found both at
Fig. 7 Smectite distribution in suspended matter along the transectstations. Numbers 1–5 correspond to stations shown in Fig. 1
40 Estuaries and Coasts (2010) 33:30–44
the sea-end (Fig. 4h) and river-end (Fig. 5c–d) of theestuary, indicating that resuspension of bottom sediments isan important process everywhere in the estuary.
Diatoms of a marine type at the sea-end and afreshwater-dominated type at river-end of the estuary reflectthe dominant water masses in those regions. However,aggregates consisting of dominant marine type diatoms,both benthic (C. radiates, Nitzschia sp.) and planktonictype (S. costatum, Chaetoceros sp., Thalassiosira sp.) witha few freshwater diatoms (C. stelligera) are present at 23–27 km from the river mouth. The mixed species in SPMmay suggest reworking of earlier deposited sediments in thechannel. Intrusion of salt water by tidal flows and shallowdepths in the upstream of the river probably enabledresuspension, early flocculation, and aggregation of partic-ulates. We, therefore, suggest that the particulate matter issubjected to flocculation and coagulation processes every-where in the estuary, and sediments accumulate largelywithin the estuary during this period.
Composition and Sources of Clay Minerals
Two clay mineral suites, kaolinite-dominated at the river-end and smectite-dominated at the sea-end, are evident(Figs. 6, 7; Table 1, 2). Kaolinite, the major clay mineral, isfound along with gibbsite in all samples at the river-end.Kaolinite and gibbsite are considered as proxy indicators ofthe products of intense chemical weathering of thehinterland rocks under tropical conditions (Chamley1989). Relatively high illite and chlorite at river-endstations and their decrease at seaward stations of the estuary(Table 2) point out that these minerals are also transportedfrom the hinterland. The hinterland is a mountainous region(Western Ghats), composed of Western Dharwar Cratonwith gneissic and schistose rocks and ferruginized lateriticcappings (Naqvi 2005). Therefore, one would expectabundant kaolinite and gibbsite (Chamley 1989) along withresidual illite, chlorite, and goethite be the weathering
products and be transported by the river, as seen at theriver-end stations in the present study.
The sources of smectite are less clear. The very highSPM of 158 and 129 mg/l in July and August, respectively,correspond to the active spells of high rainfall and lowsalinity (0.05‰) of surface waters. This SPM containslargely kaolinite, gibbsite, and goethite (see XRD profilesof July and August in Fig. 6a) and implies that the MandoviRiver contributed trace quantities of smectite during themonsoon. This statement is augmented by the mineralogyof the SPM of transect stations, which showed tracequantities of smectite at the river-end stations during thepeak monsoon (Fig. 7; Table 2).
Smectite proportions are low both at high or lowsalinities, provided the total SPM is <10 mg/l (Fig. 6b).Smectite reflections increase with the increase in SPM to>10 mg/l or more. Despite the fact that the salinityvariations are only minor (0.04–0.4‰) at different stations(see August in Table 2), smectite content increases seawardwith increase in SPM, which is notably larger at sea-endstations (Fig. 7). This suggests that the concentrations ofsmectite are more influenced by the amount of SPM andprocesses operated at sea-end of the estuary, rather than thesalinity of the waters.
Smectite proportions increase with the increase in SPMin June, when the surface waters are largely saline (31.5–34‰) (Fig. 6a; Table 1). High SPM coinciding withmoderate to high salinities at seaward stations in June–September were attributed to the development of anestuarine turbidity maximum (see above). The increase insmectite content may, therefore, be due to its resuspensionfrom bottom sediments in the estuary or transport ofsmectite from offshore.
Chemical alteration, flocculation, and size segregation ofclay minerals have been suggested to influence the along-estuary distribution of clay minerals. Smectite chemicallyalters to illite and chlorite with time (Whitehouse andMcCarter 1958). In other words, chemical alteration
Fig. 8 Correlation between wind speed and SPM concentrations during a June to September 2007, b October 2007 to January 2008, and cFebruary –April 2008 and February–May 2009. The average wind speed calculated for 5 h before sampling on that day was used for correlation
Estuaries and Coasts (2010) 33:30–44 41

decreases smectite content. As SPM reflects the present dayconditions and there are no diagenetic changes expectedover short period in modern sediments (Grim 1968),chemical alteration does not explain the increased smectiteat sea-end stations (Fig. 7). Differential flocculation, i.e.,rapid flocculation of kaolinite and illite at lower salinitiesand smectite flocculation over a much wider salinity range,is a possible mechanism for along-estuary variations in clayminerals, based on laboratory experiments using kaolinite,illite, and smectite (Whitehouse et al. 1960). Our SEMstudy on suspended matter shows the presence of flocculesand aggregates both at the river-end and sea-end stations(Figs. 4, 5).
Smectite was found to be low both at low and highsalinities (Fig. 6b), suggesting that salinity influence isinsignificant on smectite content. Evidence for differentialflocculation has not been reported in natural environments.Since flocculation is related to the degree of turbulence, ithas been suggested that flocculation processes do notdifferentiate between materials by composition (Manheimand Hathaway 1972). Gibbs (1977) proposed that physicalsorting by size is responsible for along-estuary variations inclay minerals. As the grain size of smectite is smaller thanthat of kaolinite and illite, smectite tends to remain insuspension longer and selectively winnows farther from itssource (Gibbs 1977). Moreover, smectites have relativelyhigh surface area and thus bond with organic compoundswith greater intensity than the other clay minerals (Hedges1978; Degens and Ittekot 1984). As a consequence,optimum aggregation occurs with this mineral. Aggregationor flocculation processes would be effective only whensmectite is present in the waters. Since trace quantities ofsmectite are transported through river discharge (Table 2),smectite resuspended from bottom sediments and/or trans-ported from offshore perhaps could be the primary sourceof smectite. Bottom sediments indeed showed high smectitecontent at the sea-end of the estuary, and its concentrationsdecrease towards the river-end (Bukhari and Nayak 1996;our unpublished data). Resuspension of bottom sedimentsduring the development of the turbidity maximum mayhave enhanced smectite concentrations. Abundant flocculesseen at the sea-end stations indicate biogeochemicalprocesses (flocculation, coagulation, productivity) are ac-tive in the turbidity maximum.
Smectite is the dominant claymineral in the sediments of thecontinental shelf north of Goa (Rao and Rao 1995). Althoughthe southerly surface currents and westerly winds prevailingalong the margin during the SW monsoon and the sea breezewith wind speeds of 3.2 to 3.8 m s−1 during the pre-monsoonwould facilitate transportation of smectite into the estuarineregion, available hydrographic data and/or data presented heredo not provide sufficient evidence for existence of thisprocess. More work is required to confirm the same.
Conclusions
Knowledge on the concentrations of SPM and theirtransport and fate in dynamic environments such asestuaries is of vital importance in their management withrespect to the maintenance of fairways and harbor devel-opment, their turbulence and water quality, and thesuitability of habitats to numerous species. The concen-trations of SPM vary in time and space and are largelyaffected by river discharge, settling velocities of sediment,flocculation, and resuspension of sediments. Turbidityplays an important role in maintaining “health of theestuary.” If turbidity exceeds 1 g/l, oxygen concentrationsdeplete and correspond to hypoxic conditions and may havedeleterious effects on macrofauna. High SPM in theMandovi estuary is a persistent seaward deposit. Thehighest concentration of SPM in the turbidity maxima is35 mg/l. The estuarine turbidity maximum occurs at sea-end stations during the two windiest times of year, June–September and February–May, suggesting the role of windsin its formation. SPM comprising of floccules, aggregates,and fecal pellets occurs everywhere in the estuary. Thesources of high smectite at sea-end stations are not clear.Resuspension of fine-grained material appears to be animportant process in the estuary during the pre-monsoonand monsoon.
Acknowledgements We thank Dr. S. R. Shetye, the Director,National Institute of Oceanography, Goa, for his keen interest on the“Mandovi Monsoon Experiment,” discussions, and making usavailable the manuscript in communication. Dr. Dileepkumar providedfunds for Project Assistant from the Project “SIP 1308.” Dr. SmitaMitbhavkar identified diatoms and helped us in discussions. Shri D.Sundar and G.S. Michael organized boat cruises fortnightly andprovided salinity data. Mr. Girish Prabhu helped us with X-raydiffraction analyses. We thank Prof. Carl Friedrichs, VIMS, USA forthe critical and constructive review and two anonymous reviewers foroffering several comments on our earlier manuscript. We thank Prof.James Cloern, Editor, Estuaries and Coasts for patience and valuablecomments on our paper. This is NIO contribution 4623.
References
Alagarsamy, R. 2006. Distribution and seasonal variation of tracemetals in surface sediments of the Mandovi estuary, west coast ofIndia. Estuarine, Coastal and Shelf Science 67: 333–339.
Allen, G.P., J.C. Salmon, P. Bassaullet, Y. Du Penhoat, and C. DeGrand. 1980. Effects of tides on mixing and suspended sedimenttransport in macrotidal estuaries. Sedimentary Geology 26: 69–90.
Biggs, R.B. and A.A. Howell. 1984. The estuary as a sediment trap:alternate approaches to estimating its filtering efficiency. In Theestuary as a filter, ed. V.S. Kennedy, 107–130. New York:Academic.
Biscaye, P.E. 1965. Mineralogy and sedimentation of recent deep seaclay in the Atlantic Ocean and adjacent seas and oceans.Geological Society of America Bulletin 76: 803–831.
42 Estuaries and Coasts (2010) 33:30–44

Bris, L. and M. Glemarec. 1996. Marine and brackish ecosystems ofsouth Brittany (Lorient and Vilaine Bays) with particularreference to the effect of the turbidity maxima. Estuarine,Coastal and Shelf Science 42: 737–753.
Brydsten, L. 1992. Wave-induced sediment suspension in the Oreestuary, northern Sweden. Hydrobiologia 235(236): 71–83.
Bukhari, S.S. and G.N. Nayak. 1996. Clay minerals in identificationof provenance of sediments of Mandovi estuary, Goa, west coastof India. Indian Journal of Marine Sciences 25: 341–345.
Buller, A.T. 1975. Sediments of the Tay estuary II formation ofephermal zones of high suspended sediment concentration.Proceedings of the Royal Society of Edenburgh 75B: 65–89.
Castaing, P.G. and P. Allen. 1981. Mechanisms controlling seawardescape of suspended sediment from the Girande. A macrotidalestuary in France. Marine Geology 40: 101–118.
Chamley, H. 1989. Clay Sedimentology. Heidelberg: Springer. 623 p.Chen, M.S., S. Wartel, B.V. Eck, and D.V. Maldegam. 2005.
Suspended matter in the Scheldt estuary. Hydrobiologia 540:79–104.
Chen, S.-L., G.-A. Zhang, S.-L. Yang, and J.Z. Shi. 2006. Temporalvariations of fine suspended sediment concentrations in theChangjang River estuary and adjacent coastal waters, China.Journal of Hydrology 331: 132–145.
Degens, E.T., and V. Ittekot. 1984. A New Look at Clay–OrganicInteractions, In Nord-Sud profil, Zentraleuropa-MittelmeerraumAfrika, Mitteilungen aus dem Geologish-Paleontologischen, ed.F. G. Knetsch, Heft 56, 229–248, Institute der UniversitatHamburg.
Edzwald, J.K. and C.R. O’Melia. 1975. Clay distribution in recentestuarine sediments. Clays and Clay minerals 23: 39–44.
Eisma, D. 1986. Flocculation and deflocculation of suspended matterin estuaries. Netherlands Journal of Sea Research 20: 183–199.
Festa, J.A. and D.V. Hansen. 1978. Turbidity maxima in partiallymixed estuaries: A two dimensional numerical model. EstuarineCoastal Marine Science 7: 347–359.
Geyer, W.R. 1993. The importance of suppression of turbulence bystratification on the estuarine turbidity maximum. Estuaries 16:113–125.
Gibbs, R.J. 1977. Clay mineral segregation in the marine environment.Journal of Sedimentary Petrology 47: 237–243.
Grabemann, I., R.J. Uncles, G. Krause, and J.A. Stephens. 1997.Behaviour of turbidity maxima in the Tamar (U.K.) and Weser (F.R.G.) estuaries. Estuarine. Coastal and Shelf Science 45: 235–246.
Grim, R.E. 1968. Clay mineralogy. New York: McGraw Hill. 468 p.Hamblin, P.F. 1989. Observations and model sediment transport near
the turbidity maximum of the Upper Saint Lawrence Estuary.Journal of Geophysical Research 94: 14419–14428.
Hedges, J.I. 1978. The formation and clay mineral reactions ofmelanoidins. Geochimica et Cosmochimica Acta 42: 69–76.
Hossain, S.B. and D.McConchie Eyre. 2001. Suspended sedimenttransport dynamics in the sub-tropical micro-tidal RichmondRiver estuary, Australia. Estuarine, Coastal and Shelf Science 52:529–541.
Kennedy, V.S. 1984. The Estuary as a Filter, 511. New York:Academic.
Manheim, F.T. and J.C. Hathaway. 1972. Suspended matter in surfacewater of the northern Gulf of Mexico. Limnology and Oceanog-raphy 17: 17–27.
McManus, J. 2005. Salinity and suspended matter variations in theTay estuary. Continental Shelf Research 25: 729–747.
Naqvi, S.M. 2005. Geology and evolution of the Indian Plate (fromHadean to Holocene-4 Ga to 4 Ka). New Delhi: Capital. 450 pp.
Neetu, S., S.R. Shetye, and P. Chandramohan. 2006. Impact of seabreeze on wind-seas off Goa, west coast of India. Journal ofEarth System Science 115: 229–234.
Officer, C.B. 1980. Discussion of the turbidity maximum in partiallymixed estuaries. Estuarine, Coastal Marine Science 10: 239–246.
Pattiaratchi, C.B., B. Hegge, J. Gould, and I. Eliot. 1997. Impact ofsea-breeze activity on nearshore and foreshore processes insouthwestern Australia. Continental Shelf Research 17: 1539–1560.
Postma, H. 1967. Sediment transport in the estuarine environment.In: Estuaries, ed. G. H. Lauff, American Association forAdvancement of Science, Washington, D.C. Publication 83:158–179.
Qasim, S.Z. and R. Sengupta. 1981. Environmental characteristics ofthe Mandovi-Zuari estuarine system in Goa. Estuarine, Coastaland Shelf Science 13: 557–578.
Ramaiah, N., V. Rodrigues, E. Alvares, C. Rodrigues, R. Baksh, S.Jayan, and C. Mohandas. 2007. Sewage pollution indicatorbacteria. In The Mandovi and Zuari estuaries, ed. S.R. Shetye,M. Dileep Kumar, and D. Shankar, 115–120. Goa: NationalInstitute of Oceanography.
Rao, V.P. and B.R. Rao. 1995. Provenance and distribution of clayminerals in the continental shelf and slope sediments of the westcoast of India. Continental Shelf Research 15: 1757–1771.
Ross, M. A., and J. A. Mehta, 1991. Fluidization of Soft Muds byWaves. In: Microstructure of Fine-Grained Terrigenous MarineSediments from Mud to Shale, eds. R. H. Bennett, W. R. Bryant,and M. H. Hulbert, 185–191, Frontiers in Sedimentary Geology,Springer Verlag.
Schubel, J.R. 1968. Turbidity maxima of the northern ChesapeakeBay. Science 161: 1013–1015.
Schubel, J.R. and V.S. Kennedy. 1984. The estuary as a filter: anintroduction. In The Estuary as a Filter, ed. V.S. Kennedy, 1–14.New York: Academic.
Schoelhamer, D.H. 2001. Influence of salinity, bottom topography andtides on locations of estuarine turbidity maximum in northernSan Francisco Bay. In Coastal and estuarine fine sedimenttransport processes, eds. W.H. Mc Anally, and Mehta A.H., 343–357. Elsevier Science B.V.
Sanford, L.P. 1994. Wave-forced resuspension of upper ChesapeakeBay muds. Estuaries 17: 148–165.
Scully, M.E. and C.T. Friedrichs. 2007. Sediment pumping by tidalasymmetry in a partially mixed estuary. Journal of GeophysicalResearch 112: CO7028. doi:10: 1029/2006 JC003784.
Sharp, H.H., J.R. Pennock, T.M. Church, J.M. Tramontano, and J.M.Cifuenters. 1984. The estuarine interaction of nutrients, organics,and metals: A case study in the Delaware estuary. In The Estuaryas a Filter, ed. V.S. Kennedy, 241–260. New York: Academic.
Shetye, S.R., A.D. Gouveia, S.Y.S. Singbal, C.G. Naik, D. Sundar, G.S. Michael, and G. Nampoorthiri. 1995. Propagation of tides inthe Mandovi-Zuari estuarine network. Proceedings of IndianAcademy of Sciences (Earth and Planetary Sciences) 104: 667–682.
Shetye, S.R., M.D. Kumar, and D. Shankar. 2007. The Mandovi andZuari Estuaries. Goa: National Institute of Oceanography. 145 p.
Sundar, D. and S.R. Shetye. 2005. Tides in the Mandovi and Zuariestuaries, Goa, west coast of India. Journal Earth System Science114: 493–503.
Verlaan, P.A., M. Donze, and P. Kuik. 1997. Marine vs. Fluvialsuspended matter in the Scheldt estuary. Estuarine Coastal andShelf Science 46: 873–883.
Winterwerp, J.C. 2002. On the flocculation and settling velocity ofestuarine mud. Continental Shelf Research 22: 1339–1360.
Weir, D.J. and J. McManus. 1987. The role of wind in generatingturbidity maxima in the Tay estuary. Continental Shelf Research7: 1315–1318.
Whitehouse, U.G. and R.S. Mccarter. 1958. Diagenetic modificationof clay minerals in artificial seawater. Clays and Clay minerals
Estuaries and Coasts (2010) 33:30–44 43

National Academy of Sciences, National Resesrch CouncilPublication 566: 81–119.
Whitehouse, U. G., L. M. Jeffrey, and J. D. Debrecht, 1960.Differential settling tendencies of clay minerals in saline waters,In Clays and Clay minerals, 5th National Conference on clay andclay minerals, 81–119. Pergamon, Oxford.
Zabawa, C.F. 1978. Microstructure of agglomerated suspendedsediments in Northern Chesapeake Bay estuary. Science 20:49–51.
Zimmermam-Timns, H., H. Holst, and S. Muller. 1998. Seasonaldynamics of aggregates and their typical Biocoenosis in the Elbeestuary. Estuaries 21: 613–621.
44 Estuaries and Coasts (2010) 33:30–44