Embed Size (px)
Citation preview
ANRV325-EG32-03 ARI 14 September 2007 19:18
The Nature and Valueof Ecosystem Services:An Overview HighlightingHydrologic ServicesKate A. Brauman,1 Gretchen C. Daily,2
T. Ka’eo Duarte,3 and Harold A. Mooney2
1Interdisciplinary Program in Environment and Resources, 2Department of BiologicalSciences, Stanford University, Stanford, California 94305;email: [email protected], [email protected], [email protected] Department and Water Resources Research Center, University of Hawaii atManoa, Honolulu, Hawaii 96822; email: [email protected]
Annu. Rev. Environ. Resour. 2007. 32:67–98
First published online as a Review in Advance onJuly 13, 2007
The Annual Review of Environment and Resourcesis online at http://environ.annualreviews.org
This article’s doi:10.1146/annurev.energy.32.031306.102758
Copyright c© 2007 by Annual Reviews.All rights reserved
1543-5938/07/1121-0067$20.00
Key Words
ecosystem valuation, environmental policy, flood control,freshwater, hydrology, land management, water supply
AbstractEcosystem services, the benefits that people obtain from ecosystems,are a powerful lens through which to understand human relation-ships with the environment and to design environmental policy. Theexplicit inclusion of beneficiaries makes values intrinsic to ecosystemservices; whether or not those values are monetized, the ecosystemservices framework provides a way to assess trade-offs among alter-native scenarios of resource use and land- and seascape change. Weprovide an overview of the ecosystem functions responsible for pro-ducing terrestrial hydrologic services and use this context to lay outa blueprint for a more general ecosystem service assessment. Otherecosystem services are addressed in our discussion of scale and trade-offs. We review valuation and policy tools useful for ecosystem ser-vice protection and provide several examples of land managementusing these tools. Throughout, we highlight avenues for research toadvance the ecosystem services framework as an operational basisfor policy decisions.
67
Ann
u. R
ev. E
nvir
on. R
esou
rc. 2
007.
32:6
7-98
. Dow
nloa
ded
from
arj
ourn
als.
annu
alre
view
s.or
gby
Pro
f D
iana
Liv
erm
an o
n 12
/30/
07. F
or p
erso
nal u
se o
nly.
ANRV325-EG32-03 ARI 14 September 2007 19:18
Ecosystem services:the benefits peopleobtain fromecosystems
MA: MillenniumEcosystemAssessment
Contents
INTRODUCTION. . . . . . . . . . . . . . . . . 68EVOLUTION OF THE
ECOSYSTEM SERVICESCONCEPT. . . . . . . . . . . . . . . . . . . . . . 69
BIOPHYSICAL GENERATION OFHYDROLOGIC SERVICES . . . . . 71Introduction to Hydrologic
Services . . . . . . . . . . . . . . . . . . . . . . . 72Water Quantity . . . . . . . . . . . . . . . . . . 74Water Quality . . . . . . . . . . . . . . . . . . . . 77Location of Delivery. . . . . . . . . . . . . . 78Timing of Delivery . . . . . . . . . . . . . . . 79Trends in Hydrologic Service
Delivery . . . . . . . . . . . . . . . . . . . . . . 80BENEFICIARIES AND
PRODUCERS . . . . . . . . . . . . . . . . . . . 81Human Consumption and
Production of EcosystemServices . . . . . . . . . . . . . . . . . . . . . . . 81
VALUATION . . . . . . . . . . . . . . . . . . . . . . 83Economic, Ecological, and Social
Value of Ecosystem Services . . . 83POLICY. . . . . . . . . . . . . . . . . . . . . . . . . . . . 85
Tools for Ecosystem ServiceProtection and Management . . . 85
ECOSYSTEM SERVICE-BASEDLAND MANAGEMENT INPRACTICE . . . . . . . . . . . . . . . . . . . . . 87
INTRODUCTION
Ecosystem services are the benefits people ob-tain from ecosystems (1). Throughout hu-man history, people have understood thattheir well-being is related to the function-ing of ecosystems around them. Intensifyinghuman impacts on ecosystems worldwide—and on the supply of services they provide—have accentuated the need to move beyondsimple recognition of human dependence onthe environment and create more sustainableinteractions (2). The term “ecosystem ser-vices” emerged in the early 1980s to describea framework for structuring and synthesizing
biophysical understanding of ecosystem pro-cesses in terms of human well-being (3).
Understanding ecosystems from the per-spective of humans as beneficiaries hastremendous potential for protecting ecosys-tems and the services they provide. Theecosystem services framework links conser-vation and development by relating environ-mental health to human health, security, andmaterial goods necessary for well-being (4).Coverage in the popular press, as well as at-tention from diverse leaders in academia, gov-ernment, and the private sector in communi-ties worldwide, illustrates the broad appeal ofthe ecosystem services conceptual framework(5).
Tremendous progress has been made to-ward characterizing ecosystem services inboth the natural and social sciences. TheMillennium Ecosystem Assessment (MA),the formal international effort to elevateawareness and understanding of societal de-pendence on ecosystems and currently thebenchmark for ecosystem services research,illustrated the wide-ranging importance ofecosystem services. It simultaneously under-scored the many remaining research needs (6).In order for ecosystem services to move froma conceptual to an operational framework fordecision making, much natural, social, eco-nomic, and policy science remains to be done.
Here, we review key fronts on whichprogress has been made and suggest what isneeded in the near- and long-term to makethe framework useful, credible, and widelyapplicable in decision making. This reviewfocuses on terrestrial freshwater hydrologicservices, synthesizing discussion from manyforums about ecosystem effects on freshwa-ter. Ecosystems provide hydrologic servicesin tandem with a variety of other essentialservices, including air quality, carbon diox-ide sequestration, and soil generation. Theseservices are often interrelated in dynamicand complex ways; understanding their func-tioning and relationships requires approachesspanning diverse fields of inquiry. For sim-plicity and appropriate depth of coverage, we
68 Brauman et al.
Ann
u. R
ev. E
nvir
on. R
esou
rc. 2
007.
32:6
7-98
. Dow
nloa
ded
from
arj
ourn
als.
annu
alre
view
s.or
gby
Pro
f D
iana
Liv
erm
an o
n 12
/30/
07. F
or p
erso
nal u
se o
nly.
ANRV325-EG32-03 ARI 14 September 2007 19:18
focus on hydrologic services, using them as thepoint of entry to a more general discussion oftrade-offs, valuation, and policy. Although in-timately linked to freshwater services, we alsolimit our discussion of marine services.
Following an overview of the history ofecosystem services, we review the biophysi-cal production of hydrologic services. In pre-senting a structure for defining and assess-ing hydrologic services, we aim to provide ablueprint for evaluating other services. Wethen go on to report the current state ofknowledge about the beneficiaries, valuation,and policy for a wider range of services.In closing, we lay out an agenda for futureecosystem services research.
EVOLUTION OF THEECOSYSTEM SERVICESCONCEPT
Ecosystem service is a new name for an oldidea. Plato, and likely many before him,worried about the environment’s capacity toprovide sufficient resources for a growingpopulation (7). In many cases, these worrieswere expressed as ecosystems degraded;they chronicle a failure of ecosystem servicedelivery. Recognizing their reliance onnatural systems, people have long attemptedto divorce themselves from the vagaries ofthis dependence. Part of the promise of mod-ernism was that technology could provideservices more efficiently and more reliablythan natural systems could (8). Although itmay be possible to augment or replace someecosystem services—often at great cost, on alimited scale, or in constrained locations—thereliance of technology on functioning ecosys-tems often goes unrecognized. Water filtra-tion plants, for example, may be necessary tokeep drinking water at mandated standards,but these plants operate most efficiently intandem with environmental filtration (9).
The services people receive from ecosys-tems are many and varied; understanding,studying, and making policy on the basis ofthis broad array of services requires that these
services be organized conceptually in a co-herent way. The conditions and processesunderlying ecosystem service production areso tightly interlinked that any classificationis inherently somewhat arbitrary. The MAhas suggested dividing services into four cat-egories, illustrated in Figure 1, which wehave adopted. First, provisioning services pro-vide goods such as food, freshwater, timber,and fiber for direct human use; these are afamiliar part of the economy. Second, andmuch less widely appreciated, regulating ser-vices maintain a world in which it is biophysi-cally possible for people to live and providebenefits such as pollination of crops, waterdamage mitigation, and climate stabilization.Third, cultural services make the world a placein which people want to live; they includerecreation as well as aesthetic, intellectual, andspiritual inspiration. Fourth, supporting servicesare the underlying ecosystem processes thatproduce the direct services described above,including the preservation of options (1).
In an effort to increase the tractability ofthe ecosystem services concept, some haveproposed that ecosystem accounting shouldinclude only the final products of ecosystemprocesses, things that are directly enjoyed byhumans, not the processes themselves (10).We use the MA’s system to emphasize thatsupporting services are fundamentally inter-mediate, not end products. Recognizing sup-porting services is essential to managing andmaintaining the delivery of ecosystem endproducts. Furthermore, end products are vari-able. Some supporting services, including pol-lination and nutrient sequestration, have mar-ket institutions built around them as end prod-ucts, although many consider them interme-diate services.
The ecosystem services framework makesexplicit the complex feedbacks and trade-offs among services and human beneficia-ries. Production of one service may come atthe expense of another, just as consumptionof resources by some people and activitiesmay come at the expense of consumption byothers, elsewhere and in the future. These
www.annualreviews.org • Ecosystem Services 69
Ann
u. R
ev. E
nvir
on. R
esou
rc. 2
007.
32:6
7-98
. Dow
nloa
ded
from
arj
ourn
als.
annu
alre
view
s.or
gby
Pro
f D
iana
Liv
erm
an o
n 12
/30/
07. F
or p
erso
nal u
se o
nly.

ANRV325-EG32-03 ARI 14 September 2007 19:18
Life on Earth: BiodiversityLife on Earth: Biodiversity
Ecosystem ServicesEcosystem Services
ProvisioningFoodWaterFiber. . .
ProvisioningFoodWaterFiber. . .
Regulating Climate regulationDisease regulationWater purification. . .
Regulating Climate regulationDisease regulationWater purification. . .
CulturalSpiritualReligiousAesthetic. . .
CulturalSpiritualReligiousAesthetic. . .
Supporting Nutrient cyclingSoil formationPrimary production
Supporting Nutrient cyclingSoil formationPrimary production
Constituents of Well-BeingConstituents of Well-Being
SecurityPersonal safetyResource accessSecure from disasters
SecurityPersonal safetyResource accessSecure from disasters disasters
MaterialLivelihoodsFoodShelter
MaterialLivelihoodsFoodShelter
HealthStrengthFeeling wellClean air and water
HealthStrengthFeeling wellClean air and water
Freedom of Choice and
Action Opportunity to be able to achieve
what an individual values doing and being
Freedom of Choice and
Action Opportunity to be able to achieve
what an individual values doing and being
Social RelationsSocial cohesionMutual respectAbility to help others
Social RelationsSocial cohesionMutual respectAbility to help others
Figure 1Millennium Ecosystem Assessment classification scheme. Ecosystem services can be divided into fourcategories. Supporting services create the conditions that allow provisioning, regulating, and culturalservices to be delivered. Each type of service affects human well-being in a variety of ways. From(1) Ecosystems and Human Well-Being: Our Human Planet by the Millennium Ecosystem Assessment.Copyright c© 2005 by the author. Reproduced by permission of Island Press, Washington, D.C.
trade-offs are fraught with practical and ethi-cal considerations beyond the domain of phys-ical and natural science. Integrative science,however, can inform decision making, usingtools such as valuation and scenario analysis(11, 12).
The MA synthesizes and analyzes the cur-rent conceptual theory and knowledge un-derpinning the ecosystem services framework.The next step is to make the framework prac-tical, straightforward, transparent, and cred-ible enough to be useful to decision makers.Current knowledge about ecosystem serviceproduction has often been generated in fieldsnot directly concerned with ecosystem ser-vices. Evaluating this knowledge and gener-ating new research that can inform manage-ment and policy decisions about ecosystemsand their services requires
� Information on service provision andvalue at policy-relevant scales
� Formal methods for incorporating cul-tural values in a meaningful way
� Practical know-how in the process of in-stitutional design and implementation
� Compelling models of success
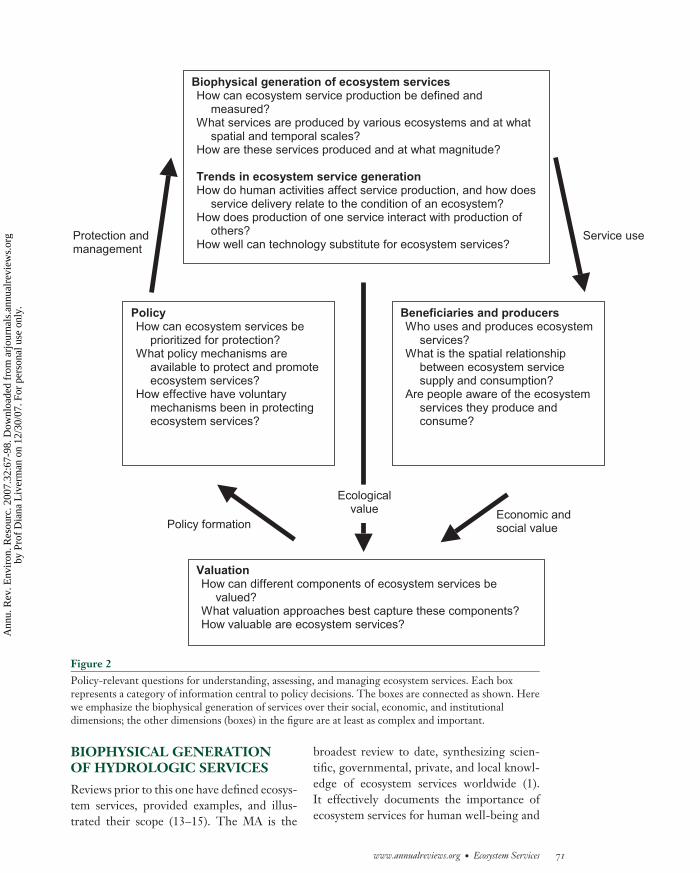
In Figure 2, we have compiled a list ofpolicy-relevant questions that are applicableto every class of ecosystem service. Althoughour answers to these questions are necessarilypresented linearly, there is no natural order inwhich they should be asked and answered, asevery question is informed by each of the oth-ers. We address the questions for hydrologicservices, illustrating one way existing researchcan be assimilated, new research conducted,and all research presented in formats usefulto decision makers.
70 Brauman et al.
Ann
u. R
ev. E
nvir
on. R
esou
rc. 2
007.
32:6
7-98
. Dow
nloa
ded
from
arj
ourn
als.
annu
alre
view
s.or
gby
Pro
f D
iana
Liv
erm
an o
n 12
/30/
07. F
or p
erso
nal u
se o
nly.
ANRV325-EG32-03 ARI 14 September 2007 19:18
Protection and management
Service use
Economic and social value Policy formation
Policy How can ecosystem services be
prioritized for protection? What policy mechanisms are
available to protect and promote ecosystem services?
How effective have voluntary mechanisms been in protecting ecosystem services?
ValuationHow can different components of ecosystem services be
valued? What valuation approaches best capture these components? How valuable are ecosystem services?
Ecological value
Biophysical generation of ecosystem servicesHow can ecosystem service production be defined and
measured? What services are produced by various ecosystems and at what
spatial and temporal scales? How are these services produced and at what magnitude?
Trends in ecosystem service generation How do human activities affect service production, and how does
service delivery relate to the condition of an ecosystem? How does production of one service interact with production of
others? How well can technology substitute for ecosystem services?
Beneficiaries and producers Who uses and produces ecosystem
services? What is the spatial relationship
between ecosystem service supply and consumption?
Are people aware of the ecosystem services they produce and consume?
Figure 2Policy-relevant questions for understanding, assessing, and managing ecosystem services. Each boxrepresents a category of information central to policy decisions. The boxes are connected as shown. Herewe emphasize the biophysical generation of services over their social, economic, and institutionaldimensions; the other dimensions (boxes) in the figure are at least as complex and important.
BIOPHYSICAL GENERATIONOF HYDROLOGIC SERVICES
Reviews prior to this one have defined ecosys-tem services, provided examples, and illus-trated their scope (13–15). The MA is the
broadest review to date, synthesizing scien-tific, governmental, private, and local knowl-edge of ecosystem services worldwide (1).It effectively documents the importance ofecosystem services for human well-being and
www.annualreviews.org • Ecosystem Services 71
Ann
u. R
ev. E
nvir
on. R
esou
rc. 2
007.
32:6
7-98
. Dow
nloa
ded
from
arj
ourn
als.
annu
alre
view
s.or
gby
Pro
f D
iana
Liv
erm
an o
n 12
/30/
07. F
or p
erso
nal u
se o
nly.
ANRV325-EG32-03 ARI 14 September 2007 19:18
Ecohydrologicprocess: a processdescribed by bothecologic andhydrologic functions
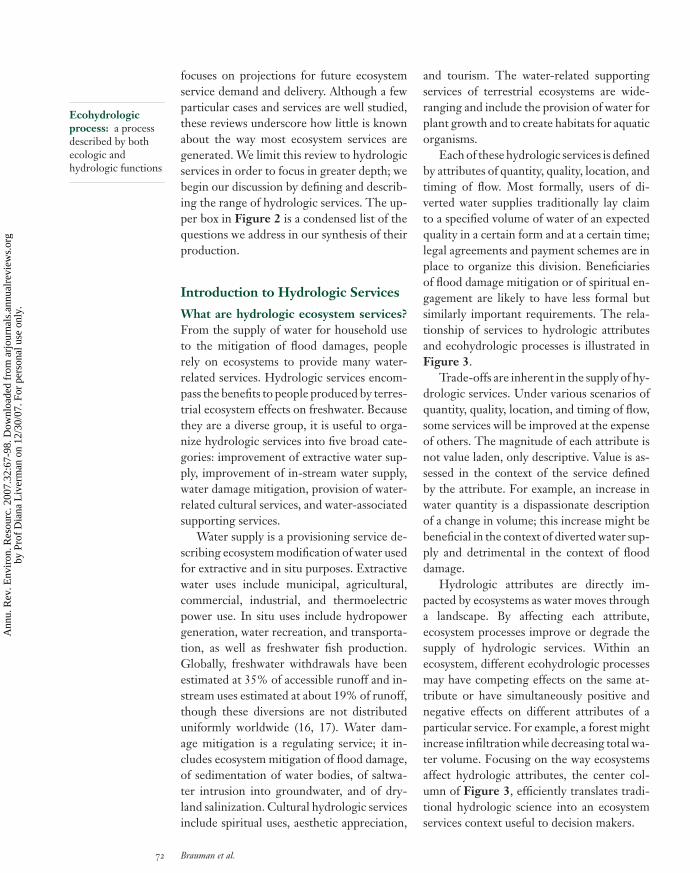
focuses on projections for future ecosystemservice demand and delivery. Although a fewparticular cases and services are well studied,these reviews underscore how little is knownabout the way most ecosystem services aregenerated. We limit this review to hydrologicservices in order to focus in greater depth; webegin our discussion by defining and describ-ing the range of hydrologic services. The up-per box in Figure 2 is a condensed list of thequestions we address in our synthesis of theirproduction.
Introduction to Hydrologic Services
What are hydrologic ecosystem services?From the supply of water for household useto the mitigation of flood damages, peoplerely on ecosystems to provide many water-related services. Hydrologic services encom-pass the benefits to people produced by terres-trial ecosystem effects on freshwater. Becausethey are a diverse group, it is useful to orga-nize hydrologic services into five broad cate-gories: improvement of extractive water sup-ply, improvement of in-stream water supply,water damage mitigation, provision of water-related cultural services, and water-associatedsupporting services.
Water supply is a provisioning service de-scribing ecosystem modification of water usedfor extractive and in situ purposes. Extractivewater uses include municipal, agricultural,commercial, industrial, and thermoelectricpower use. In situ uses include hydropowergeneration, water recreation, and transporta-tion, as well as freshwater fish production.Globally, freshwater withdrawals have beenestimated at 35% of accessible runoff and in-stream uses estimated at about 19% of runoff,though these diversions are not distributeduniformly worldwide (16, 17). Water dam-age mitigation is a regulating service; it in-cludes ecosystem mitigation of flood damage,of sedimentation of water bodies, of saltwa-ter intrusion into groundwater, and of dry-land salinization. Cultural hydrologic servicesinclude spiritual uses, aesthetic appreciation,
and tourism. The water-related supportingservices of terrestrial ecosystems are wide-ranging and include the provision of water forplant growth and to create habitats for aquaticorganisms.
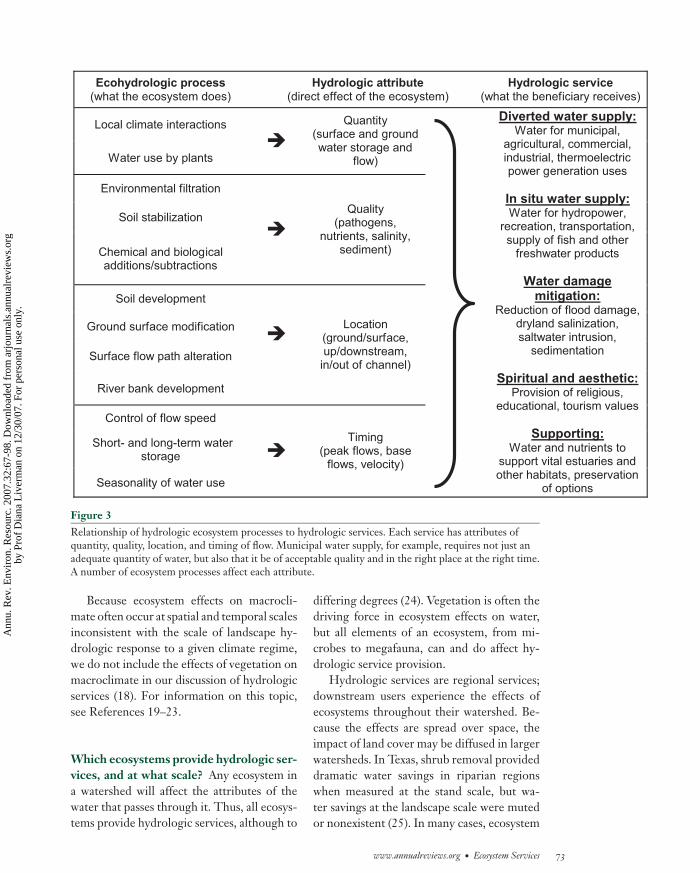
Each of these hydrologic services is definedby attributes of quantity, quality, location, andtiming of flow. Most formally, users of di-verted water supplies traditionally lay claimto a specified volume of water of an expectedquality in a certain form and at a certain time;legal agreements and payment schemes are inplace to organize this division. Beneficiariesof flood damage mitigation or of spiritual en-gagement are likely to have less formal butsimilarly important requirements. The rela-tionship of services to hydrologic attributesand ecohydrologic processes is illustrated inFigure 3.
Trade-offs are inherent in the supply of hy-drologic services. Under various scenarios ofquantity, quality, location, and timing of flow,some services will be improved at the expenseof others. The magnitude of each attribute isnot value laden, only descriptive. Value is as-sessed in the context of the service definedby the attribute. For example, an increase inwater quantity is a dispassionate descriptionof a change in volume; this increase might bebeneficial in the context of diverted water sup-ply and detrimental in the context of flooddamage.
Hydrologic attributes are directly im-pacted by ecosystems as water moves througha landscape. By affecting each attribute,ecosystem processes improve or degrade thesupply of hydrologic services. Within anecosystem, different ecohydrologic processesmay have competing effects on the same at-tribute or have simultaneously positive andnegative effects on different attributes of aparticular service. For example, a forest mightincrease infiltration while decreasing total wa-ter volume. Focusing on the way ecosystemsaffect hydrologic attributes, the center col-umn of Figure 3, efficiently translates tradi-tional hydrologic science into an ecosystemservices context useful to decision makers.
72 Brauman et al.
Ann
u. R
ev. E
nvir
on. R
esou
rc. 2
007.
32:6
7-98
. Dow
nloa
ded
from
arj
ourn
als.
annu
alre
view
s.or
gby
Pro
f D
iana
Liv
erm
an o
n 12
/30/
07. F
or p
erso
nal u
se o
nly.
ANRV325-EG32-03 ARI 14 September 2007 19:18
Ecohydrologic process (what the ecosystem does)
Hydrologic attribute (direct effect of the ecosystem)
Hydrologic service (what the beneficiary receives)
Local climate interactions
Water use by plants
Quantity (surface and ground water storage and
flow)
Environmental filtration
Soil stabilization
Chemical and biological additions/subtractions
Quality (pathogens,
nutrients, salinity, sediment)
Soil development
Ground surface modification
Surface flow path alteration
River bank development
Location (ground/surface, up/downstream,
in/out of channel)
Control of flow speed
Short- and long-term water storage
Seasonality of water use
Timing (peak flows, base
flows, velocity)
Diverted water supply: Water for municipal,
agricultural, commercial, industrial, thermoelectric power generation uses
In situ water supply:Water for hydropower,
recreation, transportation, supply of fish and other
freshwater products
Water damage mitigation:
Reduction of flood damage, dryland salinization, saltwater intrusion,
sedimentation
Spiritual and aesthetic:Provision of religious,
educational, tourism values
Supporting:Water and nutrients to
support vital estuaries and other habitats, preservation
of options
Figure 3Relationship of hydrologic ecosystem processes to hydrologic services. Each service has attributes ofquantity, quality, location, and timing of flow. Municipal water supply, for example, requires not just anadequate quantity of water, but also that it be of acceptable quality and in the right place at the right time.A number of ecosystem processes affect each attribute.
Because ecosystem effects on macrocli-mate often occur at spatial and temporal scalesinconsistent with the scale of landscape hy-drologic response to a given climate regime,we do not include the effects of vegetation onmacroclimate in our discussion of hydrologicservices (18). For information on this topic,see References 19–23.
Which ecosystems provide hydrologic ser-vices, and at what scale? Any ecosystem ina watershed will affect the attributes of thewater that passes through it. Thus, all ecosys-tems provide hydrologic services, although to
differing degrees (24). Vegetation is often thedriving force in ecosystem effects on water,but all elements of an ecosystem, from mi-crobes to megafauna, can and do affect hy-drologic service provision.
Hydrologic services are regional services;downstream users experience the effects ofecosystems throughout their watershed. Be-cause the effects are spread over space, theimpact of land cover may be diffused in largerwatersheds. In Texas, shrub removal provideddramatic water savings in riparian regionswhen measured at the stand scale, but wa-ter savings at the landscape scale were mutedor nonexistent (25). In many cases, ecosystem
www.annualreviews.org • Ecosystem Services 73
Ann
u. R
ev. E
nvir
on. R
esou
rc. 2
007.
32:6
7-98
. Dow
nloa
ded
from
arj
ourn
als.
annu
alre
view
s.or
gby
Pro
f D
iana
Liv
erm
an o
n 12
/30/
07. F
or p
erso
nal u
se o
nly.
ANRV325-EG32-03 ARI 14 September 2007 19:18
Peak flow: themaximum volumeflow rate passing agiven location duringa given period oftime; attributable todirect runoff due to astorm event
Evapotranspiration:the combinedprocesses of directevaporation andtranspiration byplants that transferswater to theatmosphere
effects on sediment yield and flooding aremeasurable only in small catchments and forsmall rainfall events. In Oregon, deforestationcaused increased peak flows in watersheds un-der 100 hectares and for storm flow eventswith less than two-year return intervals butnot in larger basins or for more intense storms(26). Ecosystem effects may either decreaseor increase with basin size depending on theextent and location of different ecosystemswithin the basin and on the frequency, du-ration, and intensity of climatic events (27).Extrapolations of local and short-term effectsof hydrologic services to larger scales maytherefore be flawed. Moreover, many aspectsof hydrologic response are dominated by ex-treme but infrequent events. The ability ofecosystems to mediate hydrologic responseto these extreme events is unclear yet poten-tially important and likely not linearly relatedto the delivery of water services in averageyears.
The bulk of research about ecosystem ef-fects on water supply and water hazard mit-igation comes from studies done in temper-ate ecosystems, although hydrologic responsevaries dramatically with climate, geography,and ecosystem type. In the tropics, for exam-ple, variations in soil type and rainfall patternsresult in ranges of natural sedimentation fromless than 1 up to 65 tons per hectare per year(28). Because of this, researchers increasinglyseek to evaluate hydrologic response in tropi-cal and arid ecosystems in addition to studyingtemperate climates (29).
How should hydrologic services be mea-sured? Ecosystem services can be assessed atdifferent stages of production by measuringgeneration of ecosystem processes, by quanti-fying the magnitude of attributes or interme-diate service levels, or by assessing the amountof final service benefit. At each stage, it is pos-sible to identify multiple baselines and indi-cators. Although ideal metrics will likely varywith context, institutionalizing uniform mea-sures facilitates comparisons among servicesand between places.
Each beneficiary of a hydrologic serviceis likely to describe a different ideal set ofattribute levels—a fisherman wants riffles,whereas a rafter wants white water—but bothcan agree that the quantity, quality, loca-tion, and timing of flow enable their pur-suits. In lieu of assessing every combinationof attributes individually, we focus on the at-tributes of hydrologic services in the followingdiscussion.
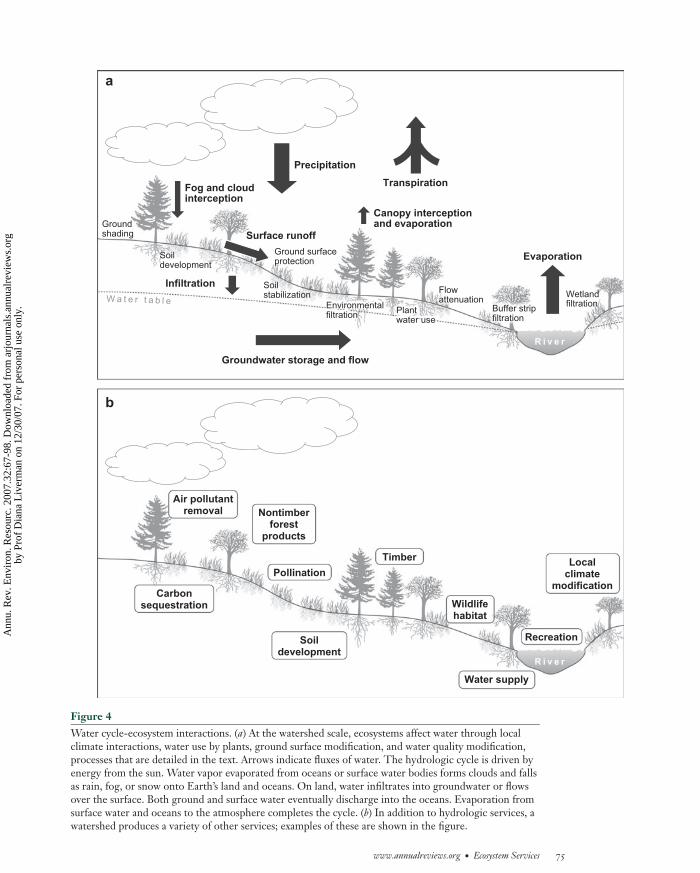
Unlike a provisioning service such as tim-ber, which is produced only in forested ecosys-tems, water will move through and be al-tered by any ecosystem. The importance ofan ecosystem to water provision and reg-ulation is revealed only by considering thebenefits a modified or replacement ecosys-tem would provide. Some of the processes bywhich ecosystems affect hydrologic attributes,discussed below, are illustrated in Figure 4a.
Water Quantity
Quantity is the first attribute of a water ser-vice many people consider; it constitutes theamount of water available for drinking oragriculture or describes the volume of floodwaters. For services such as water supply, anincrease in quantity is beneficial; in flood mit-igation, decreasing quantity is beneficial.
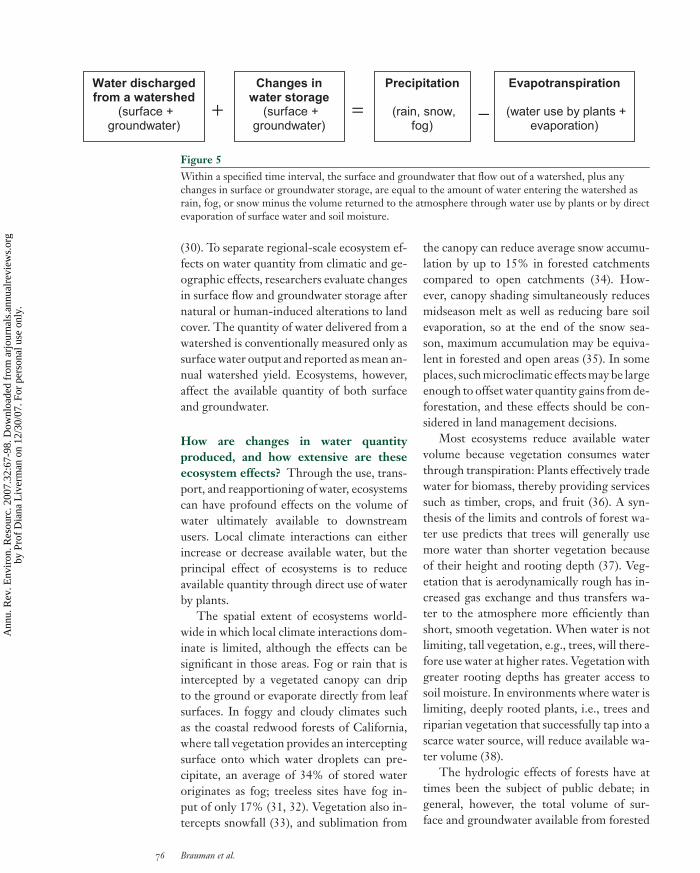
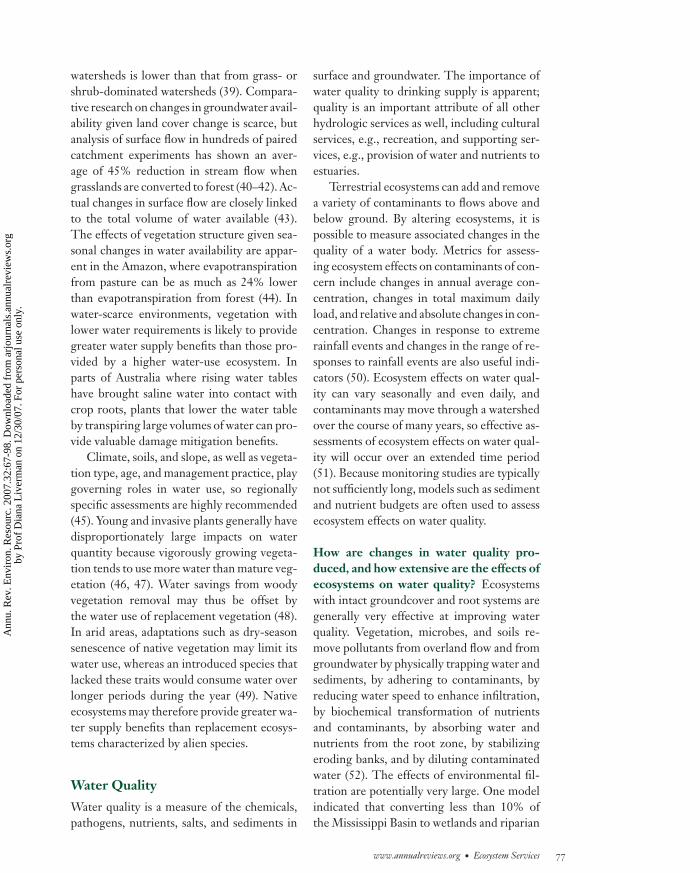
Although an ecosystem itself does not cre-ate water, it does modify the amount of watermoving through the landscape. Users may beconcerned with the volume of water storedin or discharged from a watershed, eitherabove or below ground. In all cases, mass isconserved, and the volume of available watercan be calculated with a water budget model,Figure 5.
Each variable in the water balance inFigure 5 is potentially measurable. Becausemass is conserved, any one variable can becalculated if the others are known. Measure-ment of precipitation is a well-developed fieldof study. Studies assessing individual plants, aswell as models and direct measures of evapo-transpiration, provide data about the volumeof water that is lost directly to the atmosphere
74 Brauman et al.
Ann
u. R
ev. E
nvir
on. R
esou
rc. 2
007.
32:6
7-98
. Dow
nloa
ded
from
arj
ourn
als.
annu
alre
view
s.or
gby
Pro
f D
iana
Liv
erm
an o
n 12
/30/
07. F
or p
erso
nal u
se o
nly.
ANRV325-EG32-03 ARI 14 September 2007 19:18
W a t e r t a b l e
Precipitation
Groundwater storage and flow
Infiltration
Surface runoff
Fog and cloudinterception
Canopy interceptionand evaporation
Plant water use
Soil development
Groundshading
Ground surfaceprotection
Flowattenuation
Environmentalfiltration
Soilstabilization
Buffer strip filtration
Wetlandfiltration
Evaporation
Transpiration
a
Air pollutantremoval
Carbonsequestration
Soildevelopment
Wildlifehabitat
Water supply
Pollination
Recreation
Timber
Nontimberforest
products
Localclimate
modification
b
R i v e r
R i v e r
Figure 4Water cycle-ecosystem interactions. (a) At the watershed scale, ecosystems affect water through localclimate interactions, water use by plants, ground surface modification, and water quality modification,processes that are detailed in the text. Arrows indicate fluxes of water. The hydrologic cycle is driven byenergy from the sun. Water vapor evaporated from oceans or surface water bodies forms clouds and fallsas rain, fog, or snow onto Earth’s land and oceans. On land, water infiltrates into groundwater or flowsover the surface. Both ground and surface water eventually discharge into the oceans. Evaporation fromsurface water and oceans to the atmosphere completes the cycle. (b) In addition to hydrologic services, awatershed produces a variety of other services; examples of these are shown in the figure.
www.annualreviews.org • Ecosystem Services 75
Ann
u. R
ev. E
nvir
on. R
esou
rc. 2
007.
32:6
7-98
. Dow
nloa
ded
from
arj
ourn
als.
annu
alre
view
s.or
gby
Pro
f D
iana
Liv
erm
an o
n 12
/30/
07. F
or p
erso
nal u
se o
nly.
ANRV325-EG32-03 ARI 14 September 2007 19:18
=+ −Water discharged from a watershed
(surface + groundwater)
Changes in water storage
(surface + groundwater)
Precipitation
(rain, snow, fog)
Evapotranspiration
(water use by plants + evaporation)
Figure 5Within a specified time interval, the surface and groundwater that flow out of a watershed, plus anychanges in surface or groundwater storage, are equal to the amount of water entering the watershed asrain, fog, or snow minus the volume returned to the atmosphere through water use by plants or by directevaporation of surface water and soil moisture.
(30). To separate regional-scale ecosystem ef-fects on water quantity from climatic and ge-ographic effects, researchers evaluate changesin surface flow and groundwater storage afternatural or human-induced alterations to landcover. The quantity of water delivered from awatershed is conventionally measured only assurface water output and reported as mean an-nual watershed yield. Ecosystems, however,affect the available quantity of both surfaceand groundwater.
How are changes in water quantityproduced, and how extensive are theseecosystem effects? Through the use, trans-port, and reapportioning of water, ecosystemscan have profound effects on the volume ofwater ultimately available to downstreamusers. Local climate interactions can eitherincrease or decrease available water, but theprincipal effect of ecosystems is to reduceavailable quantity through direct use of waterby plants.
The spatial extent of ecosystems world-wide in which local climate interactions dom-inate is limited, although the effects can besignificant in those areas. Fog or rain that isintercepted by a vegetated canopy can dripto the ground or evaporate directly from leafsurfaces. In foggy and cloudy climates suchas the coastal redwood forests of California,where tall vegetation provides an interceptingsurface onto which water droplets can pre-cipitate, an average of 34% of stored wateroriginates as fog; treeless sites have fog in-put of only 17% (31, 32). Vegetation also in-tercepts snowfall (33), and sublimation from
the canopy can reduce average snow accumu-lation by up to 15% in forested catchmentscompared to open catchments (34). How-ever, canopy shading simultaneously reducesmidseason melt as well as reducing bare soilevaporation, so at the end of the snow sea-son, maximum accumulation may be equiva-lent in forested and open areas (35). In someplaces, such microclimatic effects may be largeenough to offset water quantity gains from de-forestation, and these effects should be con-sidered in land management decisions.
Most ecosystems reduce available watervolume because vegetation consumes waterthrough transpiration: Plants effectively tradewater for biomass, thereby providing servicessuch as timber, crops, and fruit (36). A syn-thesis of the limits and controls of forest wa-ter use predicts that trees will generally usemore water than shorter vegetation becauseof their height and rooting depth (37). Veg-etation that is aerodynamically rough has in-creased gas exchange and thus transfers wa-ter to the atmosphere more efficiently thanshort, smooth vegetation. When water is notlimiting, tall vegetation, e.g., trees, will there-fore use water at higher rates. Vegetation withgreater rooting depths has greater access tosoil moisture. In environments where water islimiting, deeply rooted plants, i.e., trees andriparian vegetation that successfully tap into ascarce water source, will reduce available wa-ter volume (38).
The hydrologic effects of forests have attimes been the subject of public debate; ingeneral, however, the total volume of sur-face and groundwater available from forested
76 Brauman et al.
Ann
u. R
ev. E
nvir
on. R
esou
rc. 2
007.
32:6
7-98
. Dow
nloa
ded
from
arj
ourn
als.
annu
alre
view
s.or
gby
Pro
f D
iana
Liv
erm
an o
n 12
/30/
07. F
or p
erso
nal u
se o
nly.
ANRV325-EG32-03 ARI 14 September 2007 19:18
watersheds is lower than that from grass- orshrub-dominated watersheds (39). Compara-tive research on changes in groundwater avail-ability given land cover change is scarce, butanalysis of surface flow in hundreds of pairedcatchment experiments has shown an aver-age of 45% reduction in stream flow whengrasslands are converted to forest (40–42). Ac-tual changes in surface flow are closely linkedto the total volume of water available (43).The effects of vegetation structure given sea-sonal changes in water availability are appar-ent in the Amazon, where evapotranspirationfrom pasture can be as much as 24% lowerthan evapotranspiration from forest (44). Inwater-scarce environments, vegetation withlower water requirements is likely to providegreater water supply benefits than those pro-vided by a higher water-use ecosystem. Inparts of Australia where rising water tableshave brought saline water into contact withcrop roots, plants that lower the water tableby transpiring large volumes of water can pro-vide valuable damage mitigation benefits.
Climate, soils, and slope, as well as vegeta-tion type, age, and management practice, playgoverning roles in water use, so regionallyspecific assessments are highly recommended(45). Young and invasive plants generally havedisproportionately large impacts on waterquantity because vigorously growing vegeta-tion tends to use more water than mature veg-etation (46, 47). Water savings from woodyvegetation removal may thus be offset bythe water use of replacement vegetation (48).In arid areas, adaptations such as dry-seasonsenescence of native vegetation may limit itswater use, whereas an introduced species thatlacked these traits would consume water overlonger periods during the year (49). Nativeecosystems may therefore provide greater wa-ter supply benefits than replacement ecosys-tems characterized by alien species.
Water Quality
Water quality is a measure of the chemicals,pathogens, nutrients, salts, and sediments in
surface and groundwater. The importance ofwater quality to drinking supply is apparent;quality is an important attribute of all otherhydrologic services as well, including culturalservices, e.g., recreation, and supporting ser-vices, e.g., provision of water and nutrients toestuaries.
Terrestrial ecosystems can add and removea variety of contaminants to flows above andbelow ground. By altering ecosystems, it ispossible to measure associated changes in thequality of a water body. Metrics for assess-ing ecosystem effects on contaminants of con-cern include changes in annual average con-centration, changes in total maximum dailyload, and relative and absolute changes in con-centration. Changes in response to extremerainfall events and changes in the range of re-sponses to rainfall events are also useful indi-cators (50). Ecosystem effects on water qual-ity can vary seasonally and even daily, andcontaminants may move through a watershedover the course of many years, so effective as-sessments of ecosystem effects on water qual-ity will occur over an extended time period(51). Because monitoring studies are typicallynot sufficiently long, models such as sedimentand nutrient budgets are often used to assessecosystem effects on water quality.
How are changes in water quality pro-duced, and how extensive are the effects ofecosystems on water quality? Ecosystemswith intact groundcover and root systems aregenerally very effective at improving waterquality. Vegetation, microbes, and soils re-move pollutants from overland flow and fromgroundwater by physically trapping water andsediments, by adhering to contaminants, byreducing water speed to enhance infiltration,by biochemical transformation of nutrientsand contaminants, by absorbing water andnutrients from the root zone, by stabilizingeroding banks, and by diluting contaminatedwater (52). The effects of environmental fil-tration are potentially very large. One modelindicated that converting less than 10% ofthe Mississippi Basin to wetlands and riparian
www.annualreviews.org • Ecosystem Services 77
Ann
u. R
ev. E
nvir
on. R
esou
rc. 2
007.
32:6
7-98
. Dow
nloa
ded
from
arj
ourn
als.
annu
alre
view
s.or
gby
Pro
f D
iana
Liv
erm
an o
n 12
/30/
07. F
or p
erso
nal u
se o
nly.

ANRV325-EG32-03 ARI 14 September 2007 19:18
Base flow: reliableyear-roundstreamflow, sustainedby groundwater, notattributable to directrunoff
forest would reduce 10% to 40% of the ni-trogen currently creating the hypoxic zone inthe Gulf of Mexico (53).
When water moves unimpeded throughan ecosystem, there is no opportunity for en-vironmental filtration; thus, ecosystems withcharacteristics that prevent gully formation orchannelization are more likely to improve wa-ter quality (54, 55). Roads can also create a di-rect connection through an ecosystem to a wa-ter body. This means that, even in mild rainfallevents, road surfaces can route sediment andother impurities to rivers.
Any heterogeneous strip of vegetation thatforms a barrier to sediments or removes con-taminants from the water stream can be con-sidered a buffer, regardless of its positionwithin a watershed. In semiarid landscapes,patches of vegetation block runoff and sed-iment transport (56). Streamside ecosystemscan also act as buffers, creating time and spacefor filtration processes to occur. In addition,they can help maintain stream configurationsand temperatures that enhance in-stream pro-cessing of pollutants (57). Although reviewsshow substantial variation in the effectivenessof buffers, especially at a landscape scale, itis likely that these vegetated strips can re-duce local nitrate concentrations from crop-land runoff by 5% to 30% per meter widthof buffer (58, 59). Buffer ecosystems can thuspotentially reduce water treatment costs fordownstream users.
Phyto- and bioremediation efforts takeadvantage of the uptake and transformationof contaminants by certain plant roots andthe microbial communities they support (60,61). The macrophytes and microbes thatpromote denitrification and other biochem-ical processes that improve water quality areparticularly abundant in wetlands, which areso reliable at removing suspended solids,phosphorus, and nitrogen from wastewa-ter that they are regularly integrated intotreatment plants (62, 63).
Forests and other mature ecosystems gen-erally improve water quality in a catchment.Root systems stabilize soils (64), and vegeta-
tive cover affects the force and size of rain-drops hitting the ground (65, 66). When thisvegetation is removed, such as by loggingor applying herbicide, bare soils are exposedto surface raindrop splash, runoff, and wind,which can increase erosion substantially. Nu-trients and other impurities built up in ecosys-tems through decomposition, fertilizer appli-cation, or atmospheric deposition can becomeavailable for entrainment in water above andbelow ground (67, 68). Watershed protectionplans are premised on the ability of certainkinds of land cover to either improve wa-ter quality through filtration or maintain itthrough limited addition of contaminants tothe water stream.
Location of Delivery
Water is useful only when users have accessto it, e.g., in downstream diversion ditchesor in wells far from a surface water source,and it is harmful only when it ends up inthe wrong place, inundating crops or homes.Ecosystems affect the location of water aboveand below ground as well as its distributionwithin a watershed (69). Perhaps the most im-portant effect of ecosystems on water locationis on the partitioning of precipitation into sur-face and groundwater. Assessing the percent-age of precipitation that becomes groundwa-ter, or the number of days that surface flowis greater than base flow, may be more infor-mative than measuring bulk recharge. Ecosys-tems also affect the flow of water into and outof streams, lakes, and underground storage;use water; and add and remove contaminantsat specific locations in a watershed. Identify-ing the location of ecosystem effects on wateris a key part of quantity, quality, and timingmeasurements.
How do ecosystems affect the location ofwater, and to what extent? Infiltration isthe process by which surface water becomesgroundwater. By using water, plants create un-saturated space in the soil into which pre-cipitation can infiltrate. In certain geologic
78 Brauman et al.
Ann
u. R
ev. E
nvir
on. R
esou
rc. 2
007.
32:6
7-98
. Dow
nloa
ded
from
arj
ourn
als.
annu
alre
view
s.or
gby
Pro
f D
iana
Liv
erm
an o
n 12
/30/
07. F
or p
erso
nal u
se o
nly.
ANRV325-EG32-03 ARI 14 September 2007 19:18
settings, the depth of water storage space inthe soil is the primary control on runoff (70).Land uses such as logging and grazing reduceinfiltration by compacting soils, and manage-ment choices, particularly road building, canreduce infiltration and increase runoff sub-stantially (71). Reducing infiltration increasesstream yield at the expense of groundwaterstorage and discharge.
In addition to infiltration capacity, vegeta-tion can increase recharge and reduce runoffby increasing the rate at which water movesinto the subsurface. Roots, worms, and in-sects help develop macropores in soil that al-low preferential flow of water to the watertable, beyond the reach of roots, increasinggroundwater recharge. Flora and fauna foundin forests may be more effective at soil de-velopment than the flora and fauna foundin other ecosystems (72). In places with lowrainfall, vegetation can trap water and en-hance infiltration (73). Plants can also redis-tribute water within the soil profile by hy-draulic lift (74). When groundwater storageis important, ecosystems that promote in-filtration can be instrumental in improvingsupply.
Ecosystem effects on the land surface alsoplay a key role in infiltration. Leafy vegeta-tion intercepts rain droplets and, by soften-ing their impact, protects the ground surfacefrom forming an impermeable seal. Leaf litterand roots reduce flow speed, providing greateropportunity for infiltration (75). Althoughstudies are inconclusive, in certain drylandecosystems, even bare-looking patches sup-port biological soil crusts that appear toincrease infiltration (76).
Vegetation can also direct water flow,affecting the location of water within astreambed. Riparian vegetation, for exam-ple, can impede water moving from a riverinto a floodplain and slow its movement backinto the main channel (77). Replacing densestreamside vegetation with low grasses mighttherefore reduce flood damage downstreamby allowing floodwaters to move into thefloodplain.
Timing of Delivery
The attribute of timing describes when wateris available. Precipitation is not spread evenlyover the course of the year in many parts of theworld, and sudden influxes can render much ofthe mean annual runoff from a catchment un-usable or even a hazard. Low flows and floodpeaks affect users and are not adequately de-scribed by average or annual water volumes.Timing also encompasses the predictabilityof flows. Anticipating and managing the sup-ply of hydrologic services requires informa-tion about the duration, seasonality, and pre-dictability of absolute and relative changes inflood peaks and low flows (78). Informationabout seasonal variation in water use and thetime required for a new hydrologic regime tobe established in the wake of land-use alter-ations may also prove useful.
How do ecosystems regulate timing, andto what extent? Flood peaks are producedby surface water moving quickly into streams,reflecting short-term ecosystem response torainfall. Base flow is produced by groundwaterdischarge, so it reflects long-term ecosystemeffects on groundwater availability. The sameecosystem processes affect both, but often indifferent ways.
Water use by plants decreases both floodpeaks and low flows, a phenomenon that is ex-acerbated in high-water-use ecosystems suchas forests (79). Plant water use is usually notuniform through the year; seasonal effectsare influenced by root depth, seasonal growthpatterns, and local climate interactions, e.g.,snowmelt (80, 81). In most cases, absolutechanges in stream flow are greatest in the wetseason, and relative changes are more pro-nounced in the dry season (78). Effects dependon whether rainfall is synchronized with thegrowing season: In two Australian catchmentscharacterized by dormant-season rainfall, af-forestation reduced wet-season flows by only50%, whereas dry-season flows were reducedby up to 100% (82). In this water-scarce area,shrub and grass ecosystems provided greater
www.annualreviews.org • Ecosystem Services 79
Ann
u. R
ev. E
nvir
on. R
esou
rc. 2
007.
32:6
7-98
. Dow
nloa
ded
from
arj
ourn
als.
annu
alre
view
s.or
gby
Pro
f D
iana
Liv
erm
an o
n 12
/30/
07. F
or p
erso
nal u
se o
nly.
ANRV325-EG32-03 ARI 14 September 2007 19:18
Hydroperiod: thecharacteristicseasonal fluctuationsof wet and dryconditions
summertime water supply benefits than thereplacement tree-dominated ecosystem.
Ecosystems such as upland forests and ri-parian buffers promote the transfer of surfacewater to groundwater by infiltration, whichreduces flood peaks while increasing base flow,generally increasing the predictability of wa-ter availability (83). One key supporting ser-vice provided by certain ecosystems may be inmaintaining an area’s hydroperiod, the char-acteristic seasonal fluctuations of wet and dryconditions. A predictable hydroperiod allowsfor the continued supply of services such ashabitat provision for native fish valued byfishermen and migratory birds enjoyed bybird-watchers.
Water use and infiltration processes maybe overwhelmed by the effect of ecosystemson the path that water follows as it moves intoa water body. Vegetation mediates flow pathsby channeling water into ruts and ditches orphysically reducing the speed of overland andsubsurface flow (84). In Oregon, forest har-vesting increased peak flow by an average of50% owing to a combination of changes inwater balance and flow routing (85). Ripar-ian vegetation can play an important role byreducing direct routing to water bodies aswell as by promoting infiltration (86). Flood-plain wetlands also reduce flooding by ab-sorbing and slowing floodwaters. Headwaterwetlands are more unpredictable; althoughwetland vegetation impedes flow, the satu-rated subsurface has no available pore spaceto absorb water and therefore quickens sur-face flow (87). Overall, downstream flood riskis likely to be reduced by maintenance of in-tact forests and upland wetlands.
Trends in Hydrologic ServiceDelivery
How do human activities affect serviceproduction, and how has service produc-tion changed? Humans are altering ecosys-tems and thereby affecting many of the hydro-logic production processes described above(88). For example, agriculture can introduce
pollutants into a water stream that forestsdo not, trees introduced into grasslands canreduce water yield, and timber harvest canreduce infiltration and speed water flow. Ac-cording to the World Resources Institute, in1998 fewer than 20% of the world’s major wa-tersheds had more than 10% of their area pro-tected (89). As the world’s watersheds are in-creasingly developed, the mix of services thatthey provide is likely to change, potentiallyquite dramatically.
A major contribution of the MA was todocument current states and future trendsin ecosystem services (90). Because of geo-graphic variability, however, the actual im-pacts of human activities are often difficultto predict. Models based on generic effects ofland cover on water quantity, quality, location,and timing provide the best guesses aboutchanges in service delivery (91). An ideal in-dicator or suite of indicators of service trendswould reflect this heterogeneity, provide in-formation at multiple scales, incorporate un-certainty about levels and stability of delivery,and acknowledge trade-offs (92).
How does service delivery relate to thecondition of the ecosystem supplying it?Ecosystems affected by different types and in-tensities of human activity provide differentlevels of ecosystem service benefits (93). Ingeneral, effects of land-cover change on hy-drologic processes are not measurable until atleast 20% of a catchment has been converted,although in some places as little as 15% or asmuch as 50% conversion may be needed toobserve these effects (94). Other studies havesuggested that for wetlands to have an impacton water quality they must cover 2%–7% ofa watershed (95). In all cases, the location ofan ecosystem within a watershed will play adetermining role in its effects. Understand-ing how much area—locally, regionally, andglobally—is necessary to sustain a particularlevel of ecosystem service delivery is key toland management decisions.
Service amenability to repair is directlyrelated to the timescales of the ecological
80 Brauman et al.
Ann
u. R
ev. E
nvir
on. R
esou
rc. 2
007.
32:6
7-98
. Dow
nloa
ded
from
arj
ourn
als.
annu
alre
view
s.or
gby
Pro
f D
iana
Liv
erm
an o
n 12
/30/
07. F
or p
erso
nal u
se o
nly.

ANRV325-EG32-03 ARI 14 September 2007 19:18
processes that provide the services. For water-related services, processes such as soil forma-tion or tree growth are slow in relation tohuman time frames, making service provisiondifficult to repair (70). Ecosystem restorationto increase infiltration, for example, is un-likely to be effective in the short term (96).Management and reparability are also func-tions of whether service production respondsto ecosystem change incrementally or catas-trophically (97). Wetlands, for example, cantransition irreparably to new, stable statesthat do not deliver beneficial filtration ser-vices (98). Invasive species can have negative,neutral, or positive effects on service deliv-ery. In South Africa, invasive plant specieshave reduced water yield in some ecosystems(99). Many water-quality improvement func-tions of wetlands, however, are performedequally well by monostands of nonnativespecies (100).
How does production of one service de-pend on production of other services?Ecosystem services are highly interdependentat many levels. Understanding the complextrade-offs among them provides informationabout the ways in which exploiting or dam-aging one service influences the functioningof others. Provision of water quantity, quality,location, and timing; provision of the result-ing hydrologic services; and provision of alltypes of ecosystem services can be synergisticor competitive. For example, clear-cutting theHubbard Brook watershed increased annualstream flow while increasing nutrient and sed-iment concentrations in the runoff (101). Inaddition to increasing net surface water yieldand decreasing water quality, logging a water-shed may speed the rate of stream flow, de-crease average base flow, increase frequencyand size of flood events, and degrade soils.Logging may thereby reduce flood mitigationwhile increasing water supply. The increase inwater quantity may offset an increase in con-taminants by diluting them. The timber thatwas logged in the watershed is another ecosys-
tem commodity; production of this service byplants requires them to use water (102).
Land management decisions often entailtrade-offs among services delivered at differ-ent temporal and spatial scales, which repre-sents an analysis challenge (103). For example,plantation forestry for local timber or globalcarbon sequestration has been shown to re-duce regional water quantity (104, 105). Neg-ative effects of plantation forestry on otherservices may be exacerbated by the use of non-native trees that have high rates of water useor that cannot provide a habitat for speciesthat reduce disease transfer (106, 107). Thereare also potential trade-offs between humanuse of ecosystem services and healthy ecosys-tem function (108). As humans divert waterfor agricultural or municipal use, for exam-ple, freshwater systems may no longer be ableto support fish and other aquatic species (109).
How well can technology substitutefor ecosystem services? Although someecosystem services are partially or wholly re-placeable through technology or substitution,technologies may have lower resilience, cost-effectiveness, suitability, and life span than theecosystem services they replace. For example,New York City calculated over $6 billionin savings from maintaining forests andagricultural buffers in its watersheds insteadof building a filtration plant to ensure waterquality (110). Technological replacementsmay themselves have substantial environmen-tal impacts. Desalination technologies can re-place water supplied through ecosystems, butenergy requirements make this technologyboth expensive and a potentially substantialgenerator of carbon emissions (111).
BENEFICIARIES ANDPRODUCERS
Human Consumption andProduction of Ecosystem Services
We continue our discussion of ecosys-tem services by focusing on human users
www.annualreviews.org • Ecosystem Services 81
Ann
u. R
ev. E
nvir
on. R
esou
rc. 2
007.
32:6
7-98
. Dow
nloa
ded
from
arj
ourn
als.
annu
alre
view
s.or
gby
Pro
f D
iana
Liv
erm
an o
n 12
/30/
07. F
or p
erso
nal u
se o
nly.

ANRV325-EG32-03 ARI 14 September 2007 19:18
and providers, the middle right box inFigure 2.
Who uses and produces ecosystem ser-vices? All people, worldwide, are dependenton ecosystem services for their survival andquality of life. Scenario-building exercisesconnected to the MA indicated that demandfor ecosystem services will increase across allscenarios in almost all categories; between2000 and 2010 alone, global water use is ex-pected to expand by 10% (90). Dependenceis not homogeneous, however. Regionally,North Africa and the Middle East use morethan the available supply of renewable fresh-water, whereas Latin America uses less than4% of its available supply (112). Finer divi-sions show that a higher proportion of peoplein developing than developed countries de-pend directly on local provisioning services(113, 114). However, comparing demand withlocal supply of primary productivity showsthat affluent countries are often net importers;this means they may be less dependent on lo-cal services but consume more ecosystem ser-vices overall than less affluent countries (115).These variations in dependence at differentscales have important equity implications inthe face of changing availability of ecosystemservices.
In addition to using services, people world-wide influence the generation of ecosystemservices, directly and indirectly, through theiractivities. Services are produced by ecosys-tems exhibiting a range of human modifica-tion and thus by a variety of stewards, includ-ing farmers, ranchers, foresters, and managersof nature preserves.
What is the spatial relationship betweenecosystem services supply and consump-tion? As human population densities in-crease, there is often a spatial mismatchbetween the places where humans use ecosys-tem services and the location of ecosystemsthat produce them. Because of this, feed-backs to ensure the continued provision of
services may not exist (116). Moreover, riskof impairment is greatest in areas where landconversion happens most rapidly, often thesame places where people depend most di-rectly on ecosystem services. Some ecosys-tem services are transportable, whereas othersare not. Identification of key ecosystem ser-vice source areas would aid in ensuring con-tinued delivery. The subglobal assessments inthe MA were one approach to visualizing theconnection between ecosystem service supplyand demand. New approaches include iden-tifying parcels for conservation by quantify-ing their provision of highly valued servicesand their proximity to areas of high servicedemand (117, 118).
Are people aware of their productionand consumption of ecosystem services?Awareness of ecosystem services depends onthe type of service, the user, and the spa-tial scale of its delivery. Provisioning services,such as agriculture, timber products, and fish,are widely recognized and may be more highlyvalued than other service types (119). Watersupply services are generally acknowledged,often to the exclusion of the other hydro-logic services provided by a watershed (120).Long-term ecological and social research inMexico has shown that socioeconomic status,including differentiations as subtle as the landtype cultivated by farmers, influences whichservices are acknowledged and the extent towhich they are valued (121). This study alsoindicated that, although beneficiaries may ac-knowledge a wide variety of services, theymight not be aware of the ecosystem processesthat produce them. This is often related tothe spatial scale of service delivery; beneficia-ries recognize and value services at differentscales in different ways (122). Beneficiaries canalso incorrectly attribute services to particularecosystems. Management decisions resultingfrom misperceptions about a forest’s role inregulating water supply, for example, may ac-tually diminish freshwater available to down-stream populations (123).
82 Brauman et al.
Ann
u. R
ev. E
nvir
on. R
esou
rc. 2
007.
32:6
7-98
. Dow
nloa
ded
from
arj
ourn
als.
annu
alre
view
s.or
gby
Pro
f D
iana
Liv
erm
an o
n 12
/30/
07. F
or p
erso
nal u
se o
nly.

ANRV325-EG32-03 ARI 14 September 2007 19:18
VALUATION
Economic, Ecological, and SocialValue of Ecosystem Services
Hydrologic services are just one class of manyservices that provide tremendous benefits topeople. The ecosystem services frameworkpoints the way to quantifying those benefits.In so doing, it provides a way for people to as-sess the impacts and trade-offs of ecosystemchange, even when gains and losses accrueto different beneficiaries at disparate spatialand temporal scales. Monetary valuation, al-though not an end in itself, can be a powerfultool for assessment and policy making becauseit provides a common metric with which tomake comparisons (124). For a review of thehistory, background, and context of environ-mental valuation, see References 125 and 126.Our overview of ecosystem services valuationis structured as a response to the questions inthe lower box in Figure 2.
What components of ecosystem servicesshould be valued? The value of ecosystemscomprises use and nonuse elements. Use val-ues are direct, e.g., the value of water fowlto hunters; indirect, e.g., the value of wet-land nutrient sequestration in reducing eu-trophication and algal blooms downstream;and optional, e.g., the value of ensuring thata resource will be available for future use.Nonuse values are derived from simply know-ing an ecosystem exists, either now, a passiveuse value, or for future generations, a bequestvalue.
One can consider the value of total ser-vice flows from an ecosystem, the value of al-terations to an ecosystem, or the distributionof costs and benefits from ecosystem serviceproduction. While accounting for the sameelements of value, each of these approacheswill provide information that is useful in spe-cific policy contexts and that is not likely to bemeaningful in others (127).
The value of an ecosystem service is, atleast in part, a function of the total produc-
tion of that service. The marginal value of aservice, the amount someone would be will-ing to pay for one additional liter of water, isnot independent of the total value: The valueof that additional liter depends on whetherit is the first or the hundredth liter available.Some early attempts at worldwide ecosystemvaluation have been criticized for aggregatingmarginal into total economic value (128, 129).The marginal price of an ecosystem dependson the magnitude of the assessed change aswell as on the beginning and ending points ofthat change, but it provides no indicators orcorrections for nonlinear ecosystem responseto degradation.
The way services are partitioned affectstheir value. The value of a single service, suchas water supply, can be assessed, as can thevalue of an ecosystem in providing a variety ofservices, such as a forested watershed provid-ing water, timber, and recreation (130). Valua-tions of single services are the most prevalent;whole ecosystem studies and assessments thatintegrate across multiple services are moredifficult and less common (131).
For policy and management decisions, thevalue of service production is often mostmeaningfully understood in comparison toservice production from an alternative landuse (132). Tropical forest conservation in cer-tain areas, for example, may provide net hy-drologic benefits in comparison to annualcropping or grazing, but not in comparison toagroforestry (133). The choice of comparativeland use also affects the economic attractive-ness of ecosystem restoration versus conser-vation or land-use change. Value is also cru-cially dependant on the scale at which servicesare assessed. Locally and globally, forest con-servation in Madagascar was shown to havea higher value than logging, but the oppositewas true at the national scale (134).
The way the future is valued can greatlyaffect how a resource is managed over timeand thereby affect the stock of that ecosys-tem resource at any point in time. In re-cent years, intertemporal valuation and dis-counting methodologies have gone beyond
www.annualreviews.org • Ecosystem Services 83
Ann
u. R
ev. E
nvir
on. R
esou
rc. 2
007.
32:6
7-98
. Dow
nloa
ded
from
arj
ourn
als.
annu
alre
view
s.or
gby
Pro
f D
iana
Liv
erm
an o
n 12
/30/
07. F
or p
erso
nal u
se o
nly.

ANRV325-EG32-03 ARI 14 September 2007 19:18
traditional, constant-rate exponential dis-counting, which tends to severely discountfuture generations in decision making (135,136). Studies indicate that preferences con-cerning future utility are best described by adeclining discount rate (137, 138); declining-rate discounting models are supported on the-oretical grounds as well (139–141). Thesemodels weight the near future at a level similarto conventional exponential schemes but givemuch more value to the mid- to long-term fu-ture. These alternative discounting method-ologies could be especially important whenanalyzing resources that are essentially non-renewable or renewable only on very longtimescales.
What valuation approaches best capturethese components? A variety of ecosystemproducts, such as produce, timber, and fish,are commodities valued in the marketplace.Many other services, however, are publicgoods, that is, nonrival, nonexcludable, andessentially free to any user. Still other services,such as stability, resilience, and reparability,have no easy translation into market value.Because people mostly do not pay for theseecosystem services, and because many peoplecan use them without diminishing their value,there is no direct measure of demand and will-ingness to pay, presenting difficulties in dis-cerning their value (142). Nonmarket meth-ods for determining value include revealedpreference methods such as hedonic pricingand travel cost, stated preference methodssuch as contingent valuation, and avoided costor replacement cost methods (143, 144). Al-though in some cases nonmarket methods arevery effective, in other cases monetary valua-tion of ecosystem services is highly imperfect(145).
Sociocultural value and ecological valueare important aspects of overall ecosystemvalue. Because most ecosystem services aretraditionally public goods, equitable access isoften an important social value. When peoplein distant locations are given an opportunityto express their willingness to pay for differ-
ent ecosystem benefits and trade-offs, how-ever, the values they assign will be weightednot only by their preferences but also by theirincomes. Society may not be interested in val-uation methods that discount some people’sdependence on ecosystem services. New ap-proaches to ecosystem valuation attempt tointegrate economic valuation methods, whichare based on consumer preferences and the ex-change value of services, with ecological valu-ation methods, which are based on the cost ofproduction, and social values (146, 147). Pro-duction function approaches to valuation ex-plicitly incorporate ecosystem processes intoeconomic studies (148). These integrative ap-proaches are more likely to capture the fullvalue of ecosystems in providing services.
How valuable are hydrologic services?Hydrologic services have been recognizedfor some time, and valuation studies offreshwater-related services have been madesince at least 1970 (149, 150). These stud-ies have quantified the value of environmen-tal amenities such as water quality (151, 152).The value of actual ecosystems to the produc-tion of these valued amenities is less clear.
Valuation studies of wetlands and riparianbuffers often use a proxy related to produc-tion of an attribute such as water quality andthen value the incremental impact of changesin that attribute (153). In California, farmerswere assessed to have a net benefit from veg-etated buffer strips; improved water qualityand reduction in soil loss outweighed the costsof land taken out of production (154). Thespatial relationship of an ecosystem to servicebeneficiaries affects its value. A study of flooddamages related to wetland development inFlorida showed wetlands within a floodplainto be very valuable, whereas wetlands outsideof flood-prone areas were not (155).
Attempts have been made to value severalof the hydrologic services produced by wa-tersheds. Models indicate that in some placesthe value of increased groundwater rechargeunder conserved forest is substantial; the netpresent value of one forested watershed in
84 Brauman et al.
Ann
u. R
ev. E
nvir
on. R
esou
rc. 2
007.
32:6
7-98
. Dow
nloa
ded
from
arj
ourn
als.
annu
alre
view
s.or
gby
Pro
f D
iana
Liv
erm
an o
n 12
/30/
07. F
or p
erso
nal u
se o
nly.
ANRV325-EG32-03 ARI 14 September 2007 19:18
Hawai’i was calculated to be between $1.5and $2.5 billion (156). Forests are particularlyvaluable for their effects on the timing of wa-ter for in situ and diverted supply. In China,forested watersheds may improve the func-tionality of existing dams on the Yangtze riverby up to US$600,000 per year. One study inChile calculated that native forest is worthover US$200 per hectare per year because ofits effects on drinking water supply (157, 158).
The generic value of hydrologic servicesis apparent, but the functionality and value ofan ecosystem is likely to be highly variable,so site-specific assessment remains important(159).
POLICY
Tools for Ecosystem ServiceProtection and Management
There is often a vast spatial and economic dis-connect between those who control land useand those who benefit from ecosystem ser-vices, which limits feedback between land useand service delivery. Policy mechanisms cancorrect this, conserving the delivery of de-sired services, but institutional and financiallimitations constrain the mechanisms that canactually be put into place. We address the pol-icy questions listed in the middle left box ofFigure 2.
Which ecosystem services should be prior-itized for protection? If service provision isto be maintained, growing pressures on boththe supply and demand for ecosystem services,such as land-use changes in watersheds cou-pled with increasing human demand for water,must be addressed (160). Implications of ex-ternal drivers, e.g., climate change, must betaken into account as well. In almost all cases,limited resources will require prioritizing cer-tain areas for protection.
There is a wide range of competing cri-teria for prioritizing ecosystem service provi-sion. The best schemes integrate the needsof users with the biophysical constraints of
service production (161). Ecosystems can beprotected or managed to maximize the pro-vision of a single service, maximize output ofa suite of services, maximize diversity of ser-vices, minimize loss of services, or minimizevariability in service provision. The suscepti-bility of ecosystem service delivery to declinein the face of ecosystem change, and ecosys-tem affinity for management and repair, isfurther criteria for prioritization.
Policies can attempt to maximize, dis-tribute, or target value among beneficiaries;equity is often a top priority. Diverse usergroups are able to tolerate different levels ofuncertainty in ecosystem service supply, andthey will place a range of value on increasedcertainty in delivery in addition to valuing theservice itself. Agencies involved in the pro-tection of hydrologic ecosystem services inrural watersheds have emphasized the diffi-culty, as well as the importance, of ascertain-ing the value of ecosystem services to all stake-holder groups at many different scales (162).When users have conflicting service needs, so-cial patterns, including varying organizationalefficiency and political power among groups,are often stronger drivers of outcome than in-creasing total benefit (163).
Trade-offs in the protection of ecosystemsand the production of services are an in-evitable consequence of prioritizing the deliv-ery of certain services and promoting specificmanagement schemes. Ideally, policy makerswill assess trade-offs to the full range of con-sumers over the full suite of services providedby an ecosystem (164). Given the challengesin obtaining this social, biophysical, and val-uation information, good policy mechanismswill also include uncertainty as a criterion.(165)
What are the available policy mecha-nisms for protecting ecosystem services?Broadly, the classes of policy mechanismsavailable to protect ecosystem services aregovernment ownership or control of land,government regulations, government incen-tive payments, and voluntary payments.
www.annualreviews.org • Ecosystem Services 85
Ann
u. R
ev. E
nvir
on. R
esou
rc. 2
007.
32:6
7-98
. Dow
nloa
ded
from
arj
ourn
als.
annu
alre
view
s.or
gby
Pro
f D
iana
Liv
erm
an o
n 12
/30/
07. F
or p
erso
nal u
se o
nly.

ANRV325-EG32-03 ARI 14 September 2007 19:18
PES: payment forecosystem service
Ecosystem servicedistricts:governmentalauthorities dedicatedto the managementand protection ofecosystem services
Voluntary market-based or negotiated pay-ments are attractive because they poten-tially allow conservation to occur outside agovernment-mediated framework and to befinanced with nongovernment money (166).These payments are made in the form ofvoluntary contractual arrangements, transferpayments, marketable permits, tradable de-velopment rights, and certification; fundingmight come from user fees, taxes, or dona-tions. It may be most effective to combineseveral types of payments or to design vol-untary measures to work in tandem with ex-isting nonmarket mechanisms. In each placewhere voluntary payments for ecosystem ser-vices (PESs) are used, policy design must ad-dress who pays, how much, to whom, for what,and for how long (167, 168)
Although voluntary approaches to ecosys-tem services conservation are potentiallymore easily accepted, effective, and flexiblethan regulation, they also have uniquerequirements (169). If beneficiaries are toagree to pay for the delivery of ecosystemservices, they must trust that ecosystems areproducing the contracted services and thatthey will continue to do so. This requires animpartial, trustworthy, transparent institu-tional structure. In addition, understandingbaseline production and ongoing monitoringare required, both of which are likely tobe expensive and time consuming, creatinghigh transaction costs during design andimplementation phases (170).
Markets do not develop spontaneously orpredictably, so market design is importantto effectiveness and equity. Commodifyingecosystem services can be difficult. Even inthe most straightforward cases, a marketablecommodity remains a proxy for all the ecosys-tem processes that provide a service. In manyother cases, it is difficult to determine themost effective proxy because, for example,ecosystem goods are intangible or do not havea clearly identifiable clientele. Competitiontakes time to establish, and start-up and trans-action costs can be very high, so efficiency innew markets is usually low. Because ecosys-
tem services are commonly thought of as pub-lic goods, preserving their equitable distribu-tion may be an important aspect of conserva-tion schemes. Market mechanisms can affectparticipants in unexpected ways, so equity is-sues often influence policy design and level ofpayment (171).
The scale, as well as the spatial and tem-poral congruence, of supply and consumptionof ecosystem services determines the scale atwhich policy will be effective (105). If a lowerbound exists for the area of an ecosystem nec-essary to produce a service, markets mightneed to bundle services at the beneficiary end,provide adjacency bonuses to suppliers, or de-velop existing institutions into structures suchas ecosystem service districts (172). At thesame time, the scale at which management de-cisions are made constrains the ways in whichecosystems can be protected. Landscape-scaleassessments of service production and bene-ficiary needs help investment strategies rein-force one another instead of conflicting or cre-ating perversions in which individual servicevaluation leads to recommendations for oneecosystem to replace another (173).
Some have argued against payment pro-grams on the grounds that scientific knowl-edge is still too weak to ensure the productionand delivery of services, particularly for hy-drologic services, which are characterized byheterogeneous systems, conflicting processes,and high uncertainties (174). The World Bankhas advocated structuring payments in such away that delivery can be monitored after im-plementation and payments adjusted accord-ingly (170). The best policies will develop withflexibility and recognize that as the value sys-tems, institutions, and technology that con-strain management decisions evolve, policychoices are likely to change.
How effective have voluntary mechanismsbeen in protecting ecosystem services? Avariety of mechanisms, public, private, andhybrid, already exist to protect and promoteecosystem services (162, 175). Approachesto hydrologic service protection include
86 Brauman et al.
Ann
u. R
ev. E
nvir
on. R
esou
rc. 2
007.
32:6
7-98
. Dow
nloa
ded
from
arj
ourn
als.
annu
alre
view
s.or
gby
Pro
f D
iana
Liv
erm
an o
n 12
/30/
07. F
or p
erso
nal u
se o
nly.

ANRV325-EG32-03 ARI 14 September 2007 19:18
investments by trust funds and direct pay-ments to landowners. In Quito, Ecuador, atrust identifies and invests in measures such asgovernment acquisition of important water-sheds, local education, and incentives for im-proved agricultural practices. In Costa Rica,landowners are paid a flat rate by the govern-ment for the services supplied by their land(176). These programs have successfully en-rolled many landowners and dispersed a sig-nificant amount of money, although there islittle assurance that services are actually beingproduced.
The effectiveness of PESs varies depend-ing on the payment mechanism as well as onfeatures such as commodities sold, charac-teristics of participants, level of competition,geographical extent of trading, level ofmaturity, and the degree to which markets areembedded in broader institutional contexts.In general, the effectiveness of ecosystem ser-vice policy is difficult to evaluate because thesepolicies usually have multiple goals and thereare many metrics for success. For hydrologicservices, some studies have illustrated a cleareconomic benefit of watershed protection onthe basis of sediment reduction or reliabilityof water yield, but others have indicated thatthe integrated effects of forest protectionon water quantity, quality, location, andtiming on users throughout the watershedmay be neutral or negative (177). One modelcomparing ecofriendly subsidies to directconservation payments indicated that directinvestment in ecosystem protection maybe the most cost-effective mechanism forensuring service provision (178).
The International Institute for Envi-ronment and Development, after reviewingalmost 300 emerging markets for severaldifferent services, found that unintendedconsequences of markets, particularly relatedto equity, were troubling. Additionally, theynoted that many reports on existing ecosystemservice payment schemes tally benefits of ser-vice payment programs without accountingfor costs or comparing this cost-benefit ratioto that of alternative structures such as reg-
ulation (171). In all cases, assessing not onlythe functioning of markets but comparingthem to alternative mechanisms and assessingtheir effects on ecosystems and people will bevery important. Moving forward, transparentaccounting of ecosystem services policy willaid in the design of new policies that are bothmore efficient and more equitable.
ECOSYSTEM SERVICE-BASEDLAND MANAGEMENT INPRACTICE
Existing policy designed to enhance ecosys-tem service provision is limited and imperfect.The following three cases provide both inspi-ration and lessons for future attempts.
Extensive flooding on the Yangtze Riverin 1998 motivated Chinese officials to reduceerosion and improve water retention in up-land watersheds by protecting and replant-ing forests. The Sloping Lands ConversionProgram and the Natural Forest Conserva-tion Program are now two of the world’slargest ecosystem services-based conservationprograms. The Sloping Lands ConversionProgram, also known as Grain-to-Green orFarm-to-Forest, compensates farmers within-kind grain allocations, cash payments, andseedlings to take the most erodible farm-land out of production, replacing crops withtrees. The Natural Forest Conservation Pro-gram protects natural forests and improvesmanagement of natural and plantation forests(179). Assessments of these broad-scale pro-grams to reduce erosion and retain water arelimited. Evaluation is more often based onachievement of target outputs, such as thenumber of hectares planted or removed fromcultivation, than on the provisioning of ser-vices themselves. Existing information indi-cates that, although program guidelines maybe well designed, targeting is often compro-mised by lack of funding for research, imple-mentation, and systematic monitoring (180,181). Both programs have multiple objectives,including poverty alleviation and restructur-ing of local economies, which are not always
www.annualreviews.org • Ecosystem Services 87
Ann
u. R
ev. E
nvir
on. R
esou
rc. 2
007.
32:6
7-98
. Dow
nloa
ded
from
arj
ourn
als.
annu
alre
view
s.or
gby
Pro
f D
iana
Liv
erm
an o
n 12
/30/
07. F
or p
erso
nal u
se o
nly.

ANRV325-EG32-03 ARI 14 September 2007 19:18
compatible with erosion mitigation goals(182).
In South Africa, the Working for WaterProgramme has dual goals of increasing watersupply and employment. Launched in 1995,it is aimed primarily at invasive species man-agement and eradication. Recent reports in-dicate that restored native ecosystems are nowreleasing on the order of 50 million cubic me-ters of additional water each year (183). Theprogram also employs more than 20,000 peo-ple annually and runs a variety of public ed-ucation programs (184). Working for Waterhas perhaps the best basic science, assessment,and monitoring programs of any ecosystemservices project in existence. One conclusionof this research has been that significant gaps
in understanding still exist, despite substan-tial spending, illustrating that well-developedecosystem services projects may be costly(99).
In the United States, the City of Portland’sWatershed Management Program is basingsome of its land management decisions onecosystem services. By allowing flood watersfrom Johnson Creek to move into the flood-plain, the city will benefit not only from re-duced flood damages, but also from the main-tenance and restoration of biodiversity, airquality improvement, water quality improve-ment, and cultural services provided by thefloodplain. Over a 100-year time frame, onestudy calculated a $30 million benefit to thepublic (185).
SUMMARY POINTS
1. All people, worldwide, are dependent on ecosystem services for their survival andquality of life. As the size of the human population increases, demand for ecosystemservices is projected to increase as well. At the same time, the sustainable productionof most services is under threat and, in many places, in decline.
2. Vast geographic, economic, and cultural disconnects between those who control landuse and those who benefit from services produced on that land often limit feedbackbetween land use and service delivery. Policy mechanisms are needed to correct thisand sustain the delivery of desired services.
3. Understanding and managing ecosystem services requires information about the bio-physical nature of services as well as information about their social, economic, andinstitutional dimensions. Although generalizations are possible, the functionality andvalue of an ecosystem is likely to be highly variable, so site-specific assessments willalways be of great importance.
4. The ecosystem services framework makes explicit the complex feedbacks and trade-offs among services and human beneficiaries. Services are produced by ecosystemsexhibiting a wide range of human modification, from intensively managed farmlandto native habitats only lightly touched by humanity. Production of one service maycome at the expense of another, just as consumption of resources by some people andactivities may come at the expense of consumption by others, elsewhere and in thefuture.
5. Much knowledge about ecosystem service production exists in fields historically notdirectly concerned with ecosystem services. Ecosystem services science, policy, andmanagement require synthesis and interpretation of this knowledge.
6. Hydrologic services encompass the benefits to people that are produced by terrestrial-ecosystem effects on freshwater. They can be organized into five broad categories:improvement of extractive water supply, improvement of in-stream water supply, water
88 Brauman et al.
Ann
u. R
ev. E
nvir
on. R
esou
rc. 2
007.
32:6
7-98
. Dow
nloa
ded
from
arj
ourn
als.
annu
alre
view
s.or
gby
Pro
f D
iana
Liv
erm
an o
n 12
/30/
07. F
or p
erso
nal u
se o
nly.
ANRV325-EG32-03 ARI 14 September 2007 19:18
damage mitigation, provision of water-related cultural services, and maintenance ofaquatic habitats that produce services. To translate traditional hydrologic science intoan ecosystem services context, it is useful to focus on four key attributes of each service:quantity, quality, location, and timing of flow.
7. Valuation provides a way for people to assess the impacts and trade-offs of ecosystemchange and illuminates the accrual of gains and losses to different beneficiaries atdisparate spatial and temporal scales. Monetary valuation, although not an end initself, can be a powerful tool for decision making because it organizes informationusing a common metric for making comparisons.
8. Voluntary market-based or negotiated payments are attractive because they potentiallyallow conservation to occur outside a government-mediated framework and to befinanced with nongovernment money. Payment schemes must address who pays, howmuch, to whom, for what, and for how long.
FUTURE ISSUESExisting research on ecosystem services has been extraordinarily productive up to thistime; we hope to have illustrated the outstanding needs for continued and directed re-search on service production, users, value, and policy. Although effective policy willrespond to science, society, and valuation, for ecosystem services protection to be effec-tive, research in those areas must be driven by the needs and constraints of policy.
Information about the magnitude of ecosystem service production is particularlypressing. Even though one can often determine which services an ecosystem produces,the rate or level of service production is typically difficult to quantify, which complicatescomparisons with other land-use options. Policy makers need information about themagnitude of natural service variation as well as how service supply will vary in the faceof human-induced environmental change.
Location and scale of delivery also represent substantial knowledge gaps. Withoutinformation about the places from which people receive services, policy that effectivelyprotects important supply areas will remain elusive. Ecosystem services are inherentlyspatial, so mapping exercises are likely to be important in the assessment of scale and forunderstanding the connections between ecosystem service suppliers and users.
Trade-offs in biophysical production need to be directly assessed. It is importantto understand whether interactions are synergistic or competitive and which processesdominate at different scales. Ecosystem processes occur at a variety of timescales, sotrade-offs may not be immediate. We need biophysical information about how time-lagged services interact and models to assess trade-offs among them. There is limitedinformation on the effective comanagement of services; thus it is unclear to what extenttrade-offs and win-wins actually occur.
Institutional questions abound. The scope and limitations of alternative conserva-tion approaches are uncertain, especially in the international context. We do not yetknow how management plans and investment strategies conflict with or reinforce oneanother. Assessments of the effectiveness of the policy mechanisms that are already inplace are also necessary. New institutional mechanisms to provide for ecosystem service.
www.annualreviews.org • Ecosystem Services 89
Ann
u. R
ev. E
nvir
on. R
esou
rc. 2
007.
32:6
7-98
. Dow
nloa
ded
from
arj
ourn
als.
annu
alre
view
s.or
gby
Pro
f D
iana
Liv
erm
an o
n 12
/30/
07. F
or p
erso
nal u
se o
nly.

ANRV325-EG32-03 ARI 14 September 2007 19:18
delivery will be required as well. Particularly on the landscape scale, we need informationthat will help design conservation and management schemes that are reinforcing.
To effectively conserve and enhance ecosystem services, physical and social sciencemust be expanded and integrated to identify, prioritize, and target ecosystems of concern.This broad area is fertile ground for transformative interdisciplinary work.
DISCLOSURE STATEMENT
The authors are not aware of any biases that might be perceived as affecting the objectivity ofthis review.
ACKNOWLEDGMENTS
For reading early drafts and providing very helpful criticism and insight, we thank StephenCarpenter, David Freyberg, Joshua Goldstein, Steven Gorelick, Venkat Lakshmi, KevanMoffett, Walter Reid, Heather Tallis, Christine Tam, and the editors. We are most grate-ful for financial support from Peter and Helen Bing, Vicki and Roger Sant, and the WinslowFoundation, to the Kamehameha Schools, and for the David and Lucile Packard Founda-tion Stanford Graduate Fellowship and a National Science Foundation Graduate ResearchFellowship to KAB.
LITERATURE CITED1. Millenn. Ecosyst. Assess. 2003. Ecosystems and Human Well-being: Our Human Planet.
Washington, DC: Island2. Balmford A, Bond W. 2005. Trends in the state of nature and their implications for human
well-being. Ecol. Lett. 8:1218–343. Mooney HA, Ehrlich PR. 1997. Ecosystem services: a fragmentary history. See Ref. 13,
pp. 11–194. Bass S. 2006. Environment for the MDGS: An IIED Briefing. London: Int. Inst. Econ. Dev.5. The Katoomba Group. 2004. Ecosystem marketplace. Accessed Jan. 15, 2007. http://
www.ecosystemmarketplace.com6. Carpenter SR, DeFries R, Dietz T, Mooney HA, Polasky S, et al. 2006. Millennium
Ecosystem Assessment: research needs. Science 314:257–587. Feen RH. 1996. Keeping the balance: ancient Greek philosophical concerns with popu-
lation and environment. Popul. Environ. 17:447–4588. Norgaard RB. 1994. Development Betrayed: The End of Progress and a Co-Evolutionary Re-
visioning of the Future. New York: Routledge9. Dearmont D, McCarl BA, Tolman DA. 1998. Costs of water treatment due to diminished
water quality: a case study in Texas. Water Resour. Res. 34:849–5310. Boyd J, Banzhaf S. 2006. What Are Ecosystem Services? The Need for Standardized Accounting
Units. Discuss. Pap. 06–02. Resour. Future, Washington, DC11. Daily GC, Soderqvist T, Aniyar S, Arrow K, Dasgupta P, et al. 2000. The value of nature
and the nature of value. Science 289:395–9612. Falkenmark M, Gottschalk L, Lundqvist J, Wouters P. 2004. Towards integrated catch-
ment management: increasing the dialogue between scientists, policy-makers and stake-holders. Int. J. Water Resour. Dev. 20:297–309
90 Brauman et al.
Ann
u. R
ev. E
nvir
on. R
esou
rc. 2
007.
32:6
7-98
. Dow
nloa
ded
from
arj
ourn
als.
annu
alre
view
s.or
gby
Pro
f D
iana
Liv
erm
an o
n 12
/30/
07. F
or p
erso
nal u
se o
nly.
ANRV325-EG32-03 ARI 14 September 2007 19:18
13. Daily GC, ed. 1997. Nature’s Services: Societal Dependence on Natural Ecosystems.Washington, DC: Island. 392 pp.
14. Eamus D, Macinnis-Ng CMO, Hose GC, Zeppel MJB, Taylor DT, Murray BR. 2005.Ecosystem services: an ecophysiological examination. Aust. J. Bot. 53:1–19
15. Boyd JW, Banzhaf HS. 2005. Ecosystem services and government accountability: theneed for a new way of judging nature’s value. Resources Summer:16–19
16. Postel SL, Daily GC, Ehrlich PR. 1996. Human appropriation of renewable fresh water.Science 271:785–88
17. Oki T, Kanae S. 2006. Global hydrological cycles and world water resources. Science313:1068–72
18. Scheffer M, Holmgren M, Brovkin V, Claussen M. 2005. Synergy between small- andlarge-scale feedbacks of vegetation on the water cycle. Glob. Change Biol. 11:1003–12
19. Rodriguez-Iturbe I. 2000. Ecohydrology: a hydrologic perspective of climate-soil-vegetation dynamics. Water Resour. Res. 36:3–9
20. Moorcroft PR. 2003. Recent advances in ecosystem-atmosphere interactions: an ecolog-ical perspective. Proc. R. Soc. Biol. Sci. 270:1215–27
21. Betts AK, Ball JH, Beljaars ACM, Miller MJ, Viterbo PA. 1996. The land surface-atmosphere interaction: a review based on observational and global modeling perspec-tives. J. Geophys Res. Atmos. 101:7209–25
22. Gordon LJ, Steffen W, Jonsson BF, Folke C, Falkenmark M, Johannessen A. 2005.Human modification of global water vapor flows from the land surface. Proc Natl. Acad.Sci. USA 102:7612–17
23. Feddema JJ. 2005. The importance of land-cover change in simulating future climates.Science 310:1674–78
24. Allan JD. 2004. Landscapes and riverscapes: the influence of land use on stream ecosys-tems. Annu. Rev. Ecol. Evol. Syst. 35:257–84
25. Wilcox BP, Owens MK, Dugas WA, Ueckert DN, Hart CR. 2006. Shrubs, streamflow,and the paradox of scale. Hydrol. Process. 20:3245–59
26. Thomas RB, Megahan WF. 1998. Peak flow responses to clear-cutting and roads insmall and large basins, western Cascades, Oregon: a second opinion. Water Resour. Res.34:3393–403
27. Birkinshaw SJ, Bathurst JC. 2006. Model study of the relationship between sedimentyield and river basin area. Earth Surf. Process. Landf. 31:750–61
28. Bruijnzeel LA. 2004. Hydrological functions of tropical forests: not seeing the soil forthe trees? Agric. Ecosyst. Environ. 104:185–228
29. Newman BD, Wilcox BP, Archer SR, Breshears DD, Dahm CN, et al. 2006. Ecohydrol-ogy of water-limited environments: a scientific vision. Water Resour. Res. 42:W06302
30. Wullschleger SD, Meinzer FC, Vertessy RA. 1998. A review of whole-plant water usestudies in trees. Tree Physiol. 18:499–512
31. Dawson TE. 1998. Fog in the California redwood forest: ecosystem inputs and use byplants. Oecologia 117:476–85
32. Ingraham NL, Matthews RA. 1995. The importance of fog-drip water to vegetation:Point-Reyes Peninsula, California. J. Hydrol. 164:269–85
33. Storck P, Lettenmaier DP, Bolton SM. 2002. Measurement of snow interception andcanopy effects on snow accumulation and melt in a mountainous maritime climate,Oregon, United States. Water Resour. Res. 38:1223
34. Gelfan AN, Pomeroy JW, Kuchment LS. 2004. Modeling forest cover influences on snowaccumulation, sublimation, and melt. J. Hydrometeorol. 5:785–803
www.annualreviews.org • Ecosystem Services 91
Ann
u. R
ev. E
nvir
on. R
esou
rc. 2
007.
32:6
7-98
. Dow
nloa
ded
from
arj
ourn
als.
annu
alre
view
s.or
gby
Pro
f D
iana
Liv
erm
an o
n 12
/30/
07. F
or p
erso
nal u
se o
nly.

ANRV325-EG32-03 ARI 14 September 2007 19:18
35. Koivusalo H, Kokkonen T. 2002. Snow processes in a forest clearing and in a coniferousforest. J. Hydrol. 262:145–64
36. Falkenmark M. 2000. Competing freshwater and ecological services in the river basinperspective: an expanded conceptual framework. Water Int. 25:172–77
37. Calder IR. 1998. Water use by forests, limits and controls. Tree Physiol. 18:625–3138. Scott RL, Shuttleworth WJ, Goodrich DC, Maddock T. 2000. The water use of two
dominant vegetation communities in a semiarid riparian ecosystem. Agric. Forest Meteorol.105:241–56
39. Andreassian V. 2004. Waters and forests: from historical controversy to scientific debate.J. Hydrol. 291:1–27
40. Bosch JM, Hewlett JD. 1982. A review of catchment experiments to determine the effectof vegetation changes on water yield and evapo-transpiration. J. Hydrol. 55:3–23
41. Farley KA, Jobbagy EG, Jackson RB. 2005. Effects of afforestation on water yield: a globalsynthesis with implications for policy. Glob. Change Biol. 11:1565–76
42. Sahin V, Hall MJ. 1996. The effects of afforestation and deforestation on water yields. J.Hydrol. 178:293–309
43. Zhang L, Dawes WR, Walker GR. 2001. Response of mean annual evapotranspirationto vegetation changes at catchment scale. Water Resour. Res. 37:701–8
44. von Randow C, Manzi AO, Kruijt B, de Oliveira PJ, Zanchi FB, et al. 2004. Comparativemeasurements and seasonal variations in energy and carbon exchange over forest andpasture in South West Amazonia. Theor. Appl. Climatol. 78:5–26
45. Sandstrom K. 1998. Can forests “provide” water: widespread myth or scientific reality?Ambio 27:132–38
46. Vertessy RA, Watson FGR, O’Sullivan SK. 2001. Factors determining relations betweenstand age and catchment water balance in mountain ash forests. Forest Ecol. Manag.143:13–26
47. Irvine J, Law BE, Kurpius MR, Anthoni PM, Moore D, Schwarz PA. 2004. Age-relatedchanges in ecosystem structure and function and effects on water and carbon exchangein ponderosa pine. Tree Physiol. 24:753–63
48. Giambelluca TW. 2002. Hydrology of altered tropical forest. Hydrol. Process. 16:1665–6949. Calder IR, Dye P. 2001. Hydrological impacts of invasive alien plants. Land Use Water
Resour. Res. 1:1–1250. Viaud V, Merot P, Baudry J. 2004. Hydrochemical buffer assessment in agricultural
landscapes: from local to catchment scale. Environ. Manag. 34:559–7351. Kirchner JW, Feng XH, Neal C. 2000. Fractal stream chemistry and its implications for
contaminant transport in catchments. Nature 403:524–2752. Naiman RJ, Decamps H. 1997. The ecology of interfaces: riparian zones. Annu. Rev. Ecol.
Syst. 28:621–5853. Mitsch WJ, Day JW, Gilliam JW, Groffman PM, Hey DL, et al. 2001. Reducing nitrogen
loading to the Gulf of Mexico from the Mississippi River Basin: strategies to counter apersistent ecological problem. BioScience 51:373–88
54. Worrall F, Swank WT, Burt TP. 2003. Changes in stream nitrate concentrations dueto land management practices, ecological succession, and climate: developing a systemsapproach to integrated catchment response. Water Resour. Res. 39:1177
55. Croke JC, Hairsine PB. 2006. Sediment delivery in managed forests: a review. Environ.Rev. 14:59–87
56. Reid KD, Wilcox BP, Breshears DD, MacDonald L. 1999. Runoff and erosion in apinon-juniper woodland: Influence of vegetation patches. Soil Sci. Soc. Am. J. 63:1869–79
92 Brauman et al.
Ann
u. R
ev. E
nvir
on. R
esou
rc. 2
007.
32:6
7-98
. Dow
nloa
ded
from
arj
ourn
als.
annu
alre
view
s.or
gby
Pro
f D
iana
Liv
erm
an o
n 12
/30/
07. F
or p
erso
nal u
se o
nly.

ANRV325-EG32-03 ARI 14 September 2007 19:18
57. Sweeney BW, Bott TL, Jackson JK, Kaplan LA, Newbold JD, et al. 2004. Ripariandeforestation, stream narrowing, and loss of stream ecosystem services. Proc. Natl. Acad.Sci. USA 101:14132–37
58. Dosskey MG. 2001. Toward quantifying water pollution abatement in response to in-stalling buffers on crop land. Environ. Manag. 28:577–98
59. Sabater S, Butturini A, Clement JC, Burt T, Dowrick D, et al. 2003. Nitrogen removalby riparian buffers along a European climatic gradient: patterns and factors of variation.Ecosystems 6:20–30
60. Kvesitadze G, Khatisashvili G, Sadunishvili T, Ramsden JJ. 2006. Biochemical Mechanismsof Detoxification in Higher Plants: Basis of Phytoremediation. New York: Springer
61. Anderson TA, Guthrie EA, Walton BT. 1993. Bioremediation in the rhizosphere. Environ.Sci. Technol. 27:2630–36
62. Brix H. 1994. Use of constructed wetlands in water-pollution control: historical devel-opment, present status, and future perspectives. Water Sci. Technol. 30:209–23
63. Sundaravadivel M, Vigneswaran S. 2001. Constructed wetlands for wastewater treatment.Crit. Rev. Environ. Sci. Technol. 31:351–409
64. Gyssels G, Poesen J, Bochet E, Li Y. 2005. Impact of plant roots on the resistance of soilsto erosion by water: a review. Prog. Phys. Geogr. 29:189–217
65. Hall RL, Calder IR. 1993. Drop size modification by forest canopies: measurements usinga disdrometer. J. Geophys. Res. Atmos. 98:18465–70
66. Keim RF, Skaugset AE. 2003. Modeling effects of forest canopies on slope stability.Hydrol. Process. 17:1457–67
67. Carpenter SR, Caraco NF, Correll DL, Howarth RW, Sharpley AN, Smith VH. 1998.Nonpoint pollution of surface waters with phosphorus and nitrogen. Ecol. Appl. 8:559–68
68. Aber JD, Goodale CL, Ollinger SV, Smith ML, Magill AH, et al. 2003. Is nitrogendeposition altering the nitrogen status of northeastern forests? BioScience 53:375–89
69. Ward JV. 1989. The 4-dimensional nature of lotic ecosystems. J. North Am. Benthol. Soc.8:2–8
70. Chandler DG. 2006. Reversibility of forest conversion impacts on water budgets in trop-ical karst terrain. Forest Ecol. Manag. 224:95–103
71. La Marche JL, Lettenmaier DP. 2001. Effects of forest roads on flood flows in theDeschutes River, Washington. Earth Surf. Process. Landf. 26:115–34
72. Le Maitre DC, Scott DF, Colvin C. 1999. A review of information on interactions betweenvegetation and groundwater. Water South Africa 25:137–52
73. Ludwig JA, Wilcox BP, Breshears DD, Tongway DJ, Imeson AC. 2005. Vegetationpatches and runoff-erosion as interacting ecohydrological processes in semiarid land-scapes. Ecology 86:288–97
74. Caldwell MM, Dawson TE, Richards JH. 1998. Hydraulic lift: consequences of waterefflux from the roots of plants. Oecologia 113:151–61
75. Wilcox BP, Breshears DD, Turin HJ. 2003. Hydraulic conductivity in a pinon-juniperwoodland: Influence of vegetation. Soil Sci. Soc. Am. J. 67:1243–49
76. Belnap J. 2006. The potential roles of biological soil crusts in dryland hydrologic cycles.Hydrol. Process. 20:3159–78
77. Tabacchi E, Lambs L, Guilloy H, Planty-Tabacchi AM, Muller E, Decamps H. 2000.Impacts of riparian vegetation on hydrological processes. Hydrol. Process. 14:2959–76
78. Jones JA, Post DA. 2004. Seasonal and successional streamflow response to forest cuttingand regrowth in the northwest and eastern United States. Water Resour. Res. 40:W05203
www.annualreviews.org • Ecosystem Services 93
Ann
u. R
ev. E
nvir
on. R
esou
rc. 2
007.
32:6
7-98
. Dow
nloa
ded
from
arj
ourn
als.
annu
alre
view
s.or
gby
Pro
f D
iana
Liv
erm
an o
n 12
/30/
07. F
or p
erso
nal u
se o
nly.

ANRV325-EG32-03 ARI 14 September 2007 19:18
79. Sikka AK, Samra JS, Sharda VN, Samraj P, Lakshmanan V. 2003. Low flow and high flowresponses to converting natural grassland into bluegum (Eucalyptus globulus) in Nilgiriswatersheds of South India. J. Hydrol. 270:12–26
80. Bond BJ, Jones JA, Moore G, Phillips N, Post D, McDonnell JJ. 2002. The zone ofvegetation influence on baseflow revealed by diel patterns of streamflow and vegetationwater use in a headwater basin. Hydrol. Process. 16:1671–77
81. Peel MC, McMahon TA, Finlayson BL, Watson FGR. 2002. Implications of the rela-tionship between catchment vegetation type and the variability of annual runoff. Hydrol.Process. 16:2995–3002
82. Brown AE, Zhang L, McMahon TA, Western AW, Vertessy RA. 2005. A review of pairedcatchment studies for determining changes in water yield resulting from alterations invegetation. J. Hydrol. 310:28–61
83. Smakhtin VU. 2001. Low flow hydrology: a review. J. Hydrol. 240:147–8684. Guillemette F, Plamondon AP, Prevost M, Levesque D. 2005. Rainfall generated storm-
flow response to clearcutting a boreal forest: peak flow comparison with 50 world-widebasin studies. J. Hydrol. 302:137–53
85. Jones JA, Grant GE. 1996. Peak flow responses to clear-cutting and roads in small andlarge basins, western Cascades, Oregon. Water Resour. Res. 32:959–74
86. Darby SE. 1999. Effect of riparian vegetation on flow resistance and flood potential. J.Hydraul. Eng. 125:443–54
87. Bullock A, Acreman M. 2003. The role of wetlands in the hydrological cycle. Hydrol.Earth System Sci. 7:358–89
88. H. John Heinz III Cent. Sci. Econ. Environ., ed. 2002. The State of the Nation’s Ecosystems:Measuring the Lands, Waters, and Living Resources of the United States. New York: CambridgeUniv. Press
89. Revenga C, Murray S, Abramovitz J, Hammond A. 1998. Watersheds of the World: EcologicalValue and Vulnerability, Washington, DC: World Resour. Inst./Worldwatch Inst.
90. Millenn. Ecosyst. Assess., ed. 2005. Ecosystems and Human Well-Being: Current State andTrends. Vol. 1. Washington, DC: Island
91. Alcamo J, van Vuuren D, Ringler C, Cramer W, Masui T, et al. 2005. Changes in nature’sbalance sheet: model-based estimates of future worldwide ecosystem services. Ecol. Soc.10:e19. http://www.ecologyandsociety.org/vol10/iss2/art19
92. Meyerson LA, Baron J, Melillo JM, Naiman RJ, O’Malley RI, et al. 2005. Aggregatemeasures of ecosystem services: Can we take the pulse of nature? Front. Ecol. Environ.3:56–59
93. Kremen C. 2005. Managing ecosystem services: What do we need to know about theirecology? Ecol. Lett. 8:468–79
94. Stednick JD. 1996. Monitoring the effects of timber harvest on annual water yield.J. Hydrol. 176:79–95
95. Verhoeven JTA, Arheimer B, Yin CQ, Hefting MM. 2006. Regional and global concernsover wetlands and water quality. Trends Ecol. Evol. 21:96–103
96. Zimmermann B, Elsenbeer H, De Moraes JM. 2006. The influence of land-use changes onsoil hydraulic properties: implications for runoff generation. Forest Ecol. Manag. 222:29–38
97. Scheffer M, Carpenter S, Foley JA, Folke C, Walker B. 2001. Catastrophic shifts inecosystems. Nature 413:591–96
98. Zedler JB, Kercher S. 2005. Wetland resources: status, trends, ecosystem services, andrestorability. Annu. Rev. Environ. Resour. 30:39–74
94 Brauman et al.
Ann
u. R
ev. E
nvir
on. R
esou
rc. 2
007.
32:6
7-98
. Dow
nloa
ded
from
arj
ourn
als.
annu
alre
view
s.or
gby
Pro
f D
iana
Liv
erm
an o
n 12
/30/
07. F
or p
erso
nal u
se o
nly.
ANRV325-EG32-03 ARI 14 September 2007 19:18
99. Gorgens AHM, van Wilgen BW. 2004. Invasive alien plants and water resources inSouth Africa: current understanding, predictive ability and research challenges. S. Afr. J.Sci. 100:27–33
100. Hansson LA, Bronmark C, Nilsson PA, Abjornsson K. 2005. Conflicting demands onwetland ecosystem services: nutrient retention, biodiversity or both? Freshw. Biol. 50:705–14
101. Likens GE, Bormann FH, Johnson NM, Fisher DW, Pierce RS. 1970. Effects of for-est cutting and herbicide treatment on nutrient budgets in Hubbard Brook watershed-ecosystem. Ecol. Monogr. 40:23–47
102. Falkenmark M, Rockstrom J. 2006. The new blue and green water paradigm: Breakingnew ground for water resources planning and management. J. Water Resour. Plan. Manag.132:129–32
103. Rodriguez JP, Beard TD Jr, Bennett EM, Cumming GS, Cork SJ, et al. 2006.Trade-offs across space, time, and ecosystem services. Ecol. Soc. 11:e28. http://www.ecologyandsociety.org/vol11/iss1/art28
104. Jackson RB, Jobbagy EG, Avissar R, Roy SB, Barrett DJ, et al. 2005. Trading water forcarbon with biological sequestration. Science 310:1944–47
105. Foley JA, DeFries R, Asner GP, Barford C, Bonan G, et al. 2005. Global consequencesof land use. Science 309:570–74
106. Richardson DM. 1998. Forestry trees as invasive aliens. Conserv. Biol. 12:18–26107. LoGiudice K, Ostfeld RS, Schmidt KA, Keesing F. 2003. The ecology of infectious
disease: effects of host diversity and community composition on Lyme disease risk. Proc.Natl. Acad. Sci. USA 100:567–71
108. DeFries RS, Foley JA, Asner GP. 2004. Land-use choices: balancing human needs andecosystem function. Front. Ecol. Environ. 2:249–57
109. Baron JS, Poff NL, Angermeier PL, Dahm CN, Gleick PH, et al. 2002. Meeting eco-logical and societal needs for freshwater. Ecol. Appl. 12:1247–60
110. Natl. Res. Counc. 2000. Watershed Management for Potable Water Supply: Assessing the NewYork City Strategy. Washington, DC: Natl. Acad.
111. Gleick PH, Cooley H. 2006. The World’s Water 2006–2007: The Biennial Report on Fresh-water Resources. Washington, DC: Island. 388 pp.
112. Vorosmarty CJ, Leveque C, Revenga C. 2005. Fresh water. See Ref. 90, pp. 165–207113. Dasgupta P. 1998. The economics of poverty in poor countries. Scand. J. Econ. 100:41–68114. Gadgil M, Guha R. 1995. Ecology and Equity: The Use and Abuse of Nature in Contemporary
India. London, UK: Routledge. 213 pp.115. Imhoff ML, Bounoua L, Ricketts T, Loucks C, Harriss R, Lawrence WT. 2004. Global
patterns in human consumption of net primary production. Nature 429:870–73116. Levin S. 1999. Fragile Dominion: Complexity and the Commons. Reading, MA: Perseus117. Chan KMA, Shaw MR, Cameron DR, Underwood EC, Daily GC. 2006. Conservation
planning for ecosystem services. PLoS Biol. 4:e379118. Naidoo R, Ricketts TH. 2006. Mapping the economic costs and benefits of conservation.
PLoS Biol. 4:e360119. Vitousek PM, Ehrlich PR, Ehrlich AH, Matson PA. 1986. Human appropriation of the
products of photosynthesis. BioScience 36:368–73120. Postel SL. 2003. Securing water for people, crops, and ecosystems: new mindset and new
priorities. Nat. Resour. Forum 27:89–98121. Maass JM, Balvanera P, Castillo A, Daily GC, Mooney HA, et al. 2005. Ecosystem
services of tropical dry forests: insights from long-term ecological and social research
www.annualreviews.org • Ecosystem Services 95
Ann
u. R
ev. E
nvir
on. R
esou
rc. 2
007.
32:6
7-98
. Dow
nloa
ded
from
arj
ourn
als.
annu
alre
view
s.or
gby
Pro
f D
iana
Liv
erm
an o
n 12
/30/
07. F
or p
erso
nal u
se o
nly.
ANRV325-EG32-03 ARI 14 September 2007 19:18
on the Pacific Coast of Mexico. Ecol. Soc. 10:e17. http://www.ecologyandsociety.org/vol10/iss1/art17
122. Hein L, van Koppen K, de Groot RS, van Ierland EC. 2006. Spatial scales, stakeholdersand the valuation of ecosystem services. Ecol. Econ. 57:209–28
123. Calder IR. 2004. Forests and water—closing the gap between public and science percep-tions. Water Sci. Technol. 49:39–53
124. Heal G. 2000. Nature and the Marketplace: Capturing the Value of Ecosystem Services.Washington, DC: Island. 203 pp.
125. Krutilla JV. 1967. Conservation reconsidered. Am. Econ. Rev. 57:777–86126. Farber SC, Costanza R, Wilson MA. 2002. Economic and ecological concepts for valuing
ecosystem services. Ecol. Econ. 41:375–92127. Pagiola S, von Ritter K, Bishop J. 2004. Assessing the economic value of ecosystem conservation.
Environ. Dep. Pap. 101. World Bank Environ. Dep., Washington, DC128. Costanza R, d’Arge R, Groot Rd, Farber S, Grasso M, et al. 1997. The value of the world’s
ecosystem services and natural capital. Nature 387:253–60129. Turner RK. 1998. Ecosystem services value, research needs, and policy relevance: a com-
mentary. Ecol. Econ. 25:61–65130. Bockstael NE, Freeman AM, Kopp RJ, Portney PR, Smith VK. 2000. On measuring
economic values for nature. Environ. Sci. Technol. 34:1384–89131. Turner RK, Paavola J, Cooper P, Farber S, Jessamy V, Georgiou S. 2003. Valuing nature:
lessons learned and future research directions. Ecol. Econ. 46:493–510132. Limburg KE, O’Neill RV, Costanza R, Farber S. 2002. Complex systems and valuation.
Ecol. Econ. 41:409–20133. Chomitz KM, Kumari K. 1998. The domestic benefits of tropical forests: a critical review.
World Bank Res. Obs. 13:13–35134. Kremen C, Niles JO, Dalton MG, Daily GC, Ehrlich PR, et al. 2000. Economic incentives
for rain forest conservation across scales. Science 288:1828–32135. Heal G. 1998. Valuing the Future. New York: Columbia Univ. Press. 226 pp.136. Pearce D, Groom B, Hepburn C, Koundouri P. 2003. Valuing the future: recent advances
in social discounting. World Econ. 4:121–41137. Cairns J, van der Pol M. 2000. Valuing future private and social benefits: the discounted
utility model versus hyperbolic discounting models. J. Econ. Psychol. 21:191–205138. Loewenstein G, Prelec D. 1992. Anomalies in intertemporal choice: evidence and inter-
pretation. In Choice Over Time. New York: Russell Sage Found.139. Azfar O. 1999. Rationalizing hyperbolic discounting. J. Econ. Behavior Organ. 38:245–52140. Harvey CM. 1995. Proportional discounting of future costs and benefits. Math. Oper. Res.
20:381–99141. Newell RG, Pizer WA. 2003. Discounting the distant future: How much do uncertain
rates increase valuations? J. Environ. Econ. Manag. 46:52–71142. Heal G. 2000. Valuing ecosystem services. Ecosystems 3:24–30143. Freeman AM III. 2003. The Measurement of Environmental and Resource Values: Theory and
Methods. Washington, DC: Resour. Future. 496 pp. 2nd ed.144. Smith VK. 1993. Nonmarket valuation of environmental resources: an interpretive ap-
praisal. Land Econ. 69:219–53145. Natl. Res. Counc. 2004. Valuing Ecosystem Services: Towards Better Environmental Decision
Making. Washington, DC: Natl. Acad.146. de Groot RS, Wilson MA, Boumans RMJ. 2002. A typology for the classification, de-
scription and valuation of ecosystem functions, goods and services. Ecol. Econ. 41:393–408
96 Brauman et al.
Ann
u. R
ev. E
nvir
on. R
esou
rc. 2
007.
32:6
7-98
. Dow
nloa
ded
from
arj
ourn
als.
annu
alre
view
s.or
gby
Pro
f D
iana
Liv
erm
an o
n 12
/30/
07. F
or p
erso
nal u
se o
nly.

ANRV325-EG32-03 ARI 14 September 2007 19:18
147. Straton A. 2006. A complex systems approach to the value of ecological resources. Ecol.Econ. 56:402–11
148. Barbier EB. 2007. Valuing ecosystem services as productive inputs. Econ. Policy 49:178–229
149. Wilson MA, Carpenter SR. 1999. Economic valuation of freshwater ecosystem servicesin the United States: 1971–1997. Ecol. Appl. 9:772–83
150. Echavarria M. 2000. Valuation of Water-Related Services to Downstream Users in Rural Wa-tersheds: Determining Values for the Use and Protection of Water Resources. Rome, Italy: UNFood Agric. Organ. (UN FAO)
151. Leggett CG, Bockstael NE. 2000. Evidence of the effects of water quality on residentialland prices. J. Environ. Econ. Manag. 39:121–44
152. Carson RT, Mitchell RC, Hanemann M, Kopp RJ, Presser S, Ruud PA. 2003. Contingentvaluation and lost passive use: damages from the Exxon Valdez oil spill. Environ. Resour.Econ. 25:257–86
153. Pattanayak SK. 2004. Valuing watershed services: concepts and empirics from SoutheastAsia. Agric. Ecosyst. Environ. 104:171–84
154. Rein FA. 1999. An economic analysis of vegetative buffer strip implementation—casestudy: Elkhorn Slough, Monterey Bay, California. Coast. Manag. 27:377–90
155. Brody WEHSD. 2006. Price of permits: measuring the economic impacts of wetlanddevelopment on flood damages in Florida. Natural Hazards Rev. 7:123–30
156. Kaiser B, Roumasset J. 2002. Valuing indirect ecosystem services: the case of tropicalwatersheds. Environ. Dev. Econ. 7:701–14
157. Guo ZW, Xiao XM, Li DM. 2000. An assessment of ecosystem services: water flowregulation and hydroelectric power production. Ecol. Appl. 10:925–36
158. Nunez D, Nahuelhual L, Oyarzun C. 2006. Forests and water: the value of native tem-perate forests in supplying water for human consumption. Ecol. Econ. 58:606–16
159. Woodward RT, Wui YS. 2001. The economic value of wetland services: a meta-analysis.Ecol. Econ. 37:257–70
160. Jackson RB, Carpenter SR, Dahm CN, McKnight DM, Naiman RJ, et al. 2001. Waterin a changing world. Ecol. Appl. 11:1027–45
161. Murray BR, Hose GC, Eamus D, Licari D. 2006. Valuation of groundwater-dependentecosystems: a functional methodology incorporating ecosystem services. Aust. J. Bot.54:221–29
162. UN Food Agric. Organ. (UN FAO). 2002. Land-water linkages in rural watersheds:proceedings of the electronic workshop. FAO Land Water Bull. 9:1–78
163. Scheffer M, Brock W, Westley F. 2000. Socioeconomic mechanisms preventing optimumuse of ecosystem services: an interdisciplinary theoretical analysis. Ecosystems 3:451–71
164. Brismar A. 2002. River systems as providers of goods and services: a basis for comparingdesired and undesired effects of large dam projects. Environ. Manag. 29:598–609
165. Falkenmark M. 2004. Towards integrated catchment management: opening the paradigmlocks between hydrology, ecology and policy-making. Int. J. Water Resour. Dev. 20:275–81
166. Salzman J. 2005. Creating markets for ecosystem services: notes from the field. N. Y.Univ. Law Rev. 80:870–961
167. UN Food Agric. Organ. (UN FAO). 2004. Electronic forum on payment schemes forenvironmental services in watersheds. UN FAO/Lat. Am. Netw. Tech. Coop. WatershedManag. (REDLACH), Rep., Santiago. http://www.rlc.fao.org/foro/psa/pdf/report.pdf
168. Pagiola S, Agostini P, Gobbi J, de Haan C, Ibrahim M, et al. 2005. Paying for biodiversityconservation services: experience in Colombia, Costa Rica, and Nicaragua. Mountain Res.Dev. 25:206–11
www.annualreviews.org • Ecosystem Services 97
Ann
u. R
ev. E
nvir
on. R
esou
rc. 2
007.
32:6
7-98
. Dow
nloa
ded
from
arj
ourn
als.
annu
alre
view
s.or
gby
Pro
f D
iana
Liv
erm
an o
n 12
/30/
07. F
or p
erso
nal u
se o
nly.
ANRV325-EG32-03 ARI 14 September 2007 19:18
169. Pagiola S, Bishop J, Landell-Mills N, eds. 2002. Selling Forest Environmental Services.Sterling, VA: Earthscan
170. Tognetti SS, Mendoza G, Aylward B, Southgate D, Garcia L. 2003. A Knowledge andAssessment Guide to Support the Development of Payment Arrangements for Watershed EcosystemServices (PWES). Washington, DC: World Bank Environ. Dep.
171. Landell-Mills N, Porras IT. 2002. Silver Bullet or Fools’ Gold? A Global Review of Marketsfor Forest Environmental Services and Their Impact on the Poor. London: Int. Inst. Environ.Dev.
172. Heal G, Daily GC, Erlich PR, Salzman J, Boggs C, et al. 2001. Protecting natural capitalthrough ecosystem service districts. Stanford Environ. Law J. 20:333–64
173. Mitsch WJ, Gosselink JG. 2000. The value of wetlands: importance of scale and landscapesetting. Ecol. Econ. 35:25–33
174. Hayward B. 2005. From the Mountain to the Tap: How Land Use and Water Management CanWork for the Rural Poor. Newcastle Upon Tyne, UK: Dep. Int. Dev. For. Res. Program.
175. Daily GC, Ellison K. 2002. The New Economy of Nature: The Quest to Make ConservationProfitable. Washington, DC: Island
176. Postel SL, Thompson BH. 2005. Watershed protection: Capturing the benefits of nature’swater supply services. Nat. Resour. Forum 29:98–108
177. Bonell M, Bruijnzeel LA, eds. 2005. Forests, Water and People in the Humid Tropics:Past, Present and Future Hydrological Research for Integrated Land and Water Management.Cambridge, UK: Cambridge Univ. Press
178. Ferraro PJ, Simpson RD. 2002. The cost-effectiveness of conservation payments. LandEcon. 78:339–53
179. Zhang PC, Shao GF, Zhao G, Le Master DC, Parker GR, et al. 2000. China’s forestpolicy for the 21st century. Science 288:2135–36
180. Uchida E, Xu JT, Rozelle S. 2005. Grain for green: cost-effectiveness and sustainabilityof China’s conservation set-aside program. Land Econ. 81:247–64
181. Xu M, Qi Y, Gong P. 2000. China’s new forest policy. Science 289:2049–50182. Xu ZG, Xu JT, Deng XZ, Huang JK, Uchida E, Rozelle S. 2006. Grain for green versus
grain: conflict between food security and conservation set-aside in China. World Dev.34:130–48
183. Macdonald IAW. 2004. Recent research on alien plant invasions and their managementin South Africa: a review of the inaugural research symposium of the Working for WaterProgramme. S. Afr. J. Sci. 100:21–26
184. Magadlela D, Mdzeke N. 2004. Social benefits in the Working for Water Programme asa public works initiative. S. Afr. J. Sci. 100:94–96
185. Evans D, Assoc. ECONorthwest. 2004. Comparative Valuation of Ecosystem Services: LentsProject Case Study. Portland, OR: City Portland Watershed Manag. Program
98 Brauman et al.
Ann
u. R
ev. E
nvir
on. R
esou
rc. 2
007.
32:6
7-98
. Dow
nloa
ded
from
arj
ourn
als.
annu
alre
view
s.or
gby
Pro
f D
iana
Liv
erm
an o
n 12
/30/
07. F
or p
erso
nal u
se o
nly.

AR325-FM ARI 21 September 2007 16:39
Annual Review ofEnvironmentand Resources
Volume 32, 2007Contents
I. Earth’s Life Support Systems
Feedbacks of Terrestrial Ecosystems to Climate ChangeChristopher B. Field, David B. Lobell, Halton A. Peters, and Nona R. Chiariello � � � � � �1
Carbon and Climate System Coupling on Timescales from thePrecambrian to the AnthropoceneScott C. Doney and David S. Schimel � � � � � � � � � � � � � � � � � � � � � � � � � � � � � � � � � � � � � � � � � � � � � � � � � � � � 31
The Nature and Value of Ecosystem Services: An OverviewHighlighting Hydrologic ServicesKate A. Brauman, Gretchen C. Daily, T. Ka’eo Duarte, and Harold A. Mooney � � � � � 67
Soils: A Contemporary PerspectiveCheryl Palm, Pedro Sanchez, Sonya Ahamed, and Alex Awiti � � � � � � � � � � � � � � � � � � � � � � � � � 99
II. Human Use of Environment and Resources
Bioenergy and Sustainable Development?Ambuj D. Sagar and Sivan Kartha � � � � � � � � � � � � � � � � � � � � � � � � � � � � � � � � � � � � � � � � � � � � � � � � � � � � �131
Models of Decision Making and Residential Energy UseCharlie Wilson and Hadi Dowlatabadi � � � � � � � � � � � � � � � � � � � � � � � � � � � � � � � � � � � � � � � � � � � � � � � � �169
Renewable Energy Futures: Targets, Scenarios, and PathwaysEric Martinot, Carmen Dienst, Liu Weiliang, and Chai Qimin � � � � � � � � � � � � � � � � � � � � � �205
Shared Waters: Conflict and CooperationAaron T. Wolf � � � � � � � � � � � � � � � � � � � � � � � � � � � � � � � � � � � � � � � � � � � � � � � � � � � � � � � � � � � � � � � � � � � � � � � � � � � � �241
The Role of Livestock Production in Carbon and Nitrogen CyclesHenning Steinfeld and Tom Wassenaar � � � � � � � � � � � � � � � � � � � � � � � � � � � � � � � � � � � � � � � � � � � � � � � � �271
Global Environmental Standards for IndustryDavid P. Angel, Trina Hamilton, and Matthew T. Huber � � � � � � � � � � � � � � � � � � � � � � � � � � � � �295
Industry, Environmental Policy, and Environmental OutcomesDaniel Press � � � � � � � � � � � � � � � � � � � � � � � � � � � � � � � � � � � � � � � � � � � � � � � � � � � � � � � � � � � � � � � � � � � � � � � � � � � � � � �317
vii
Ann
u. R
ev. E
nvir
on. R
esou
rc. 2
007.
32:6
7-98
. Dow
nloa
ded
from
arj
ourn
als.
annu
alre
view
s.or
gby
Pro
f D
iana
Liv
erm
an o
n 12
/30/
07. F
or p
erso
nal u
se o
nly.
AR325-FM ARI 21 September 2007 16:39
Population and EnvironmentAlex de Sherbinin, David Carr, Susan Cassels, and Leiwen Jiang � � � � � � � � � � � � � � � � � � � �345
III. Management, Guidance, and Governance of Resources and Environment
Carbon Trading: A Review of the Kyoto MechanismsCameron Hepburn � � � � � � � � � � � � � � � � � � � � � � � � � � � � � � � � � � � � � � � � � � � � � � � � � � � � � � � � � � � � � � � � � � � � � � � �375
Adaptation to Environmental Change: Contributionsof a Resilience FrameworkDonald R. Nelson, W. Neil Adger, and Katrina Brown � � � � � � � � � � � � � � � � � � � � � � � � � � � � � � � �395
IV. Integrative Themes
Women, Water, and DevelopmentIsha Ray � � � � � � � � � � � � � � � � � � � � � � � � � � � � � � � � � � � � � � � � � � � � � � � � � � � � � � � � � � � � � � � � � � � � � � � � � � � � � � � � � � �421
Indexes
Cumulative Index of Contributing Authors, Volumes 23–32 � � � � � � � � � � � � � � � � � � � � � � � �451
Cumulative Index of Chapter Titles, Volumes 23–32 � � � � � � � � � � � � � � � � � � � � � � � � � � � � � � � � �455
Errata
An online log of corrections to Annual Review of Environment and Resources articlesmay be found at http://environ.annualreviews.org
viii Contents
Ann
u. R
ev. E
nvir
on. R
esou
rc. 2
007.
32:6
7-98
. Dow
nloa
ded
from
arj
ourn
als.
annu
alre
view
s.or
gby
Pro
f D
iana
Liv
erm
an o
n 12
/30/
07. F
or p
erso
nal u
se o
nly.