Embed Size (px)
Citation preview
The Neolithic Revolution and Contemporary Variations in LifeExpectancy ∗
Oded Galor and Omer Moav†
August 28, 2007
Abstract
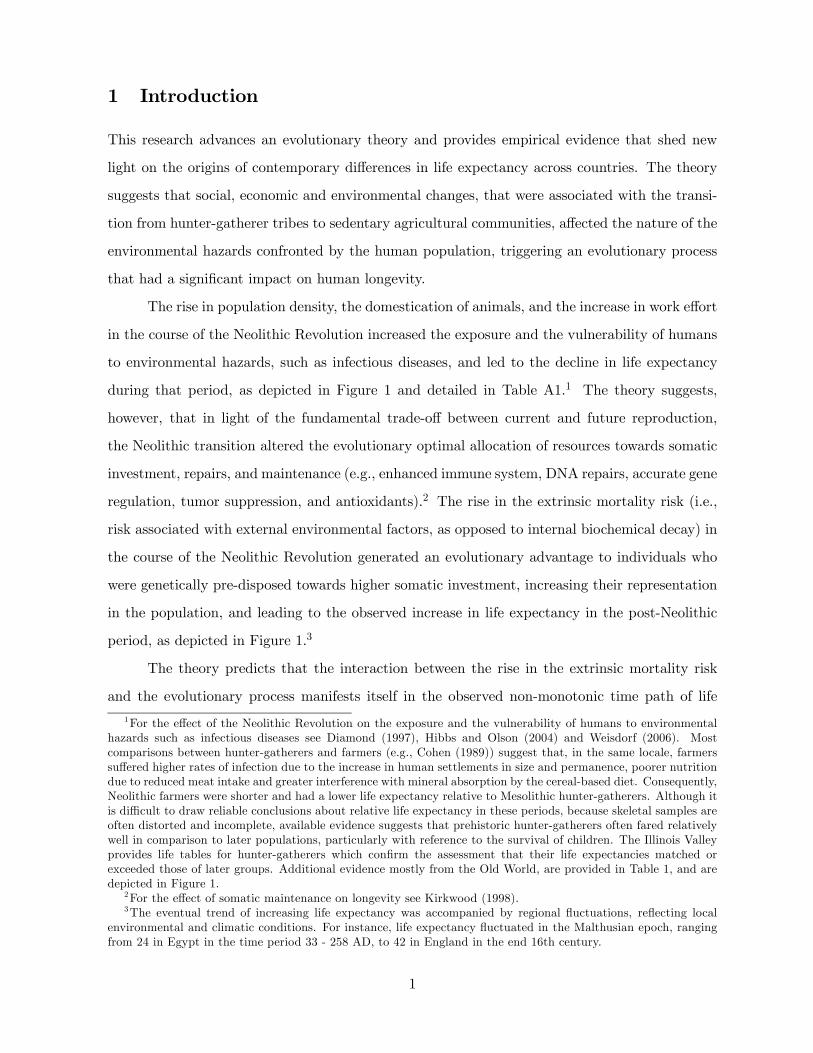
This research advances an evolutionary theory and provides empirical evidence that shednew light on the origins of contemporary differences in life expectancy across countries. Thetheory suggests that social, economic and environmental changes that were associated withthe Neolithic Revolution affected the nature of the environmental hazards confronted by thehuman population, triggering an evolutionary process that had a significant impact on humanlongevity. The empirical analysis shows that a significant portion of contemporary variationsin life expectancy across countries can be traced to the differences in the time passed sincethe ancestors of the population of each country experienced the Neolithic Revolution.Keywords: Life Expectancy, Growth, Technological Progress, Evolution, Natural Selection,Malthusian Stagnation.
JEL classification Numbers: I12, J13, N3, O10.
∗The authors are especially grateful to Yona Rubinsiten for numerous discussion and comments. In addition,they wish to thank Josh Angrist, Roland Benabou, Herbert Ginitis, Moshe Hazan, Peter Howitt, David Laibson,Victor Lavy, Alex Levkov, Rodrigo Soares, Richard Steckel, Neil Wallace, David Weil, Jorgen Weibull, and seminarparticipants at BU, Copenhagen, Harvard, Hebrew University, LSE, Penn State, Rome, Royal Holloway, Tel-Aviv,NES, and conference participants at DEGIT X, Mexico 2005, and ”Biological Welfare and Inequality in Pre-Industrial Times”, Yale 2005, NBER Summer Institute, 2006, and ”Health, Human Development Potential andthe Quality of Life” IADB and PAHO, 2007, for helpful discussion and comments, and Tamar Roth for excellentresearch assistantship.
†Galor: Brown University, and CEPR; Moav: Hebrew University, University of London Royal Holloway, ShalemCenter, and CEPR
0
1 Introduction
This research advances an evolutionary theory and provides empirical evidence that shed new
light on the origins of contemporary differences in life expectancy across countries. The theory
suggests that social, economic and environmental changes, that were associated with the transi-
tion from hunter-gatherer tribes to sedentary agricultural communities, affected the nature of the
environmental hazards confronted by the human population, triggering an evolutionary process
that had a significant impact on human longevity.
The rise in population density, the domestication of animals, and the increase in work effort
in the course of the Neolithic Revolution increased the exposure and the vulnerability of humans
to environmental hazards, such as infectious diseases, and led to the decline in life expectancy
during that period, as depicted in Figure 1 and detailed in Table A1.1 The theory suggests,
however, that in light of the fundamental trade-off between current and future reproduction,
the Neolithic transition altered the evolutionary optimal allocation of resources towards somatic
investment, repairs, and maintenance (e.g., enhanced immune system, DNA repairs, accurate gene
regulation, tumor suppression, and antioxidants).2 The rise in the extrinsic mortality risk (i.e.,
risk associated with external environmental factors, as opposed to internal biochemical decay) in
the course of the Neolithic Revolution generated an evolutionary advantage to individuals who
were genetically pre-disposed towards higher somatic investment, increasing their representation
in the population, and leading to the observed increase in life expectancy in the post-Neolithic
period, as depicted in Figure 1.3
The theory predicts that the interaction between the rise in the extrinsic mortality risk
and the evolutionary process manifests itself in the observed non-monotonic time path of life
1For the effect of the Neolithic Revolution on the exposure and the vulnerability of humans to environmentalhazards such as infectious diseases see Diamond (1997), Hibbs and Olson (2004) and Weisdorf (2006). Mostcomparisons between hunter-gatherers and farmers (e.g., Cohen (1989)) suggest that, in the same locale, farmerssuffered higher rates of infection due to the increase in human settlements in size and permanence, poorer nutritiondue to reduced meat intake and greater interference with mineral absorption by the cereal-based diet. Consequently,Neolithic farmers were shorter and had a lower life expectancy relative to Mesolithic hunter-gatherers. Although itis difficult to draw reliable conclusions about relative life expectancy in these periods, because skeletal samples areoften distorted and incomplete, available evidence suggests that prehistoric hunter-gatherers often fared relativelywell in comparison to later populations, particularly with reference to the survival of children. The Illinois Valleyprovides life tables for hunter-gatherers which confirm the assessment that their life expectancies matched orexceeded those of later groups. Additional evidence mostly from the Old World, are provided in Table 1, and aredepicted in Figure 1.
2For the effect of somatic maintenance on longevity see Kirkwood (1998).3The eventual trend of increasing life expectancy was accompanied by regional fluctuations, reflecting local
environmental and climatic conditions. For instance, life expectancy fluctuated in the Malthusian epoch, rangingfrom 24 in Egypt in the time period 33 - 258 AD, to 42 in England in the end 16th century.
1
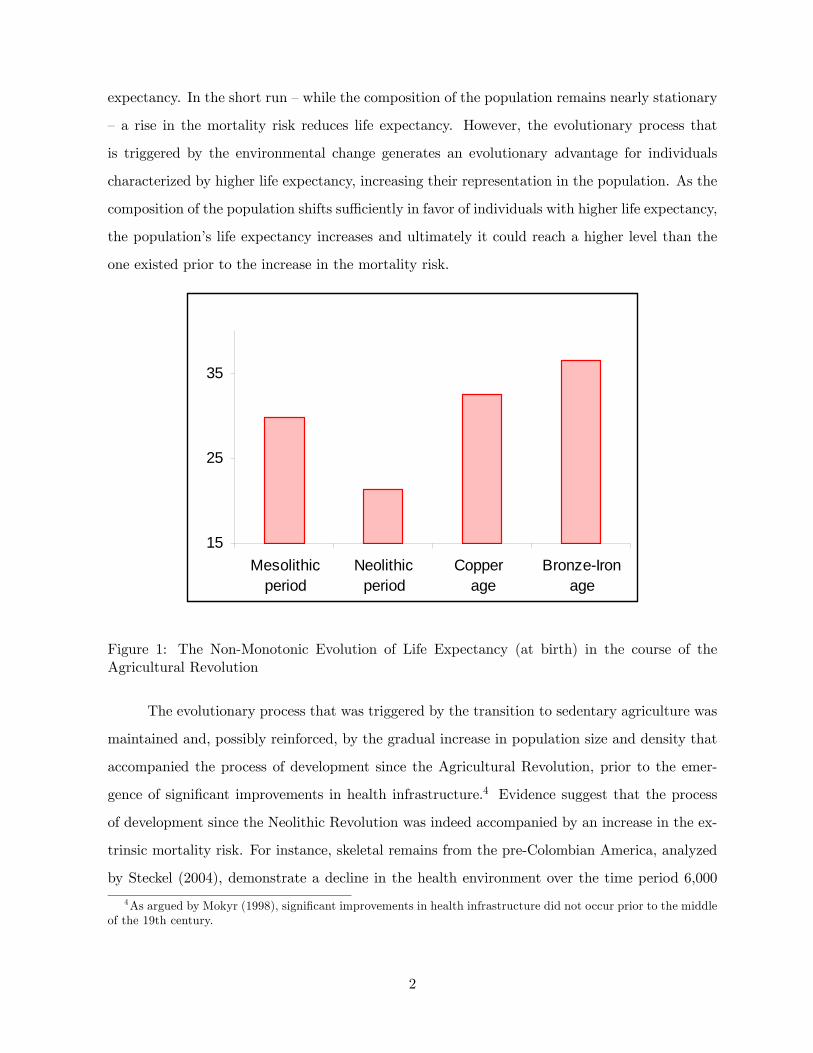
expectancy. In the short run — while the composition of the population remains nearly stationary
— a rise in the mortality risk reduces life expectancy. However, the evolutionary process that
is triggered by the environmental change generates an evolutionary advantage for individuals
characterized by higher life expectancy, increasing their representation in the population. As the
composition of the population shifts sufficiently in favor of individuals with higher life expectancy,
the population’s life expectancy increases and ultimately it could reach a higher level than the
one existed prior to the increase in the mortality risk.
15
25
35
Mesolithicperiod
Neolithicperiod
Copper age
Bronze-Ironage
Figure 1: The Non-Monotonic Evolution of Life Expectancy (at birth) in the course of theAgricultural Revolution
The evolutionary process that was triggered by the transition to sedentary agriculture was
maintained and, possibly reinforced, by the gradual increase in population size and density that
accompanied the process of development since the Agricultural Revolution, prior to the emer-
gence of significant improvements in health infrastructure.4 Evidence suggest that the process
of development since the Neolithic Revolution was indeed accompanied by an increase in the ex-
trinsic mortality risk. For instance, skeletal remains from the pre-Colombian America, analyzed
by Steckel (2004), demonstrate a decline in the health environment over the time period 6,000
4As argued by Mokyr (1998), significant improvements in health infrastructure did not occur prior to the middleof the 19th century.
2
BCE until 1500 CE.5 Moreover, the process of urbanization suggests that the rise in population
density further contributed to the increase in the extrinsic mortality risk, as reflected by the rise
in the prevalence of major epidemics, such as the Black Death in Europe in the middle of the
14th century (e.g., McNeil (1998)), and a significant decline in life expectancy in some European
countries in the 16th and the 17th centuries.6 Furthermore, evidence suggests that changes in
the environment may generate significant evolutionary processes in the composition of existing
genetic traits within a time period that corresponds to the one required by the proposed the-
ory.7 Voight et al. (2006) detected about 700 regions of the human genome where genes appear
to have been reshaped by natural selection within the last 5,000 to 15,000 years. In addition,
Mekel-Bobrov et. al (2005) report that a variant of the gene ASPM (a specific regulator of brain
size in the lineage leading to Homo sapiens) arose in humans about 5800 years ago and has since
swept to high frequency under strong positive selection.
Importantly, differences in the timing of the Neolithic Revolution across regions generated
significant variations in the genetic composition of the contemporary human population. For
instance, lactose tolerance was developed among European and Near Easterners since the domes-
tication of dairy animals in the course of the Agricultural Revolution, whereas in regions that
were exposed to dairy animals in later stages a larger proportion of the adult population suffers
from lactose intolerance. Furthermore, genetic immunity to malaria, associated with the sickle
5Steckel (2004) constructs a health index based on skeletal infections (inflammatory responses to bacterialinvasion), iron deficiency anemia (nutritional deprivation, low body weight, chronic diarrhea, parasite infections),dental health, degenerative joint disease (mechanical wear and tear on the joints of the skeleton due to physicalactivity), enamel hypoplasias (enamel deficiency commonly found in the teeth of people whose early childhoodwas biologically stressful), and trauma. The health index declined by an average of 2.5 percentage points permillennium, from 6,000 BCE until 1500 CE.
6 In particular, during the initial process of European urbanization in which the percentage of the urban pop-ulation increased six-fold from about 3% in 1520 to nearly 18% in 1750 [de Vries (1984) and Bairoch (1988)], lifeexpectancy at birth fell in England from about 40 at the end of the 16th century to about 33 in the beginningof the 18th century while mortality rates increased by nearly 50% (Wrigley and Schofield, 1981). Furthermore,Clark and Hamilton (2003) find that in England during the early part of the 17th century, the average numberof surviving offspring was nearly 50% higher among rural families in comparison to urban families, controlling forliteracy.
7There are numerous examples of rapid evolutionary changes among various species that were triggered bysignificant changes in the environment. The color change that peppered moths underwent during the 19th centuryis a classic example of evolution in nature [See Kettlewell 1973]. Before the Industrial Revolution light-coloredEnglish peppered moths blended with the lichen-covered bark of trees. By the end of the 19th century a blackvariant of the moth, first recorded in 1848, became far more prevalent than the lighter varieties in areas in whichindustrial carbon removed the lichen and changed the background color. Hence, a significant evolutionary changeoccurred within a time period that correspond to only hundreds of generations. Moreover, evidence from DaphneMajor in the Galapagos suggests that significant evolutionary changes in the distribution of traits among Darwin’sFinches occurred within few generations due to a major drought [Grant and Grant 1989]. Other evidence, includingthe dramatic changes in the color patterns of guppies within 15 generations due to changes in the population ofpredators, are surveyed by Endler [1986].
3
cell trait, is prevalent among descendents of Africans whose engagement in agriculture improved
the breeding ground for mosquitoes and thereby raised the incidence of malaria, whereas this
trait is absent among descendents of nearby populations that have not made the transition to
agriculture.8
In this research we explore the evolution of the distribution of life-history profiles (i.e., the
life cycle of somatic investment and its effect on life expectancy)9 in light of the fundamental
trade-off that exists in nature between investments in somatic maintenance (and thus longevity
and future reproduction) and the resources available for current reproduction. Evidence shows
that the evolved capacity of somatic cells to carry out effective maintenance and repairs (e.g.,
DNA repairs, accurate gene regulation, tumor suppression, and antioxidants), governs the time
taken for damage to accumulate thereby regulating longevity.10 Experiments and observation in
non-human species indicate that this trade-off exists.11 Moreover, using an historical data set
from the British aristocracy, Westendorp and Kirkwood (1998) argue that human life histories
involve a trade-off between longevity and reproduction.
The analysis focuses on the evolutionary process with respect to the trade-off between
parental somatic investment in each offspring and the number of offspring that can be supported.12
Resources that are channeled towards higher somatic investment in each offspring generate higher
life expectancy, but limit the number of offspring that can be raised.13 “Increased bearing is bound
to be paid for by less efficient caring” [Dawkins 1989, p. 116]. Thus, there is an evolutionary
trade-off, regarding reproduction success, between the life expectancy of each offspring and the
8See Livingston [1958], Weisenfeld [1967] and Durham [1982].9See Stearns (1992).10Evidence at the molecular and cellular levels suggest that longevity is correlated with effort devoted to repair
and cellular maintenance. A positive correlation is found among captive mammals between longevity and DNArepair capacity, genomic integrity, and mitochodrial ROS production. Furthermore, cell resistance to external stressis larger among long-lived species. Moreover, it should be noted that long-run adaptations that reduce extrinsicmortality (e.g., larger brains) are generally linked to increased longevity. [Kirkwood (1998)]. These long-runadaptations, however, are not the focus of the current study.11See the survey of this evidence by Williams and Day (2003).12As is well established in the evolutionary biology literature since the seminal work of Lack [1954], the allocation
of resources between offspring ‘caring’ and ‘bearing’ is subjected to evolutionary changes. Lack (1954) suggeststhat clutch sizes (e.g., number of eggs per nest), among owls and other predatory vole-eating birds, for instance,are positively related to food abundance. He argues that the clutch size is selected such that under any feedingconditions fertility rates ensure the maximal reproductive success. Furthermore, Cody [1966] documents theexistence of significant differences between clutch sizes of the same bird species on islands and nearby mainlandlocalities of the same latitude. In temperate regions where food is more abundant in the mainland than on islands,the average clutch size is smaller on the islands. For instance, Cyanoramphus novaezelandeae, the average mainlandclutch is 6.5 whereas the average in the island is 4.13For instance, variations in somatic investment may manifest themselves in genetically pre-determined variations
in the length of childhood and therefore in the amount of parental resources that are devoted to each offspring.
4
number of offspring that can be supported.14 Similar insights would be obtained if one would
have alternatively focused on the evolutionary process with respect to the trade-off between the
resources allocated to current parental own somatic investments (and thus life expectancy and
future reproduction success) and the resources invested in current parental reproduction.
The probability that an individual would survive to a reproduction age is affected positively
by the genetically pre-determined somatic investment, and negatively by the extrinsic mortality
risk that is associated with socio-environmental characteristics, which were altered by the Ne-
olithic Revolution. A rise in mortality risk triggers a process of natural selection that alters the
distribution of types within the population. Nature selects the level of somatic investment and
thereby life expectancy that maximizes reproduction success in any given environment, and the
distribution of these hereditary life-history traits evolves over time due to changes in the envi-
ronment. As long as the adverse effect of population density on the survival probability is lower
for individuals who are genetically pre-disposed for higher somatic investment, the evolutionary
optimal level of somatic investment is an increasing function of the extrinsic mortality risk.
Thus, the rise in the extrinsic mortality risk in the course of the Neolithic Revolution shifted
the evolutionary advantage towards individuals with higher somatic investment and thus higher
life expectancy. Furthermore, the rise in the extrinsic mortality risk and its interaction with the
forces of natural selection induced a non-monotonic time path of life expectancy. During the
Neolithic Revolution life expectancy declined, as long as the extrinsic mortality risked increased
and the distribution of types in the population did not evolve considerably. However, the onset of
the evolutionary process increased the prevalence of individuals with higher somatic investment
in the population and ultimately generated a rise in life expectancy.15
The theory suggests therefore that regions that experienced an earlier transition to agri-
cultural communities, begun earlier the evolutionary process that increased the representation of
individuals who are genetically pre-disposed towards higher somatic investment and higher life
expectancy. The onset of the occurrence of the Neolithic Revolution, only 10,500 years ago, sug-
14Consistent with the existence of this trade-off, recent molecular and behavioral genetic research across historicaland modern data from the United States and Europe suggests that fertility behavior has a significant hereditarycomponent [Rodgers et al. 2001a]. For instance, as established recently by Kohler et al. [1999] and Rodgerset al. [2001b] based on the comparison of fertility rates among identical and fraternal twins born in Denmarkduring the periods 1870-1910 and 1953-1964, slightly more than one-quarter of the variance in completed fertilityis attributable to genetic influence. These findings are consistent with those of Rodgers and Doughty [2000] basedon kinship data from the United States.15 In the long-run the decline in the extrinsic mortality risk due to the improvements in medical technology and
health infrastructure may reverse the evolutionary process outlined in this research.
5

gest that this evolutionary process has not been completed, and thus differences in the timing of
the Neolithic Revolution across regions should be reflected in variations in the genetic component
of life expectancy in the contemporary human population. In particular, the theory predicts that
descendants of regions that experienced the Neolithic Revolution earlier would have a higher life
expectancy today in comparison to others who live in similar socioeconomic conditions.
The prediction of the theory regarding the effect of the time passed since of the Neolithic
Revolution on life expectancy is examined empirically. The empirical analysis demonstrates that
a significant portion of contemporary variations in life expectancy across countries can be traced
to the weighted average of the time passed since the ancestors of the population of each country
experienced the Neolithic Revolution. In particular, controlling for geographical and continental
characteristics of each country, as well as income, education and health expenditure per capita,
every 1000 years of earlier Neolithic transition contributes to life expectancy 1.6-1.9 years. Thus,
for instance, the European population that experienced the Neolithic Revolution on average 3160
years earlier than the African population would be expected to live 5 years longer, even if the
gap in the socioeconomic conditions between these continents will be eliminated. Alternatively,
Americans from European decent would be expected to live five years longer than Americans
from African decent with similar socioeconomic background.
2 Related Literature
Evolutionary biologists suggest two complementary theories for the evolution of senescence (i.e.,
persistent decline in the somatic function of an organism with age) and thus of life expectancy.16
The mutation accumulation theory of aging [Medawar, 1946] suggests that late-acting deleteri-
ous mutations have a smaller negative effect on the survival of the genes and aging therefore is
an inevitable outcome of the declining force of natural selection in older age. The antagonistic
pleiotropy theory [Williams, 1957] suggests that late-activating deleterious genes may be favored
by natural selection and may be actively accumulated in population if they have a beneficial repro-
ductive effects in early stages of life. In particular, the disposable soma theory [Kirkwood, 1977]
examines the optimal allocation of metabolic resources between reproduction and maintenance.
Our theory advances the disposable soma theory, exploring the implications of the process
16An earlier theory that is widely considered among biologists as inconsistent with the evidence is the theory ofprogrammed death (Weismann, 1882). It suggests that aging is beneficial and even necessary at the species levelin order to free resources for the younger generation.
6
of economic development on the evolution of the distribution of life-history profiles (i.e., the
life cycle of somatic investment and maintenance) within the human species since the onset of
the Neolithic Revolution. The proposed theory demonstrates that if the effect of a rise in the
extrinsic mortality risk on the survival probability can be mitigated by an increase in somatic
investment, then it would necessarily generate an increase in the (evolutionary optimal) level of
somatic investment and may thereby prolong longevity.17
The implications of the interaction between the process of economic development and hu-
man evolution have been explored in recent years.18 Galor and Moav (2002) suggest that during
the epoch of Malthusian stagnation traits that are complementary to the process of develop-
ment, in particular higher valuation for offspring quality, generated an evolutionary advantage
and their representation in the population gradually increased. This selection process and its
effect on investment in human capital stimulated technological progress and ultimately triggered
a reinforcing interaction between investment in human capital and technological progress that
brought about the Industrial Revolution, a demographic transition and a shift to the modern
regime of sustained economic growth.19 Ofek (2001) and Saint Paul (2003) examine the effect of
the emergence of markets on the evolution of heterogeneity in the human population. Lagerlof
(2007) examines the evolution of human body size in the process of development, and Borghans,
Borghans and ter-Weel (2004) analyze the effect of human cooperation on the evolution of Major
Histocompatibility Complex (MHC).20
Robson and Kaplan (2003) examine the evolutionary optimal human brain size and life
17Most of the literature in evolutionary biology focused on the effect of a rise in the extrinsic mortality ratethat cannot be mitigated by an increase somatic investment, arguing therefore that in this type of environmentan increase in the extrinsic mortality rate would generate a decline in somatic investment and thereby a declinein life expectancy. Recently, however, in light of a wide range of compelling evidence, it has been recognized thatthe adverse effect of a rise in extrinsic mortality risk can be counteracted by an increase in somatic investment[Williams and Day (2003)]. In particular, Reznick et al. (2004) demonstrates that guppies that were exposed tohigher extrinsic mortality risk had lower intrinsic mortality rate.18The evolution of a wide range of attributes such as time preference, risk aversion, and altruism, in a given
economic environment, has been extensively explored in the economic literature, as surveyed by Bowles (1998) andRobson (2001). The dynamics of evolutionary processes is explored as well (e.g., Benaim and Weibull (2003)).19The theory is applicable for either social or genetic intergenerational transmission of traits. A cultural trans-
mission is likely to be more rapid and may govern some of the observed differences in fertility rates across regions.The interaction between cultural and genetic evolution is explored by Boyd and Richardson (1985) and Cavalli-Sforza and Feldman (1981), and a cultural transmission of preferences is examined by Bisin and Verdier (2000).Clark and Hamilton (2006) provides evidence from England in the 1630s, supporting the view that the number ofsurviving offspring increases with wealth and education.20The Darwinian methodology has been employed in the study of human behavior within the sociobiology
literature (e.g., Wilson [1975]) and in a sequence of studies about the evolution of preferences surveyed by Bowles[1998] and Robson [2001], within the economics literature. The focus of these models is fundamentally different.They are primarily designed to explain the determination of preference (e.g., Becker [1976], and Hansson andStuart [1990]).
7
expectancy in the context of hunter-gatherer societies that were prevalent during the two million
years that preceded the Agricultural Revolution.21 They argue that a decrease in the extrinsic
mortality risk that was faced by the human population led to an increase in somatic investment
leading to larger brain size and higher life expectancy. In contrast to the basic premise of
Robson and Kaplan (2003) that the extrinsic mortality risk decreased in the course of human
existence, evidence about the rise of population density and the lack of significant improvements
in technology prior to the Mesolithic period, suggests in fact that extrinsic mortality risk increased
in this era, consistently with the findings of Steckel (2004). For instance, the transition from the
Paleolithic period to the Mesolithic hunter-gatherer economies corresponded to the disappearance
of large game animals and the consequent adoption of broad spectrum foraging patterns aimed
at a wider array of small animals, seeds, and aquatic foods resulting in a decline in nutrition and
thus human health [Cohen (1989), and Acsa’di and Nemeskeri (1970, p. 169)]. Thus, our theory
and empirical analyzes suggests, in contrast, that an increase in the extrinsic mortality risk led in
fact to higher somatic investment, that mitigated the negative effect of the external environment,
and eventually led to higher life expectancy. Moreover, the theory offers an explanation for the
observed non-monotonic evolution of life expectancy in the context of the Agricultural Revolution,
despite the apparent increase in the extrinsic mortality risk during these periods of increased
population density.
Finally, in contrast to our evolutionary approach to the understanding of the time-path of
life expectancy in the last 10,000 year, existing economic theories have focused on the contribution
of the advancement of health infrastructure, medical technology and education to the rise in life
expectancy in recent centuries, as documented by Fogel (1994) and Mokyr (1998), and explored
by Erlich and Lui (1991), Galor and Weil (1999), Boucekkine, de la Croix and Licandro (2003),
Cervellati and Sunde (2005), Lagerlof (2003), Hazan and Zoabi (2006), Weisdorf (2004), Weil
(2005), Soares (2005), Iyigun (2005) and Strulik (2007).
3 The Basic Structure of the Model
Consider an economy that consists of individuals that are distinguished genetically by the re-
sources that they allocate to somatic investment, repair and maintenance, and thereby by their
21Similarly, abstracting from the process of economic development, Lee (2003) examines the evolution of lifeexpectancy in light of the effect of Intergenerational transfers, during the post fertility period, on offspring’squality.
8
life expectancy. Resources that are channeled towards higher somatic investment of each offspring
generate higher life expectancy, but limit the number of offspring that can be raised. Thus, there
is an evolutionary trade-off, regarding reproduction success, between the life expectancy of each
offspring and the number of offspring that can be supported.
A rise in mortality risk triggers a process of natural selection that alters the distribution
of types within the population. Nature selects the life-history profile (i.e., the life cycle of so-
matic investment) and thereby life expectancy that maximizes reproduction success, in any given
environment and the distribution of these hereditary life-history traits evolves over time due to
changes in the environment that are induced by increases in population density. Thus, the evo-
lutionary process within the human population may lead to a reduction in mortality rates and
an increase in life expectancy, despite the increase in extrinsic mortality risk that is associated
with the rise in population density.
The economy is implicitly characterized by a Malthusian environment in which the growth
of income per capita is constrained by the increase in the size of the population, whereas popu-
lation size is constrained by the availability of resources as well as by the technological level.22
3.1 Individuals
Individuals are ex-ante identical except for their genetic disposition towards somatic investment
and thus life expectancy. Individuals may live for either one period (childhood) or two periods
(childhood and adulthood), i.e., children are subjected to a mortality risk that may prevent them
from reaching adulthood. In their childhood, individuals consume part of their parental income.
Those who survive and reach adulthood, work and allocate their income to consumption and
child rearing. Reproduction is a-sexual and each individual is therefore born to a single parent.23
3.1.1 Somatic Investment, Extrinsic Mortality, and Life Expectancy
The survival probability of individuals depends upon their somatic investment and the extrinsic
mortality risk that characterizes the environment in which they live. Individuals are distinguished
by the resources that they allocate to somatic investment, repair, and maintenance, and thereby
by their life expectancy. Individuals that are characterized by a higher, genetically predetermined,
22Consistently with the Malthusian theory, Clark and Hamilton (2006) and Botticini and Siow (2005) provideevidence that in pre-industrial society wealthier families had more surviving children, and Kelly (2004) providesevidence at the macro level regarding the effect of wages on population growth.23The modeling of sexual reproduction would clutter the analysis, but would not alter the basic hypothesis.
9
somatic investment generate higher life expectancy. Somatic investment during childhood, μ,
varies across individuals.24 This genetic trait is transmitted imperfectly from parent to offspring,
maintaining the variation in the population.
The survival probability of each type of individual depends upon the extrinsic mortality
risk that is associated with the environment and the individual’s genetically pre-determined
somatic investment. The extrinsic mortality risk, x, is affected by the socioeconomic environment,
population density and the level of health infrastructure.25
The probability, P , that an individual would survive to adulthood is affected positively
by the genetically pre-determined somatic investment in childhood, μ, and negatively by the
extrinsic mortality risk, x;
P = P (μ, x). (1)
Thus, life expectancy of individual E = 1 + P, is affected positively by the genetically
pre-determined somatic investment in childhood, μ, and negatively by the extrinsic mortality
risk, x;
E = E(P (μ, x)). (2)
The biological upper bound on life expectancy for individual of type i, Emax, is reached when
the extrinsic mortality risk is equal to zero, i.e.,
Emax = E(P (μ, 0)). (3)
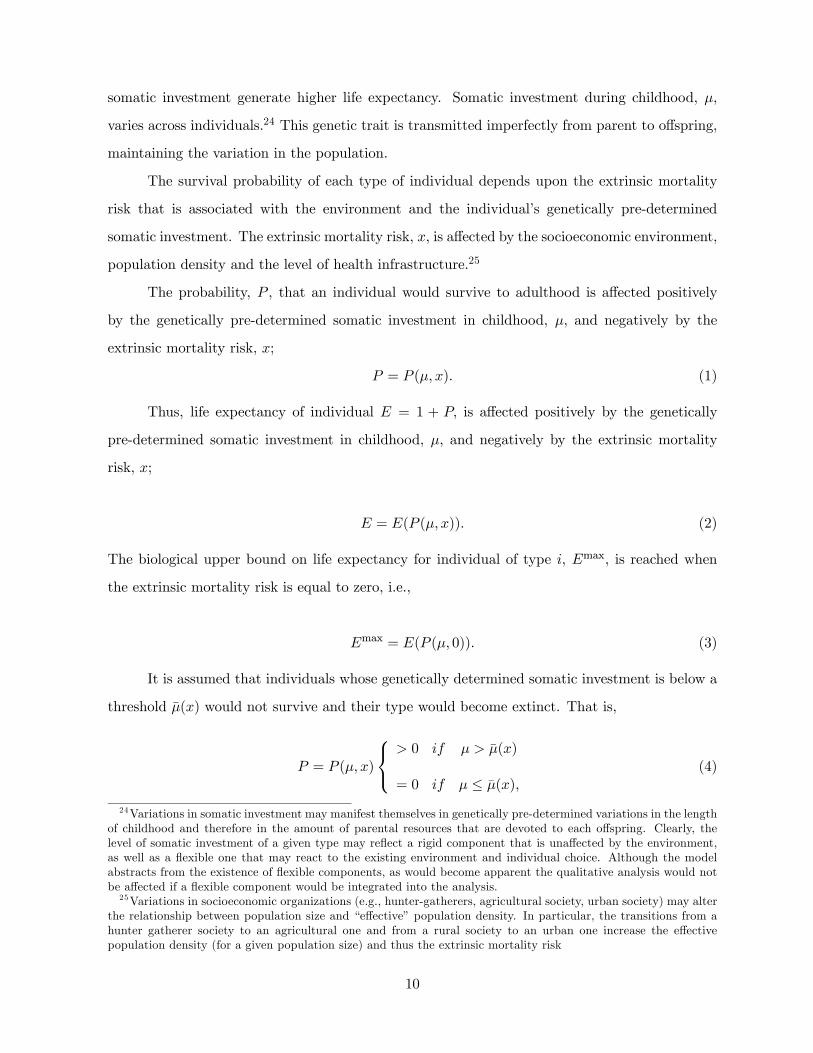
It is assumed that individuals whose genetically determined somatic investment is below a
threshold μ̄(x) would not survive and their type would become extinct. That is,
P = P (μ, x)
⎧⎨⎩> 0 if μ > μ̄(x)
= 0 if μ ≤ μ̄(x),(4)
24Variations in somatic investment may manifest themselves in genetically pre-determined variations in the lengthof childhood and therefore in the amount of parental resources that are devoted to each offspring. Clearly, thelevel of somatic investment of a given type may reflect a rigid component that is unaffected by the environment,as well as a flexible one that may react to the existing environment and individual choice. Although the modelabstracts from the existence of flexible components, as would become apparent the qualitative analysis would notbe affected if a flexible component would be integrated into the analysis.25Variations in socioeconomic organizations (e.g., hunter-gatherers, agricultural society, urban society) may alter
the relationship between population size and “effective” population density. In particular, the transitions from ahunter gatherer society to an agricultural one and from a rural society to an urban one increase the effectivepopulation density (for a given population size) and thus the extrinsic mortality risk
10
where for all x, μ̄(x) > 0. Moreover, for μ > μ̄(x), Pμ(μ, x) > 0, Pμμ(μ, x) < 0, Px(μ, x) ≤ 0 and
(a) the threshold level of somatic investment below which individuals do not survive, μ̄(x), in-
creases with the harshness of the environment, i.e.,
μ̄0(x) > 0; (A1)
(b) the adverse effect of population density on the survival probability is (weakly) lower for indi-
viduals who are genetically pre-disposed for higher somatic investment and somatic investment
increases the probability of survival in decreasing rates, i.e.,
Pxμ(μ, x) ≥ 0 for μ > μ̄(x). (A2)
3.1.2 Fertility Across Types
Parental income, y, is allocated between consumption and child rearing. In particular, parents di-
vide their income, y, between consumption, c, and the cost associated with raising n children, μn,
where μ is the somatic investment of each child.26 Thus, the individual resource constraint is
μn+ c ≤ y. (5)
In a Malthusian environment in which population growth is affected positively by the
level of income per capita, a fraction, β, of parental resources are devoted to childrearing and a
fraction 1 − β to consumption.27 Hence, the number of children of each parent is a function of
their children’s genetically predisposed somatic investment, μ 28
n = βy/μ. (6)
Thus, consistent with the fundamental features of the Malthusian environment - the economic
environment that is at the center of the proposed theory - the number of children is an increasing
function of parental income.29 In addition, parents whose children’s somatic investment is higher
would have fewer children.26 If some non-surviving children will parish in the beginning of the childhood period, rather than in the end, as
it is currently assumed, no qualitative change will occur. The cost of those non-surviving children will be zero, andtherefore, nit will stand for the number of surviving children that completed their childhood period. Furthermore,the incorporation of time as well as real resources as inputs in the production of offspring would not affect theanalysis qualitatively, as shown in the next footnote.27This allocation of parental resources could be devided from a utility maximization. In particular, if preferences
are homothetic, the fraction of parental resources that will be devoted to childrearing will be β.28For simplicity it is assumed that β is identical across individuals.29See for instance, Boyer (1989) and Clark and Hamilton (2006). The positive effect of the parental income on
11
3.2 Evolutionary Optimal Level of Life Expectancy
This section examines the evolutionary optimal level of somatic investment in a given environ-
ment, x (i.e., the level of somatic investment that generate the largest number of surviving
offspring). Individuals who posses this genetic predisposition will dominate the population in the
long run.
Let, μ∗, be the genetically determined level of somatic investment that, given the individual
allocation of resource to child rearing (6), will generate the largest number of surviving offspring,
P (μ, x)n, and let E∗ = E(P (μ∗, x)) be the evolutionary optimal level of life expectancy. It follows
that
μ∗ = argmaxP (μ, x)ns.t. n = βy/μ
(7)
Lemma 1 The genetically determined level of somatic investment, μ∗, that generates the largest
number of surviving offspring, is a unique single-valued function of the environment, x :
μ∗ = μ∗(x) > μ̄(x),
and the evolutionary optimal level of life expectancy, E∗, is therefore
E∗ = E(P (μ∗(x), x))
Proof. Since P = P (μ, x) = 0 for μ ≤ μ̄(x), it follows that μ∗(x) > μ̄(x). Further, as follows
from the first order conditions for the maximization problem (7), for μ∗(x) > μ̄(x),
F (μ∗, x) ≡ Pμ(μ∗, x)μ∗ − P (μ∗, x) = 0. (8)
Hence, since Fμ(μ∗, x) = Pμμ(μ∗, x)μ∗ 6= 0, the lemma follows from the Implicit Function Theorem
and the definition of life expectancy. ¤
As follows from (8), the evolutionary optimal level of somatic investment, μ∗(x), depicted
in Figure 2, is given by the unique tangency point between the function P (μ, x) and a ray from
the number of children, regardless of the level of income, reflects the assumption that child rearing is associatedwith a real cost, without any time cost. If a time cost would be added, it would generate the Malthusian structurein low levels of income but fertility rates will be bounded in a higher level of income. In particular, let τ be thetime cost associated with an offspring. Individuals’ budget constraint would become n(yτ + μ) + c ≤ y and theoptimization would imply that n = βy/(τy + μ). Hence, as in the formulation without a time cost, the number ofchildren is an increasing function of income and a decreasing function of somatic investment. However, under thisspecification, the number of children is a strictly concave function of income, bounded from above by β/τ.
12
the origin. Thus, at the optimum, reproductive success is maximized if the marginal return from
an increase in somatic investment, Pμ(μ∗, x), (i.e., the marginal return in reproductive success
to an increase in child “quality”) is equal to the marginal return in reproductive success due
to an increase in the investment in number of children (i.e., to investment in child “quantity”).
The latter generates an increase of (1/μ∗) in the number of children, resulting in an increase of
P (μ∗, x)/μ∗ in the number of surviving children.
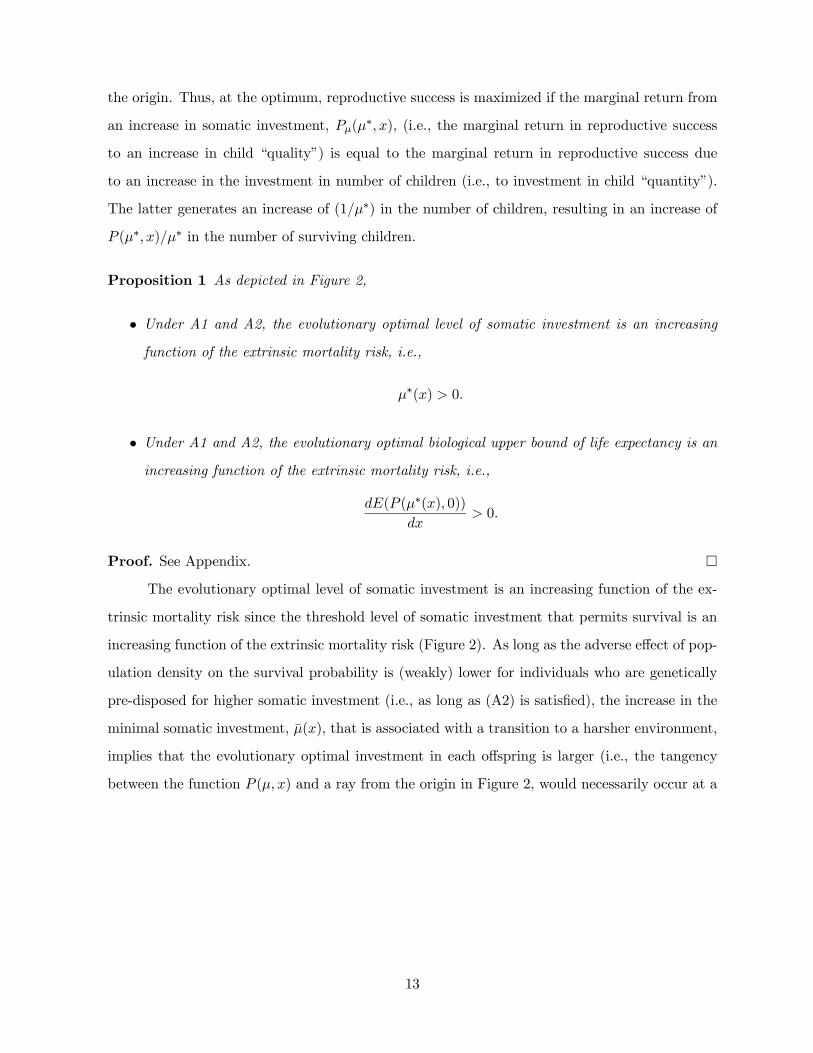
Proposition 1 As depicted in Figure 2,
• Under A1 and A2, the evolutionary optimal level of somatic investment is an increasing
function of the extrinsic mortality risk, i.e.,
μ∗(x) > 0.
• Under A1 and A2, the evolutionary optimal biological upper bound of life expectancy is an
increasing function of the extrinsic mortality risk, i.e.,
dE(P (μ∗(x), 0))
dx> 0.
Proof. See Appendix. ¤
The evolutionary optimal level of somatic investment is an increasing function of the ex-
trinsic mortality risk since the threshold level of somatic investment that permits survival is an
increasing function of the extrinsic mortality risk (Figure 2). As long as the adverse effect of pop-
ulation density on the survival probability is (weakly) lower for individuals who are genetically
pre-disposed for higher somatic investment (i.e., as long as (A2) is satisfied), the increase in the
minimal somatic investment, μ̄(x), that is associated with a transition to a harsher environment,
implies that the evolutionary optimal investment in each offspring is larger (i.e., the tangency
between the function P (μ, x) and a ray from the origin in Figure 2, would necessarily occur at a
13

higher level of μ).30
)),(( * ll xxP μ
)),(( * hh xxP μ
μ
1
)( hxμ)( lxμ )(* hxμ)(* lxμ
P
),( hxPP μ=
),( lxPP μ=
Figure 2. Evolutionary optimal levels of somatic investment and survival probabilityfor different levels of extrinsic mortality risk: xh > xl
It follows from Lemma 1 and Proposition 1 that a permanent increase in the extrinsic mor-
tality risk will initially generate a reduction life expectancy, but the process of natural selection
that it will trigger will gradually increase somatic investment, life expectancy and the biological
upper bound of life expectancy.
Despite the permanent rise in the extrinsic mortality risk, life expectancy will ultimately
increase beyond its initial level, prior to the increase in the extrinsic mortality risk, if it is further
assumed that the elasticity, ηPμ,μ, of the marginal effect of somatic investment on the survival
probability, Pμ(μ, x), with respect to somatic investment, μ, is smaller than one in absolute value:
ηPμ,μ ≡¯̄̄̄Pμμ(μ, x)μ
Pμ(μ, x)
¯̄̄̄< 1 for μ > μ̄(x), (A3)
i.e., an increase in somatic investment, μ generates less than a proportional decrease in the
marginal effect of somatic investment on the survival probability, Pμ(μ, x).31
Proposition 2 Under A1-A3,32 the evolutionary optimal level of life expectancy is an increasing
function of the extrinsic mortality risk, i.e.,
dE(P (μ∗(x), x))
dx> 0.
30For instance, if in contrast to (A2), the extrinsic component of the survival rate is independent of somaticinvestment then the optimal somatic investment may be negatively affected by the extrinsic mortality risk. Forinstance if the survival probability to adulthood P (μ, x) = p(μ)(1− x) then Pμx = −pμ < 0.31That is, for μ > μ̄(L), the survival probability P (μ,L) is only “moderately” strictly concave function of μ.32 (A3) is a sufficient but not a necessary condition.
14
Proof. See Appendix.33 ¤
Thus, the permanent rise in the extrinsic mortality risk in the course of the Neolithic
Revolution initially generates a reduction in life expectancy, but due to the process of natural
selection life expectancy gradually increased. Moreover, the biological upper bound of longevity
increased, generating the biological infrastructure for the recent prolongation of life expectancy
that was brought about by the decline in the extrinsic mortality risk due to improvements in the
heath infrastructure.
4 Empirical Specifications and Findings
The theory suggests that regions that experienced an earlier transition to agricultural communi-
ties, were exposed to a longer period of evolutionary pressure that increased the representation
of individuals who are genetically pre-disposed towards higher life expectancy. Since its earliest
occurrence in the Middle East nearly 10,500 years ago, the average onset of the Neolithic Revolu-
tion in Asia was about 6900 years ago, 6300 years ago in Europe, 3800 in South America, 2900 in
Africa, and in North America it occurred only 2300 years ago. From an evolutionary viewpoint,
these are short time periods, suggesting that variations in the timing of the Neolithic Revolu-
tion across regions should be reflected in variations in the genetic component of contemporary
life expectancy. In particular, the theory predicts that in a given socioeconomic environment
descendants of people from regions that experienced the Neolithic Revolution earlier would have
a higher life expectancy in comparison to descendants of people from regions that experienced
the Neolithic Revolution later.
The prediction of the theory regarding the positive effect of the time passed since of the
Neolithic Revolution on life expectancy is examined empirically. We exploit variations in the
average time passed since the ancestors of the population of each country today experienced the
Neolithic Revolution, as well as contemporary differences in life expectancy across countries, to
identify the impact of the time passed since the Neolithic Revolution on life expectancy. Moreover,
33For instance, if
P (μ, x)
⎧⎨⎩0 for μ ≤ x
(μ− x)1/2 for μ ∈ (x, x+ 1)1 for μ > x+ 1
for x ∈ (0, 1), thenμ∗(x) = 2x
P ∗ = x1/2,
and μ∗0(x) > 0 and dP (μ∗(x), x)/dx > 0.
15
we attempt to isolate the genetic effect on life expectancy, by controlling for plausible alternative
routes for the relationship between the timing of the Neolithic Revolution and contemporary life
expectancy.
The empirical analysis demonstrates that the time passed since the Neolithic transition
has a positive and highly significant effect on life expectancy in the year 2000, controlling for a
variety of geographical and socio-economic characteristics. Moreover, the findings lend credence
to the hypothesis that one of the underlying mechanisms that contributed to contemporary life
expectancy is the change in the composition of genetic traits triggered by the Neolithic Revolution.
The weighted average of the time passed since the ancestors of the population of each
country today experienced the Neolithic Revolution is positively and significantly correlated with
life expectancy in the year 2000, as shown in column 1 of Table 1.34 Nevertheless, although
contemporary life expectancy had no effect on the timing of the Neolithic Revolution, it does not
necessarily imply that an earlier onset of the Neolithic Revolution contributed to contemporary
life expectancy. In particular, one has to account for the possibility that a third factor (i.e., geo-
graphical attributes) that may be conducive for longer life expectancy today, may have permitted
an earlier onset of the Neolithic Revolution.
Moreover, even if a causal effect of an earlier onset of the Neolithic Revolution on con-
temporary life expectancy could be established, it does not necessarily confirm the proposed
genetic channel. An earlier onset of the Neolithic Revolution generated a socio-economic process
that may had an impact on contemporary living standards and thereby on contemporary life
expectancy, irrespective of potential changes in the composition of genetic traits.
Thus, the main empirical challenges are to account for the contribution of geographi-
cal attributes and socio-economic factors to the observed cross country correlation between the
weighted timing of the Neolithic Revolution and contemporary life expectancy, and to demon-
strate that the timing of the Neolithic Revolution has a significant additional effect on life ex-
pectancy that could be plausibly attributed to changes in the genetic composition of the human
population.
These challenges are confronted in several ways. First we demonstrate that once we control
34The weighted average of the timing in which the population of each country experienced the Neolithic Rev-olution is computed based on the recently compiled data set on the timing of the Neolithic Revolution acrossdifferent regions of the world (Putterman, 2006), as well as the data on post-1500 migratory patterns across theglobe (Putterman, 2007).
16
for major geographical attributes (i.e., latitude, percentage of arable land, and continental dum-
mies) that may have influenced the timing of Neolithic transition and possibility contemporary
life expectancy, the effect of the timing of the Neolithic Revolution remains highly significant and
powerful in explaining contemporary variations in life expectancy. Thus, we plausibly preclude
the possibility that a third (geographical) factor governs the entire observed correlation between
these two variables, establishing a causal effect of the time passed since the Neolithic Revolution
on contemporary life expectancy.
Table 1 presents the analysis of the effect of the time passed since the Neolithic Revolution
on life expectancy in the year 2000, accounting for variations in geographical characteristics
across countries that may have jointly influenced the timing of the Neolithic Revolution and
contemporary life expectancy. The results are based on linear OLS regressions, using a sample
of 139 countries.35 Regression 1 shows that in the absence of any controls, the coefficient of the
time passed since the Neolithic Revolution is 4.23 years of life expectancy for every 1000 years
of earlier Neolithic transition, and it is highly significant. Regression 2 incorporates exogenous
geographical controls for absolute latitude and the percentage of arable land. These geographical
variables, as elaborated above, are likely to have an effect on the timing of the Neolithic Revolution
and could be expected to directly affect life expectancy today via climate, population density,
and the level of income. The inclusion of these geographical controls suggests that the effect
of the time passed since the Neolithic Revolution remains highly significant and the coefficient
of the time passed since the Neolithic Revolution is 3.3 years of life expectancy for every 1000
years of earlier Neolithic transition. Furthermore, it is reassuring to note that the effects of
the geographical factors on contemporary life expectancy are as one would have predicted. In
particular, (a) absolute latitude (i.e. distance from the equator), that captures higher income
per-capita, and possibly a less hostile disease environment, has a highly significant positive effect
on life expectancy,36 and (b) the percentage of arable land in each country, an exogenous indicator
for population density, that is uncorrelated with the level of income per capita, and thus is an
indicator for the extrinsic mortality risk, has a negative effect on contemporary life expectancy.
35Appendix 3 provides a comprehensive description of the data and its sources.36 Interestingly, as is apparent from the results presented in Table 2, the effect of the distance from the equator on
life expectancy operates primarily through its effect on contemporary income per capita. Its direct effect becomesinsignificant once income per capita is introduced as a control variable. Moreover, if the sample is restricted tocountries that mostly consist of the descendents of the country’s native population, the effect of distance fromthe equator vanishes, suggesting that the forces of natural selection did not operated based on distance from theequator.
17
Finally, Regression 3 shows that inclusion of continental dummies that capture geographical and
socio-economic characteristics that are specific to each continent does not affect the significance
of the results. Nevertheless, the coefficient of the effect of the timing of the Neolithic Revolution
drops to 2.05 years of life expectancy for every 1000 years of earlier transition, capturing only
the effect on the modest variations in life expectancy within continents in comparison to these
variations across continents.
Table 1, suggests therefore, that although geographical factors are indeed important in
explaining some of the observed correlation between these two variables, there exists a highly
significant positive effect of the time passed since the Neolithic Revolution on contemporary life
expectancy. Abstracting from variations in socio-economic characteristics, every 1000 years of
18
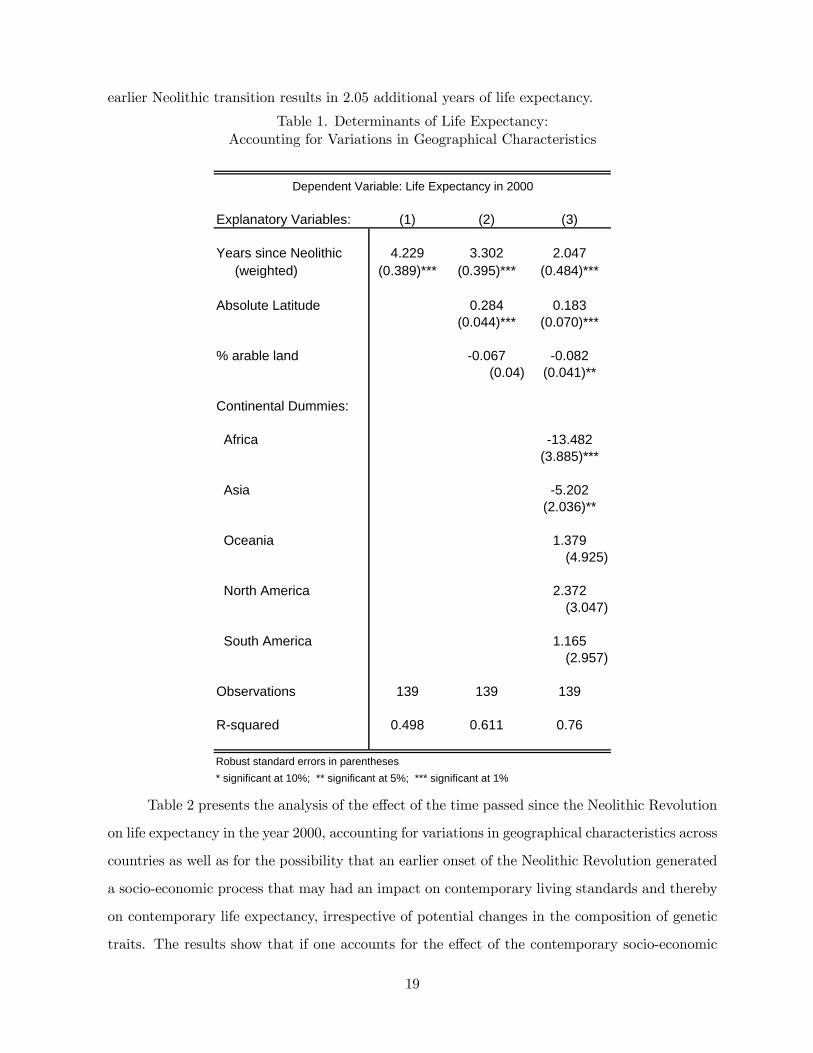
earlier Neolithic transition results in 2.05 additional years of life expectancy.
Table 1. Determinants of Life Expectancy:Accounting for Variations in Geographical Characteristics
Explanatory Variables: (1) (2) (3)
Years since Neolithic 4.229 3.302 2.047 (weighted) (0.389)*** (0.395)*** (0.484)***
Absolute Latitude 0.284 0.183(0.044)*** (0.070)***
% arable land -0.067 -0.082(0.04) (0.041)**
Continental Dummies:
Africa -13.482(3.885)***
Asia -5.202(2.036)**
Oceania 1.379(4.925)
North America 2.372(3.047)
South America 1.165(2.957)
Observations 139 139 139
R-squared 0.498 0.611 0.76
Robust standard errors in parentheses* significant at 10%; ** significant at 5%; *** significant at 1%
Dependent Variable: Life Expectancy in 2000
Table 2 presents the analysis of the effect of the time passed since the Neolithic Revolution
on life expectancy in the year 2000, accounting for variations in geographical characteristics across
countries as well as for the possibility that an earlier onset of the Neolithic Revolution generated
a socio-economic process that may had an impact on contemporary living standards and thereby
on contemporary life expectancy, irrespective of potential changes in the composition of genetic
traits. The results show that if one accounts for the effect of the contemporary socio-economic
19
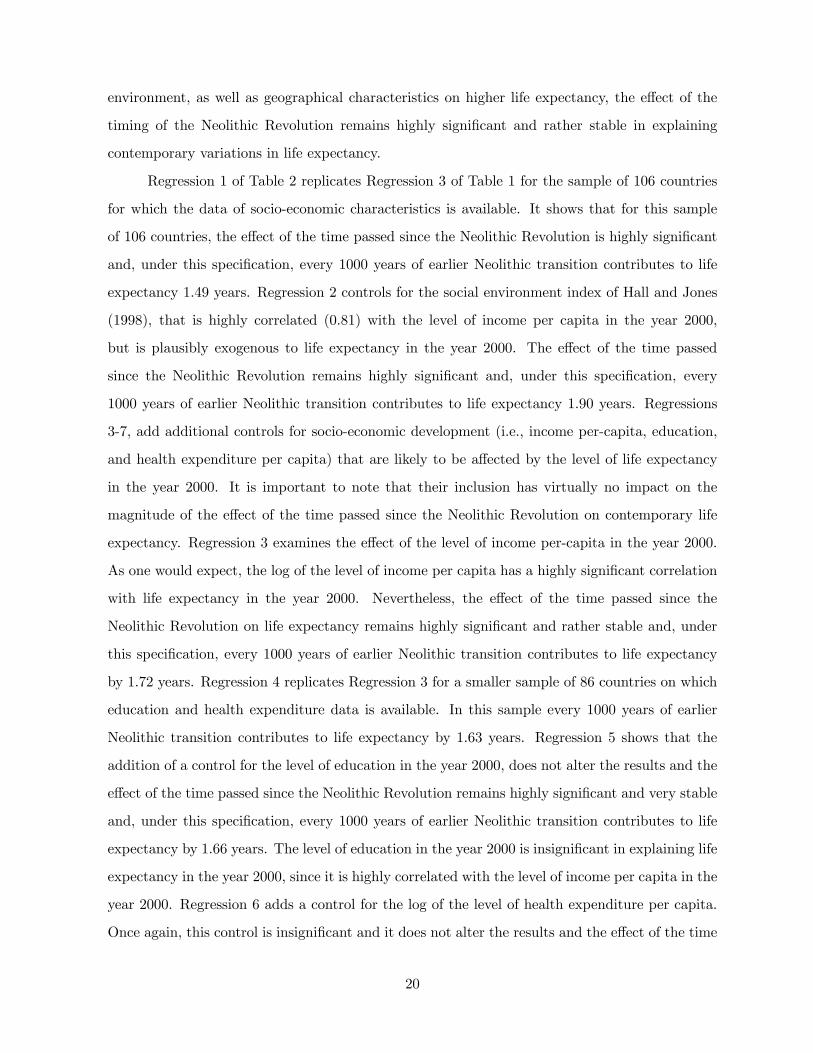
environment, as well as geographical characteristics on higher life expectancy, the effect of the
timing of the Neolithic Revolution remains highly significant and rather stable in explaining
contemporary variations in life expectancy.
Regression 1 of Table 2 replicates Regression 3 of Table 1 for the sample of 106 countries
for which the data of socio-economic characteristics is available. It shows that for this sample
of 106 countries, the effect of the time passed since the Neolithic Revolution is highly significant
and, under this specification, every 1000 years of earlier Neolithic transition contributes to life
expectancy 1.49 years. Regression 2 controls for the social environment index of Hall and Jones
(1998), that is highly correlated (0.81) with the level of income per capita in the year 2000,
but is plausibly exogenous to life expectancy in the year 2000. The effect of the time passed
since the Neolithic Revolution remains highly significant and, under this specification, every
1000 years of earlier Neolithic transition contributes to life expectancy 1.90 years. Regressions
3-7, add additional controls for socio-economic development (i.e., income per-capita, education,
and health expenditure per capita) that are likely to be affected by the level of life expectancy
in the year 2000. It is important to note that their inclusion has virtually no impact on the
magnitude of the effect of the time passed since the Neolithic Revolution on contemporary life
expectancy. Regression 3 examines the effect of the level of income per-capita in the year 2000.
As one would expect, the log of the level of income per capita has a highly significant correlation
with life expectancy in the year 2000. Nevertheless, the effect of the time passed since the
Neolithic Revolution on life expectancy remains highly significant and rather stable and, under
this specification, every 1000 years of earlier Neolithic transition contributes to life expectancy
by 1.72 years. Regression 4 replicates Regression 3 for a smaller sample of 86 countries on which
education and health expenditure data is available. In this sample every 1000 years of earlier
Neolithic transition contributes to life expectancy by 1.63 years. Regression 5 shows that the
addition of a control for the level of education in the year 2000, does not alter the results and the
effect of the time passed since the Neolithic Revolution remains highly significant and very stable
and, under this specification, every 1000 years of earlier Neolithic transition contributes to life
expectancy by 1.66 years. The level of education in the year 2000 is insignificant in explaining life
expectancy in the year 2000, since it is highly correlated with the level of income per capita in the
year 2000. Regression 6 adds a control for the log of the level of health expenditure per capita.
Once again, this control is insignificant and it does not alter the results and the effect of the time
20

passed since the Neolithic Revolution remains highly significant and remarkably stable. Under
this specification, every 1000 years of earlier Neolithic transition contributes to life expectancy
by 1.82 years.
Moreover, to further alleviate the concerns about the inclusion of potentially endogenous
controls variables, we demonstrate that if one includes lagged values of these variables in the years
1960, the coefficient on the time passed since the Neolithic Revolution remains highly significant
and virtually unchanged in magnitude. In particular, as reported in Regression 7, controlling for
geographical and continental characteristics of each country, as well as income and education in
the years 1960, under this specification, every 1000 years of earlier Neolithic transition results in
1.73 additional years of life expectancy.37
Finally, Regression 8, demonstrates that the migratory patterns in the world in the past
500 years and the selection that it may represents is not the source of the results. In particular, if
for instance, one restricts the sample of countries to the 42 countries whose at least 90% of their
population are descendants of natives in the country in the year 1500, then every 1000 years of
earlier Neolithic transition results in 1.48 additional years of life expectancy.38
Thus Table 2 suggests that, accounting for geographical and socio-economic factors that
are associated with the timing of the Neolithic Revolution as well as with contemporary life ex-
pectancy, there exists an additional highly significant positive effect of the time passed since the
Neolithic Revolution on contemporary life expectancy. Every 1000 years of earlier Neolithic tran-
sition results in 1.63-1.90 additional years of life expectancy, beyond the potential contribution of
an earlier Neolithic transition, and the geographical factors that permitted it, to contemporary
life expectancy.
37The sample in Regression 7 is smaller, consisting of 68 countries for which data on education in the year 1960and the rest of the variables is available. It should be noted that for the same sample of 68 countries, the coefficientremain nearly the same (i.e., 1.78) if one controls instead for education in the year 2000. Moreover, controllinginstead for income per capita and the level of education in the year 1980 does not alter the results. The coefficienton the time passed since the Neolithic Revolution remains highly significant and slightly higher at a level of 1.77years of life expectancy for every 1000 years of earlier transition.38Similarly, if the sample is restricted to the 50 (32) countries whose at least 75% (95%) of their population are
descendants of native in the country in the year 1500, every 1000 years of earlier Neolithic transition results in 1.61(1.31) additional years of life expectancy.
21
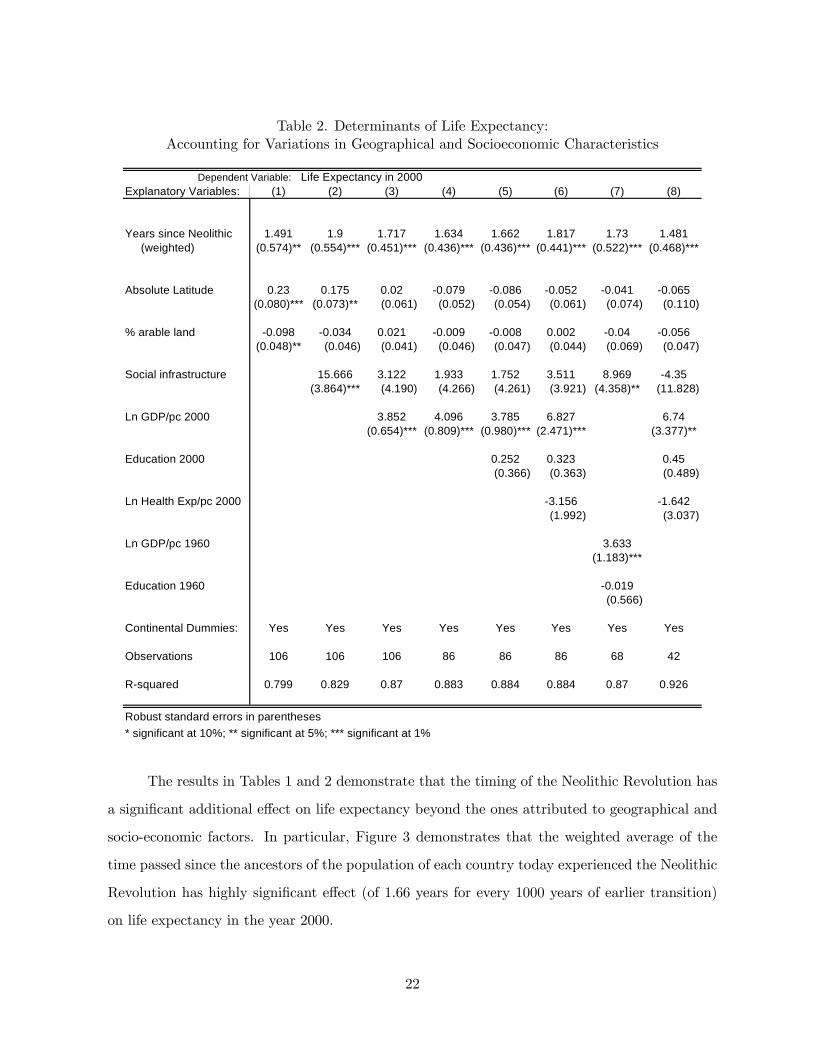
Table 2. Determinants of Life Expectancy:Accounting for Variations in Geographical and Socioeconomic Characteristics
Dependent Variable: Life Expectancy in 2000Explanatory Variables: (1) (2) (3) (4) (5) (6) (7) (8)
Years since Neolithic 1.491 1.9 1.717 1.634 1.662 1.817 1.73 1.481 (weighted) (0.574)** (0.554)*** (0.451)*** (0.436)*** (0.436)*** (0.441)*** (0.522)*** (0.468)***
Absolute Latitude 0.23 0.175 0.02 -0.079 -0.086 -0.052 -0.041 -0.065(0.080)*** (0.073)** (0.061) (0.052) (0.054) (0.061) (0.074) (0.110)
% arable land -0.098 -0.034 0.021 -0.009 -0.008 0.002 -0.04 -0.056(0.048)** (0.046) (0.041) (0.046) (0.047) (0.044) (0.069) (0.047)
Social infrastructure 15.666 3.122 1.933 1.752 3.511 8.969 -4.35(3.864)*** (4.190) (4.266) (4.261) (3.921) (4.358)** (11.828)
Ln GDP/pc 2000 3.852 4.096 3.785 6.827 6.74(0.654)*** (0.809)*** (0.980)*** (2.471)*** (3.377)**
Education 2000 0.252 0.323 0.45(0.366) (0.363) (0.489)
Ln Health Exp/pc 2000 -3.156 -1.642(1.992) (3.037)
Ln GDP/pc 1960 3.633(1.183)***
Education 1960 -0.019(0.566)
Continental Dummies: Yes Yes Yes Yes Yes Yes Yes Yes
Observations 106 106 106 86 86 86 68 42
R-squared 0.799 0.829 0.87 0.883 0.884 0.884 0.87 0.926
Robust standard errors in parentheses* significant at 10%; ** significant at 5%; *** significant at 1%
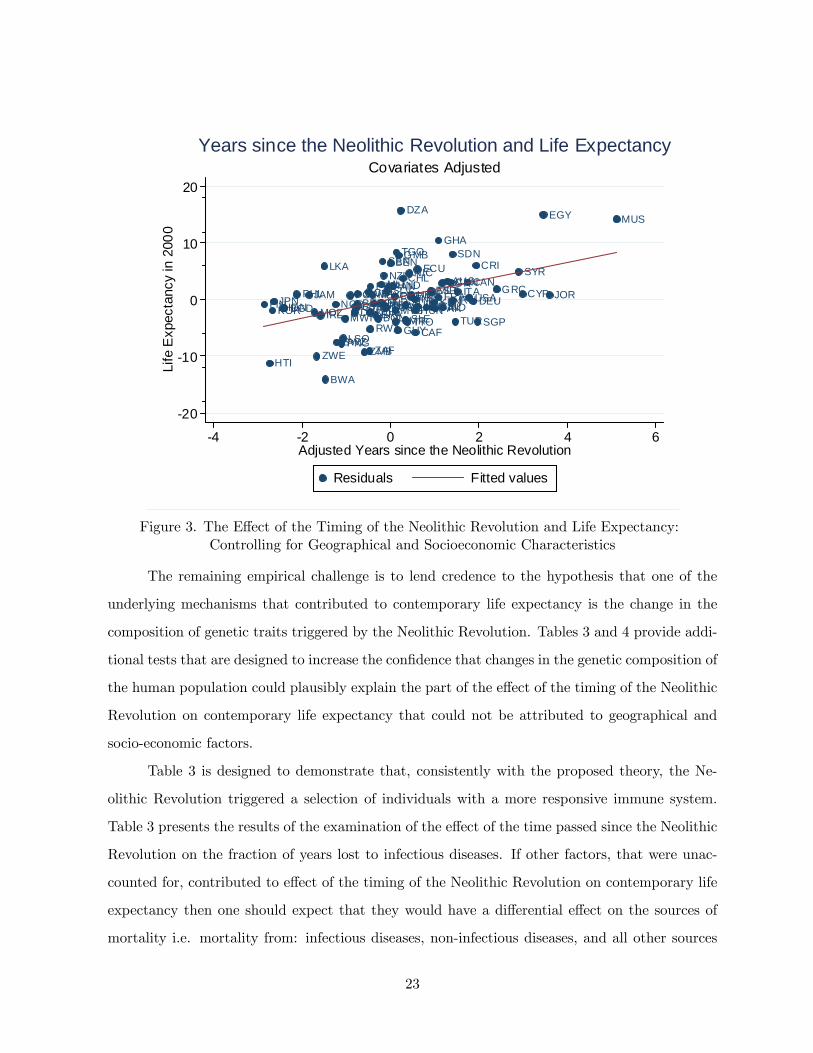
The results in Tables 1 and 2 demonstrate that the timing of the Neolithic Revolution has
a significant additional effect on life expectancy beyond the ones attributed to geographical and
socio-economic factors. In particular, Figure 3 demonstrates that the weighted average of the
time passed since the ancestors of the population of each country today experienced the Neolithic
Revolution has highly significant effect (of 1.66 years for every 1000 years of earlier transition)
on life expectancy in the year 2000.
22
ARG
AUS
AUTBEL
BEN
BGD
BGR
BOLBRA
BWA
CAF
CANCHE
CHL CHN
CMRCOG
COL
CRI
CYPDEU
DNKDOM
DZA
ECU
EGY
ESPFIN
FRAGBR
GHAGMB
GRC
GTM
GUY
HND
HTI
HUNIDN INDIRL
IRNISRITAJAM JORJPN KEN
KOR
LKA
LSO
MEXMLI MLT
MOZ
MUS
MWIMYS
NER
NIC
NLDNOR
NZL
PAK
PAN
PERPHL
PNG
POL PRTPRY
RWA
SDNSEN
SGPSLE
SLVSWE
SWZ
SYR
TGO
THATTO TUR
UGAURY USAVEN
ZAF
ZAR
ZMBZWE
-20
-10
0
10
20Li
fe E
xpec
tanc
y in
200
0
-4 -2 0 2 4 6Adjusted Years since the Neolithic Revolution
Residuals Fitted values
Covariates AdjustedYears since the Neolithic Revolution and Life Expectancy
Figure 3. The Effect of the Timing of the Neolithic Revolution and Life Expectancy:Controlling for Geographical and Socioeconomic Characteristics
The remaining empirical challenge is to lend credence to the hypothesis that one of the
underlying mechanisms that contributed to contemporary life expectancy is the change in the
composition of genetic traits triggered by the Neolithic Revolution. Tables 3 and 4 provide addi-
tional tests that are designed to increase the confidence that changes in the genetic composition of
the human population could plausibly explain the part of the effect of the timing of the Neolithic
Revolution on contemporary life expectancy that could not be attributed to geographical and
socio-economic factors.
Table 3 is designed to demonstrate that, consistently with the proposed theory, the Ne-
olithic Revolution triggered a selection of individuals with a more responsive immune system.
Table 3 presents the results of the examination of the effect of the time passed since the Neolithic
Revolution on the fraction of years lost to infectious diseases. If other factors, that were unac-
counted for, contributed to effect of the timing of the Neolithic Revolution on contemporary life
expectancy then one should expect that they would have a differential effect on the sources of
mortality i.e. mortality from: infectious diseases, non-infectious diseases, and all other sources
23
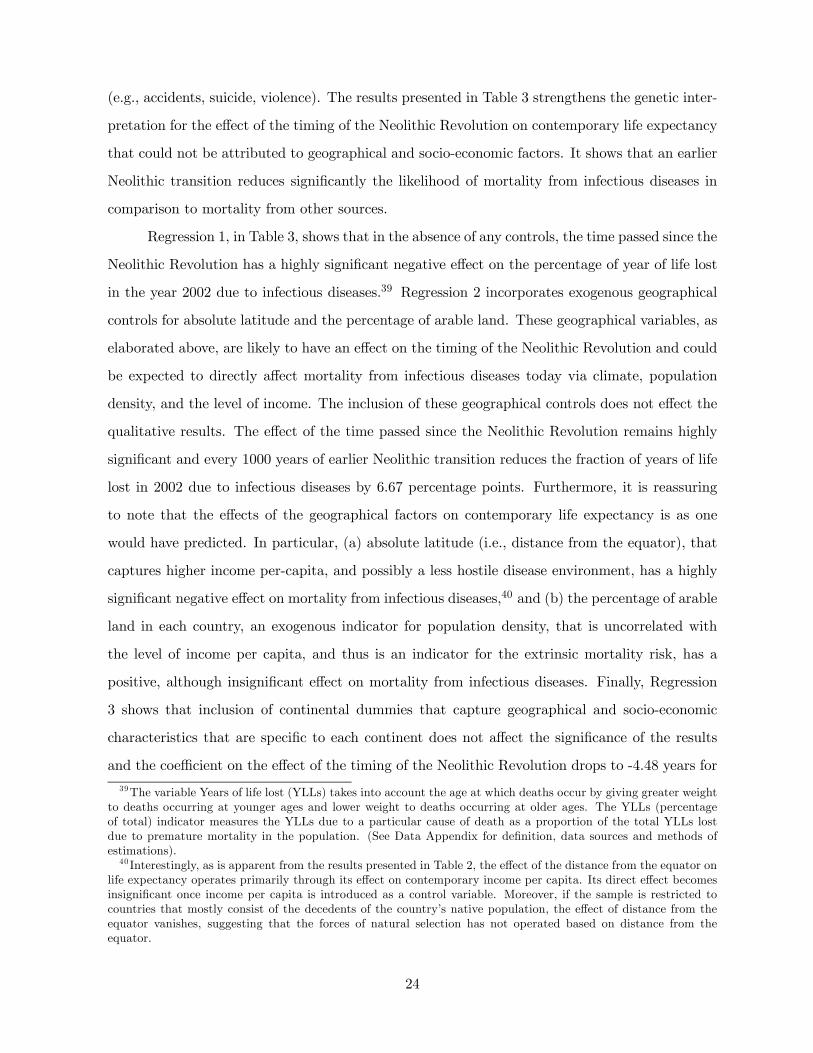
(e.g., accidents, suicide, violence). The results presented in Table 3 strengthens the genetic inter-
pretation for the effect of the timing of the Neolithic Revolution on contemporary life expectancy
that could not be attributed to geographical and socio-economic factors. It shows that an earlier
Neolithic transition reduces significantly the likelihood of mortality from infectious diseases in
comparison to mortality from other sources.
Regression 1, in Table 3, shows that in the absence of any controls, the time passed since the
Neolithic Revolution has a highly significant negative effect on the percentage of year of life lost
in the year 2002 due to infectious diseases.39 Regression 2 incorporates exogenous geographical
controls for absolute latitude and the percentage of arable land. These geographical variables, as
elaborated above, are likely to have an effect on the timing of the Neolithic Revolution and could
be expected to directly affect mortality from infectious diseases today via climate, population
density, and the level of income. The inclusion of these geographical controls does not effect the
qualitative results. The effect of the time passed since the Neolithic Revolution remains highly
significant and every 1000 years of earlier Neolithic transition reduces the fraction of years of life
lost in 2002 due to infectious diseases by 6.67 percentage points. Furthermore, it is reassuring
to note that the effects of the geographical factors on contemporary life expectancy is as one
would have predicted. In particular, (a) absolute latitude (i.e., distance from the equator), that
captures higher income per-capita, and possibly a less hostile disease environment, has a highly
significant negative effect on mortality from infectious diseases,40 and (b) the percentage of arable
land in each country, an exogenous indicator for population density, that is uncorrelated with
the level of income per capita, and thus is an indicator for the extrinsic mortality risk, has a
positive, although insignificant effect on mortality from infectious diseases. Finally, Regression
3 shows that inclusion of continental dummies that capture geographical and socio-economic
characteristics that are specific to each continent does not affect the significance of the results
and the coefficient on the effect of the timing of the Neolithic Revolution drops to -4.48 years for
39The variable Years of life lost (YLLs) takes into account the age at which deaths occur by giving greater weightto deaths occurring at younger ages and lower weight to deaths occurring at older ages. The YLLs (percentageof total) indicator measures the YLLs due to a particular cause of death as a proportion of the total YLLs lostdue to premature mortality in the population. (See Data Appendix for definition, data sources and methods ofestimations).40 Interestingly, as is apparent from the results presented in Table 2, the effect of the distance from the equator on
life expectancy operates primarily through its effect on contemporary income per capita. Its direct effect becomesinsignificant once income per capita is introduced as a control variable. Moreover, if the sample is restricted tocountries that mostly consist of the decedents of the country’s native population, the effect of distance from theequator vanishes, suggesting that the forces of natural selection has not operated based on distance from theequator.
24

every 1000 years of earlier transition.
Regression 4 of Table 3 replicates Regression 3 of Table 3 for the sample of 86 countries
for which the data of socio-economic characteristics is available. It shows that for this sample
of 86 countries, the effect of the time passed since the Neolithic Revolution is highly significant
and every 1000 years of earlier Neolithic transition reduces the fraction of years of life lost in
2002 due to infectious diseases by 3.42 percentage points. Regression 5 controls for the social
environment index of Hall and Jones (1998)), that is highly correlated (0.81) with the level of
income per capita in the year 2000, but is plausibly exogenous to life expectancy in the year 2000.
The effect of the time passed since the Neolithic Revolution remains highly significant and every
1000 years of earlier Neolithic transition reduces the fraction of years of life lost in 2002 due to
infectious diseases by 4.23 percentage points. Regressions 6, adds additional controls for socio-
economic development (i.e., income per-capita, education, and health expenditure per capita)
that are likely to be affected by the level of life expectancy in the year 2000. It is important to
note that their inclusion has a minor impact on the magnitude of the effect of the time passed
since the Neolithic on contemporary life expectancy. As one would expect, the level of income
per capita and the level of education have highly significant negative effect on mortality from
infectious diseases.41 Nevertheless, the effect of the time passed since the Neolithic Revolution
on life expectancy remains highly significant and rather stable and every 1000 years of earlier
Neolithic transition reduces the fraction of years of life lost in 2002 due to infectious diseases by
3.91 percentage points.
Thus Table 3 suggests that the channel through which the timing of the Neolithic Rev-
olution affect contemporary life expectancy is through reduction in mortality from infectious
diseases, lending credence to the hypothesis that a selection of genetic pre-disposition towards a
more responsive immune system that was triggered by the Neolithic Revolution is a major factor
41Health expenditure per capita, which is highly correlated with income per capita, has an insignificant effect onmortality from infectious diseases.
25
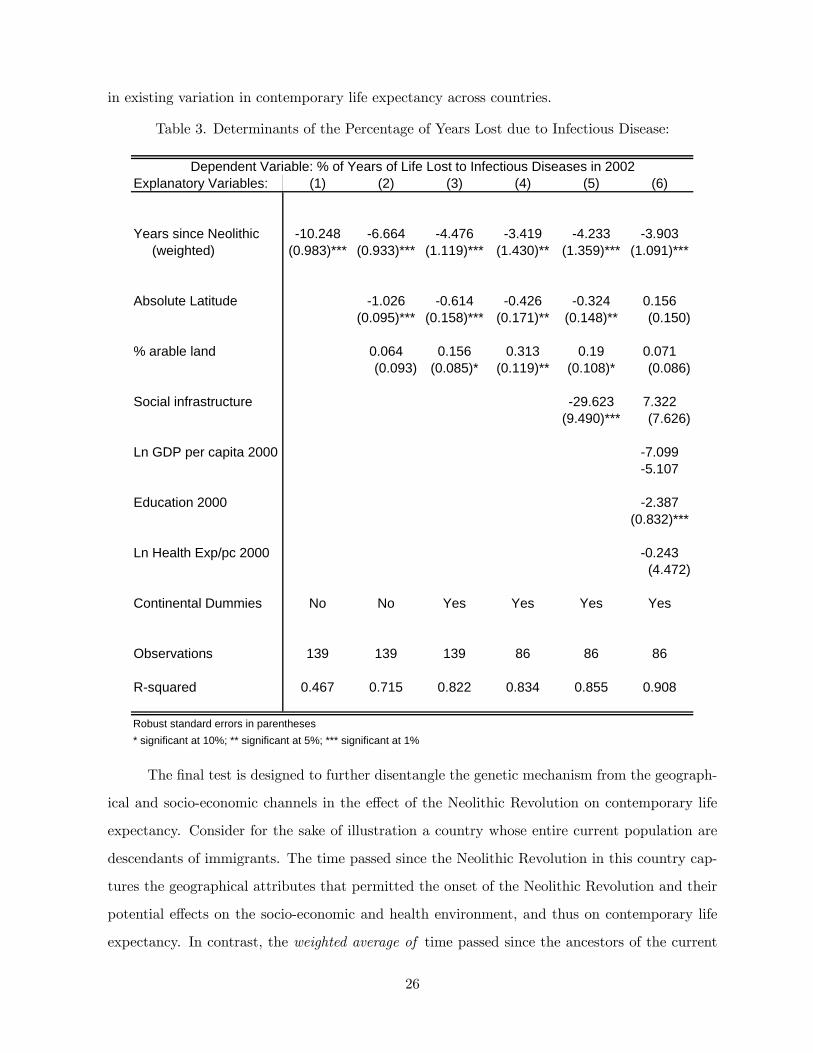
in existing variation in contemporary life expectancy across countries.
Table 3. Determinants of the Percentage of Years Lost due to Infectious Disease:
Explanatory Variables: (1) (2) (3) (4) (5) (6)
Years since Neolithic -10.248 -6.664 -4.476 -3.419 -4.233 -3.903 (weighted) (0.983)*** (0.933)*** (1.119)*** (1.430)** (1.359)*** (1.091)***
Absolute Latitude -1.026 -0.614 -0.426 -0.324 0.156(0.095)*** (0.158)*** (0.171)** (0.148)** (0.150)
% arable land 0.064 0.156 0.313 0.19 0.071(0.093) (0.085)* (0.119)** (0.108)* (0.086)
Social infrastructure -29.623 7.322(9.490)*** (7.626)
Ln GDP per capita 2000 -7.099-5.107
Education 2000 -2.387(0.832)***
Ln Health Exp/pc 2000 -0.243(4.472)
Continental Dummies No No Yes Yes Yes Yes
Observations 139 139 139 86 86 86
R-squared 0.467 0.715 0.822 0.834 0.855 0.908
* significant at 10%; ** significant at 5%; *** significant at 1%
Dependent Variable: % of Years of Life Lost to Infectious Diseases in 2002
Robust standard errors in parentheses
The final test is designed to further disentangle the genetic mechanism from the geograph-
ical and socio-economic channels in the effect of the Neolithic Revolution on contemporary life
expectancy. Consider for the sake of illustration a country whose entire current population are
descendants of immigrants. The time passed since the Neolithic Revolution in this country cap-
tures the geographical attributes that permitted the onset of the Neolithic Revolution and their
potential effects on the socio-economic and health environment, and thus on contemporary life
expectancy. In contrast, the weighted average of time passed since the ancestors of the current
26
population experienced the Neolithic Revolution, capture only the traits that are embodied in
the current population and were transmitted intergenerationally either genetically or culturally.
In the existing data set, the average fraction of the native population is about 0.72, and the
standard error is about 0.34. Thus, the weighted average of the time passed since the ancestors
of the population of each country today experienced the Neolithic Revolution, places more weight
on the “portable” component of the Neolithic experience. Namely, the component that the pop-
ulation today inherited from their non-native ancestors. In contrast, the time passed since the
Neolithic Revolution in each country, places relatively more weight on the effect of the Neolithic
transition on individuals via the geographical mechanism.
We exploit the difference between the time passed since the Neolithic Revolution in each
country and the weighted average of time passed since the ancestors of the population of each
country today experienced the Neolithic Revolution to disentangle the genetic mechanism from
the geographical and socio-economic channels in the effect of the Neolithic Revolution on con-
temporary life expectancy. 42
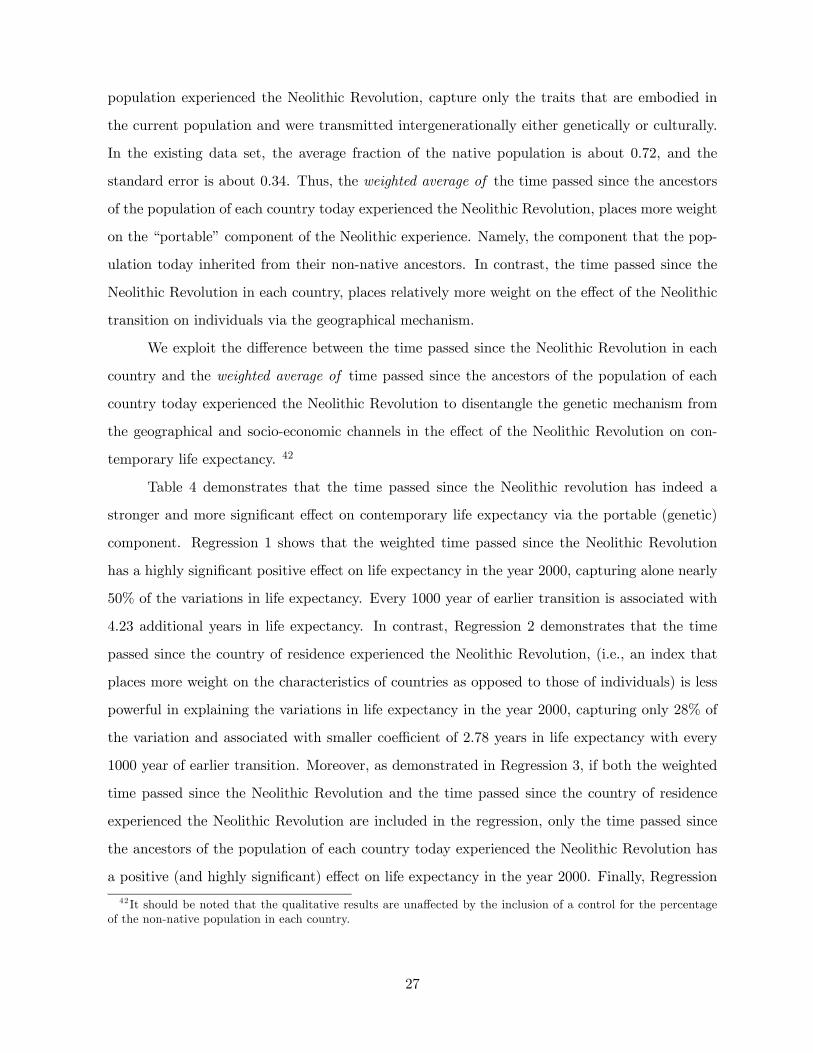
Table 4 demonstrates that the time passed since the Neolithic revolution has indeed a
stronger and more significant effect on contemporary life expectancy via the portable (genetic)
component. Regression 1 shows that the weighted time passed since the Neolithic Revolution
has a highly significant positive effect on life expectancy in the year 2000, capturing alone nearly
50% of the variations in life expectancy. Every 1000 year of earlier transition is associated with
4.23 additional years in life expectancy. In contrast, Regression 2 demonstrates that the time
passed since the country of residence experienced the Neolithic Revolution, (i.e., an index that
places more weight on the characteristics of countries as opposed to those of individuals) is less
powerful in explaining the variations in life expectancy in the year 2000, capturing only 28% of
the variation and associated with smaller coefficient of 2.78 years in life expectancy with every
1000 year of earlier transition. Moreover, as demonstrated in Regression 3, if both the weighted
time passed since the Neolithic Revolution and the time passed since the country of residence
experienced the Neolithic Revolution are included in the regression, only the time passed since
the ancestors of the population of each country today experienced the Neolithic Revolution has
a positive (and highly significant) effect on life expectancy in the year 2000. Finally, Regression
42 It should be noted that the qualitative results are unaffected by the inclusion of a control for the percentageof the non-native population in each country.
27
4 demonstrates that once all the geographical and socio-economic controls, used in Table 2, are
included, the effect of the portable (genetic) component as captured by the weighted years since
the Neolithic Revolution remains positive, highly significant, and stable relative to its magnitude
in table 2, whereas the effect of, the more geographically-based, years since transition nearly
vanishes.Table 4. Determinants of Life Expectancy:
Country-Specific vs. Individual-Specific Characteristics
Explanatory Variables: (1) (2) (3) (4)
Years since Neolithic 4.229 6.873 1.885 (weighted) (0.389)*** (0.542)*** (0.699)***
Years since Neolithic 2.777 -2.619 -0.072 (unweighted) (0.392)*** (0.421)*** (0.635)
Absolute Latitude -0.052(0.061)
% arable land 0.002(0.045)
Social infrastructure 3.52(3.944)
Ln GDP per capita 2000 6.82(2.498)***
Education 2000 0.314(0.358)
Ln Health Exp/pc 2000 -3.155(2.008)
Continental Dummies No No No Yes
Observations 139 139 139 86
R-squared 0.498 0.276 0.549 0.888
Dependent Variable: Life Expectancy in 2000
Robust standard errors in parentheses* significant at 10%; ** significant at 5%; *** significant at 1%
It should be noted that there is a strong positive correlation between the unadjusted years
since transitions and the percentage of the population who are descendants of natives in the same
country in the year 1500. Namely, countries that experienced the Neolithic revolution later and
28
thus had lower population density, were more attractive to migrants. Thus, the positive correla-
tion between the timing of the Neolithic Revolution and contemporary life expectancy does not
reflect a selection of individuals with higher life expectancy into regions that are geographically
more prosperous, as reflected by earlier Neolithic Transition.
Thus, the empirical analysis demonstrates that a significant portion of contemporary vari-
ations in life expectancy across countries can be traced to the weighted average of the time passed
since the ancestors of the population of each country today experienced the Neolithic Revolu-
tion. In particular, controlling for geographical and continental characteristics of each country,
as well as for the contemporary socio-economic environment, every 1000 years of earlier Neolithic
transition results in 1.65-1.9 additional years of life expectancy. Thus, for instance, the Euro-
pean population that experienced the Neolithic Revolution on average 3160 years earlier than
the African population would be expected to live more than 5 years longer, even if the gap in the
socioeconomic conditions between these continents will be eliminated. Alternatively, Americans
from European decent would be expected to live five years longer than Americans from African
decent with similar socioeconomic background.
5 Concluding Remarks
This research advances an evolutionary theory and provides empirical evidence that shed new
light on the origins of contemporary differences in life expectancy across countries. The theory
suggests that social, economic and environmental changes that were associated with the Neolithic
Revolution affected the nature of the environmental hazards confronted by the human population,
triggering an evolutionary process that had a significant impact on human longevity. The theory
predicts that in a given socioeconomic environment descendants of people from regions that
experienced the Neolithic Revolution earlier would have a higher life expectancy in comparison
to descendants of people from regions that experienced the Neolithic Revolution later.
We exploit variations in the average time passed since the ancestors of the population of
each country today experienced the Neolithic Revolution, as well as contemporary differences in
life expectancy across countries, to identify the impact of the time passed since the Neolithic
Revolution on life expectancy. Accounting for the contribution of geographical attributes and
socio-economic factors to the observed cross country correlation between the timing of the Ne-
olithic Revolution and contemporary life expectancy, we demonstrate that the timing of the
29
Neolithic Revolution has a significant additional effect on life expectancy that could be plausibly
attributed to changes in the genetic composition of the human population.
The empirical analysis shows that a significant portion of contemporary variations in life
expectancy across countries can be traced to the weighted average of the time passed since
the ancestors of the population of each country today experienced the Neolithic Revolution.
In particular, controlling for geographical and continental characteristics of each country, as
well as for the contemporary socio-economic environment, every 1000 years of earlier Neolithic
transition results in 1.65-1.9 additional years of life expectancy. Thus, for instance, the European
population that experienced the Neolithic Revolution on average 3160 years earlier than the
African population would be expected to live more than 5 years longer, even if the gap in the
socioeconomic conditions between these continents will be eliminated. Alternatively, Americans
from European decent would be expected to live five years longer than Americans from African
decent with similar socioeconomic background.
30
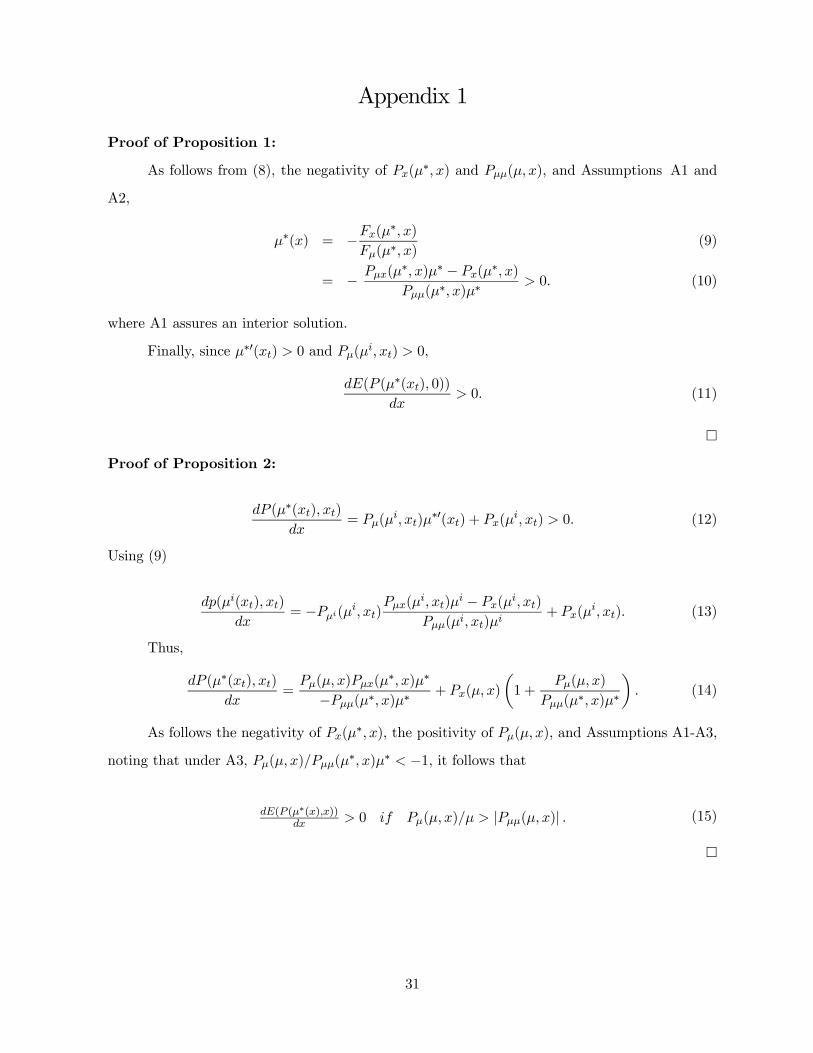
Appendix 1
Proof of Proposition 1:
As follows from (8), the negativity of Px(μ∗, x) and Pμμ(μ, x), and Assumptions A1 and
A2,
μ∗(x) = −Fx(μ∗, x)
Fμ(μ∗, x)(9)
= − Pμx(μ∗, x)μ∗ − Px(μ
∗, x)
Pμμ(μ∗, x)μ∗> 0. (10)
where A1 assures an interior solution.
Finally, since μ∗0(xt) > 0 and Pμ(μi, xt) > 0,
dE(P (μ∗(xt), 0))
dx> 0. (11)
¤
Proof of Proposition 2:
dP (μ∗(xt), xt)
dx= Pμ(μ
i, xt)μ∗0(xt) + Px(μ
i, xt) > 0. (12)
Using (9)
dp(μi(xt), xt)
dx= −Pμi(μi, xt)
Pμx(μi, xt)μ
i − Px(μi, xt)
Pμμ(μi, xt)μi+ Px(μ
i, xt). (13)
Thus,
dP (μ∗(xt), xt)
dx=
Pμ(μ, x)Pμx(μ∗, x)μ∗
−Pμμ(μ∗, x)μ∗+ Px(μ, x)
µ1 +
Pμ(μ, x)
Pμμ(μ∗, x)μ∗
¶. (14)
As follows the negativity of Px(μ∗, x), the positivity of Pμ(μ, x), and Assumptions A1-A3,
noting that under A3, Pμ(μ, x)/Pμμ(μ∗, x)μ∗ < −1, it follows that
dE(P (μ∗(x),x))dx > 0 if Pμ(μ, x)/μ > |Pμμ(μ, x)| . (15)
¤
31
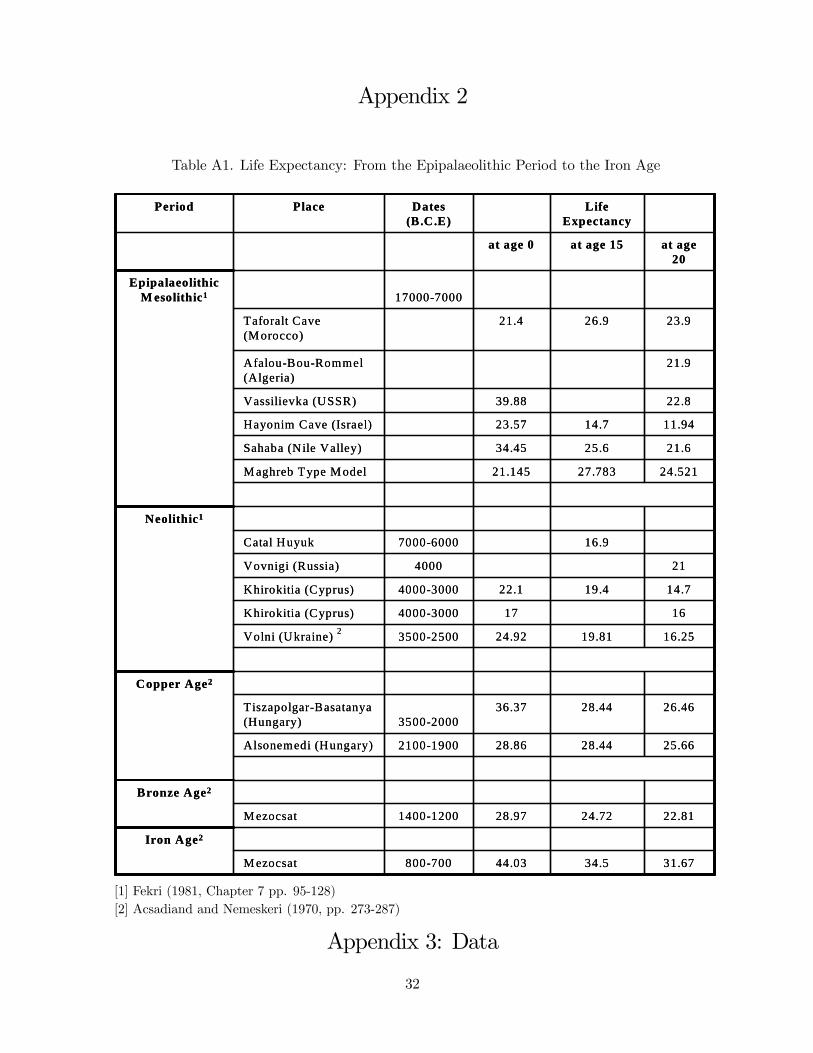
Appendix 2
Table A1. Life Expectancy: From the Epipalaeolithic Period to the Iron Age
31.6734.544.03800-700 M ezocsat
Iron Age2
22.8124.7228.971400-1200 M ezocsat
Bronze Age2
25.6628.4428.862100-1900Alsonemedi (Hungary)
26.4628.4436.373500-2000
Tiszapolgar-Basatanya(Hungary)
Copper Age2
16.2519.8124.923500-2500Volni (Ukraine) 2
16174000-3000Khirokitia (Cyprus)
14.719.422.14000-3000Khirokitia (Cyprus)
214000Vovnigi (Russia)
16.97000-6000Catal Huyuk
Neolithic1
24.52127.78321.145M aghreb Type M odel
21.625.634.45Sahaba (Nile Valley)
11.9414.723.57Hayonim Cave (Israel)
22.839.88Vassilievka (USSR)
21.9Afalou-Bou-Rommel(Algeria)
23.926.921.4Taforalt Cave (M orocco)
17000-7000Epipalaeolithic
M esolithic1
at age 20
at age 15at age 0
Life Expectancy
Dates (B.C.E)
PlacePeriod
[1] Fekri (1981, Chapter 7 pp. 95-128)[2] Acsadiand and Nemeskeri (1970, pp. 273-287)
Appendix 3: Data
32
Life expectancy at birth in the year 2000. Source: World Development Indicators.
Income Per-Capita in the years 1960, 1980, 2000. Source: World Development Indicators.
Education: Average schooling years in the total population over age 25. Sources: Barro
and Lee (1993).
Health Expenditure Per Capita. Source: World Development Indicators.
Years Passed since the Neolithic Revolution. Source: Putterman (2006).
Weighted Years Passed since the Neolithic Revolution. The weighted average of the timing
in which the ancestors of the population of each country today experienced the Neolithic Rev-
olution. Using the recently compiled data set on the timing of the Neolithic Revolution across
different regions of the world (Putterman, 2006), as well as the data on post-1500 migratory
patterns across the globe (Putterman, 2007), we calculate the weighted average of the timing in
which the population of each country experienced the Neolithic Revolution.
Percentage of Arable Land. Source: World Development Indicators.
Absolute Latitude. Source: CIA World Factbook. Absolute Latitude of the capital of each
country.
Years of life lost to communicable diseases (%) . Source: World Health Organization.
Years of life lost (YLLs) take into account the age at which deaths occur by giving greater weight
to deaths occurring at younger ages and lower weight to deaths occurring at older ages. The
YLLs (percentage of total) indicator measures the YLLs due to a particular cause of death as
a proportion of the total YLLs lost due to premature mortality in the population. (See Data
Appendix for: definition, data sources and methods of estimations).
Years of Life Lost (YLLs) due to infectious are calculated from the number of deaths
multiplied by a standard life expectancy at the age at which death occurs. The standard life
expectancy used for YLLs at each age is the same for deaths in all regions of the world and is
the same as that used for the calculation of disability-adjusted life years (DALYs). Additionally,
3% time discounting and non-uniform age weights that give less weight to years lived at young
and older ages were used, as for the DALY. With non-uniform age weights and 3% discounting,
a death in infancy corresponds to 33 YLLs, and deaths at age 5 to 20 years to around 36 YLLs.
33

Death registration data for 112 WHO Member States, sample registration systems (In-
dia, China), available data on child and adult mortality from censuses and surveys, together
with population-based epidemiological studies, disease registers and notifications systems for the
estimation of mortality due to 21 specific causes of death.
Life tables specifying all-cause mortality rates by age and sex for 192 WHO Member States
were developed from available death registration data for 2002, sample registration systems (In-
dia, China) and data on child and adult mortality from censuses and surveys. Cause-of-death
distributions were estimated from death registration data for 107 countries, together with data
from population-based epidemiological studies, disease registers and notifications systems for se-
lected specific causes of death. Causes of death for populations without usable death-registration
data were estimated using cause-of-death models together with data from population-based epi-
demiological studies, disease registers and notifications systems for 21 specific causes of death.
Using the recently compiled data set on the timing of the Neolithic Revolution across different
regions of the world (Putterman, 2006), as well as the data on post-1500 migratory patterns
across the globe (Putterman, 2007), we calculate the weighted average of the timing in which the
population of each country experienced the Neolithic Revolution.
The index of Social Infrastructure, Source: Hall and Jones (1998). It is an equally-weighted
average of two other indexes: Government Antidiversion Policy Index and Years Open Index. The
Government Antidiversion Policy Index, follows Knack and Keefer (1995) as the equally-weighted
average of the following five variables from the International Country Risk Guide compiled by
Political Risk Services: (1) law and order, (2) bureaucratic quality, (3) corruption, (4) risk of
expropriation, and (5) government repudiation of contracts. Each of these variables is assigned
its 10-yr average value across the period spanning 1985-1996. The index is normalized to take
values in the [0,1]-interval. The Years Open Index, follows Sachs and Warner (1995) as measuring
the fraction of years during the period 1950-1994 that the country is ”open” where openness is
satisfied if all the following conditions hold: (1) non-tariff barriers cover less than 40% of trade, (2)
average tariff rates are less than 40%, (3) black market premium was less than 20% in the 1970s
and 1980s, (4) not classified as a socialist by Kornai (1992), and (5) no government monopoly on
major exports. The index takes on values in the [0,1]-interval.
34
References
[1] Acsa’di, G.Y., and J. Nemeskeri, (1970), History of Human Life Span and Mortality,(Akademiai Kiado, Budapest).
[2] Barro R. and J. Lee, (1993), “International Comparisons of Educational Attainment,” NBERWorking Paper.
[3] Bairoch, P. (1988), Cities and Economic Development (The University of Chicago Press,Chicago).
[4] Becker, G. (1976), “Altruism, Egoism and Genetic Fitness: Economics and Sociobiology”,Journal of Economic Literature, 14, 817-826
[5] Benaim, M. and J. Weibull (2003) “Deterministic Approximation of Stochastic Evolution inGames”, Econometrica 71, 873-903.
[6] Bisin, A., and T. Verdier (2000), “Beyond the Melting Pot: Cultural Transmission, Marriage,and the Evolution of Ethnic and Religious Traits”, Quarterly Journal of Economics 115:955-988.
[7] Borghans, J.A.M., L. Borghans and B. ter-Weel, (2004), “Economic Performance,HumanCooperation,and the Major Histocompatibility Complex,” Maastricht.
[8] Boserup, E., (1965). The Conditions of Agricultural Progress, (Aldine Publishing Company,Chicago).
[9] Botticini M. and A. Siow (2005) "The Value of Sons in Pre-modern Economies: A Viewfrom the Marriage Market", Boston Universty.
[10] Boucekkine, R, D. de la Croix and O. Licandro.(2003), “Early Mortality Declines at theDawn of Modern Growth,” Scandinavian Journal of Economics, 105: 401-418.
[11] Bowles, S. (1998), “Endogenous Preferences: The Cultural Consequences of Markets andother Economic Institutions,” Journal of Economic Literature 36: 75-111.
[12] Boyd, R., and P.J. Richardson (1985), Culture and the Evolutionary Process (University ofChicago Press, Chicago).
[13] Boyer, G. (1989), “Malthus was Right After All: Poor Relief and Birth Rates in South-Eastern England”, Journal of Political Economy 97: 93-114.
[14] Cavalli-Sforza, L.L., and M.W. Feldman (1981), Cultural Transmission and Evolution: AQuantitative Approach (Princeton University Press, Princeton).
[15] Cervellati, M. and U. Sunde (2005), “Human Capital Formation, Life Expectancy, and theProcess of Development ,” American Economic Review, 95, 1653-1672.
[16] Clark, G. and G. Hamilton. (2006), “Survival of the Richest: The Malthusian Mechanism inPre-Industrial England” Journal of Economic History, 66: 707-736
[17] Cody, M. L. (1966), “A General Theory of Clutch Size,” Evolution, 20 174-184.
[18] Cohen M. N.,(1989), Health and the Rise of Civilization (Yale Uni. Press: New Haven).
[19] Dawkins, R. (1989), The Selfish Gene (Oxford University Press, Oxford).
35
[20] De Vries, J. (1984). European Urbanization, 1500-1800 (Harvard University Press, Cam-bridge).
[21] Diamond, J. (1997),.Guns, Germs, and Steel: The Fates of Human Societies.(Norton, NewYork).
[22] Durham, W. (1982), “Interaction of Genetic and Cultural Evolution: Models and Examples”,Human Ecology 10: 289-323.
[23] Endler, J.A. (1986), Natural Selection in the Wild (Princeton University Press, Princeton).
[24] Erlich, I. and F. T. Lui (1991), “Intergenerational trade, Longevity, and Economic Growth,”Journal of Political Economy 99: 1029-1059.
[25] Fekri, A. H., (1981), Demographic Archaeology, (Academic Press: New York).
[26] Fogel, R. W.(1994), “Economic Growth, Population Theory, and Physiology: The Bearingof Long-Term Processes on the Making of Economic Policy.” American Economic Review84: 369-95.
[27] Galor, O. and O. Moav (2002), “Natural Selection and the Origin of Economic Growth”,Quarterly Journal of Economics 117: 1133-1192.
[28] Galor, O. and D.N. Weil (1999), “From Malthusian Stagnation to Modern Growth”, Amer-ican Economic Review, 89: 150-154.
[29] Grant, B.R. and P.R. Grant (1989), Evolutionary Dynamics of a Natural Population (Uni-versity of Chicago Press, Chicago).
[30] Hansson, I., and C. Stuart (1990), “Malthusian Selection of Preferences”, American Eco-nomic Review 80: 529-544.
[31] Hazan, M. and H. Zoabi (2004). “Longevity, Fertility and Economic Growth,” Hebrew Uni-versity.
[32] Iyigun, M. F. (2005), “Geography, Demography, and Early Development,” Journal of Pop-ulation Economics 18, 301-321.
[33] Jones, E.L. (1981), The European Miracle: Environments, Economies and Geopolitics in theHistory of Europe and Asia (Cambridge University Press, Cambridge).
[34] Kalemli-Ozcan, S., H.E. Ryder and D. N. Weil (2000), “Mortality Decline, Human CapitalInvestment, and Economic Growth” Journal of Development Economics, 62: 1-23
[35] Kelly M. (2004) Living Standards and Population Growth: Malthus was Right. UniversityCollege Dublin.
[36] Kettlewell, H.B.D. (1973), The Evolution of Melanism (Clarendon Press, Oxford).
[37] Kirkwood T.B.L. (1998), Evolution Theory and the Mechanisms of Aging. In: Textbook ofGeriatric Medicine, 5th ed. (Brocklehurst JC, Tallis RC, eds). London: Churchill Livingstone,45-49.
[38] Kirkwood T.B.L (1977) “Evolution of Aging”, Nature, 270, 301-304.
36
[39] Kirkwood T.B.L and F.R.S. Holliday (1979) “The evolution of ageing and longevity”, Pro-ceedings of the Royal Society of London B 205: 531-546.
[40] Kohler, H., J.L. Rodgers and K. Christensen (1999), “Is Fertility Behavior in our Genes?Findings from a Danish Twin Study”, Population and Development Review 25: 253-263.
[41] Lack, D., (1954), The Natural Regulation of Animal Numbers (Oxford: Clarendon Press).
[42] Lagerlof, N., (2003), “From Malthus to Modern Growth: The Three Regimes Revisited”,International Economic Review 44: 755-777.
[43] Lagerlof, N.P. (2007), “Long-Run Trends in Human Body Size,” Macroeconomics Dynamics,11, 367-387
[44] Laxton, P. and N. Williams (1989) “Urbanization and Infant Mortality in England”, inM.C. Nelson and J. Rogers, eds. Urbanization and the Epidemiological Transition UppsalaUniversity.
[45] Lee R. D. (2003) “Rethinking the evolutionary theory of aging: Transfers, not births,shapesenescence in social species” PNAS, 100, 9637-42.
[46] Livi-Bacci, M. (1997), A Concise History of World Population (Blackwel, Oxford).
[47] Livingston F, (1958), “Anthropological Implications of Sickle Cell Distribution in WestAfrica”, American Anthropologist 60: 533-562.
[48] Malthus, T.R. (1798), An Essay on the Principle of Population (printed for J. Johnson, inSt. Paul’s Church-Yard, London).
[49] McNeil, W.H., 1998, Plagues and Peoples, Anchor press, Doublebay.
[50] Medawar, P.B. (1952) An Unsolved Problem of Biology H.K. Lewis & Co. London
[51] Mekel-Bobrov, N., S. L. Gilbert, P. D. Evans, E. J. Vallender, J. R. Anderson, R. R. Hudson,S. A. Tishkoff, and B.T. Lahn (2005), “Ongoing Adaptive Evolution of ASPM, a Brain SizeDeterminant in Homo sapiens.” Science 309, 1720-1722.
[52] Mokyr, J.(1998), “Induced Technical Innovation and Medical History: An EvolutionaryApproach.” Journal of Evolutionary Economics, 8: 119-137.
[53] Ofek, H. (2001), Second Nature: Economic origin of Human evolution. Cambridge: Cam-bridge University Press.
[54] Putterman, L. (2006) “Agricultural Transition Year Country Data Set”, Brown University.
[55] Putterman, L. (2007), “Agriculture, Diffusion, and Development: Ripple Effects of the Ne-olithic Revolution,” Economica (forthcoming).
[56] Reznick, David N., Michael J. Bryant, Derek Roff, Cameron K. Ghalambor and Dionna E.Ghalambor (2004), “Effect of Extrinsic Mortality on the Evolution of Senescence in Gup-pies,” Nature, 431, 1095-1099.
[57] Robson, A.J. (2002) “Evolution and Human Nature,” Journal of Economic Perspectives 16, 89-106.
37
[58] Robson A. J. and H. S. Kaplan (2003), “The Evolution of Human Longevity and Intelligencein Hunter-Gatherer Economies,” American Economic Review 93: 150-169.
[59] Rodgers, J.L., and D. Doughty (2000), “Genetic and Environmental Influences on FertilityExpectations and Outcomes Using NLSY Kinship Data”, in: J.L. Rodgers, D.C. Rowe andW.B. Miller, eds., Genetic Influences on Human Fertility and Sexuality (Kluwer, Boston).
[60] Rodgers, J.L., K. Hughes, H. Kohler, K. Christensen, D. Doughty, D.C. Rowe and W.B.Miller (2001a), “Genetic influence helps explain variation in human fertility: Evidence fromrecent behavioral and molecular genetic studies”, Current Directions in Psychological Science10: 184-188.
[61] Rodgers, J.L., H. Kohler, K. Ohm Kyvik, and K. Christensen (2001b), “Behavior GeneticModeling of Human Fertility: Findings from a Contemporary Danish Twin Study”, Demog-raphy 38: 29-42.
[62] Saint-Paul, G. (2003), “On Market and Human Evolution” CEPR Discussion Paper No.3654.
[63] Soares, R. R. (2005), “Mortality Reductions, Educational Attainment,and Fertility Choice,”American Economic Review, 95, 580-601
[64] Stearns, Stephen C. (1992), The Evolution of Life Histories, Oxford: Oxford UniversityPress.
[65] Steckel R. (2004): “The Best of Times, The Worse of Times: Health and Nutrition inPre-Columbian America” NBER.
[66] Strulik, H. (2007) ”Geography, Health, and Demo-Economic Development”, Journal of De-velopment Economics, 2007, forthcoming.
[67] Voight, B.F., S. Kudaravalli, (2006), X. Wen, and J.K. Pritchard. “A Map of Recent PositiveSelection in the Human Genome.” Plos Biology.
[68] Weil, D. (2005) "Accounting for the Effect of Health on Economic Growth" NBER, WorkingPaper 11455.
[69] Weisdorf, J. L. (2004) “From Stagnation to Growth: Revisiting Three Historical Regimes.”Journal of Population Economics, 17, 445-472,
[70] Wesidorf, J. L. (2006) “From Foraging to Farming: Explaining the Neolithic Revolution,”Journal of Economic Surveys, 19, 561-586.
[71] Weismann, A. (1882) Uber die Dauer des Lebens, Gustav Fischer, Jena, Germany.
[72] Weisenfeld, S.L. (1967), “Sickle Cell Trait in Human Biological and Cultural Evolution”,Science 157: 1135-1140.
[73] Westendorp, R.G.J., Kirkwood, T.B.L. (1998), “Human Longevity at the Cost of Reproduc-tive Success,” Nature, 396: 743—746.
[74] Williams, G. (1957) “Pleiotropy, Natural Selection and the Evolution of Senescence” Evo-lution 11, 398-411
[75] Williams P. D. and T. Day (2003) “Antagonistic Pleiotropy, Mortality Source Interactions,And The Evolutionary Theory Of Senescence” Evolution, 57, 1478-1488.
38

[76] Wilson, E.O. (1975), Sociobiology: The New Synthesis, Cambridge, Mass.: Harvard Univer-sity Press
[77] Wrigley, E.A., and R.S. Schofield (1981), The Population History of England 1541-1871: AReconstruction (Harvard University Press, Cambridge).
39