Embed Size (px)
Citation preview
The Neural Behavior of Male and Female Investors ∗
Joao Paulo Vieito† Rachel A. J. Pownall‡ Armando F. Rocha§
Fabio T. Rocha¶
December 1, 2014
Abstract
Risk preferences are known to be heterogeneous, in particular across genders.In this paper we provide striking evidence that brain activity associated withfinancial decision making differs between males and females. Using Electroen-cephalogram technology in an investment trading simulation we capture partic-ipants’ brain electric activity during the investment process and find that menuse different parts of the brain to make the same financial investment decisionsthan women. Furthermore we separately analyse decisions to buy, sell, and holdstocks, and find that whilst men use the same set of neural circuits to makeall three types of investment decisions, women use multiple areas. The resultsprovide evidence of why the decision making process for investment decisions issignificantly different between men and women. The findings help towards un-derstanding the heterogeneity of risk preferences when making financial decisionsand sheds light on some recent empirical findings in behavioral finance.
JEL Classification: G11; G12.Keywords: Neurofinance; Risk; Gender; Financial Decision-Making.
∗We are grateful for comments from participants at the 2014 FMA Asia Meetings in Tokyo, 2014Behavioural Finance Working Group Conference in London, 2013 World Finance Conference in Cyprus,and in particular Peter Bossaerts, Henrik Cronqvist, Meir Statman, Arno Riedl and Paul Smeets.†Dean and Professor of Finance, School of Business Studies, and Polytechnic Institute of
Viana do Castelo, Portugal. Address: Avenida Miguel Dantas, 4930 Valena, Portugal. Email:[email protected].‡Finance Department, Maastricht University, 6200MD Maastricht, The Netherlands, and TIAS
Business School, Tilburg University, 5000LE Tilburg, The Netherlands. Email [email protected].§Neuroscience Researcher at RANI and Professor at Medical School of Sao Paulo, Brazil. Address:
Rua Tenente Ary Aps, 172, 13207-110 Jundiaı, Brazil. Email: [email protected].¶Neuroscience Researcher at IPTI and RANI Research on Artificial and Natural Intelligence.
Address: Rua Tenente Ary Aps, 172, 13207-110 Jundiaı, Brazil. Email: [email protected].
1

1 Introduction
There is a wealth of evidence that documents gender issues. A body of literature
associates gender differences relating to discrimination in the workplace (Black and
Strahan, 2001; Goldin and Rouse, 2000 and Wenners and Wold, 1997) allocation of high
profile jobs (Bertrand and Hallock, 2001) and also higher total compensation (Blau and
Kahn, 2000) to men. According to Becker (1957) part of the difference in executive
compensation between men and women can be associated with differences in education.
Given that the difference in education has been diminishing over recent decades between
men and women across the world; women having made remarkable progress in receiving
education in last decades, we would expect these differences naturally to decrease further
in future.
Recently, a group of researchers (Brody, 1985; McClure et al., 2004 and Schneider
et al., 2011), generally in the field of neuroscience, have provided evidence that men
and women differ in their abilities and preferences (Polachek, 1981) leading to different
behavioural attitudes across the life cycle. In the area of finance, researchers have
paid much less attention to gender differences in decision making. The research field
has focused on overconfidence, excessive optimism, confirmation biases, and heuristics
with men tending to exhibit greater overconfidence, trading more than their female
counterparts (Barber and Odean, 2001) and investing more into mutual funds and
equity portfolios (Koedijk et al., 2013 and Jacobsen et al., 2014).
Prior work in decision making has found that risk taking behaviour in finance differs
between men and women. Men are more tolerant to risk than women (Croson and
Gneezy, 2009, among several others). Women normally see risk as a threat, whereas
men prefer to see risk as a challenge (Arch, 1993). Even after controlling for many
2

socio-economic factors, the reason why this occurs remain unclear.
Some literature argues that risk aversion differences between men and women are
associated with differences in financial education. For example Atkinson et al. (2003)
find that male and female fund managers do not handle their funds in a significantly
different manner; and Koedijk et al. (2013) argues that young single males are more
likely to invest in stocks than females, and the likelihood of investing in individual
stocks and mutual funds increases, as education increases. A strand of literature from
Psychology also describes gender differences in risk aversion related with emotions with
women experiencing emotions more strongly than men (Harshman and Paivio, 1987).
Women tend to feel fear whilst men tend to feel anger (Grossman and Wood, 1993) and
according to Lerner et al. (2003) anger normally leads to evaluating gambles as less
risky choices, which can help explain why women behave in a more risk averse manner.
However, all these empirical studies, do not allow us to distinguish whether the neural
response of men and women differ, when facing risky decisions.
In this paper we propose and experimentally test the inherent nature of gender
differences during risky investment decisions (buy, hold and selling) using advanced
technology from neuroscience to observe brain activity for males and females during
simulated financial investment decisions. The use of neuroscience techniques to map
the brain during the process of financial decision making is a highly promising area
that can provide important advances in finance, which we hope will pave the way to
understanding how emotions and neural behavior influence the theory of choice behavior
under risk.
Our Electroencephalogram measurements reveal patterns of neural activity that are
consistently different for males and females proving that men and women use different
3
parts of the brain to make financial investment decisions.
The paper is organized as follows: Section 2 discusses the literature. Section 3
describes the experimental design and data. Section 4 explains the data and the results
from the experimental research. Section 5 concludes.
2 Literature Review
2.1 Neuroscience and Finance
Neurofinance is an emerging field of investigation that merges knowledge from neu-
roscience and finance. It is still in its infancy. The high costs associated with un-
dertaking research in this area, especially with functional magnetic resonance imaging
(fMRI), positron emission tomography (PET), single photon emission computed to-
mography (SPECT), structural magnetic resonance imaging (MRI) explain, in part,
why the number of publication in the area remains low. Frydman et al. (2013) define
the field of Neurofinace as ‘seeking to characterize the computations undertaken by the
brain to make financial decisions, and to understand how these computations map to
behavior’. Their seminal paper in the finance field using fMRI is an important milestone
in the finance literature.
To our knowledge, the first prior investigation in the area of finance using advanced
technology to map the brain was developed by Gehring and Willoughby (2002) using
Electroencephalogram (EEG) technology and a finance game simulation found that
brain activity was indeed related to results from final game outcomes. McClure et
al. (2004) and Rocha and Rocha (2011) complement the information describing that a
wide network of neural circuits is involved in risk assessment, benefits, conflicts, and the
4

intent to make a purchase or to sell. Understanding the functionality of these circuits
is very important in discovering the dynamics of investment in financial markets.
Also in a financial decision making setting, Kuhnen and Knutson (2005) find that the
brain area called the nucleus accumbens is activated before investors make risky choices
as well as risk-seeking mistakes, and the anterior insula activation proceeds riskless
choices as well as mistakes in assessing risk-aversion and concludes that emotions play
an important role when people make decisions under risk. An important early study
to understand how emotions influence trading was undertaken by Lo and Repin (2002)
measuring the skin conductance response and blood pressure level of traders. Also
Caplin and Leahy (2001) discuss how suspense and anxiety influence portfolio choice
and LeDoux (1993) the important role that the amygdala plays in the preconscious
evaluation of a stimulus as representing a potential threat.
Kuhnen and Knutson (2011) found that a positive emotional state induces people to
take risk and to be confident to evaluate investment options, whereas negative emotions,
like anxiety, reduce the propensity to take risk. Frydman et al. (2014) complement all
this information arguing that brain activity increases at exactly the moment at which
subjects issue orders to sell stocks knowingly realizing a gain and Samanez-Larkin et al.
(2010) that the financial decision process changes over lifetime and older adults make
more suboptimal choices, in terms of risk-seeking mistakes, than younger adults when
choosing between risky assets.
2.2 Neuroscience, Gender and Risk
Literature in Neuroscience describes several differences between men and women in
terms of brain organization. Kelly et al. (2008) argue that, on average, male brain
5
volume is higher than for women, but when controlling for total volume, women have a
higher percentage of gray matter, and men a higher percentage of white matter. They
also found that women have a higher global cerebral blood flow than men. Men tend to
perform better on tasks related to spatial and inhibition settings, and women perform
better on more verbal tasks (Halari et al., 2005) and are more efficient in the visual
event-categorization process (Jausovec and Jausovec, 2009) and exhibit greater signal
intensity changes in middle, inferior, and orbital prefrontal cortices (Goldstein et al.,
2005). Gur et al. (2002a) also argue that, after correcting for cranial volume, men
and women have identical volumes of amygdala and hippocampus, as well as dorsal
prefrontal cortex, but women have larger orbital frontal cortices than men.
Several authors also describe women and men differently in terms of emotions. In the
case of Brody (1985) and McClure et al. (2004) they both find differences between men
and women in several areas of emotional functioning; including nonverbal sensitivity,
expressiveness, self-reported anger, fear, and sadness. Using short videos that present
angry and neutral faces, Schneider et al. (2011) found that the right amygdala was more
strongly activated than the left amygdala in males but not in females and this happened
in adults and not in adolescents. Gur et al. (2002b) complement this information
describing that brain frontal and temporal regions change with the age of the person
with men having a higher volume decrease across life. According to these authors, the
larger volume of cortex related with emotional modulation can, in part, explain the
fact why men and women behave differently in emotion processing. Rocha et al. (2011)
show that men and women with similar coefficients are likely to use different neural
circuits to solve the same task or to process the same perception.
Based on all these differences in terms of the brains functional network organization
6

Tian et al. (2011) defends that this can lead to gender differences in terms of behavior
and cognition. A large literature in experimental economics finds risk aversion to be
higher for females than males, hence evidence in the neuroscience field to investigate
these differences arising from gender are worth investigating. A group of authors defend
that risk differences are essentially related to testosterone levels (Coates and Herbert,
2008). Testosterone was found to be related with the male tendency toward aggressive
behavior (Archer, 1996), hostility (Hartgens and Kuipers, 2004) and dominance (Mazur
and Booth, 1998). Preuschoff et al. (2006) complement this information describing that
dopaminergic systems are correlated with the mathematical expectation conditioned
reward and risk, showing that the expectation of reward responses are immediate while
the risk is related to later.
Finally Overman (2004) found that males and females have a different response
pattern. Females tended to choose cards associated with immediate wins and males
tended to choose cards related with long-term outcome meaning that women prefer
investments that produce short terms outcomes. This finding is prominent in Jacobsen
et al. (2014) who find that differences in optimism across gender can explain differences
in asset allocation across gender.
The literature suggests that decision-making is different across gender. In particular
we are interested in investigating investment decisions under uncertainty involving risk,
and test if men and women use different parts of the brain to make these decisions; we
also test if this situation changes when they buy, sell or hold stocks.
7
3 Experimental Design
3.1 Data and Experiment
The investigation was conducted, based on a sample composed of 40 undergraduate stu-
dents of the School of Business Studies from Polytechnic Institute of Viana do Castelo,
Portugal. Our sample is composed of 20 women and 20 men, aged 20 to 45, with a
mean average age of 27. In terms of financial knowledge the sample is homogenous.
Each volunteer played the following investment game (described below), with a portfo-
lio composed by 200 stocks of seven different companies trading on the Portuguese Sock
Market: Banif, Portugal Telecom, Energias de Portugal, Banco Comercial Portugues,
BRISA, Cimentos de Portugal and Futebol Clube do Porto. Each participant made a
total of 100 investment decisions (50 decisions in Market Scenario 1 and 50 decisions in
Market Scenario 2). They were asked to buy, sell or hold these seven stocks. Based on
EEG technology during the investment simulation of 100 decisions we captured brain
electrical activity to identify which areas of the brain are activated when each invest-
ment decision was made how much activity takes place. Furthermore test if these areas
are different for men and women.
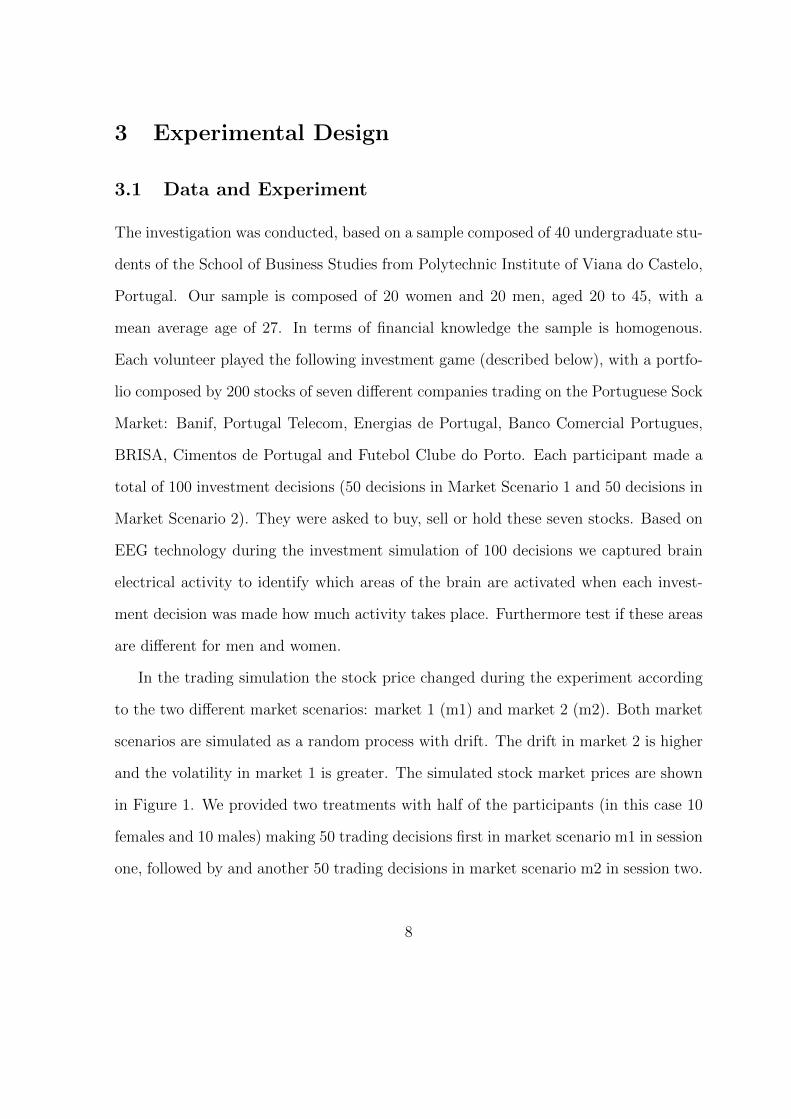
In the trading simulation the stock price changed during the experiment according
to the two different market scenarios: market 1 (m1) and market 2 (m2). Both market
scenarios are simulated as a random process with drift. The drift in market 2 is higher
and the volatility in market 1 is greater. The simulated stock market prices are shown
in Figure 1. We provided two treatments with half of the participants (in this case 10
females and 10 males) making 50 trading decisions first in market scenario m1 in session
one, followed by and another 50 trading decisions in market scenario m2 in session two.
8
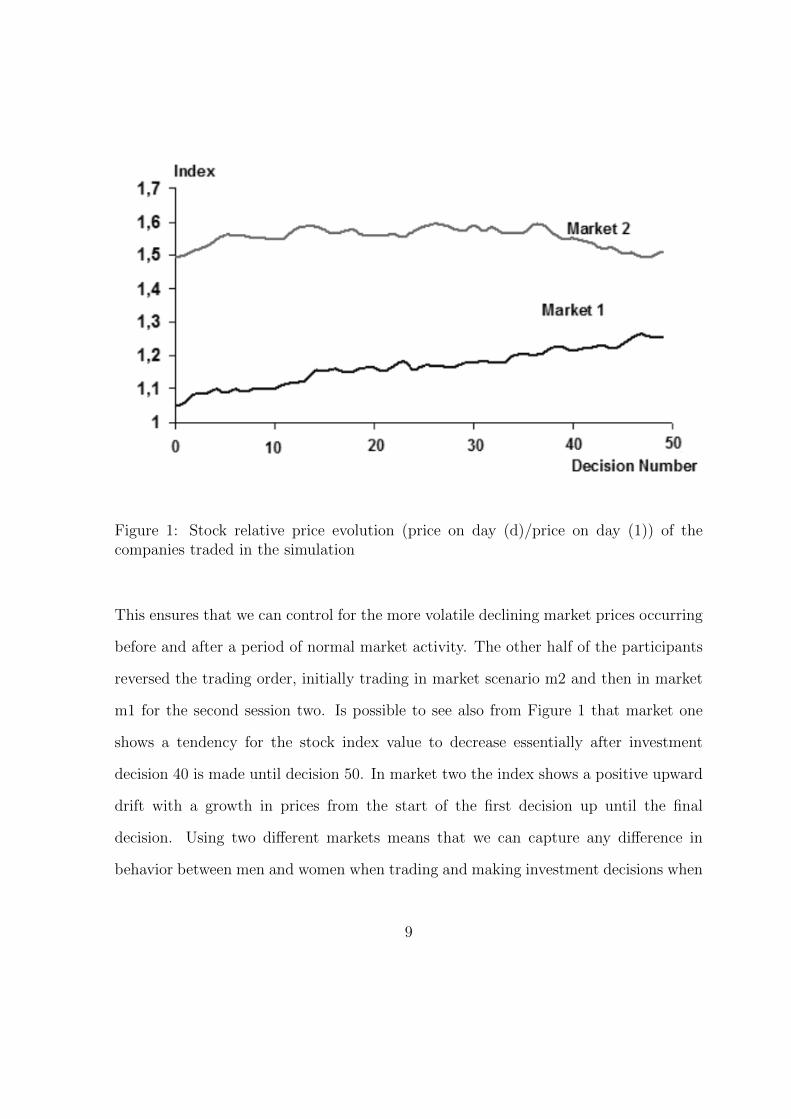
Figure 1: Stock relative price evolution (price on day (d)/price on day (1)) of thecompanies traded in the simulation
This ensures that we can control for the more volatile declining market prices occurring
before and after a period of normal market activity. The other half of the participants
reversed the trading order, initially trading in market scenario m2 and then in market
m1 for the second session two. Is possible to see also from Figure 1 that market one
shows a tendency for the stock index value to decrease essentially after investment
decision 40 is made until decision 50. In market two the index shows a positive upward
drift with a growth in prices from the start of the first decision up until the final
decision. Using two different markets means that we can capture any difference in
behavior between men and women when trading and making investment decisions when
9

the market has a tendancy to be growing (bullish) or decreasing (bearish). Our two
market scenarios m1 and m2 therefore generate portfolio values with different values.
Participants were restricted to 50,000 Euros with which to trade on each market.
Is also important to note that none of the volunteers were given any information
about the data generating process and the way each of the stock will behave across the
investment simulation process. Table 1 presents the image of the information given on
the computer screen presented to the participants when making the investment deci-
sions. The Trading simulation progressed using the screen shown for each new decision.
With the EGG mechanism on the scalp of the brain, the participants digitalized the
number and the price of the stock to trade each time by selecting the trading option V
to sell, or C to buy. The OK Enter key was pressed in order to maintain the current
portfolio unaltered. If the price offer was within 5% variation of the next stock price,
the offer was accepted and the corresponding number of stocks adjusted; otherwise the
offer was rejected and the corresponding number of stocks was maintained unaltered.
Table 2 describes the univariate statistics of the seven stocks that composes the
index depicted in Figure 1. The information given on the simulated distributions shows
the Portugal Telecom had the highest standard deviation in both markets and hence
the most risky stock. Whilst Cimentos de Portugal was the least risky with the lowest
standard deviation. Futebol Clube do Porto had the highest average return during
market one, whilst Portugal Telecom had the highest average return during the second
market simulation.
10
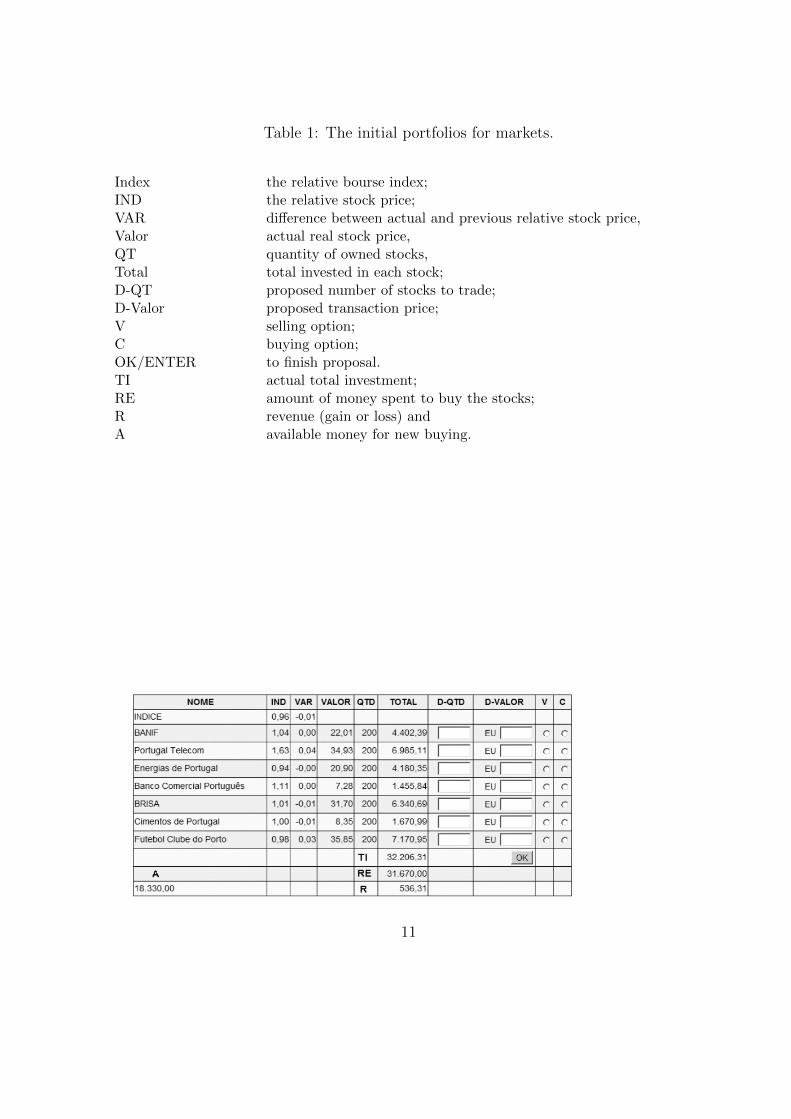
Table 1: The initial portfolios for markets.
Index the relative bourse index;IND the relative stock price;VAR difference between actual and previous relative stock price,Valor actual real stock price,QT quantity of owned stocks,Total total invested in each stock;D-QT proposed number of stocks to trade;D-Valor proposed transaction price;V selling option;C buying option;OK/ENTER to finish proposal.TI actual total investment;RE amount of money spent to buy the stocks;R revenue (gain or loss) andA available money for new buying.
11
Table 2: Univariate Statistics
Market 1 Market 2
Mean Max Min Std Dev Mean Max Min Std Dev
Banif 22.81 24.13 20.32 0.72 30.90 34.20 25.06 2.04Portugal Telecom 37.17 41.41 31.87 2.50 50.27 56.31 44.65 3.17Energias de Portugal 22.77 25.44 19.86 1.51 36.59 39.18 33.40 1.62Energias de Portugal 7.95 9.27 7.27 0.61 11.32 12.31 9.96 0.58BRISA 33.06 35.52 31.10 1.07 42.77 44.00 41.15 0.78Cimentos de Portugal 8.38 8.94 7.77 0.22 9.84 10.28 8.89 0.28Futebol Clube do Porto 38.40 44.01 34.82 2.20 42.81 45.65 40.45 1.48
3.2 The EEG Process of Mapping the Brain
The electroencephalogram (EEG) is used to measure brain activity from the electrical
charge which neurons maintain on the scalp. The EEG is performed while the volunteer
undertakes the investment simulation. EEG records changes in the electrical potential
using electrodes. The higher the density of the electrodes the better the inference
about the spatial distribution of the electrical activity. The wires from the electrodes
feed into an amplifier that allows a very rapid sampling of the electrical signal. We
use a sampling frequency of 256Hz. Specifically; the recording will be 10/20 with the
protocol; impedance below 10 Kohm; low-pass filter 50Hz, sampling frequency of 256
Hz and 10 bits of resolution.
Using source localization software we combine the data from these EEG channels
and are able to estimate the location of the likely neural generators of the observed
signals. We analyze the brain activity data at the precise time when the participants
activate the keys on the keyboard for the task. The process is non-invasive and allows
us to study the dynamics of financial decision-making. By combining many financial
decisions we are able to combine the data from many decisions and observe the average
12

response. Due to the spatial localization, we must infer the brain region that co-occurs
with the function of interest. These types of measurement techniques in neuroscience
are referred to as correlational.
To clarify the link between the information that the EEG captures from the 20
electrodes situated in different points of the brain and how this has been attributed in
the neuroscience literature about main function of brain areas, we first give some more
detail on this. Brodmann in 1909 divided the human cortex is 52 different areas and
gave a specific name to each area. Figure 2 graphically highlights the location of these
52 areas. Our EEG technology captures information using electrodes in 20 different
points of the brain. In Figure 2 we can see both where the 52 brain areas are located
alongside the 20 electrodes from the EEG used in the experiment.
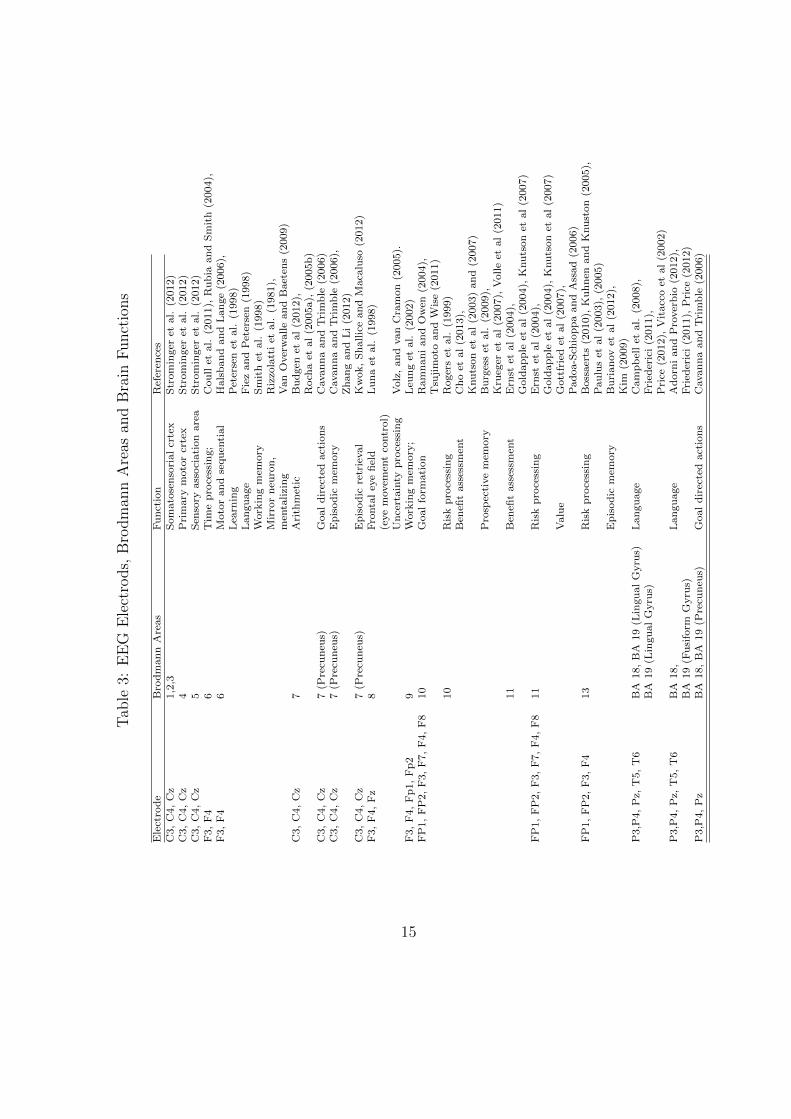
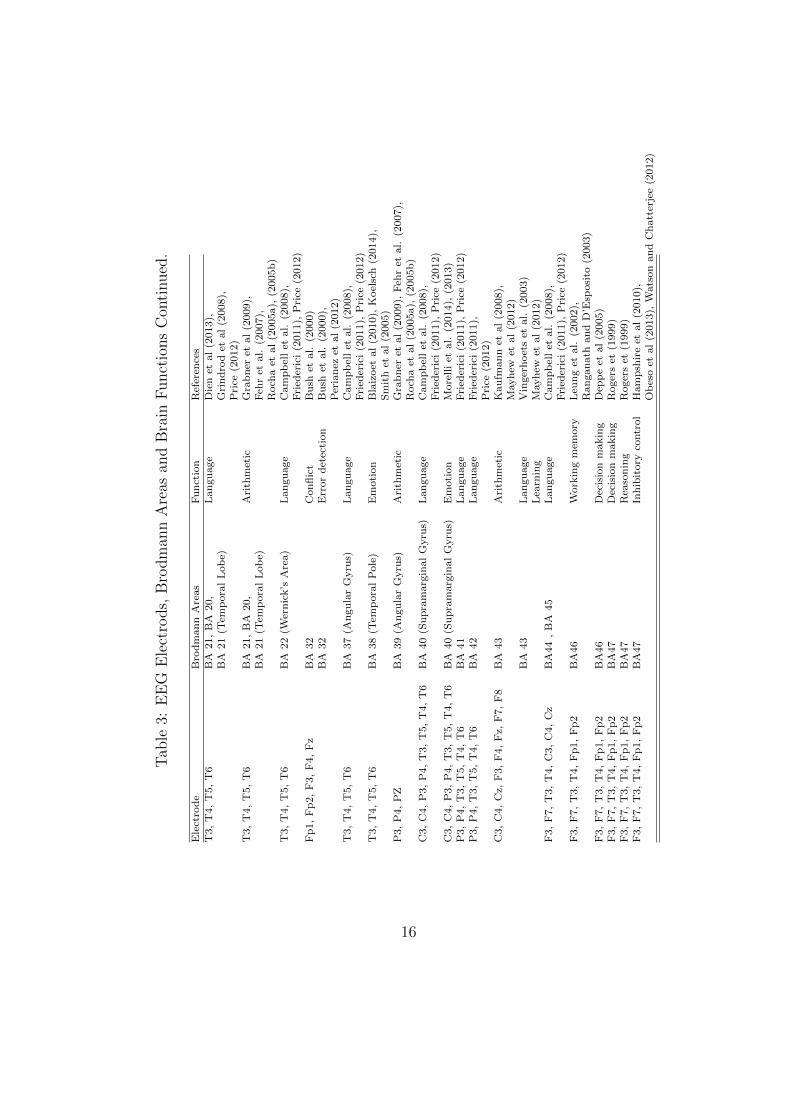
Table 3 provides an overview of what the neuroscience literature knows about the
main functions of the 52 Brodmann areas of the brain. This information is important
when interpreting our findings.
13
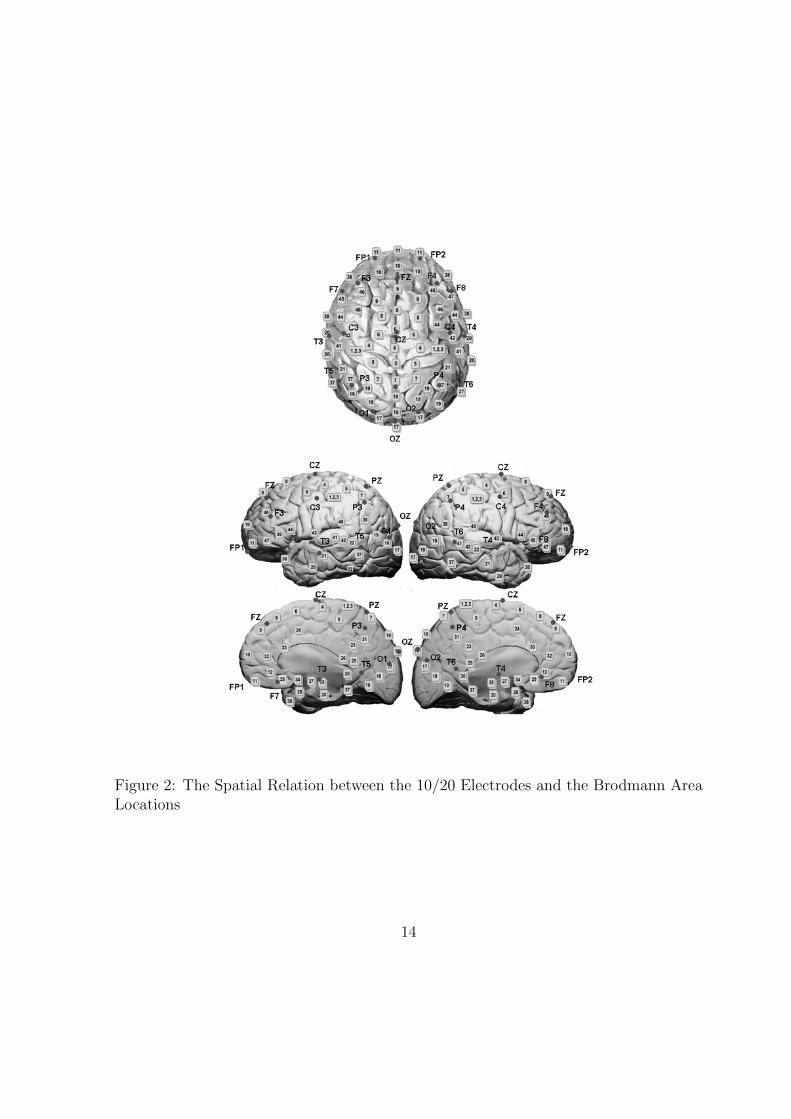
Figure 2: The Spatial Relation between the 10/20 Electrodes and the Brodmann AreaLocations
14
Tab
le3:
EE
GE
lect
rods,
Bro
dm
ann
Are
asan
dB
rain
Funct
ions
Ele
ctro
de
Bro
dm
an
nA
reas
Fu
nct
ion
Ref
eren
ces
C3,
C4,
Cz
1,2
,3S
om
ato
sen
sori
al
crte
xS
trom
inger
etal.
(2012)
C3,
C4,
Cz
4P
rim
ary
moto
rcr
tex
Str
om
inger
etal.
(2012)
C3,
C4,
Cz
5S
enso
ryass
oci
ati
on
are
aS
trom
inger
etal.
(2012)
F3,
F4
6T
ime
pro
cess
ing;
Cou
llet
al.
(2011),
Ru
bia
an
dS
mit
h(2
004),
F3,
F4
6M
oto
ran
dse
qu
enti
al
Hals
ban
dan
dL
an
ge
(2006),
Lea
rnin
gP
eter
sen
etal.
(1998)
Lan
gu
age
Fie
zand
Pet
erse
n(1
998)
Work
ing
mem
ory
Sm
ith
etal.
(1998)
Mir
ror
neu
ron
,R
izzo
latt
iet
al.
(1981),
men
tali
zin
gV
an
Over
walle
an
dB
aet
ens
(2009)
C3,
C4,
Cz
7A
rith
met
icB
ud
gen
etal
(2012),
Roch
aet
al
(2005a),
(2005b
)C
3,
C4,
Cz
7(P
recu
neu
s)G
oal
dir
ecte
dact
ion
sC
avan
na
an
dT
rim
ble
(2006)
C3,
C4,
Cz
7(P
recu
neu
s)E
pis
od
icm
emory
Cavan
na
an
dT
rim
ble
(2006),
Zh
an
gan
dL
i(2
012)
C3,
C4,
Cz
7(P
recu
neu
s)E
pis
od
icre
trie
val
Kw
ok,
Sh
allic
ean
dM
aca
luso
(2012)
F3,
F4,
Fz
8F
ronta
ley
efi
eld
Lu
na
etal.
(1998)
(eye
movem
ent
contr
ol)
Un
cert
ain
typ
roce
ssin
gV
olz
,an
dvan
Cra
mon
(2005).
F3,
F4,
Fp
1,
Fp
29
Work
ing
mem
ory
;L
eun
get
al.
(2002)
FP
1,
FP
2,
F3,
F7,
F4,
F8
10
Goal
form
ati
on
Ram
nan
ian
dO
wen
(2004),
Tsu
jim
oto
an
dW
ise
(2011)
10
Ris
kp
roce
ssin
gR
oger
set
al.
(1999)
Ben
efit
ass
essm
ent
Ch
oet
al
(2013),
Knu
tson
etal
(2003)
an
d(2
007)
Pro
spec
tive
mem
ory
Bu
rges
set
al.
(2009),
Kru
eger
etal
(2007),
Volle
etal
(2011)
11
Ben
efit
ass
essm
ent
Ern
stet
al
(2004),
Gold
ap
ple
etal
(2004),
Knu
tson
etal
(2007)
FP
1,
FP
2,
F3,
F7,
F4,
F8
11
Ris
kp
roce
ssin
gE
rnst
etal
(2004),
Gold
ap
ple
etal
(2004),
Knu
tson
etal
(2007)
Valu
eG
ott
frie
det
al
(2007),
Pad
oa-S
chio
pp
aan
dA
ssad
(2006)
FP
1,
FP
2,
F3,
F4
13
Ris
kp
roce
ssin
gB
oss
aer
ts(2
010),
Ku
hn
enan
dK
nu
ston
(2005),
Pau
lus
etal
(2003),
(2005)
Ep
isod
icm
emory
Bu
rian
ov
etal
(2012),
Kim
(2009)
P3,P
4,
Pz,
T5,
T6
BA
18,
BA
19
(Lin
gu
al
Gyru
s)L
an
gu
age
Cam
pb
ell
etal.
(2008),
BA
19
(Lin
gu
al
Gyru
s)F
ried
eric
i(2
011),
Pri
ce(2
012),
Vit
acc
oet
al
(2002)
P3,P
4,
Pz,
T5,
T6
BA
18,
Lan
gu
age
Ad
orn
ian
dP
rover
bio
(2012),
BA
19
(Fu
sifo
rmG
yru
s)F
ried
eric
i(2
011),
Pri
ce(2
012)
P3,P
4,
Pz
BA
18,
BA
19
(Pre
cun
eus)
Goal
dir
ecte
dact
ion
sC
avan
na
an
dT
rim
ble
(2006)
15
Tab
le3:
EE
GE
lect
rods,
Bro
dm
ann
Are
asan
dB
rain
Funct
ions
Con
tinued
.
Ele
ctro
de
Bro
dm
an
nA
reas
Fu
nct
ion
Ref
eren
ces
T3,
T4,
T5,
T6
BA
21,
BA
20,
Lan
gu
age
Die
net
al
(2013),
BA
21
(Tem
pora
lL
ob
e)G
rin
dro
det
al
(2008),
Pri
ce(2
012)
T3,
T4,
T5,
T6
BA
21,
BA
20,
Ari
thm
etic
Gra
bn
eret
al
(2009),
BA
21
(Tem
pora
lL
ob
e)F
ehr
etal.
(2007),
Roch
aet
al
(2005a),
(2005b
)T
3,
T4,
T5,
T6
BA
22
(Wer
nic
k’s
Are
a)
Lan
gu
age
Cam
pb
ell
etal.
(2008),
Fri
eder
ici
(2011),
Pri
ce(2
012)
Fp
1,
Fp
2,
F3,
F4,
Fz
BA
32
Con
flic
tB
ush
etal.
(2000)
BA
32
Err
or
det
ecti
on
Bu
shet
al.
(2000),
Per
ianez
etal
(2012)
T3,
T4,
T5,
T6
BA
37
(An
gu
lar
Gyru
s)L
an
gu
age
Cam
pb
ell
etal.
(2008),
Fri
eder
ici
(2011),
Pri
ce(2
012)
T3,
T4,
T5,
T6
BA
38
(Tem
pora
lP
ole
)E
moti
on
Bla
izoet
al
(2010),
Koel
sch
(2014),
Sm
ith
etal
(2005)
P3,
P4,
PZ
BA
39
(An
gu
lar
Gyru
s)A
rith
met
icG
rab
ner
etal
(2009),
Feh
ret
al.
(2007),
Roch
aet
al
(2005a),
(2005b
)C
3,
C4,
P3,
P4,
T3,
T5,
T4,
T6
BA
40
(Su
pra
marg
inal
Gyru
s)L
an
gu
age
Cam
pb
ell
etal.
(2008),
Fri
eder
ici
(2011),
Pri
ce(2
012)
C3,
C4,
P3,
P4,
T3,
T5,
T4,
T6
BA
40
(Su
pra
marg
inal
Gyru
s)E
moti
on
More
lli
etal.
(2014),
(2013)
P3,
P4,
T3,
T5,
T4,
T6
BA
41
Lan
gu
age
Fri
eder
ici
(2011),
Pri
ce(2
012)
P3,
P4,
T3,
T5,
T4,
T6
BA
42
Lan
gu
age
Fri
eder
ici
(2011),
Pri
ce(2
012)
C3,
C4,
Cz,
F3,
F4,
Fz,
F7,
F8
BA
43
Ari
thm
etic
Kau
fman
net
al
(2008),
Mayh
ewet
al
(2012)
BA
43
Lan
gu
age
Vin
ger
hoet
set
al.
(2003)
Lea
rnin
gM
ayh
ewet
al
(2012)
F3,
F7,
T3,
T4,
C3,
C4,
Cz
BA
44
,B
A45
Lan
gu
age
Cam
pb
ell
etal.
(2008),
Fri
eder
ici
(2011),
Pri
ce(2
012)
F3,
F7,
T3,
T4,
Fp
1,
Fp
2B
A46
Work
ing
mem
ory
Leu
ng
etal.
(2002),
Ran
gan
ath
an
dD
’Esp
osi
to(2
003)
F3,
F7,
T3,
T4,
Fp
1,
Fp
2B
A46
Dec
isio
nm
akin
gD
epp
eet
al
(2005)
F3,
F7,
T3,
T4,
Fp
1,
Fp
2B
A47
Dec
isio
nm
akin
gR
oger
set
(1999)
F3,
F7,
T3,
T4,
Fp
1,
Fp
2B
A47
Rea
son
ing
Roger
set
(1999)
F3,
F7,
T3,
T4,
Fp
1,
Fp
2B
A47
Inh
ibit
ory
contr
ol
Ham
psh
ire
etal
(2010),
Ob
eso
etal
(2013),
Wats
on
an
dC
hatt
erje
e(2
012)
16
In terms of EEG any cognitive task is supported by activation of sets of neurons
located in many different cortical areas over the entire cortex, each of these taking
charge of handling specific aspects of cognition (see table 1 and Rocha et al, 2005,
2010). Activation of these neurons generated electrical currents that give rise to elec-
trical fields that are sensed by electrodes placed in the scalp. The temporal recordings
of brain activity by sets of electrodes (e.g., 20 electrodes as in this paper) is called
electroencephalogram (EEG).
The 20 electrodes of the EEG are named according to the brain lobes (Frontal or
F electrodes, Temporal or T electrodes, Occiptal or O electrodes and Parietal or C
and P electrodes) they are supposed to monitor. Electrodes in the left hemisphere are
even-numbered and in the right hemisphere they are odd-numbered.
The currents generated by different sets of neurons located in different areas of the
brain sum up to produce the electrical fields that are sensed by the different electrodes.
The electrical field sensed by each electrode depends on the distance of the electrode to
the sets of neurons acting as current sources. This way, the frontal electrodes (denoted
as Fx in Figure 3) are able to measure the activity of neurons located in the anterior
brain.
Because EEG data are assumed to be a weighted sum of the electrical activity of
different sources si, correlation analysis of the electrical activity v(ei, t) recorded by the
different electrodes ei may be used to summarize information provided by each electrode
ei about all involved sources si into a single variable as proposed by Rocha et al (2010;
2011, 2013). Correlation estimates capture the degree of linear dependence between the
electrodes.
In our investigation we also use Principal Component Analysis (PCA) to deter-
17
mine if information may be condensed into small sets of these variables called principal
components. This transformation is defined in such a way that the first principal com-
ponent is the one that accounts for as much of the variability in the data as possible,
and each succeeding component in turn explains the subsequent amount of variance
possible under the constraint that it is orthogonal to the preceding components. Based
on this information we create brain maps to represent the activity of the neural circuits
involved in a cognitive task. We condense the information provided by the electrodes
sampling this neural activity. Factorial analysis does not map brain areas activated by
a cognitive task, but rather, measures the amount of information provided by about
the spatial and temporal distribution of the neurons. Factorial analysis provides infor-
mation to disclose the activity of circuits composed by neurons distributed on different
areas of the brain recruited by the cognitive task. PCA is therefore first applied here
to study the covariation during each of the selected epochs.
Furthermore, regression analysis studies the association between the financial nu-
merical variables and the discrete numerical variables from a questionnaire to collect
demographic information on age and gender; and H(ei) is calculated for each of the
electrodes (independent variables) and controlled for by the variable expertise (poten-
tial confounder). Given H(ei) as the mean H(ei) for each group, the normalized values
of the βi(ei)H(ei) will be used to build the color-coded brain mapping images to dis-
play the results of the regression analysis. Statistically positive betas will be coded
from green (normalized βi(ei)H(ei) tending to 0) to dark blue (normalized βi(ei)H(ei)
tending to +1). Statistically negative βi(ei)H(ei) will be coded from rose (normalized
βi(ei)H(ei) tending to 0) to dark red. Hence the greater the brain activity the darker
the blue in the brain maps.
18

4 Experiment Results
The psychology literature describes that men and woman, although having similar IQs
may use different neural circuits to solve the same task or to process the same perception
(e.g. Bell et al, 2006; Jausovec and Jausovec 2009; Rocha, Rocha and Massad, 2011),
but according to our knowledge no investigation until now has analyzed what happens
in terms of gender differentials and brain electrical activity when a large number of
financial investment decisions are made. This way, this investigation is among the first
to analyse if women and men brains work in different ways when making the same
investment decisions. We also test if these differences exist when they make particular
decisions related to buying, selling or holding stocks.
4.1 Gender Differences in Brain Activity
Table 4 and Figures 3 display the electrodes and the zones of the brain activated in
men and women when they make the same investment decisions. The table has three
different columns that represent the image of the brain with the information capture
from Principal Component Analysis (Factor 1, Factor 2 and Factor 3). Each factor has
three different groups of images that display the view of the brain in three different
perspectives. To build these images we use a loading factor higher than 0.65 until 1 like
Rocha et al. (2011). For example, the highest loading value of female factor 1 is the
value of 0.85 and is associated with the brain area related with the electrode C3. In the
male case the electrodes with high loading values are FP2 (0.86) and FP1 (0.85). In
figure 4, the higher loading values appear with more intense color. The white colours
areas of the brain mean that loading factors are smaller than 0.65, meaning that brain
electrical frequency activity captured by the electrodes located in this area is low.
19
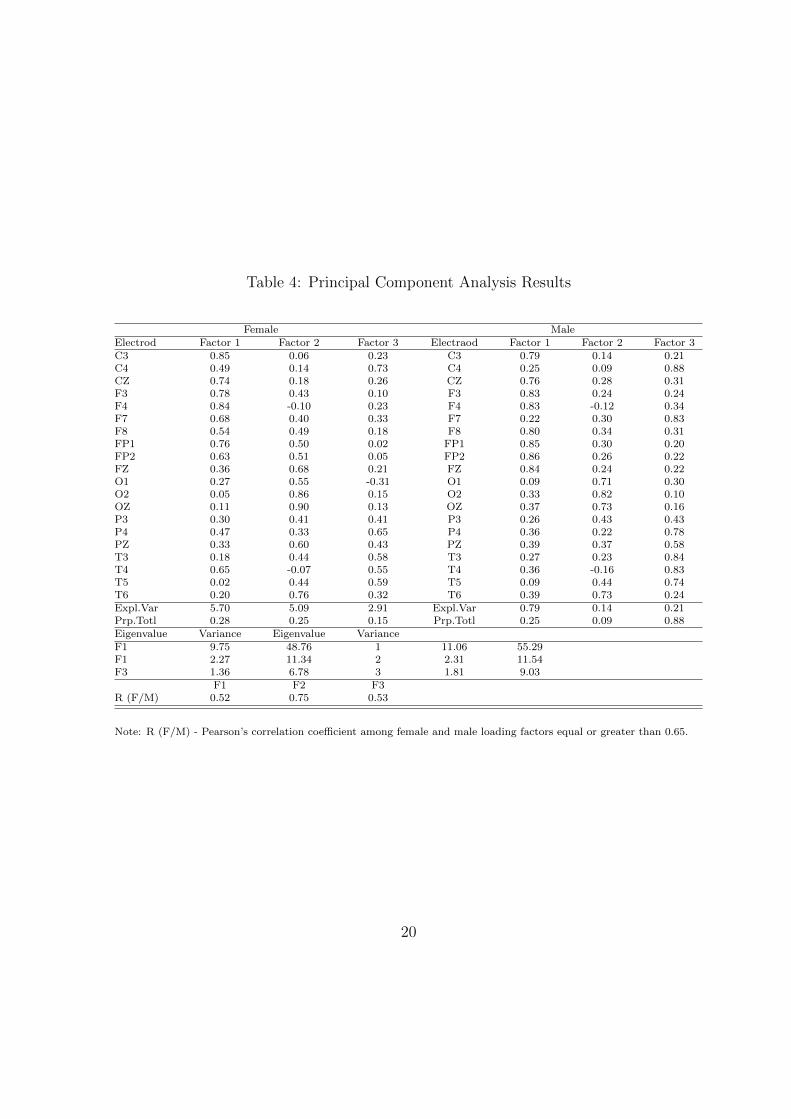
Table 4: Principal Component Analysis Results
Female MaleElectrod Factor 1 Factor 2 Factor 3 Electraod Factor 1 Factor 2 Factor 3C3 0.85 0.06 0.23 C3 0.79 0.14 0.21C4 0.49 0.14 0.73 C4 0.25 0.09 0.88CZ 0.74 0.18 0.26 CZ 0.76 0.28 0.31F3 0.78 0.43 0.10 F3 0.83 0.24 0.24F4 0.84 -0.10 0.23 F4 0.83 -0.12 0.34F7 0.68 0.40 0.33 F7 0.22 0.30 0.83F8 0.54 0.49 0.18 F8 0.80 0.34 0.31FP1 0.76 0.50 0.02 FP1 0.85 0.30 0.20FP2 0.63 0.51 0.05 FP2 0.86 0.26 0.22FZ 0.36 0.68 0.21 FZ 0.84 0.24 0.22O1 0.27 0.55 -0.31 O1 0.09 0.71 0.30O2 0.05 0.86 0.15 O2 0.33 0.82 0.10OZ 0.11 0.90 0.13 OZ 0.37 0.73 0.16P3 0.30 0.41 0.41 P3 0.26 0.43 0.43P4 0.47 0.33 0.65 P4 0.36 0.22 0.78PZ 0.33 0.60 0.43 PZ 0.39 0.37 0.58T3 0.18 0.44 0.58 T3 0.27 0.23 0.84T4 0.65 -0.07 0.55 T4 0.36 -0.16 0.83T5 0.02 0.44 0.59 T5 0.09 0.44 0.74T6 0.20 0.76 0.32 T6 0.39 0.73 0.24Expl.Var 5.70 5.09 2.91 Expl.Var 0.79 0.14 0.21Prp.Totl 0.28 0.25 0.15 Prp.Totl 0.25 0.09 0.88Eigenvalue Variance Eigenvalue VarianceF1 9.75 48.76 1 11.06 55.29F1 2.27 11.34 2 2.31 11.54F3 1.36 6.78 3 1.81 9.03
F1 F2 F3R (F/M) 0.52 0.75 0.53
Note: R (F/M) - Pearson’s correlation coefficient among female and male loading factors equal or greater than 0.65.
20
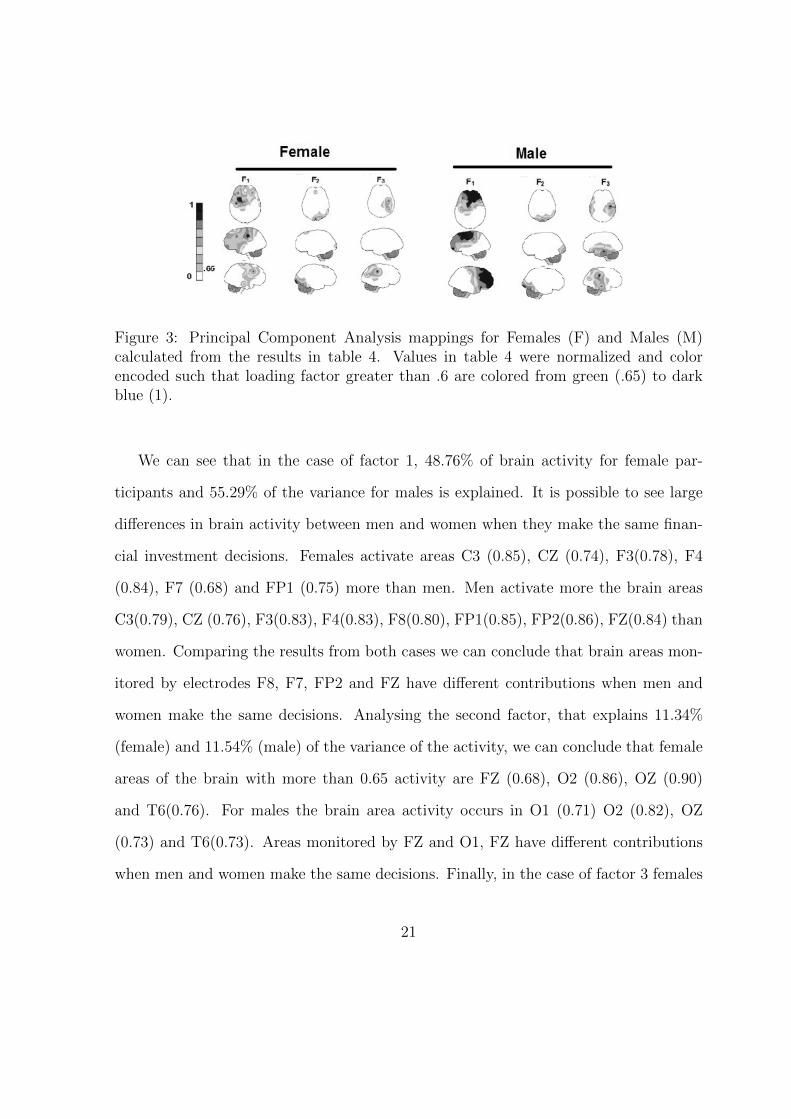
Figure 3: Principal Component Analysis mappings for Females (F) and Males (M)calculated from the results in table 4. Values in table 4 were normalized and colorencoded such that loading factor greater than .6 are colored from green (.65) to darkblue (1).
We can see that in the case of factor 1, 48.76% of brain activity for female par-
ticipants and 55.29% of the variance for males is explained. It is possible to see large
differences in brain activity between men and women when they make the same finan-
cial investment decisions. Females activate areas C3 (0.85), CZ (0.74), F3(0.78), F4
(0.84), F7 (0.68) and FP1 (0.75) more than men. Men activate more the brain areas
C3(0.79), CZ (0.76), F3(0.83), F4(0.83), F8(0.80), FP1(0.85), FP2(0.86), FZ(0.84) than
women. Comparing the results from both cases we can conclude that brain areas mon-
itored by electrodes F8, F7, FP2 and FZ have different contributions when men and
women make the same decisions. Analysing the second factor, that explains 11.34%
(female) and 11.54% (male) of the variance of the activity, we can conclude that female
areas of the brain with more than 0.65 activity are FZ (0.68), O2 (0.86), OZ (0.90)
and T6(0.76). For males the brain area activity occurs in O1 (0.71) O2 (0.82), OZ
(0.73) and T6(0.73). Areas monitored by FZ and O1, FZ have different contributions
when men and women make the same decisions. Finally, in the case of factor 3 females
21

only activate two brain areas: C4 (0.73) and P4 (0.65) but males activate C4 (0.88),
F4(0.83), P4(0.78), T3 (0.84), T4 (0,83) and T5 (0.74). It is interesting to see that
similar regions of the brain are activated, but that males use more areas in the case of
factor 3. Overall from our results we find strong evidence that that men and women
use different parts of the brain to make investment decisions. Using the information of
table 4 we also compile the results in figure 4, highlighting the location of the electrodes
activated when neural activity corresponds to values greater than 0.65. We do this for
Factors 1, 2 and 3.
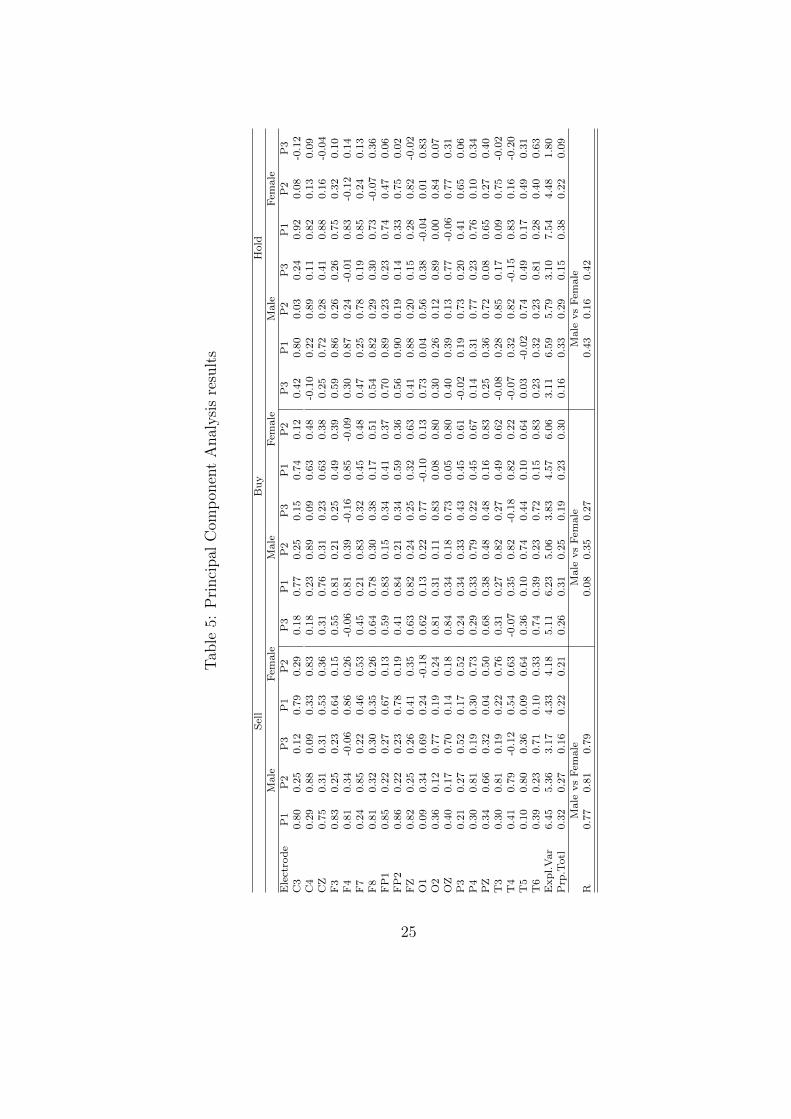
4.2 Gender Differences in Buy, Sell, and Hold Decisions
We extend our analysis to investigate if there are gender differences in terms of brain
activity when different types of investment decisions are made. In particular we split
the sample into decisions to buy, sell and to hold (maintain the stock position). Table 5
displays information related to brain electrical activity for male and female investment
decisions. Figure 5 displays the results graphically. We see that for males, the areas
of the brain more activated during investment process are on average relatively similar
when they make the decisions to buy, sell or to hold stocks. However, for females the
areas are different. Females appear to use different neural circuits to make these three
different decisions investment decisions. Figure 6 graphically presents the electrodes
activated (values higher than 0.65) for decisions to buy, sell or maintain share holdings.
22
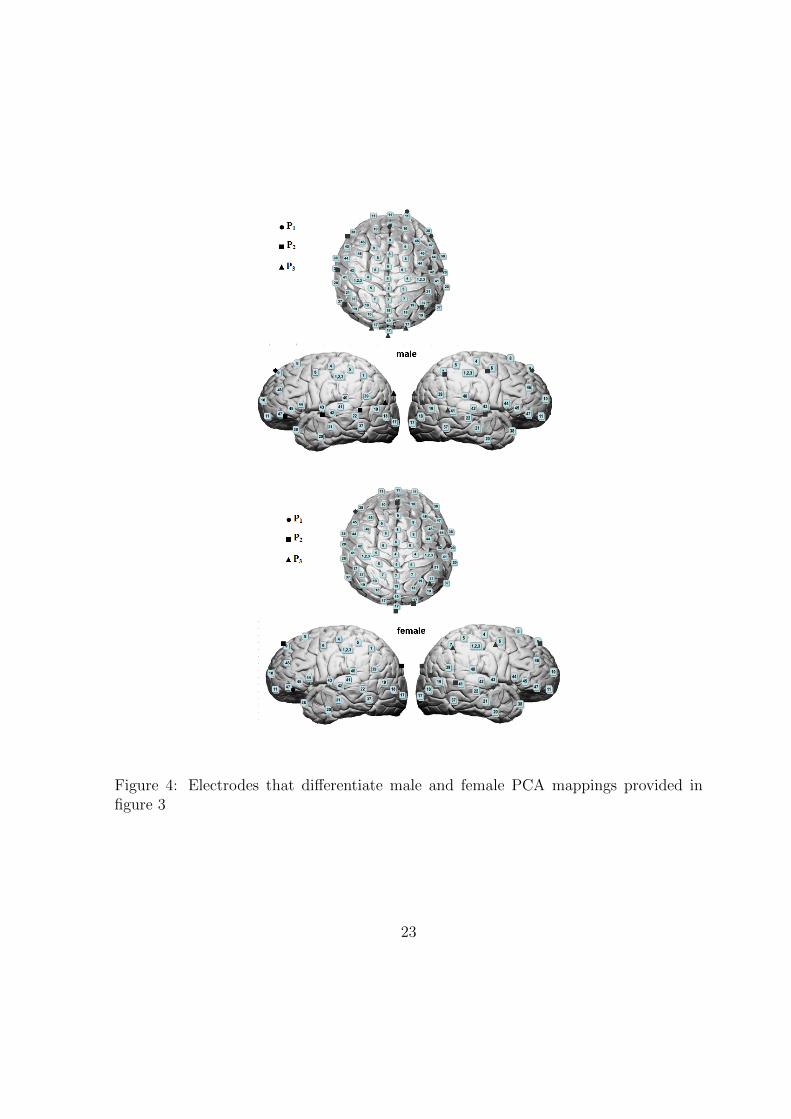
Figure 4: Electrodes that differentiate male and female PCA mappings provided infigure 3
23
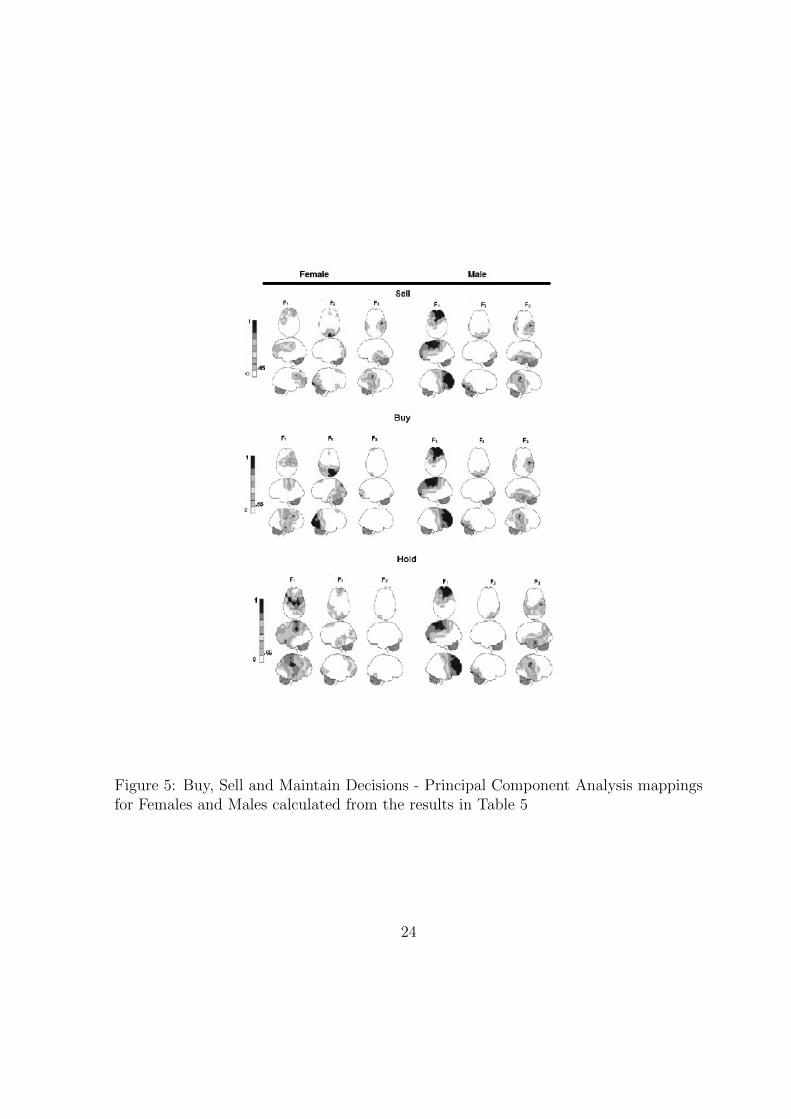
Figure 5: Buy, Sell and Maintain Decisions - Principal Component Analysis mappingsfor Females and Males calculated from the results in Table 5
24
Tab
le5:
Pri
nci
pal
Com
pon
ent
Anal
ysi
sre
sult
s
Sel
lB
uy
Hold
Male
Fem
ale
Male
Fem
ale
Male
Fem
ale
Ele
ctro
de
P1
P2
P3
P1
P2
P3
P1
P2
P3
P1
P2
P3
P1
P2
P3
P1
P2
P3
C3
0.8
00.2
50.1
20.7
90.2
90.1
80.7
70.2
50.1
50.7
40.1
20.4
20.8
00.0
30.2
40.9
20.0
8-0
.12
C4
0.2
90.8
80.0
90.3
30.8
30.1
80.2
30.8
90.0
90.6
30.4
8-0
.10
0.2
20.8
90.1
10.8
20.1
30.0
9C
Z0.7
50.3
10.3
10.5
30.3
60.3
10.7
60.3
10.2
30.6
30.3
80.2
50.7
20.2
80.4
10.8
80.1
6-0
.04
F3
0.8
30.2
50.2
30.6
40.1
50.5
50.8
10.2
10.2
50.4
90.3
90.5
90.8
60.2
60.2
60.7
50.3
20.1
0F
40.8
10.3
4-0
.06
0.8
60.2
6-0
.06
0.8
10.3
9-0
.16
0.8
5-0
.09
0.3
00.8
70.2
4-0
.01
0.8
3-0
.12
0.1
4F
70.2
40.8
50.2
20.4
60.5
30.4
50.2
10.8
30.3
20.4
50.4
80.4
70.2
50.7
80.1
90.8
50.2
40.1
3F
80.8
10.3
20.3
00.3
50.2
60.6
40.7
80.3
00.3
80.1
70.5
10.5
40.8
20.2
90.3
00.7
3-0
.07
0.3
6F
P1
0.8
50.2
20.2
70.6
70.1
30.5
90.8
30.1
50.3
40.4
10.3
70.7
00.8
90.2
30.2
30.7
40.4
70.0
6F
P2
0.8
60.2
20.2
30.7
80.1
90.4
10.8
40.2
10.3
40.5
90.3
60.5
60.9
00.1
90.1
40.3
30.7
50.0
2F
Z0.8
20.2
50.2
60.4
10.3
50.6
30.8
20.2
40.2
50.3
20.6
30.4
10.8
80.2
00.1
50.2
80.8
2-0
.02
O1
0.0
90.3
40.6
90.2
4-0
.18
0.6
20.1
30.2
20.7
7-0
.10
0.1
30.7
30.0
40.5
60.3
8-0
.04
0.0
10.8
3O
20.3
60.1
20.7
70.1
90.2
40.8
10.3
10.1
10.8
30.0
80.8
00.3
00.2
60.1
20.8
90.0
00.8
40.0
7O
Z0.4
00.1
70.7
00.1
40.1
80.8
40.3
40.1
80.7
30.0
50.8
00.4
00.3
90.1
30.7
7-0
.06
0.7
70.3
1P
30.2
10.2
70.5
20.1
70.5
20.2
40.3
40.3
30.4
30.4
50.6
1-0
.02
0.1
90.7
30.2
00.4
10.6
50.0
6P
40.3
00.8
10.1
90.3
00.7
30.2
90.3
30.7
90.2
20.4
50.6
70.1
40.3
10.7
70.2
30.7
60.1
00.3
4P
Z0.3
40.6
60.3
20.0
40.5
00.6
80.3
80.4
80.4
80.1
60.8
30.2
50.3
60.7
20.0
80.6
50.2
70.4
0T
30.3
00.8
10.1
90.2
20.7
60.3
10.2
70.8
20.2
70.4
90.6
2-0
.08
0.2
80.8
50.1
70.0
90.7
5-0
.02
T4
0.4
10.7
9-0
.12
0.5
40.6
3-0
.07
0.3
50.8
2-0
.18
0.8
20.2
2-0
.07
0.3
20.8
2-0
.15
0.8
30.1
6-0
.20
T5
0.1
00.8
00.3
60.0
90.6
40.3
60.1
00.7
40.4
40.1
00.6
40.0
3-0
.02
0.7
40.4
90.1
70.4
90.3
1T
60.3
90.2
30.7
10.1
00.3
30.7
40.3
90.2
30.7
20.1
50.8
30.2
30.3
20.2
30.8
10.2
80.4
00.6
3E
xp
l.V
ar
6.4
55.3
63.1
74.3
34.1
85.1
16.2
35.0
63.8
34.5
76.0
63.1
16.5
95.7
93.1
07.5
44.4
81.8
0P
rp.T
otl
0.3
20.2
70.1
60.2
20.2
10.2
60.3
10.2
50.1
90.2
30.3
00.1
60.3
30.2
90.1
50.3
80.2
20.0
9M
ale
vs
Fem
ale
Male
vs
Fem
ale
Male
vs
Fem
ale
R0.7
70.8
10.7
90.0
80.3
50.2
70.4
30.1
60.4
2
25

4.3 Brain Activity, Gender and Portfolio Holdings
We now turn to understanding what areas of the male and female brain are related to
portfolio holdings, in particular portfolio value and cash holdings. One of the first im-
portant conclusions that we can extract from the table is that women manage portfolios
with a lower total value and prefer to keep a higher percentage of the portfolio in cash.
Is important to mention that each volunteer received 50,000 Euros at the beginning
of the investment simulation to invest and they were able to invest all this money in
stocks or just a small part and retain the rest in cash.
26
Tab
le6:
OL
SR
egre
ssio
nN
eura
lA
ctiv
ity
and
Val
ue
ofE
quit
yin
the
Por
tfol
io
DependentVariable:Equity
Valu
eFull
Mark
etSim
ulation
Mark
et1
Mark
et2
(1)
(2)
(1)
(2)
(1)
(2)
Coef
TSta
tCoef
TSta
tCoef
TSta
tCoef
TSta
tCoef
TSta
tCoef
TSta
tConstant
2.904
20.483***
3.102
21.615***
2.991
30.831***
3.158
33.568***
2.811
11.287***
2.931
11.794***
Gender
-0.745
-6.552***
-1.002
-8.053***
-0.103
-1.318
-0.251
-3.036***
-1.735
-8.473***
-2.1122
-9.398***
C3
-0.013
-0.244
-0.099
-1.511
-0.048
-1.31
-0.139
-3.061***
-0.047
-0.489
-0.065
-0.561
C4
-0.009
-0.143
-0.180
-2.247***
-0.071
-1.704*
-0.290
-5.172
0.04
0.367
-0.335
-2.383**
CZ
0.008
0.148
0.034
0.449
0.168
4.455***
0.085
1.553
-0.353
-3.769***
-0.216
-1.662*
F3
-0.015
-0.271
0.177
2.599***
-0.212
-5.202***
-0.088
-1.855*
0.069
0.7
0.322
2.794***
F4
0.378
7.219***
0.604
9.330***
-0.114
-3.117***
-0.070
-1.603
0.941
10.242***
1.28
11.487***
F7
0.428
7.432***
0.31
3.770***
0.231
5.743***
0.133
2.311**
0.632
6.192***
0.458
3.135***
F8
0.116
2.157**
0.08
1.102
0.099
2.665***
0.018
0.363
0.168
1.760*
0.084
0.655
FP1
0.356
5.305***
0.541
6.500***
0.167
3.501***
0.137
2.337**
0.634
5.304***
1.052
7.038***
FP2
-0.054
-0.807
-0.144
-1.741*
0.039
0.752
0.201
3.272***
-0.158
-1.386
-0.382
-2.619***
FZ
-0.595
-11.137***
-0.709
-10.818***
0.033
0.857
0.111
2.472**
-1.192
-12.988***
-1.471
-13.343***
O1
0.026
0.574
-0.180
-2.438**
-0.110
-3.592***
-0.211
-4.295***
0.169
2.059**
-0.141
-1.063
O2
0.117
1.840*
0.308
3.826***
-0.208
-4.710***
-0.056
-1.036
0.38
3.302***
0.674
4.638***
OZ
0.368
5.632***
0.542
7.009***
0.122
2.632***
0.268
5.060***
0.777
6.523***
0.987
6.822***
P3
0.056
1.238
0.175
2.654***
0.04
1.372
0.078
1.780*
0.142
1.606
0.317
2.705***
P4
-0.096
-1.785*
0.039
0.566
-0.167
-4.467***
-0.077
-1.607
-0.005
-0.058
0.305
2.468**
PZ
0.0561
1.13
-0.076
-1.08
0.103
2.953***
-0.021
-0.428
0.066
0.743
-0.236
-1.957*
T3
0.158
2.971***
0.064
0.914
-0.084
-2.168***
-0.102
-2.042**
0.409
4.345***
0.291
2.442**
T4
-0.384
-7.949***
-0.702
-11.108***
0.03
0.887
-0.130
-3.053***
-0.747
-8.676***
-1.268
-11.083***
T5
-0.401
-7.990***
-0.335
-4.677***
-0.036
-1.045
0.091
1.902*
-0.841
-9.106***
-0.674
-5.130***
T6
-0.197
-3.504***
-0.091
-1.24
0.072
1.801
0.133
2.682***
-0.450
-4.494***
-0.264
-2.038**
C3*Gender
0.264
2.250**
0.124
1.628
0.319
1.48
C4*
Gender
0.237
1.804*
0.38
4.389***
0.609
2.533**
CZ*Gender
-0.097
-0.793
-0.040
-0.488
-0.075
-0.355
F3*Gender
-0.055
-0.405
0.218
2.436**
-0.307
-1.257
F4*
Gender
-0.547
-4.599***
0.059
0.762
-1.066
-4.999***
F7*
Gender
-0.140
-1.046
-0.022
-0.255
-0.285
-1.208
F8*
Gender
-0.109
-0.856
0.149
1.781*
-0.213
-0.936
FP1*
Gender
-0.646
-4.400***
-0.250
-2.533**
-1.046
-4.160***
FP2*
Gender
0.136
0.881
-0.283
-2.604***
0.433
1.676*
FZ*Gender
0.736
5.254***
-0.141
-1.468
1.496
6.377***
O1*Gender
0.151
1.486
-0.015
-0.235
0.439
2.388**
O2*
Gender
-0.436
-2.964***
-0.328
-3.341***
-0.597
-2.340**
OZ*
Gender
-0.417
-2.715***
-0.251
-2.381**
-0.776
-2.977***
P3*
Gender
-0.245
-2.566**
-0.054
-0.9
-0.480
-2.634***
P4*
Gender
-0.319
-2.730***
-0.152
-1.994**
-0.770
-3.687*
PZ*
Gender
0.183
1.698*
0.206
2.898***
0.376
1.941
T3*
Gender
0.085
0.698
0.08
0.976
0.087
0.412
T4*
Gender
0.715
6.357***
0.156
2.090**
1.218
6.16
T5*
Gender
0.112
1.021
-0.116
-1.639
0.175
0.883
T6*
Gender
0.12
0.847
0.037
0.399
0.226
0.899
R-S
quare
d16.14%
18.97%
11.98%
26.96%
28.10%
35.11%
Obse
rvation
3460
3460
1714
1714
1739
1739
27
Tab
le7:
OL
SR
egre
ssio
nN
eura
lA
ctiv
ity
and
Cas
hH
oldin
gs
DependentVariable:Cash
Hold
ing
Full
Mark
etSim
ulation
Mark
et1
Mark
et2
(1)
(2)
(1)
(2)
(1)
(2)
Coef
TSta
tCoef
TSta
tCoef
TSta
tCoef
TSta
tCoef
TSta
tCoef
TSta
tConstant
1.442
16.801***
1.221
14.246***
1.478
13.767***
1.232
11.577***
1.423
10.515***
1.269
9.462***
Gender
0.729
10.589***
0.945
12.719***
0.375
4.330***
0.688
7.341***
1.177
10.571***
1.31
10.798***
C3
0.032
0.977
0.131
3.362***
0.03
0.735
0.214
4.156***
0.082
1.543
0.109
1.743*
C4
0.021
0.578
0.004
0.084
0.008
0.181
-0.038
-0.605
-0.033
-0.575
0.1
1.31
CZ
-0.053
-1.670*
0.024
0.521
-0.015
-0.372
0.072
1.164
-0.035
-0.703
-0.0007
-0.011
F3
0.155
4.478***
0.072
1.786*
0.104
2.295**
-0.090
-1.673*
0.22
4.138***
0.199
3.197***
F4
-0.209
-6.605***
-0.310
-8.028***
-0.173
-4.271***
-0.303
-6.098***
-0.268
-5.369***
-0.357
-5.945***
F7
-0.372
-10.701***
-0.264
-5.386***
-0.366
-8.225***
-0.262
-4.048***
-0.386
-6.973***
-0.288
-3.652***
F8
0.076
2.341**
0.071
1.651*
0.041
1.004
0.124
2.245**
0.112
2.150**
0.093
1.334
FP1
-0.284
-7.016***
-0.432
-8.703***
-0.130
-2.467**
-0.203
-3.058***
-0.498
-7.675***
-0.716
-8.887***
FP2
0.084
2.068**
0.154
3.120***
-0.033
-0.594
-0.111
-1.603
0.208
3.347***
0.365
4.629***
FZ
0.087
2.703***
0.076
1.947*
0.042
0.984
-0.082
-1.623
0.109
2.191**
0.179
3.005***
O1
0.064
2.325**
0.32
7.250***
0.147
4.312***
0.397
7.105***
-0.040
-0.921
0.24
3.354***
O2
-0.025
-0.669
-0.023
-0.493
0.017
0.348
-0.088
-1.436
-0.047
-0.765
-0.028
-0.363
OZ
-0.165
-4.192***
-0.383
-8.310***
-0.106
-2.068**
-0.294
-4.919***
-0.236
-3.662***
-0.485
-6.222***
P3
-0.219
-8.059***
-0.454
-11.505***
-0.226
-7.067***
-0.328
-6.610***
-0.256
-5.330***
-0.558
-8.830***
P4
0.045
1.384
-0.039
-0.955
0.052
1.26
-0.097
-1.790*
0.058
1.107
-0.054
-0.814
PZ
-0.030
-1.007
0.005
0.12
0.039
0.996
0.159
2.771***
-0.090
-1.870*
0.02
0.307
T3
0.052
1.618
0.219
5.215***
0.069
1.606
0.096
1.697*
0.022
0.437
0.262
4.070***
T4
0.165
5.650***
0.353
9.362***
0.171
4.630***
0.442
9.168***
0.16
3.409***
0.369
5.978***
T5
0.256
8.427***
0.117
2.737***
0.162
4.240***
0.106
1.970**
0.41
8.156***
0.117
1.650*
T6
-0.015
-0.46
-0.018
-0.414
-0.138
-3.148***
-0.012
-0.228
0.118
2.161**
-0.022
-0.321
C3*Gender
-0.194
-2.781***
-0.293
-3.406***
-0.152
-1.308
C4*
Gender
0.062
0.793
0.157
1.609
-0.136
-1.048
CZ*Gender
0.059
0.81
0.069
0.745
0.108
0.946
F3*Gender
-0.097
-1.188
0.195
1.919*
-0.334
-2.538*
F4*
Gender
0.156
2.198**
0.131
1.498
0.169
1.469
F7*
Gender
-0.014
-0.177
-0.036
-0.366
-0.005
-0.045
F8*
Gender
0.011
0.139
-0.116
-1.232
0.041
0.332
FP1*
Gender
0.48
5.479***
0.269
2.404**
0.716
5.278***
FP2*Gender
-0.225
-2.449
0.042
0.343
-0.362
-2.598
FZ*Gender
-0.040
-0.479
0.052
0.482
-0.123
-0.978
O1*Gender
-0.284
-4.695***
-0.221
-2.967***
-0.404
-4.083***
O2*
Gender
0.008
0.092
0.176
1.586
-0.041
-0.302
OZ*
Gender
0.601
6.550***
0.568
4.756***
0.695
4.941***
P3*
Gender
0.472
8.283***
0.241
3.503***
0.692
7.025***
P4*
Gender
0.227
3.248***
0.26
2.998***
0.336
2.976***
PZ*
Gender
-0.137
-2.136**
-0.273
-3.409***
-0.183
-1.756*
T3*
Gender
-0.398
-5.494***
-0.094
-1.027
-0.593
-5.199***
T4*
Gender
-0.281
-4.196***
-0.470
-5.579***
-0.259
-2.432**
T5*
Gender
0.135
2.055**
0.033
0.409
0.292
2.731***
T6*
Gender
-0.264
-3.141***
-0.516
-4.864***
-0.140
-1.035
R-S
quare
d15.39%
22.88%
16.07%
27.31%
19.82%
28.68%
Obse
rvations
3550
3550
1714
1714
1738
1738
28
Tab
le8:
OL
SR
egre
ssio
nN
eura
lA
ctiv
ity
and
Fin
alP
ortf
olio
Bal
ance
DependentVariable:Fin
alPortfolio
Valu
eFull
Mark
etSim
ulation
Mark
et1
Mark
et2
(1)
(2)
(1)
(2)
(1)
(2)
Coef
TSta
tCoef
TSta
tCoef
TSta
tCoef
TSta
tCoef
TSta
tCoef
TSta
tConstant
14.411
16.803***
12.204
14.243***
14.784
13.767***
12.318
11.577
14.228
10.519***
12.669
9.454***
Gender
7.291
10.597***
9.455
12.733***
3.751
4.330***
6.885
7.341
11.768
10.579***
13.121
10.824***
C3
0.317
0.984
1.317
3.378***
0.303
0.735
2.136
4.156
0.819
1.548
1.11
1.770*
C4
0.213
0.586
0.044
0.091
0.083
0.181
-0.384
-0.605
-0.334
-0.571
1.002
1.319
CZ
-0.534
-1.665*
0.244
0.536
-0.154
-0.372
0.717
1.164
-0.356
-0.7
0.007
0.011
F3
1.546
4.478***
0.724
1.785*
1.037
2.295**
-0.9
-1.673
2.202
4.139***
1.986
3.195***
F4
-2.094
-6.604***
-3.102
-8.032***
-1.731
-4.271***
-3.03
-6.098
-2.681
-5.370***
-3.578
-5.955***
F7
-3.726
-10.700***
-2.636
-5.379***
-3.668
-8.225***
-2.629
-4.048
-3.863
-6.974***
-2.867
-3.636***
F8
0.762
2.342**
0.713
1.650*
0.412
1.004
1.238
2.245
1.116
2.151**
0.922
1.329
FP1
-2.847
-7.015***
-4.324
-8.701***
-1.301
-2.467**
-2.031
-3.058
-4.984
-7.678***
-7.169
-8.892***
FP2
0.839
2.065**
1.539
3.113***
-0.338
-0.594
-1.112
-1.603
2.078
3.347***
3.64
4.616***
FZ
0.872
2.698***
0.757
1.934*
0.418
0.984
-0.826
-1.623
1.092
2.189**
1.774
2.984***
O1
0.637
2.327**
3.198
7.256***
1.468
4.312***
3.966
7.105
-0.408
-0.92
2.411
3.368***
O2
-0.258
-0.674
-0.24
-0.501
0.17
0.348
-0.888
-1.436
-0.48
-0.769
-0.296
-0.378
OZ
-1.656
-4.190***
-3.834
-8.307***
-1.065
-2.068**
-2.946
-4.919
-2.368
-3.662***
-4.849
-6.213***
P3
-2.189
-8.056***
-4.536
-11.500***
-2.269
-7.067***
-3.281
-6.61
-2.561
-5.330***
-5.566
-8.818***
P4
0.447
1.378
-0.401
-0.97
0.523
1.26
-0.978
-1.79
0.577
1.103
-0.564
-0.847
PZ
-0.301
-1.009
0.046
0.11
0.386
0.996
1.593
2.771
-0.908
-1.874*
0.186
0.285
T3
0.518
1.613
2.182
5.205***
0.694
1.606
0.961
1.697
0.222
0.435
2.606
4.053***
T4
1.65
5.648***
3.531
9.359***
1.709
4.630***
4.422
9.168
1.595
3.409***
3.687
5.971***
T5
2.564
8.434***
1.177
2.752***
1.62
4.240***
1.063
1.97
4.099
8.164***
1.19
1.679*
T6
-0.156
-0.459
-0.179
-0.408
-1.384
-3.148***
-0.127
-0.228
1.177
2.164**
-0.213
-0.305
C3*Gender
-1.951
-2.788***
-2.939
-3.406
-1.535
-1.319
C4*
Gender
0.62
0.789
1.574
1.609
-1.368
-1.055
CZ*Gender
0.585
0.802
0.693
0.745
1.068
0.935
F3*Gender
-0.972
-1.187
1.947
1.919
-3.344
-2.536**
F4*
Gender
1.561
2.201***
1.311
1.498
1.696
1.473
F7*
Gender
-0.146
-0.183
-0.369
-0.366
-0.072
-0.057
F8*
Gender
0.106
0.139
-1.166
-1.232
0.408
0.332
FP1*
Gender
4.801
5.478***
2.693
2.404
7.163
5.279***
FP2*
Gender
-2.248
-2.445**
0.423
0.343
-3.61
-2.590***
FZ*Gender
-0.394
-0.472
0.524
0.482
-1.221
-0.966
O1*Gender
-2.85
-4.698***
-2.218
-2.967
-4.055
-4.091***
O2*
Gender
0.084
0.096
1.763
1.586
-0.405
-0.295
OZ*
Gender
6.012
6.549***
5.678
4.756
6.945
4.937***
P3*
Gender
4.719
8.278***
2.41
3.503
6.906
7.013***
P4*
Gender
2.274
3.258***
2.596
2.998
3.38
2.999***
PZ*
Gender
-1.368
-2.131**
-2.739
-3.409
-1.822
-1.745*
T3*
Gender
-3.98
-5.488***
-0.949
-1.027
-5.917
-5.189***
T4*
Gender
-2.816
-4.193***
-4.707
-5.579
-2.588
-2.427**
T5*
Gender
1.341
2.048**
0.328
0.409
2.903
2.717***
T6*
Gender
-2.65
-3.144***
-5.163
-4.864
-1.413
-1.044
R-S
quare
d15.3%
22.88%
16.07%
27.31%
19.83%
28.68%
Obse
rvations
3551
3551
1714
1714
1739
1739
29
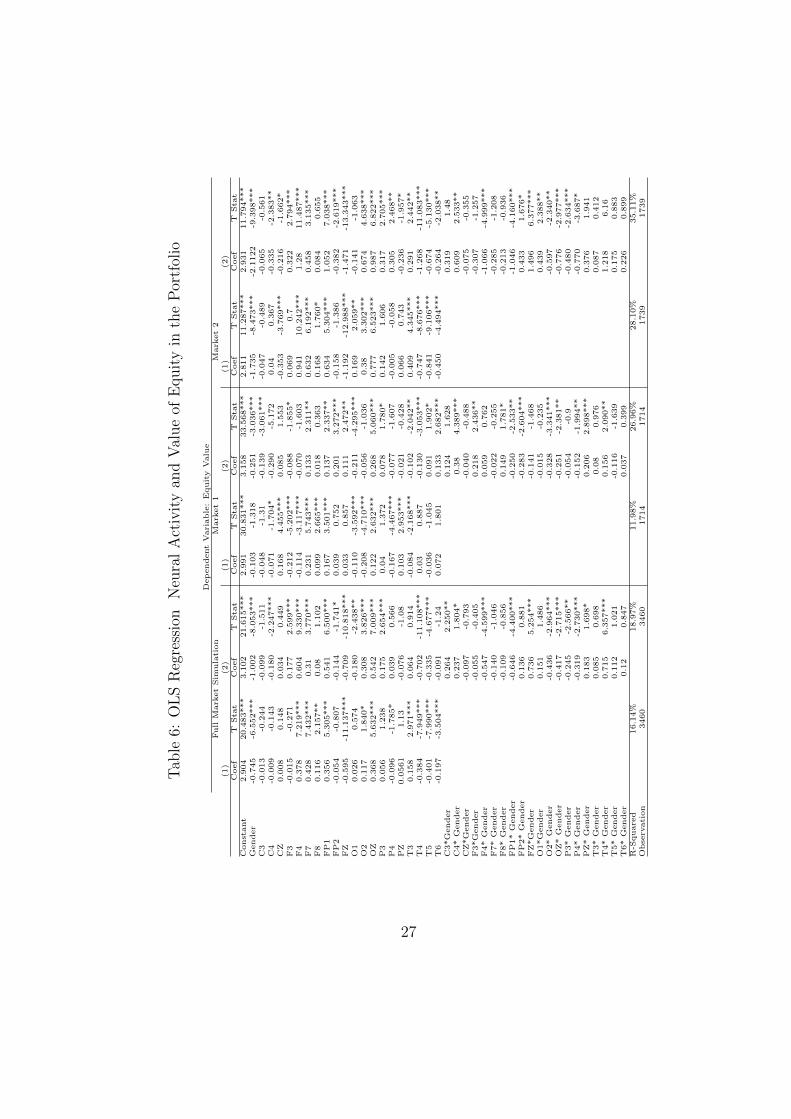
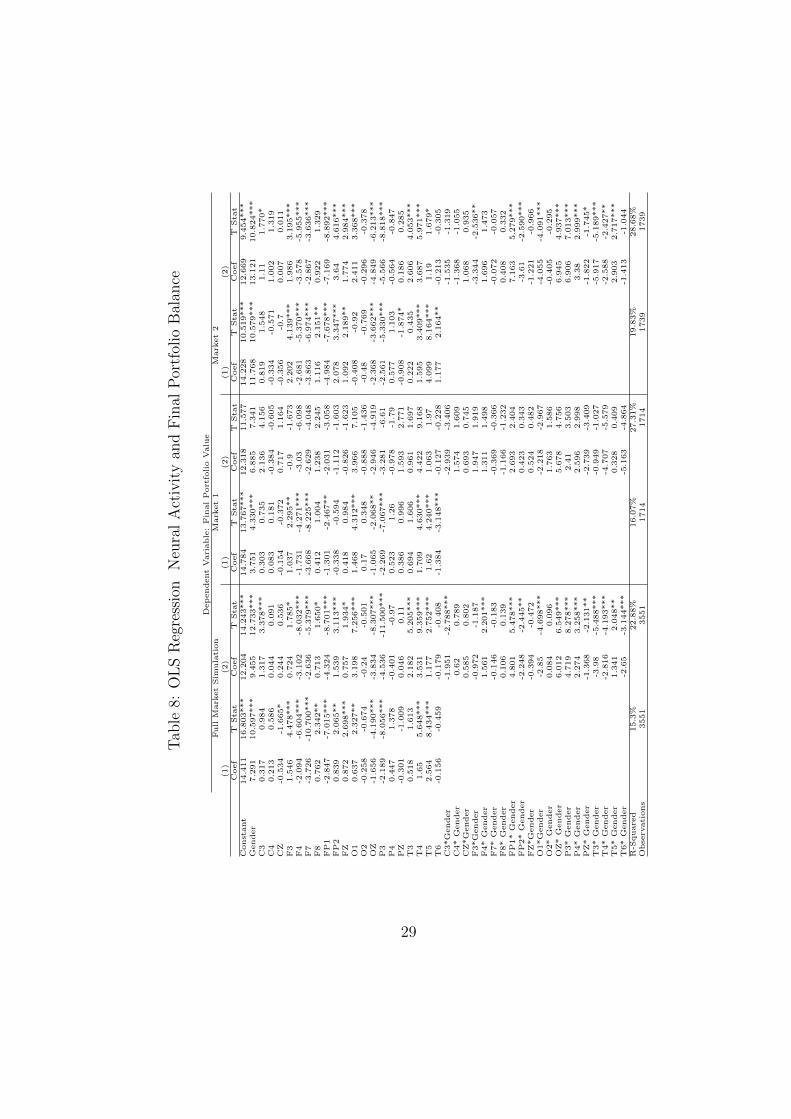
In table 6 we regress the neural activity on the log value of the stocks (risky assets)
held in the portfolio. In the first specification (1) we include the 20 electrodes as
explanatory variables. We find that gender has a highly significant negative relationship
with the value of equity in the portfolio. Females hold significantly less equity in the
portfolio. This result does not hold when looking at the data from market 1 only, but
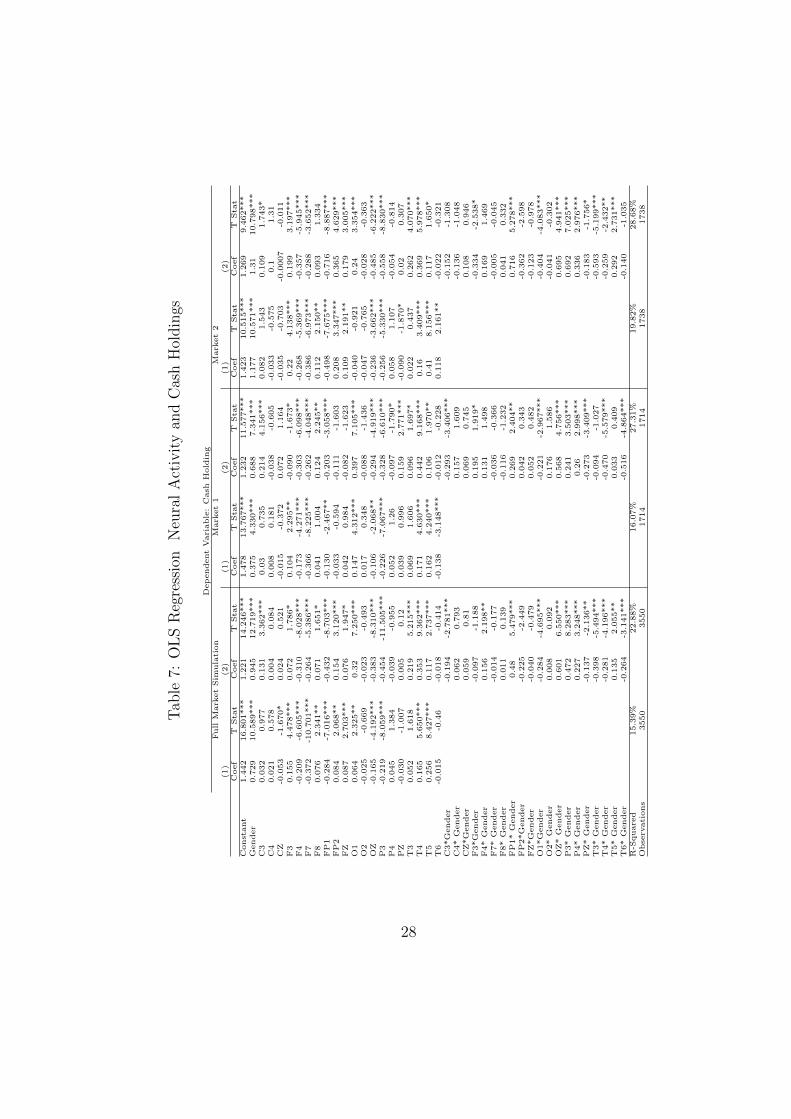
is even more pronounced when using the data for market 2 only. From Table 7 we
see that there is a highly significant positive effect from gender on the log value held
in cash in all three market cases. This helps explain that the insignificant holding in
equity for market 1 for females is due to the lower value of equity when the market
does not rise by as much as in market 2. Overall we can conclude that females hold
a significantly small position in the risk assets during the experiments. The results
are congruent with Overman (2004) who finds that males and females have a differing
response pattern. Females tended to choose investments associated with immediate wins
(or a known outcome) and males tended to choose investments related with long-term
outcome (more risk); meaning that women prefer investments that produce short terms
outcomes. Turning to the neural activity of the electrodes during the various market
simulations. A simple analysis, without interacting gender, we see that electrodes FZ
and T4, T5 and T6 are negative related with Portfolio value and F4, F7, FP1, and
OZ are positively related with the equity value in the portfolio. When looking at the
neural activity related to the value of cash held the tendency is for the sign of the
coefficients to be switch, in particular for those which show a statistically significant
relation. Electrodes F3 and P3 also become significant for the value held in cash, and
T3 is no longer significant.
When splitting the data across the two market scenarios we find that CZ and F4
30
are both significantly positive for market 1 and negatively significant for market 2, and
O1 and O2 are both significantly positive for market 1 and negative for market 2. P4
and PZ also become significant during market 1. The R2 is also much higher when
including the interaction terms and also across each market scenario. The R2 increases
from 18.97% for the full market scenario to 26.96% for the volatile market scenario,
market 1, and even higher explanatory power for market 2, with an R2 of 35.11%.
When controlling for the interaction terms across gender we find that C4 and O1
also become negatively significant, and F3, O2 and P3 become positively significant.
The interaction terms of gender with each of these electrodes captures whether women
activate more, or less, of these areas of the brain than men. We find significant negative
values on the interaction terms of F4, FP1, O2, OZ, P3 and P4, which highlights
the difference that females have on neural activity than men. Men therefore have
significantly higher activity in these brain areas, which are associated with benefit and
risk processing and value estimation.
5 Conclusion
This investigation is among the first to analyze male and female patterns of brain
activity associated with financial decision making and to what extent brain activity
is different across gender. We further investigate if these differentials also occur for
different types of investment decision. In particular we focus on the decisions to to
buy, sell or hold stocks. Using 40 participants (20 men and 20 women) who are invited
to trade during a simulated investment market with 100 financial decisions, across 50
decisions traded in market with that is growing and 50 in market which has a tendency
to decline.
31
During the decision process we use Electroencephalogram technology to capture the
brain electric activity. Our results describe that males and female use different parts of
the brain to make investment financial decision. In the case of investment decisions of
buying, selling or holding stocks we find that males activate similar parts of the brain
when making all three different types of investment decisions. Whereas females appear
to use different neural circuits. Our results highlight the importance of understanding
exactly how risk is interpreted by individuals and that whilst many see risk as an
opportunity others see it as a threat. In line with empirical findings in the behavioural
finance literature, we also find that men trade more stocks and women buy more and
sell less. Moreover women prefer to hold a larger proportion of the portfolio in cash
and men more stocks.
References
[1] Adorni, R and A. Proverbio, 2012, The Neural Manifestation of the Word Concrete-
ness Effect: An Electrical Neuroimaging Study, Neuropsychologia, 50, 880-891
[2] Barber, B, Odean, T, (2001) Boys will be Boys: Gender, Overconfidence, and Com-
mon Stock Investment. Quarterly Journal of Economics, February, 261-292.
[3] Barnea, A, Cronqvist, H, Siegel, S. (2010) Nature or Nurture: What Determines
Investor Behavior? Working paper.
[4] Becker, G., 1957, The Economics of Discrimination. 1st ed. , Chicago: University
of Chicago Press.
32
[5] Bertrand, M., Hallock, K. (2001) The Gender Gap in Top Corporate Jobs. Industrial
and Labor Relations Review, LV 321.
[6] Black, S., Strahan, P. E. (2001) The Division of Spoils: Rent-Sharing and Discrim-
ination in a Regulated Industry. American Economic Review, XCI (2001), 814831.
[7] Blau, F. D, Kahn, L. M. (2000) Gender Differences in Pay. Journal of Economic
Perspectives 14(4) 75-99.
[8] Bossaerts, P., 2010, Risk and Risk Prediction Error Signals in Anterior Insula, Brain
Structure and Function, 214, 645-653
[9] Braver, T., M. Barch, J. Gray, D. Molfese and A. Snyder 2001, Anterior Cingulate
Cortex and Response Conflict: Effects of Frequency, Inhibition and Errors, Cerebral
Cortex, 11(9), 825-836.
[10] Breaban, A, Noussair, C. (2013) Emotional State and Market Behavior. Working
paper.
[11] Brodmann, K. (1909).Vegleichende Lokalisationslehre der Grosshirnde. Barth,
Leipzig.
[12] Brody, L. R. (1985). Gender Differences in Emotional Development: A Review of
Theories and Research. Journal of Personality 53:102-49.
[13] Burgess P., G. Gonen-Yaacovi and E. Volle, 2011, Functional Neuroimaging Studies
of Prospective Memory: What Have We Lear so Far?, Neuropsychologia, 49, 2246-57.
[14] Burianov, H., E. Ciaramelli, C. Grady and M. Moscovitch, 2012, Top-down and
Bottom-up Attention-to-Memory: Mapping Functional Connectivity in Two Distinct
33

Networks that Underlie Cued and Uncued Recognition Memory, NeuroImage, 63,
1343-1352.
[15] Bush, G., P. Luu and M. Posner, 2000. Cognitive and Emotional Influences in
Anterior Cingulate Cortex, Trends in Cognitive Sciences 4 (6), 215-222.
[16] Campbell, R., M. MacSweeney and D. Waters, 2008, Sign Language and the Brain:
A Review, Journal of Deaf Studies and Deaf Education 13, 3-20.
[17] Caplin, A, Leahy, J (2001) Psychological Expected Utility Theory and Anticipatory
Feelings. Quarterly Journal of Economics, February, 55-79.
[18] Cavanna A. and M.Trimble, 2006, The Precuneus: A Review of its Functional
Anatomy and Behavioural Correlates, Brain 129 (pt 3), 564-83.
[19] Cho, S. G. Pellecchia, J. H. Ko, N.Ray, I. Obeso, S. Houle and A. P. Strafella (2013)
Effect of Continuous Theta Burst Stimulation of the Right Dorsolateral Prefrontal
Cortex on Cerebral Blood Flow Changes During Decision Making, Brain Stimulation
5, 116-123.
[20] Coates, J, Herbert, J (2008) Endogenous Steroids and Financial Risk Taking on a
London Trading Floor. Proceedings of National Academy Science 105(16), 6167-72.
[21] Coull J., R. Cheng and W. Meck, 2011, Neuroanatomical and Neurochemical Sub-
strates of Timing, Neuropsychopharmacology 36(1), 3-25.
[22] Croson, R, Gneezy, U. (2009) Gender Differences in Preferences. Journal of Eco-
nomic Literature. 47(2) 448-474.
34
[23] Deppe, M., W. Schwindt, J. Krmer, H. Kugel, H. Plassmann, P. Kenning and E.
Ringelstein, 2005, Evidence for a Neural Correlate of a Framing Effect: Bias-Specific
Activity in the Ventromedial Prefrontal Cortex During Credibility Judgments, Brain
Research Bulletin 67, 413-421.
[24] Dien, J., S. Brian, D. Molfese and B. Gold, 2013, Combined ERP/fMRI Evidence
for Early Word Recognition Effects in the Posterior Inferior Temporal Gyrus, Cortex
49 (9), 2307-2321.
[25] Ernst, M., E. Eric, B. Nelson, E. McClure, Ch. Monk, S. Munson, N. Eshel, E.
Zarahn, E. Leibenluft, A. Zametkin, K. Towbin, J. Blair, D. Charney and D. S Pine ,
2004, Choice Selection and Reward Anticipation: An fMRI Study, Neuropsychologia,
42, 1585-1597.
[26] Fehr, T., C. Code and M. Herrmann, 2007, Common Brain Regions Underlying Dif-
ferent Arithmetic Operations as Revealed by Conjunct fMRIBold Activation, Brain
Research 1172, 93-102
[27] Fiez J. and S. Petersen, 1998, Neuroimaging Studies of Word Reading, Proceedings
of National Academy of Science 95(3), 914-21.
[28] Friederici, A., 2011, The Brain Basis of Language Processing: From Structure to
Function, Physiology Review 91, 1357-92.
[29] Frydman, C., Barberis, N., Camerer., C., Bossaerts, P., Rangel, A., (2013) Testing
Theories of Investor Behavior Using Neural Data. Journal of Finance 96, 2, 907-946.
[30] Gehring, W, Willoughby, J. (2002).The Medial Frontal Cortex and the Rapid Pro-
cessing of Monetary Gains and Losses. Science 295, 2279 2282.
35
[31] Gneezy, U, Niederle, M, Rustichini, A. (2003) Performance and Competitive Envi-
ronments: Gender Differences. Quarterly Journal of Economics. August, 1049-1074.
[32] Goldapple K, Z Segal , C. Garson, M Lau, P. Bieling, S. Kennedy and H. May-
berg, 2004, Modulation of Cortical-limbic Pathways in Major Depression: Treatment-
Specific Effects of Cognitive Behavior Therapy, Arch Gen Psychiatry, 61(1), 34-41.
[33] Goldin, C., Rouse, C. (2000) Orchestrating Impartiality: The Impact of Blind
Auditions on Female Musicians. American Economic Review, XL 715742.
[34] Goldstein, J., Jerram, M., Russel, P., Anagnoson, R., Breiter, H., Makris, N.,
Goodman, J., Tsuang, M. (2005). Sex Differences in Prefrontal Cortical Brain Ac-
tivity During FMRI of Auditory Verbal Working Memory. Neuropsychology 19 (4),
509-19.
[35] Gottfried, J., J. ODoherty and R. J. Dolan, 2003, Encoding Predictive Reward
Value in Human Amygdala and Orbitofrontal Cortex, Science 301, 1104-1107
[36] Grabner R., D. Ansari, K. Koschutnig, G. Reishofer, F. Ebner and C. Neuper,
2009, To Retrieve or to Calculate? Left Angular Gyrus Mediates the Retrieval of
Arithmetic Facts During Problem Solving, Neuropsychologia 47, 604608.
[37] Grindrod, G., N. Bilenko, E. Myers and S. Blumstein, 2008, The Role of the Left
Inferior Frontal Gyrus in Implicit Semantic Competition and Selection: An Event-
Related fMRI Study, Brain Research 1229, 167-178.
[38] Grossman, M., Wood, W. (1993) Sex Differences in Intensity of Emotional Expe-
rience: A Social Role Interpretation. Journal of Personality and Social Psychology.
65(5) 1010-1020.
36
[39] Gur, R., Gunning-Dixon, F, Bilker, W., Gur, R. (2002a). Sex Differences in
Temporo-Limbic and Frontal Brain Volumes of Healthy Adults. Cerebral Cortex 12
(9), 998-1003.
[40] Gur, R., Gunning-Dixon, F., Turetsky, B.; Bilker, W.; Gur, Raquel, E., (2002b).
Brain Region and Sex Differences in Age Association With Brain Volume: A Quanti-
tative MRI Study of Healthy Young Adults. American Journal Geriatric Psychiatry
10 (1): 72-80.
[41] Halari, R.; Hines, M.; Kumari, V.; Mehrotra, R.; Wheeler, M.; Ng, V.; Sharma,
T. (2005). Sex Differences and Individual Differences in Cognitive Performance and
their Relationship to Endogenous Gonadal Hormones and Gonadotropins. Behavio-
rial Neuroscience 119 (1): 104-17.
[42] Halsband U. and R. Lange, 2006, Motor Learning in Man: A Review of Functional
and Clinical Studies, Journal of Physiology 99(4-6), 414-24.
[43] Hampshire A., S. Chamberlain, M. Monti, J. Duncan and A. Owen, 2010, The Role
of the Right Inferior Frontal Gyrus: Inhibition and Attentional Control, Neuroimage
50(3), 1323-1329.
[44] Harshman, R. A., Paivio, A. (1987) ‘Paradoxical’ Sex Differences in Self-Reported
Imagery. Canadian Journal of Psychology. 41: 287- 302.
[45] Hartgens, F., Kuipers, H. (2004). Effects of Androgenic-Anabolic Steroids in Ath-
letes. Sports Medicine 34, 513554.
37
[46] Jacobsen, B., J. B. Lee, W. Marquering, C. Zhang (2014) Gender differences in
optimism and asset allocation. Forthcoming in Journal of Economic Behavior and
Organization.
[47] Jausovec, N., Jausovec, K. (2009). Do Women See Things Differently than do men?
Neuroimage 45, 198-207.
[48] Jianakoplos, N. Bernasek, A. (1998). Are Women More Risk Averse? Economic
Inquiry, 36, 620-630.
[49] Jordan, K., Wustenberg, T., Heinze, H. Peters, M., Jancke, L.(2002). Women and
Men Exhibit Different Cortical Activation Patterns During Mental Rotation Tasks.
Neuropsychologia 40 (13), 2397-408.
[50] Kaufmann, L. S. Vogel, G. Wood, C. Kremser, M. Schocke, L. Zimmerhackl and
J. Kote, 2008, A Developmental fMRI Study of Nonsymbolic Numerical and Spatial
Processing, Cortex 44, 376-385.
[51] Kelly, A. M., Uddin, L. Q., Biswal, B. B., Xavier Castellanos, F., Milham, M. P.,
2008. Competition between functional brain networks mediates behavioral variability.
NeuroImage 39, 527-537.
[52] Khan, W., Vieito, J. (2013). CEO Gender and Firm Per-
formances. Journal of Economic and Business (forthcoming).
http://dx.doi.org/10.1016/j.jeconbus.2013.01.003.
[53] Kim, H., 2010, Dissociating the Roles of the Default-Mode, Dorsal, and Ventral
Networks in Episodic Memory Retrieval, NeuroImage 50, 1648-1657.
38
[54] Knutson, B., Fong, G., Bennett, S., Adams, C. and Hommer, D. (2003). A Region
of Mesial Prefrontal Cortex Tracks Monetarily Rewarding Outcomes: Characteriza-
tion With Rapid Event-Related FMRI. Neuroimage 18, 263272.
[55] Knutson B., S. Rick, G. Wimmer, D. Prelec and G. Loewenstein, 2007, Neural
Predictors of Purchases, Neuron, 53, 147-156.
[56] Knutson, B., Bossaerts, P. (2007). Neural Antecedents of Financial Decisions. Jour-
nal of Neuroscience 27, 8174-8177.
[57] Koedijk, C. G., Pownall, R. A., Statman, M, (2013) Aspirations for Income: Status,
Competitiveness and Risk Attitudes. Working paper.
[58] Koelsch, S., 2014, Brain Correlates of Music-Evoked Emotions, Nature Review
Neuroscience 15, 170-180.
[59] Krueger F., J. Moll, R. Zahn, A. Heinecke and J. Grafman, 2007, Event Frequency
Modulates the Processing of Daily Life Activities in Human Medial Prefrontal Cortex,
Cerebral Cortex 17, 2346. 2353.
[60] Kuhnen, C., Knuston, B. (2005). The Neural Basis of Financial Risk Taking. Neu-
ron 47,763-770.
[61] Kuhnen, C, Knutson, B. (2011). The Influence of Affect on Beliefs, Preferences,
and Financial Decisions. Journal of Financial Quantitative Analysis, 46, 605626.
[62] Kuhnen, C., Samanez-Larkin, G. R., Knutson, B. (2011) Serotonin and Risk Tak-
ing: How Do Genes Change Financial Choices. Working Paper.
39
[63] Kwok S., T. Shallice and E. Macaluso, 2012, Functional Anatomy of Temporal Or-
ganisation and Domain-specificity of Episodic Memory Retrieval, Neuropsychologia
50, 2943-2955.
[64] LeDoux, J. (1993) Emotional Networks in the Brain. In Handbook of Emotions.
M. Lewis and J. Haviland, eds. New York: Guildford Press.
[65] Lerner J., R. Gonzalez, D. Small and B. Fixchhoof, 2003, Effects of Fear and Anger
on Perceived Risk of Terrorism: A national Field Experiment, Psychological Science,
14(2), 144-150.
[66] Leung H., J. Gore and P. Goldman-Rakic, 2002, Sustained Mnemonic Response
in the Human Middle Frontal Gyrus during On-Line Storage of Spatial Memoranda,
Journal of Cognitive Neuroscience 14, 659-671
[67] Lo, A., Repin, D. (2002) The Pyschophysiology of Real-Time Financial Risk Pro-
cessing. Journal of Cognitive Neuroscience. 4(3) 323-339.
[68] Luna B., K. Thulborn, M. Strojwas, B. McCurtain, R. Berman, C. Genovese and
J. Sweeney, 1998, Dorsal Cortical Regions Subserving Visually Guided Saccades in
Humans: An fMRI Study, Cerebral Cortex 8(1), 40-47.
[69] Mayhew S., S. Li and Z. Kourtzi, 2012, Learning Acts on Distinct Processes for
Visual Form Perception in the Human Brain, Jorunal of Neuroscience 32(3), 775-786.
[70] Mazur, A., Booth, A. (1998). Testosterone and Dominance in Men. Behavioral and
Brain Sciences, 21, 353-397.
40
[71] McClure E., C. Monk, E. Nelosn, E. Zarahn, E. Leibenluft, R. Bilder, D. Charney;
M. Ernst and D. Pine, 2004, A Developmental Examination of Gender Differences in
Brain Engagement During Evaluation of Threat, Biology Psychiatry 55 (11), 1047-55.
[72] Morelli S., L. Rameson and M. Lieberman, 2014, The Neural Components of Em-
pathy. Predicting Daily Prosocial, Behavior, Social Cognitive Affect Neuroscience
9(1):39-47.
[73] Obeso, I., S. Cho, F. Antonelli, S. Houle, M. Jahanshahi, J. Ko and A. Strafella,
2013, Stimulation of the Pre-SMA Influences Cerebral Blood Flow in Frontal Areas
Involved with Inhibitory Control of Action, Brain Stimulation 5, 769-776.
[74] Overman, W., 2004, Sex Differences in Early Childhood. Adolescence. and Adult-
hood on Cognitive Tasks That Rely on Orbital Prefrontal Cortex, Brain and Cogni-
tion 55 (1), 134-47.
[75] Padoa-Schioppa C. and J. Assad, 2006, Neurons in Orbitofrontal Cortex Encode
Economic Value, Nature 441, 223226.
[76] Paulus, M., J. Feinstein, D. Leland and A. Simmons, 2005, Superior Temporal
Gyrus and Insula Provide Response and Outcome-Dependent Information During
Assessment and Action Selection in a Decision-Making Situation, NeuroImage 25, 2,
607-615.
[77] Paulus M., C. Rogalsky, A. Simmons, J. Feinstein and M. Stein, 2003, Increased
Activation in the Right Insula During Risk-Taking Decision Making is Related to
Harm Avoidance and Neuroticism, NeuroImage 19, 1439-1448.
41
[78] Periez J., F. Maest, F. Barcel, A. Fernndez, C. Amo, T. Alonso, 2004, Spatiotem-
poral Brain Dynamics During Preparatory Set Shifting: MEG Evidence, NeuroImage
21 (2) 2, 687-695.
[79] Petersen S., H. van Mier, J. Fiez and M. Raichle, 1998, The Effects of Practice on
the Functional Anatomy of Task Performance, Proceedings of National Academy of
Science U S A 95(3), 853-60.
[80] Polachek, S. W., (1981) Occupational Self-Selection: A Human Capital Approach
to Sex Differences in Occupational Structure. Review of Economics and Statistics,
LXIII (1981), 6069.
[81] Preuschoff K., Bossaerts P., Quartz S. (2006). Neural Differentiation of Expected
Reward and Risk in Human Subcortical Structures. Neuron, 51:38190.
[82] Price C., 2012, A Review and Synthesis of the First 20 Years of PET and fMRI
Studies of Heard Speech, Spoken Language and Reading, Neuroimage 62, 816-847.
[83] Ramnani N. and A. Owen, 2004, Anterior Prefrontal Cortex: Insights Into Function
from Anatomy and Neuroimaging, Nature Reviews Neuroscience 5, 184-194.
[84] Ranganath C, M. Johnson and M. D’Esposito, 2003, Prefrontal Activity Associated
with Working Memory and Episodic Long-Term Memory, Neuropsychologia 41, 378-
89.
[85] Reynolds J., R. West and T. Braver, 2009, Distinct Neural Circuits Support Tran-
sient and Sustained Processes in Prospective Memory and Working Memory, Cerebral
Cortex 19, 1208-21.
42
[86] Rizzolatti G., C. Scandolara, M. Matelli and J. Gentilucci, 1981, Afferent Proper-
ties of Periarcuate Neurons in Macaque Monkeys, II. Visual Responses, Behavioural
Brain Research 2 (2), 147163.
[87] Rocha A., E. Massad and A. Pereira Jr, 2004, The Brain: From Fuzzy Arithmetic
To Quantum Computing, Springer Verlag.
[88] Rocha A., F. Rocha and E. Massad, 2011, The Brain as a Distributed Intelligent
Processing System. Plos One 6(3) e17355.
[89] Rocha, A. F., F. T. Rocha and E. Massad (2013) Moral Dilemma Judg-
ment Revisited: A Loreta Analysis. J. Behavioral and Brain Science, doi:
10.4236/jbbs.2013.38066.
[90] Rocha F., A. Rocha, E. Massad and R. Menezes, 2005, Brain Mappings of the
Arithmetic Processing in Children and Adults, Cognitive Brain Research 22, 359-
372.
[91] Rogers R., A. Owen, H. Middleton, E. Williams, J. Pickard, B. Sahakian and
T. Robbins, 1999, Choosing Between Small, Likely Rewards and Large, Unlikely
Rewards Activates Inferior and Orbital Prefrontal Cortex, Journal of Neuroscience
19, 9029-38.
[92] Rubia K and A. Smith, 2004, The Neural Correlates of Cognitive Time Manage-
ment: A Review, Acta Neurobiologiae Experimentalis 64(3), 329-40.
[93] Samanez-Larkin, G., Gibbs, S., Nielsen, L., Khanna, K., Carstensen, L., Wrase,
J., Kahnt, T., Schlagenhauf, F., Beck, A., Cohen, M. X., Knutson, B., Heinz, A.
43
(2007). Different Neural Systems Adjust Motor Behavior in Response to Reward and
Punishment. NeuroImage, 36, 1253-1262.
[94] Samanez-Larkin, G. R., Kuhnen, C. M., Yoo, D. J. Knutson, B. (2010). Variability
in Nucleus Accumbens Activity Mediates Age-Related Suboptimal Financial Risk
Taking. The Journal of Neuroscience, 30, 14261434.
[95] Schneider S., J. Peters, U. Bromberg, S. Brassen, M. Menz, S. Miedl, E. Loth, T.
Banaschewski, A. Barbot, G. Barker, P. Conrod, J. Dalley, H. Flor, J. Gallinat, H.
Garavan, A. Heinz, B. Itterman, C. Mallik, K. Mann, E. Artiges, T. Paus, J. Poline,
M. Rietschel, L. Reed, M. Smolka, R. Spanagel, C. Speiser, A. Strohle, M. Struve, G.
Schumann and C. Buchel, 2011, Boys do it the Right Way: Sex-Dependent Amygdala
Lateralization During Face Processing in Adolescents, NeuroImage 56(3), 1847-53.
[96] Schultz J. and T. Lennert, 2009, BOLD Signal in Intraparietal Sulcus Covaries
with Magnitude of Implicitly Driven Attention Shifts, NeuroImage 45, 4, 1314-1328.
[97] Shannon, C. E. (1948) A Mathematical Theory of Communication. The Bell Sys-
tem Technical Journal, 27:379423, 623656.
[98] Smith E., J. Jonides, C. Marshuetz and R. Koeppe, 1998, Components of Verbal
Working Memory: Evidence from Neuroimaging, Proceedings of National Academy
Science U S A 95(3), 876-82.
[99] Smith A., R. Henson , M. Rugg and R. Dolan, 2005, Modulation of retrieval
processing reflects accuracy of emotional source memory, Learning and Memory 12
(5), 472-479.
44
[100] Strominger N., R. Demarest and L. Laemle, 2012, Nobacks Human Nervous Sys-
tem, Seventh Edition, Structure and Function, Springer
[101] Sokhi, D. S, Hunter, M. D., Wilkinson, I. D., Woodruff, P. W. 2005. Male and
Female Voices Activate Distinct Regions in the Male Brain. Neuroimage. 27:572-578.
[102] Thaler, R. H., Sunstein, C. R. (2008) Nudge: Improving Decisions about Health,
Wealth, and Happiness. Yale University Press.
[103] Tian, L., Wang, J., Yan, C., He, Y. (2011). Hemisphere- and Gender-Related
Differences in Small-World Brain Networks: A Resting-State Functional MRI Study.
Neuroimage 54 (1) 191202.
[104] Tsujimoto S, A. Genovesio and S. Wise, 1999, Frontal Pole Cortex: Encoding
Ends at the End of the Endbrain, Journal of Neuroscience, 19, 9029-38.
[105] Van Overwalle F. and K. Baetens K., 2009, Understanding Others’ Actions and
Goals by Mirror and Mentalizing Systems: A Meta-Analysis, Neuroimage 48(3), 564-
84.
[106] Vingerhoets G., J. Borsel, C. Tesink, M. Noort and K. Deblaere, 2003, Multilin-
gualism: an fMRI study, NeuroImage 20 (4), 2181-2196.
[107] Vitacco D., D. Brandeis, R. Pascual-Marqui and E. Martin, 2002, Correspondence
of Event-Related Potential Tomography and Functional Magnetic Resonance Imaging
During Language Processing, Human Brain Mapping 17, 4-12.
[108] Volle E., G. Gonen-Yaacovi, A. Costello, S. Gilbert and P. Burgess, 2011, The
Role of Rostral Prefrontal Cortex in Prospective Memory: A Voxel-Based Lesion
Study, Neuropsychologia 49, 2185-98.
45

[109] Volz K., R. Schubotz and D. von Cramon, 2005, Variants of Uncertainty in
Decision-Making and Their Neural Correlates, Brain Research 65, 40312.
[110] Watson C. and A. Chatterjee, 2012, A Bilateral Frontoparietal Network Underlies
Visuospatial Analogical Reasoning, NeuroImage 59, 2831-2838.
[111] Wenneras C. and A. Wold, 1997, Nepotism and Sexism in Peer-Review, Nature
387(6631), 341-343.
[112] Zhang S. and C. Li, 2012, Functional Connectivity Mapping of the Human Pre-
cuneus by Resting State fMRI, NeuroImage 59, 3548-3562.
46