Embed Size (px)
Citation preview

Paul Eitelman Investment Strategist, North America
Graham Harman Senior Investment Strategist, Asia-Pacific
Shailesh Kshatriya, CFA Director, Canadian Strategies
Van Luu, Ph.D. Head of Currency & Fixed Income Strategy
Kara Ng Senior Quantitative Investment Strategy Analyst
Andrew Pease Global Head of Investment Strategy
Abraham Robison Quantitative Investment Strategist
DECEMBER 2016
RUSSELL INVESTMENTS
2017 Global Market Outlook
The search for investment portfolio returns is not going to get any easier in 2017 against a backdrop of record U.S. equity prices, narrow credit spreads and low bond yields.
The New Abnormal
Wouter Sturkenboom, CFA, CAIA Senior Investment Strategist, EMEA
Robert Wilson Investment Strategy Analyst
Stephen Wood, Ph.D. Chief Market Strategist

Russell Investments // 2017 Global Market Outlook // The new abnormal 2 of 16
Introduction: investment tourism
Brexit and U.S. President-elect Donald Trump make a complicated late-cycle outlook even less predictable. Investors will need to navigate stretched valuations in 2017 and a potentially more aggressive U.S. Federal Reserve (Fed) as they work out the policy direction of the new U.S. administration.
The United Nations has designated 2017 as the year of sustainable tourism1, which I believe is a worthy accreditation in these environmentally sensitive times. It is a theme that investors would do well to follow, in our
view. The search for returns is not going to get any easier against a backdrop of record U.S. equity prices, narrow credit spreads and low bond yields. We need to be tourists in the investment sense and venture further afield in our search for investment returns.
The election of Donald Trump as U.S. president has thrown an extra element of uncertainty into our outlook. We believe markets are assuming that the new administration will have a policy mix that will boost growth, equities, and the U.S. dollar, as well as push the Fed into more tightening. But there are large uncertainties about the president-elect's views. Some of his campaign comments about withdrawing from trade deals and imposing tariffs on China, if enacted, have the potential to send the global economy into a renewed downturn. The post-election optimism driving markets in late 2016 could quickly reverse.
With this backdrop, we would respond in three ways: (1) diversify sources of returns, (2) use a robust dynamic asset allocation process to guide tactical positioning, and (3) seek effective implementation capabilities.
Russell Investments has, for example, incorporated strategies such as bank loans and mortgage prepayments into some of the firm’s multi-asset portfolios. These assets potentially reduce exposure to rising interest rates and help diversify away from traditional credit exposure. Mortgage prepayments can provide exposure to much healthier household balance sheets and benefit from rising rates. With emerging markets hammered after the U.S. election on Nov. 8, 20162, we think there are opportunities in select countries and their equity, bond and currency markets.
We’re also making extra use of factor-based strategies. For example, our Conscious Currency™ strategy uses the factor constituents of value, carry and trend to help provide diversified returns. We believe that dynamically managing currency exposures will be essential in 2017 with policy-related volatility in these markets. Our portfolio managers have widened their direct investment capabilities to gain access to equity factors such as growth, value, quality, volatility, momentum and size.
And our implementation capabilities allow us to seek opportunities in derivative markets, most importantly by taking out downside protection when the markets are overly optimistic.
The tactical process used by our global team of investment strategists is based on the building blocks of business cycle, value and sentiment. This process has helped us navigate markets in recent years, balancing concerns about valuations against positive cycle views and sentiment shifts between extremes of overbought and oversold.
2017 offers few certainties and plenty of potential risks. We believe investors will need to take a grand tour of the returns landscape with a good map to arrive at some rewarding portfolio destinations. n
CONTENTS
3 Investment outlook
6 U.S. outlook
8 Eurozone outlook
10 Asia-Pacific outlook
12 Currencies
14 Modeling insights
INTRODUCTION
By Jeff HusseyGlobal Chief Investment Officer
1 Source: United Nations, resolution 70/193.
2 Source: MSCI Emerging Markets Index, as of Nov. 25, 2016.

Russell Investments // 2017 Global Market Outlook // The new abnormal 3 of 16
Outlook 2017: the new abnormal
Political uncertainty dominates the 2017 outlook as markets adjust to the new realities of President-elect Trump and Brexit.
We expect the following to unfold in 2017:
› Global equities to modestly outperform fixed income and cash
› U.S. gross domestic product (GDP) growth of 2.25% for 2017
› U.S. payroll gains averaging 140,000 for the next 12 months
› The Fed to follow the December rate rise with two further hikes
› U.S. 10-year Treasury yield at 2.5% by the end of 2017
› U.S. dollar to strengthen, but no 1980s-style overshoot
› Europe and Japan to outperform U.S. equities
› Target for the S&P 500® Index of 2,100 by the end of 2017
Brexit + Trump = uncertainty2016 will be remembered as the year in which the aftershocks of the 2008 financial crisis finally crashed into the political process, delivering Brexit and President-elect Trump. The global implications are trade protection, more restrictive immigration, fiscal stimulus and additional geopolitical risk. In particular, Trump’s tariff threats against China could trigger an escalation in tensions between the incumbent and ascendant superpowers.
Near-term, we should expect better economic growth, particularly in the U.S., where President-elect Trump is likely to deliver tax cuts and infrastructure spending. Fiscal stimulus is likely to be a global trend as politicians move away from austerity and take heed of the ballot box messages delivered in the U.S. and UK. Longer-term, however, trade protectionism means slower growth and higher inflation. There is also the risk that the Trump stimulus overheats the U.S. economy, resulting in more Fed tightening and an economic downturn in 2018.
Global monetary policy divergence remains an important theme, and we believe it will be magnified by President-elect Trump. We expect the Fed to follow a December federal funds rate tightening with two further hikes in 2017. Meanwhile, monetary policy in the UK and Japan is set to remain very accommodative, and the European Central Bank (ECB) is likely to extend its asset purchases.
The main investment implications are a less friendly environment for U.S. government bonds and upward pressure on the U.S. dollar. U.S. 10-year Treasury yields have risen by nearly 60 basis points since the U.S. election on Nov. 8, but at 2.4% as of Nov. 30, 2016, they are below our fair-value range of 2.5% to 2.9%. The U.S. dollar (USD) is already expensive and close to the 2002 peak. We believe it has some further upside potential, but this is limited by the feedback loop between the dollar and Fed tightening. Significant further dollar strength will weaken the economy and in our view make the Fed less aggressive, which will then likely put downward pressure on the dollar.

Russell Investments // 2017 Global Market Outlook // The new abnormal 4 of 16
A mixed outlook for equity marketsThe United States is expensive and profit growth is likely to be at best in the mid-single digits. Margins are high and we expect they will come under pressure from rising labor costs and the stronger dollar. Fundamental support for U.S. equities looks mediocre, but there is the risk of an extended overbought period on euphoria over an anticipated Trump stimulus for the U.S. economy.
Japan and Europe seem better placed for equity returns. Both have much better value than the U.S., less political uncertainty and central banks that are likely to continue with supportive policy settings.
Japan’s outlook depends on fiscal stimulus from Prime Minister Abe. This will push up inflation, lower real interest rates and put more downward pressure on the yen. The Bank of Japan has effectively promised to fully finance any further fiscal expansion3.
Political risk is an issue for Europe with elections in Germany, the Netherlands, France and potentially Italy in 2017. France’s Marine Le Pen is the closest populist leader Europe has to a President-elect Trump, and Italy’s Five Star Movement has threatened a referendum on the euro if elected. But support for the euro is still strong across the wealthier European countries4, and the immigration crisis that fueled populist support in 2015 looks to have abated. Europe looks poised to benefit from stronger profits, the weaker euro, supportive ECB policy and an improvement in bank balance sheets.
The outlook for emerging markets (EM) is more nuanced. Rising U.S. interest rates and a stronger dollar provide headwinds, but a number of emerging economies are benefiting from stronger exports, lower inflation and easier central bank policy settings. China’s leading indicators5 are starting to pick up for the first time in nearly four years. The leverage build-up across most emerging markets in recent years is still a concern, particularly in China, Russia, Brazil, Mexico and Turkey6. Valuation remains attractive, but we believe emerging markets need a Goldilocks scenario of robust global growth without an aggressive Fed or strong U.S. dollar to do well.
Key indicatorsIn 2016 we focused on non-farm payrolls growth, S&P 500 earnings per share (EPS) and emerging markets trade as the three main indicators to watch. The key issues for 2017, in our view, revolve around inflation pressures and stimulus. Our most watched indicators will be:
› U.S. wage measures. Wages likely will give us the best read on U.S. inflation pressures and the extent of Fed tightening. The Federal Reserve Bank of Atlanta's wage growth tracker gives probably the most accurate measure, indicating a steady rise during 2016, including an eight-year high of 3.9% in October.
› Fiscal policy announcements. We believe one of the key stories of 2017 will be the extent of the switch to fiscal expansion.
› Emerging markets trade. EM exports have been on a recovering trend during 2016. This will need to continue to offset the negative impact from Fed tightening and a stronger dollar.
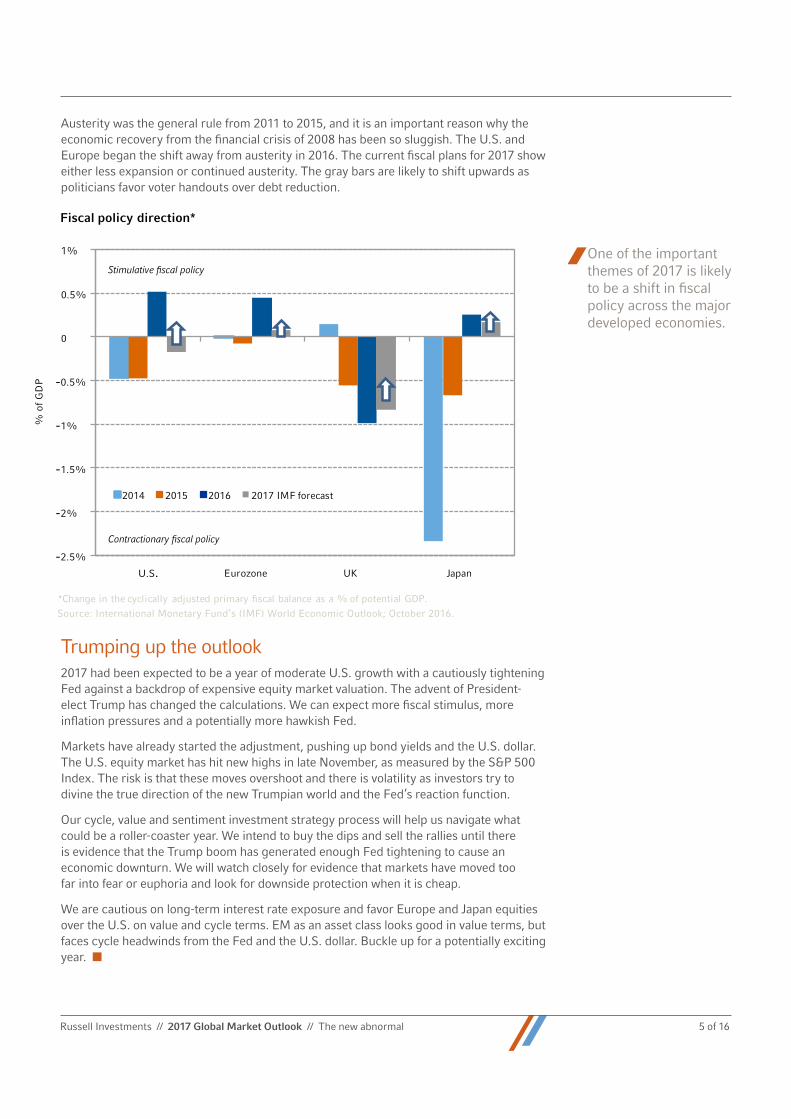
Austerity — you're firedOne of the important themes of 2017 is likely to be a shift in fiscal policy across the major developed economies. The chart on the next page shows the stance of fiscal policy using data compiled on a consistent basis by the International Monetary Fund (IMF). A reduction of the deficit (shown as a negative bar on the chart) implies contractionary fiscal policy. It means the government is withdrawing funds from the economy. A larger deficit implies a shift to fiscal expansion.
3 Source: Bank of Japan’s Monetary Policy meeting summary, Sept. 20, 2016.
4 Source: French Institute of Public Opinion (IFOP) poll, conducted between June 28 and July 6, 2016. EU membership was favored by 81% in Germany, 67% in France and 59% in Italy.
5 China’s leading indicators cited here include their Consumer Expectations Index and the total number of loans issued by financial institutions.
6 Source: Bank for International Settlements, as of Aug. 5, 2016.
Fundamental support for U.S. equities looks mediocre, but there is the risk of an extended overbought period on euphoria over an anticipated Trump stimulus for the U.S. economy.
Russell Investments // 2017 Global Market Outlook // The new abnormal 5 of 16
-2.5%
-2%
-1.5%
-1%
-0.5%
0
0.5%
1%
U.S. Eurozone UK Japan
% o
f G
DP
*Change in the cyclically adjusted primary fiscal balance as a % of potential GDP.Source: International Monetary Fund’s (IMF) World Economic Outlook; October 2016.
Fiscal policy direction*
2014 2015 2016 2017 IMF forecast
Stimulative fiscal policy
Contractionary fiscal policy
Austerity was the general rule from 2011 to 2015, and it is an important reason why the economic recovery from the financial crisis of 2008 has been so sluggish. The U.S. and Europe began the shift away from austerity in 2016. The current fiscal plans for 2017 show either less expansion or continued austerity. The gray bars are likely to shift upwards as politicians favor voter handouts over debt reduction.
Trumping up the outlook2017 had been expected to be a year of moderate U.S. growth with a cautiously tightening Fed against a backdrop of expensive equity market valuation. The advent of President-elect Trump has changed the calculations. We can expect more fiscal stimulus, more inflation pressures and a potentially more hawkish Fed.
Markets have already started the adjustment, pushing up bond yields and the U.S. dollar. The U.S. equity market has hit new highs in late November, as measured by the S&P 500 Index. The risk is that these moves overshoot and there is volatility as investors try to divine the true direction of the new Trumpian world and the Fed’s reaction function.
Our cycle, value and sentiment investment strategy process will help us navigate what could be a roller-coaster year. We intend to buy the dips and sell the rallies until there is evidence that the Trump boom has generated enough Fed tightening to cause an economic downturn. We will watch closely for evidence that markets have moved too far into fear or euphoria and look for downside protection when it is cheap.
We are cautious on long-term interest rate exposure and favor Europe and Japan equities over the U.S. on value and cycle terms. EM as an asset class looks good in value terms, but faces cycle headwinds from the Fed and the U.S. dollar. Buckle up for a potentially exciting year. n
One of the important themes of 2017 is likely to be a shift in fiscal policy across the major developed economies.

Russell Investments // 2017 Global Market Outlook // The new abnormal 6 of 16
United States: a brave new world
Trumponomics7 will likely boost growth at a time when the U.S. economy is already operating at close to full capacity. This should nudge inflation higher and give the Fed more wiggle room to hike the federal funds rate. Cyclically, we see the presidential election outcome as a wash for the equity market but bad for bonds.
Trumponomics and what it means for…1. The U.S. economy:
It’s too early to say precisely what the Trump administration’s policy mix will look like. The president-elect’s budget initiatives, for example, must pass through the Republican-controlled Congress before becoming law. Directionally, that isn’t a big obstacle. Trump won a mandate, and the basic tenets of the Trump and U.S. House of Representatives tax plans are quite similar. But there are legitimate questions about how to pay for these tax cuts, which add risk for markets in terms of both the size and timing of the stimulus package. Directionally, we expect the final plan to be pro-growth and pro-inflation.
Our central scenario is that the net impact of Trumponomics will add about a half percentage point to real GDP growth, with the bulk of this stimulus hitting the U.S. economy between late 2017 and early 2018. With the labor market already at full capacity, the boost from fiscal policy is likely to nudge inflation even further along its gradual path higher, as shown in the chart below.
Our central scenario is that the net impact of Trumponomics will add about a half percentage point to real GDP growth, with the bulk of this stimulus hitting the U.S. economy between late 2017 and early 2018.
2%
Trumponomics is directionally pro-growth, pro-inflationImpact of the November 8, 2016 Trump election victory on our 2017 U.S. macro forecasts
Pre-Trump victory
Real GDP Growth* 2.25%
2.6%
0.0% 0.5% 1.0% 1.5% 2.0% 2.5% 3.0%
Core CPI Inflation**
Post-Trump victory
2.5%
Source: Russell Investments and Thomson Reuters I/B/E/S Datastream, as of Nov. 25, 2016.
*Real gross domestic product (GDP) is an inflation-adjusted measure that reflects the value of all goods and services produced by an economy in a given year, expressed in base-year prices.
**The Consumer Price Index (CPI) is a measure that examines the weighted average of prices of a basket of consumer goods and services, such as transportation, food and medical care. It is calculated by taking price changes for each item in the predetermined basket of goods and averaging them. Core inflation represents the long run trend in the price level.
Forecasting represents predictions of market prices and/or volume patterns utilizing varying analytical data. It is not representative of a projection of the stock market, or of any specific investment.
7 The economic policies of U.S. President-elect Donald Trump, featuring the reduction of taxes and U.S.-centric trade activity.

Russell Investments // 2017 Global Market Outlook // The new abnormal 7 of 16
2. The Federal Reserve:
We expect Fed Chair Janet Yellen and the Federal Open Market Committee (FOMC) to hike interest rates at their final meeting of 2016. It has been a frustratingly slow hiking process through 2016 and, as former Minneapolis Fed President Narayana Kocherlakota put it, there seems to be a certain amount of “gravity” to the zero bound. The Fed has been derailed numerous times from hiking, such as when China's markets tumbled at the start of 2016, a bizarrely weak employment report in May, and Brexit all contributed to a cautious approach. And yet, when we zoom out, the economy has continued its slow road to recovery. The Fed has effectively achieved its full employment mandate, and wage and price pressures are gradually building. Fanning the flames with fiscal stimulus at this stage of the recovery in our view will make the Fed’s job easier.
Our forecasts still suggest the likeliest outcome for 2017 is two additional federal funds rate hikes. But the risks to that view are now much more balanced. And we could see a more aggressive Fed if the Trump administration successfully reflates the economy in the back half of 2017. It’s important to remember that global central bank divergence amplifies the amount of tightening in U.S. markets from each rate hike (i.e., yield differentials drive U.S. dollar strength, which also slows the economy). Financial conditions started to tighten towards the end of 2016 and will continue to be an important watch point in 2017 as the Fed moves forward.
3. Asset prices:
Our outlook for the S&P 500 Index is unchanged. It’s true that a short-term boost from fiscal stimulus should support corporate revenues. But there are a number of competing crosscurrents that dampen the outlook for stocks. Renewed dollar strength could pose up to a 1.5 percentage-point drag on earnings growth. The post-election “reflation trade” also brought a significantly higher discount rate. We maintain an underweight on the U.S. equity market in global portfolios due to their expensive valuations.
Trumponomics poses new cyclical challenges for the U.S. Treasury market. Upside risks to inflation and a more hawkish distribution of Fed outcomes are both headwinds for bonds. But perhaps the most impactful change from a Trump presidency is its inherent uncertainty. Investors in long-term bonds, in our view, need to be compensated for the risk that the path for monetary policy might deviate from current market pricing. We believe a president with no governance experience, sometimes erratic views, and a bold economic agenda warrants a higher risk premium. This is the primary reason why we have upgraded our 10-year U.S. Treasury yield forecast to 2.5% at the end of 2017. The post-election bond market selloff was fast and furious8. After a period of consolidation, we would look to re-establish an underweight position on the cyclical dynamics noted above.
Strategy outlook › Business cycle: Corporate profits have recovered but dollar strength and rising wage
costs imply a lackluster outlook in 2017 and beyond. We expect 2.25% real GDP growth in 2017 with a boost from fiscal policy that is likely to kick in towards the end of the year. Our 12-month-ahead recession probabilities as of November 30, 2016 remain modest at 20% to 25%.
› Valuation: U.S. equities are expensive, and valuations are likely to act as a headwind on future market performance.
› Sentiment: Momentum is flat, and the market has quickly recovered from oversold territory before the election. This leaves our sentiment score at roughly neutral.
› Conclusion: We continue to have an underweight preference for U.S. equities in global portfolios primarily on the back of their expensive valuations. n
8 Source: Bloomberg Barclays U.S. Aggregate Bond Index, as of Nov. 25, 2016.
Corporate profits have recovered but dollar strength and rising wage costs imply a lackluster outlook in 2017 and beyond.

Russell Investments // 2017 Global Market Outlook // The new abnormal 8 of 16
The eurozone: trust in fundamentals
It is hard to stick to an investment process when financial markets seem to ignore everything it is built on. However, it is precisely in times like these that we have to remind ourselves that an investment process aims to not only identify investment opportunities, but also prevent investors from making behavioral mistakes. We believe giving up on the favorable fundamentals in the eurozone would be such a mistake. And we continue to trust they will lift eurozone financial markets.
Waiting for GodotWaiting for outperformance in eurozone financial markets has felt like waiting for Godot9. Over the past year, every time it looked like an upward trend had been established, something caused it to falter. Most notably, concerns around global growth, Brexit and eurozone financials prevented markets from reaching what we called “stage 2 lift-off” in our previous quarterly report.
In the meantime, the fundamentals remained favorable in 2016. The reflationary forces coming from the ECB and credit growth continued to outweigh the deflationary forces from lower global growth and Brexit. As a result, economic growth was robust at ±1.5% and confidence stayed persistently high, as shown in the chart below. Particularly noteworthy is the fact that this was achieved due to strong domestic growth overcoming the headwind from a slowdown in global trade. Looking ahead, we expect 2017 to deliver more of the same with eurozone GDP growth staying close to 1.5%. This outlook is predicated on a continuation of quantitative easing by the ECB and a modest increase in global growth.
Favorable fundamentals based on robust economic growth, stimulatory monetary policy, strong earnings growth and attractive valuations keep us positive on eurozone financial markets.
9 Waiting for Godot is a masterpiece play by Samuel Beckett in which two characters wait endlessly and in vain for the arrival of someone named Godot.
Eurozone GDP growth & economic sentiment
2000
-6
2002 2004 2006 2008 2014 201620122010
-4
-2
0
2
4
6
70
80
90
100
110
120
GDP growth 1.62% yoy Economic sentiment (right side axis)
Source: Thomson Reuters Datastream Q3 2016, as of November 25, 2016.
Econom
ic Sentim
ent Indicator*
% y
ear
over
yea
r (y
oy)
*The European Economic Sentiment Indicator report consists of business and consumer surveys collected by the European Commission.

Russell Investments // 2017 Global Market Outlook // The new abnormal 9 of 16
On the corporate side, the fundamentals also continue to look favorable. Expectations for earnings growth in 2017, as published by the Thomson Reuters Institutional Brokers’ Estimate System (I/B/E/S)10, stand at 13% in November 2016, driven by rising non-financial profit margins and a bit of revenue growth. Although that looks a tad high to us, we think 5% to 10% looks achievable, especially with the euro under renewed downward pressure. Combined with a dividend yield of ±3.5% and relatively attractive valuations, we add it all up to a positive outlook — even more so when we consider the fact that inflationary pressures and their associated risk to profit margins are still very contained in the eurozone.
To sum up, favorable fundamentals based on robust economic growth, stimulatory monetary policy, strong earnings growth and attractive valuations keep us positive on eurozone financial markets.
Political riskAfter the Brexit and U.S. presidential votes in 2016 as well as the Italian referendum on constitutional reform in December, we’re now focused on the political risks that the eurozone faces in 2017. It starts with the Dutch elections in March, French presidential elections in April/May and German elections in September. Of these three events, we consider the French elections to be most important. The Dutch and German parliamentary systems make a far-right victory all but impossible.
Given the record-low popularity of President François Hollande, as recorded by several national French polls in 2016, it looks likely that the French elections will end in a run-off between Front National’s Marine Le Pen and the Republicans’ François Fillon. The published polls as of Nov. 20, 2016, appear very much in favor of Fillon under those circumstances, but given the surprises of 2016 it is good to understand what is at stake. The French president holds a tremendous amount of power, and in the hands of Le Pen, a noted Eurosceptic, it could be an existential threat to the eurozone. Without exaggeration, we can say that such an outcome could make us forget all about Brexit and the U.S. presidential election. However, for now we see it as an unlikely outcome and take comfort from the fact that the eurozone is seemingly better able to withstand populist powers. We think this is the case for two important reasons: it has kept inequality in check and support for the euro is still very strong. So, we are optimistic that we will not witness big political surprises in the eurozone in 2017.
Strategy outlook › Business cycle: A combination of expected GDP growth of 1.5%, loose monetary policy
and corporate earnings growth of 5% to 10% adds up to a positive business cycle score. However, due to the before-mentioned political risks, we keep our score in check until more information becomes available.
› Valuation: eurozone equities are considered slightly cheap in an absolute sense and outright cheap relative to the U.S. In eurozone government bonds we have closed our underweight position in core bonds now that yields have risen slightly above our year-end target of 0.2% for 2016. For 2017 we expect core bonds to remain range-bound at 0% to 0.5% and peripheral bonds at 1% to 2%.
› Sentiment: With no strong price momentum or contrarian signals, our sentiment score for eurozone equities is neutral. Sentiment for core government bonds has also gone to neutral from being previously overbought, while Italian bonds have even become oversold, presenting us with a potential buying opportunity.
› Conclusion: We are sticking to our investment process. Strong fundamentals combined with attractive valuations continue to point to an overweight position to eurozone equities. The political risks need to be monitored, but we are optimistic there will not be any surprises in the eurozone next year along the lines of the Brexit vote outcome or U.S. President-elect Trump’s victory. n
10 I/B/E/S is a system that gathers and compiles the different estimates made by stock analysts on the future earnings for the majority of U.S. publicly traded companies.
Sentiment for core Eurozone government bonds has also gone to neutral from being previously overbought while Italian bonds have even become oversold, presenting us with a potential buying opportunity.

Russell Investments // 2017 Global Market Outlook // The new abnormal 10 of 16
Asia-Pacific: steady growth
The Asia-Pacific region continues to both deliver and promise steady economic growth. For 2016 as a whole we see real GDP growth overall at around 4.75%, down only fractionally on the previous year. We expect a similar steady rate of growth in 2017. Against this constructive backdrop, the long downtrend in inflation and in official interest rates is coming to an end across much of the region, and we believe Asia-Pacific equity markets continue to offer moderately good value.
Returns are keeping a step ahead of the risksAsia-Pacific economies have been beset by a catalogue of anxieties over 2016:
› Australia and New Zealand are in the late throes of dramatic housing booms, associated with an extended episode of record lows in mortgage rates.
› Question marks hang over the substance of relatively new, populist governments in India and Indonesia.
› Structural and debt-related questions linger in China.
› Stubbornly low growth and inflation have dogged Japan.
› Political scandal has rocked South Korea.
› The entire region is contemplating the uncertainties of U.S. President-elect Trump’s administration, potentially including the risks of a trade war.
By and large, however, the steady growth story is triumphing, and the risks remain subdued. Australia and New Zealand will likely deliver solid growth in 2017, with their economies underpinned by the stabilization in commodity prices and with the housing cycles slowing in a controlled fashion. In Pacific-Rim Asia, while U.S. policy remains uncertain, recent trade developments are reasonably constructive. For Japan, recent GDP developments are positive; the weakening in the Japanese yen following the U.S. election provides some headroom; and the Bank of Japan is displaying resolute commitment to stimulus. In addition, Indonesia and India are rising above their “populist” images, and their respective economies are performing quite well.
ChinaChina has kept out of the headlines over the past year, and we see that as good news. Skepticism was rife amongst commentators earlier in 2016, when reported Chinese GDP growth rates of 6.7% had implausibly dislocated from more transparent indicators of activity. Electricity production growth slowed perilously close to zero, for example, and freight volumes were in outright decline.
As we move towards 2017, these doubts are abating. The bounce in commodity prices through 2016 has stabilized China’s heavy manufacturing sectors and, while this favorable reversal is slowing the structural adjustment process, it is also providing some stability to the transition. As shown in the chart on the next page, China’s leading indicators are now turning convincingly upwards for the first time in nearly four years.
China’s leading indicators are turning convincingly upwards at year-end 2016 for the first time in nearly four years.

Russell Investments // 2017 Global Market Outlook // The new abnormal 11 of 16
Investment strategyFor regional equities, we assess cycle, value and sentiment considerations as follows:
› Business cycle: The cyclical backdrop for the Asia-Pacific region remains neutral as we look ahead to 2017. However, the composition is changing. Raw economic growth is in decent shape, and the earnings outlook is acceptable. Offsetting these positives, the era of falling interest rates — across most of the region — appears to be ending, and potentially reversing.
› Valuation: Many Asian-region markets are still trading at 2015 price levels, and now represent fair to reasonable value. As of November 18, 2016, and using the MSCI All Country Asia Pacific Index, equities were trading on a forward (2017) price-to-earnings (PE) ratio of 13.4x; a price-to-book ratio of 1.3x; and a dividend yield of 2.8%.
› Sentiment: Modest returns and lackluster momentum leave us at “neutral” in our assessment of regional sentiment.
› Conclusion: Our investment thesis of “low returns and high volatility” for Asia-Pacific equities for 2016 and into 2017 remains intact. At current prices, as of November 20, 2016, we take a slightly positive stance, largely motivated by the valuation scores in our research process. n
China real GDP growth
GDP: 6.7% yoy (Q3 2016) Leading Indicator (3-month lead)*
%
Source: Thomas Reuters Datastream, Q3 2016.
*Produced by the Organization for Economic Co-operation and Development (OECD), the composite leading indicator (CLI) is designed to provide early signals of turning points in business cycles showing fluctuation of the economic activity around its long-term potential level. CLIs show short-term economic movements in qualitative rather than quantitative terms.
5
10
15
20
25
2007 2008 2009 2010 2011 2012 2013 2014 2015 2016

Russell Investments // 2017 Global Market Outlook // The new abnormal 12 of 16
Currencies: will Trumponomics echo Reaganomics?
The U.S. dollar has surged since the unexpected victory of Donald Trump in November’s U.S. presidential elections. If the greenback’s ascent continues apace, it could rival the overshoot of the dollar during Ronald Reagan’s first term as president in the 1980s. However, we don’t think such an overshoot is a likely scenario.
Contrary to the expectations of most pollsters, Donald Trump won the race for the White House. Currency markets reacted fiercely, with the U.S. dollar surging against most other currencies. As measured by the Bloomberg Dollar Spot Index, the trade-weighted U.S. dollar jumped by 4.1% in the immediate aftermath of the election through November 21, 2016. The president-elect’s fiscal plans for the U.S. economy are more expansionary than Hillary Clinton’s. According to non-partisan projections, Mr. Trump’s fiscal plans would imply a much steeper rise in the budget deficit. If the U.S. economy operates close to full capacity, as it arguably does, economic theory tells us that a higher deficit leads to an appreciation of the currency via higher interest rates. Indeed, long-term U.S. bond yields have started rising sharply11. Some commentators contend that currency markets could see a repeat of the early 1980s when the real trade-weighted dollar surged into highly overvalued territory, as shown in the chart below. U.S. President Ronald Reagan at the time had implemented substantial tax cuts while the Fed under then-chair Paul Volcker kept interest rates high to extinguish the ghosts of inflation.
U.S. President-elect Trump’s fiscal plans are positive for the U.S. dollar, but a U.S. dollar overshoot similar to the early 1980s is unlikely.
80
90
100
110
120
130
140
150
1976
1986
1978
1984
19801982
1988
1998
1990
1996
19921994
2000
2004
2014
2006
2012
20082010
2002
Average, for the 40-year period from Nov. 15, 1976 through Nov. 15, 2016.
Inde
x le
vel
Narrow Effective Exchange Rate for United States*
*The real effective exchange rate is the weighted average of a country’s currency relative to an index or basket of other major currencies, adjusted for the effects of inflation. The weights are determined by comparing the relative trade balance of a country's currency against each country within the index. This exchange rate is used to determine an individual country's currency value relative to the other major currencies in the index, such as the U.S. dollar, Japanese yen and the euro.
Repeating Reaganomics overshoot?
11 Source: Bloomberg Barclays U.S. Aggregate Bond Index, as of Nov. 25, 2016.

Russell Investments // 2017 Global Market Outlook // The new abnormal 13 of 16
We think a repeat of the 1980s overshoot of the U.S. dollar is unlikely, although the greenback could strengthen a little further from current levels. The situation today is different from the 1980s insofar as the Fed under Janet Yellen is not fighting high inflation and is unlikely to be as hawkish as the Fed was in Volcker’s era. In addition, Mr. Trump’s protectionist and isolationist stance may weaken the dollar’s appeal as a reserve and safe-haven currency. Weighing up these countervailing forces, we think a Trump presidency is indeed a net positive for the U.S. dollar due to the new president-elect's fiscal plans. However, already rich valuations and limited scope for policy divergence will likely restrain the dollar’s upside potential against other developed market currencies to 5% to 10%.
Other major currencies › Euro (EUR) Political risks aplenty — such as upcoming elections in France and Germany
— as well as loose monetary policy could keep the euro under pressure in 2017. However, the single European currency is supported by an attractive valuation, which limits how much further it could fall. We think 0.95 to 1.00 on the EUR/USD exchange rate is a constructive support zone.
› Japanese Yen (JPY) The yen is in a similar situation to the EUR in terms of monetary policy because the Bank of Japan’s mix of bond purchases and negative interest rates exert a gravitational pull on the Japanese currency. While the yen may weaken further, it would become attractive at an exchange rate of 120 USD/JPY.
› UK Pound Sterling (GBP) Although 2016 has been a horrendous year for the British pound, we believe it is now sufficiently cheap, rendering a fairly balanced ratio of reward-to-risk. We also think that there may be some softening of the UK government’s stance towards a “hard Brexit,” which should also be supportive of GBP.
Emerging market currenciesOn the surface, the outcome of the U.S. presidential election is also bad news for EM currencies. President-elect Trump has supported greater restrictions on international trade, which, if implemented, are likely to hurt EM economies and could weigh on EM currencies. The Mexican peso fell sharply immediately following the election, for example, because Mexico is seen as particularly vulnerable to a possible repeal of the North American Free Trade Agreement (NAFTA).
While the threat of protectionism is a near-term headwind, the economic fundamentals of EM economies are improving and we think that many EM currencies are attractively valued. The U.S. president-elect’s economic policies are not universally detrimental to the economic prospects of EM countries. His plans for increased infrastructure spending may even benefit economies that mainly export raw materials, such as Brazil or Russia.
All in all, we think that the return potential for EM currencies, which has to take into account their high interest rates relative to developed-market currencies, is still good in a world where there are very few financial assets that are outright cheap. n
We think a repeat of the 1980s overshoot of the U.S. dollar is unlikely, although the greenback could strengthen a little further from current levels.

Russell Investments // 2017 Global Market Outlook // The new abnormal 14 of 16
Quantitative modeling insights: holding pattern
Neutral equity outlookOur model for U.S. equities versus U.S. fixed income, which had slightly favored equities through much of 2016, shows a neutral preference as of November 25, 2016.
› Business cycle: Our model that estimates the likelihood of being in a bull or bear market has moderated since last quarter to be neutral. However, the U.S. Business Cycle Index (BCI) model continues to show moderate recession risk and a path of modest economic growth.
› Valuation: Our Fed model stayed positive even as the earnings yield remained steady and bond yields greatly increased.
› Sentiment: Our 12-month declining weighted average signal of excess equity momentum stayed slightly positive and even increased after the U.S. presidential election results.
The following graph shows the distribution of forward returns, conditional on the U.S. equities/U.S. fixed income model’s signal. Given our signal is neutral, we would expect a return distribution close to the dark gray line. This means that our models recommend a neutral stance for the time being.
Distribution of returns, conditional on EAA U.S. equity vs. U.S. fixed income aggregate signal
Pro
babi
lity
0
0.05
0.10
0.15
Monthly Returns
-15% -10% -5% 0% 5% 10%
Histogram of all returns from 2005 to present
Forward return distribution given bullish signal (signal more than 0.25)
Forward return distribution given neutral signal (signal between -0.25 to +0.25)
Forward return distribution given bearish signal (signal less than 0.25)
Source: Russell Investments as of Nov 25, 2016.
Forecasting represents predictions of market prices and/or volume patterns utilizing varying analytical data. It is not representative of a projection of the stock market, or of any specific investment.
12
Recession probabilities: wait-and-see modeThe BCI model uses a range of economic and financial variables to estimate the strength of the U.S. economy and forecast the probability of a recession. The BCI model shows that the chances for a U.S. recession have risen in the last year, but are still moderate by historical standards. Recession levels above 20% signal caution and above 30% signal warning.
12 Enhanced Asset Allocation (EAA) is a capability that builds on Strategic Asset Allocation (SAA) by incorporating views from Russell Investments’ proprietary asset class valuation models. EAA is based on the concept that sizable market movements away from long-term average valuations create opportunities for incremental returns. The EAA Equity-Fixed Aggregate Signal is based on the S&P 500 and Barclays U.S. Aggregate Bond indexes.

Russell Investments // 2017 Global Market Outlook // The new abnormal 15 of 16
Higher payrolls, higher consumption, a steeper yield curve, a narrower TED spread13, and narrower credit spreads all contribute to a stronger BCI and lower recession probability. Payrolls and consumption are still robust, but have moderated since 2015. The yield curve has flattened, which could foreshadow slower economic growth. The TED spread has widened, partially reflecting increased financial stress (relevant to our outlook forecast when modeling recession risk) and partially reflecting a change in money market mutual fund regulation (less relevant to our forecast). Removing the regulation component raises the BCI marginally and lowers the recession probability by a couple of percentage points. Credit spreads, which have stabilized since early 2016, are no longer a headwind.
In aggregate, the indicators reflect an aging business cycle that warrants monitoring, but a U.S. recession in 2017 is still relatively unlikely. Going forward, a key watch point in our view is the impact of a Trump administration on the U.S. economy — namely the balance between growth-inhibiting protectionism policies and pro-growth tax cuts and fiscal stimulus. Our BCI scenario simulations show that policy missteps could send recession probabilities into warning territory, while a gradual GDP boost could modestly push probabilities down. n
Payrolls Consumption TED spread Slope of yield curve Credit spreadsJan 2015Feb 2015Mar 2015Apr 2015
May 2015Jun 2015Jul 2015
Aug 2015Sep 2015Oct 2015Nov 2015Dec 2015Jan 2016Feb 2016Mar 2016Apr 2016
May 2016Jun 2016Jul 2016
Aug 2016D
Heat map colors of green/yellow/red denote the economic variable’s positive (green)/neutral (yellow)/negative (red) impact on business cycle strength relative to recent history. The chart above shows shifts from more green boxes to more red boxes from early 2015 to October 2016.
Our BCI-based heat map shows aging U.S. business cycle
Source: Russell Investments as of November 25, 2016.
Forecasting represents predictions of market prices and/or volume patterns utilizing varying analytical data. It is not representative of a projection of the stock market, or of any specific investment.
Sep 2016Oct 2016 13 The TED spread is the
difference between the interest rates on interbank loans and on short-term U.S. government debt ("T-bills"). TED is an acronym formed from T-Bill and ED, the ticker symbol for the Eurodollar futures contract.
2006
Recession
BCI model: Historical forecasted-recession probabilities
Forecasted 1 month ahead of recession probability
Source: Russell Investments as of Nov. 25, 2016.
Rec
essi
on p
roba
bilit
y
Forecasted 3 month ahead of recession probability
Forecasted 12 month ahead of recession probability
0%
20%
40%
60%
80%
100%
2007 2008 2009 2010 2011 2012 2013 2014 2015 2016
Forecasting represents predictions of market prices and/or volume patterns utilizing varying analytical data. It is not representative of projections of the stock market, or of any specific investment.

Russell Investments // 2017 Global Market Outlook // The new abnormal 16 of 16
IMPORTANT INFORMATION
The views in this 2017 Global Market Outlook are subject to change at any time based upon market or other conditions and are current as of the date at the top of the page. While all material is deemed to be reliable, accuracy and completeness cannot be guaranteed.
Please remember that all investments carry some level of risk, including the potential loss of principal invested. They do not typically grow at an even rate of return and may experience negative growth. As with any type of portfolio structuring, attempting to reduce risk and increase return could, at certain times, unintentionally reduce returns.
Keep in mind that, like all investing, multi-asset investing does not assure a profit or protect against loss.
No model or group of models can offer a precise estimate of future returns available from capital markets. We remain cautious that rational analytical techniques cannot predict extremes in financial behavior, such as periods of financial euphoria or investor panic. Our models rest on the assumptions of normal and rational financial behavior. Forecasting models are inherently uncertain, subject to change at any time based on a variety of factors and can be inaccurate. Russell believes that the utility of this information is highest in evaluating the relative relationships of various components of a globally diversified portfolio. As such, the models may offer insights into the prudence of over or under weighting those components from time to time or under periods of extreme dislocation. The models are explicitly not intended as market timing signals.
The Business Cycle Index (BCI) forecasts the strength of economic expansion or recession in the coming months, along with forecasts for other prominent economic measures. Inputs to the model include non-farm payroll, core inflation (without food and energy), the slope of the yield curve, and the yield spreads between Aaa and Baa corporate bonds and between commercial paper and Treasury bills. A different choice of financial and macroeconomic data would affect the resulting business cycle index and forecasts.
Investment in Global, International or Emerging markets may be significantly affected by political or economic conditions and regulatory requirements in a particular country. Investments in non-U.S. markets can involve risks of currency fluctuation, political and economic instability, different accounting standards and foreign taxation. Such securities may be less liquid and more volatile. Investments in emerging or developing markets involve exposure to economic structures that are generally less diverse and mature, and political systems with less stability than in more developed countries.
Currency investing involves risks including fluctuations in currency values, whether the home currency or the foreign currency. They can either enhance or reduce the returns associated with foreign investments.
Investments in non-U.S. markets can involve risks of currency fluctuation, political and economic instability, different accounting standards and foreign taxation.
Bond investors should carefully consider risks such as interest rate, credit, default and duration risks. Greater risk, such as increased volatility, limited liquidity, prepayment, non-payment and increased default risk, is inherent in portfolios that invest in high yield (“junk”) bonds or mortgage-backed securities, especially mortgage-backed securities with exposure to sub-prime mortgages. Generally, when interest rates rise, prices of fixed income securities fall. Interest rates in the United States are at, or near, historic lows, which may increase a Fund’s exposure to risks associated with rising rates. Investment in non-U.S. and emerging market securities is subject to the risk of currency fluctuations and to economic and political risks associated with such foreign countries.
The S&P 500, or the Standard & Poor’s 500, is a stock market index based on the market capitalizations of 500 large companies having common stock listed on the NYSE or NASDAQ.
Source for MSCI data: MSCI. MSCI makes no express or implied warranties or representations and shall have no liability whatsoever with respect to any MSCI data contained herein. The MSCI data may not be further redistributed or used as a basis for other indices or any securities or financial products. This report is not approved, reviewed or produced by MSCI.
The MSCI All Country World Index is a market capitalization weighted index designed to provide a broad measure of equity-market performance throughout the world. The MSCI ACWI is maintained by Morgan Stanley Capital International, and is comprised of stocks from both developed and emerging markets.
The MSCI AC Asia Pacific Index captures large and mid cap representation across Developed Markets countries and 8 Emerging Markets countries in the Asia-Pacific region. The index covers approximately 85% of the free float-adjusted market capitalization in each country.
The trademarks, service marks and copyrights related to the Russell Indexes and other materials as noted are the property of their respective owners. The Russell logo is a trademark and service mark of Russell Investments.
Copyright © Russell Investments 2016. All rights reserved. This material is proprietary and may not be reproduced, transferred, or distributed in any form without prior written permission from Russell Investments. It is delivered on an "as is" basis without warranty.
Russell Investments’ ownership is composed of a majority stake held by funds managed by TA Associates with minority stakes held by funds managed by Reverence Capital Partners and Russell Investments’ management.
Frank Russell Company is the owner of the Russell trademarks contained in this material and all trademark rights related to the Russell trademarks, which the members of the Russell Investments group of companies are permitted to use under license from Frank Russell Company. The members of the Russell Investments group of companies are not affiliated in any manner with Frank Russell Company or any entity operating under the “FTSE RUSSELL” brand.
2017 Global Market Outlook
UNI-10961