Embed Size (px)
Citation preview
United StatesDepartmentof Agriculture
www.ers.usda.gov
Electronic Outlook Report from the Economic Research Service
LDP-M-89-01
December 2001
The New Agricultural TradeNegotiations: Background andIssues for the U.S. Beef Sector
Abstract
New negotiations on trade in agriculture were recently initiated by the World TradeOrganization (WTO). These negotiations are focusing on extending the gains to worldtrade achieved in the 1994 Uruguay Round Agreement on Agriculture (URAA). Gains toworld trade have occurred under the URAA as a result of limits placed on the use of tar-iffs and non-tariff barriers to trade, export subsidies, and the type and level of spendingfor domestic support programs by WTO member countries. For the beef sector, theURAA, continuing a process of increasing market access begun in the 1970s, has furtherincreased U.S. and world beef trade. While export subsidies and non-tariff trade barriersmay continue to limit the market for U.S. beef exports, additional increases in marketaccess in these negotiations may increase U.S. beef exports. The extent will largelydepend upon the degree of reductions in tariffs.
Keywords: Beef, trade, policy, WTO, market access, tariffs, tariff-rate quota, exportsubsidies, domestic support.
Acknowledgments
The author thanks Carol Goodloe (Office of the Chief Economist); Shayle Shagam andJoel Greene (World Agricultural Outlook Board); Rosanne Freese and Steve Neff(Foreign Agricultural Service); and Ron Gustafson, Linwood Hoffman, Mary AnneNormile, and Leland Southard (Economic Research Service) for their insightful reviews.
Dale Leuck
New multilateral agricultural trade negotiations havebegun under the auspices of the World TradeOrganization (WTO). Over the next few years, repre-sentatives from the 144 WTO-member countries (as ofJanuary 1, 2002) are expected to continue the processof reforming the rules of agricultural trade begununder the Uruguay Round that concluded in 1994. TheUruguay Round built on earlier bilateral and multilat-eral agreements in increasing access to world beefmarkets. Nevertheless, access to some potentially largemarkets is still limited in important ways. The out-come of these negotiations could affect exports of U.S.beef as well as U.S. beef imports because the UnitedStates is a major participant in both markets.
High tariffs remain the major limitation for furtheraccess to many markets, in spite of the reduction inmaximum allowable (i.e., bound) tariff rates in theUruguay Round Agreement on Agriculture (URAA).The United States will be seeking greater access for itsbeef exports, and other countries are expected to seekgreater access to the U.S. market, which is protectedfrom the beef exports of non-NAFTA members by tar-iff rate quotas (TRQs). Other important issues affect-ing world beef trade include export subsidies and sani-tary regulations. This article discusses how additionalpolicy liberalization might affect world and U.S. beeftrade by describing how the success of policy reformsmay be conditioned by the structure of world beefmarkets.
2 Economic Research Service, USDA
Introduction
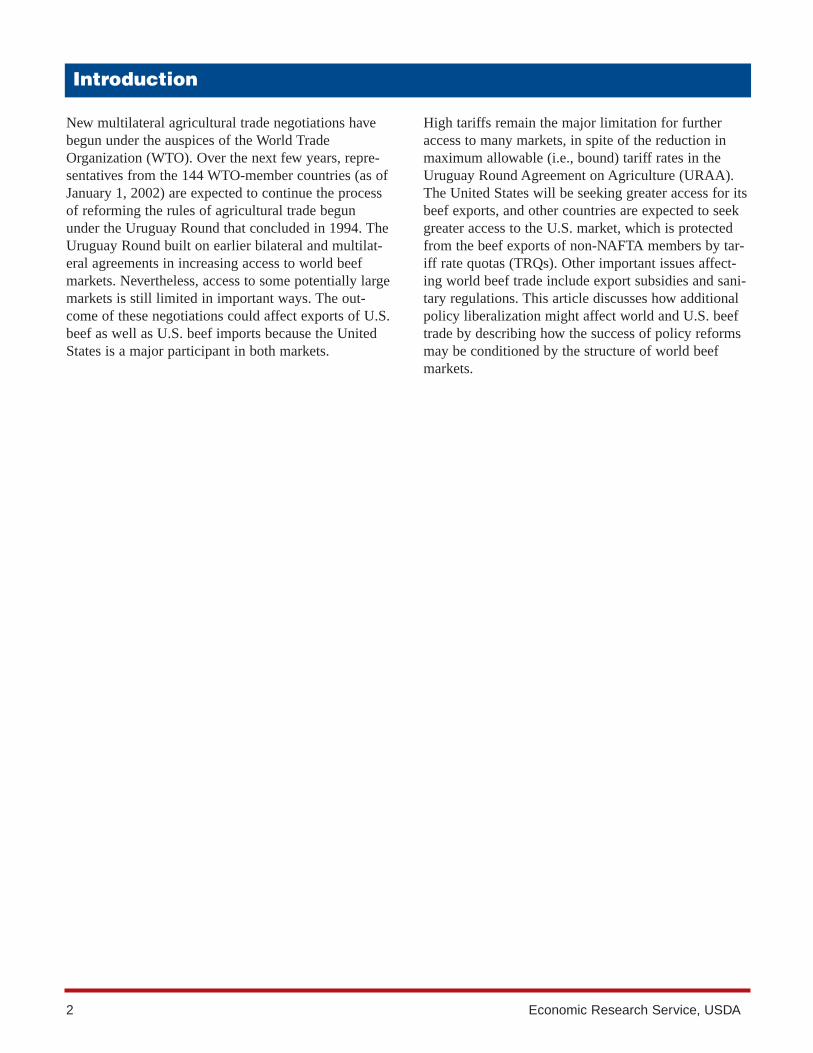
World beef trade has been increasing since the early1960s (fig. 1), as income growth increased demand formeat products, including beef.1 While declines in beeftrade were associated with economic slowdowns in themid-1960s and mid-1970s, growth in beef trade stead-ied at about 7.5 billion total pounds by the late 1970s.World beef trade doubled between the early 1970s andthe mid-1990s, after several high-income markets wereopened by a series of trade agreements: the TokyoRound of the General Agreement on Tariffs and Trade(GATT) in 1978; bilateral agreements between Asianmarkets and major producers in 1984; the Beef-CitrusAgreement between the United States and Japan in1988; the North America Free Trade Agreement(NAFTA) in 1994; and the Uruguay Round of theGATT in 1994. The rapid growth in beef trade in theyears after these agreements suggests that additionalaccess to markets could further increase trade.
World Beef Markets are ConcentratedAmong a Select Group of Countries
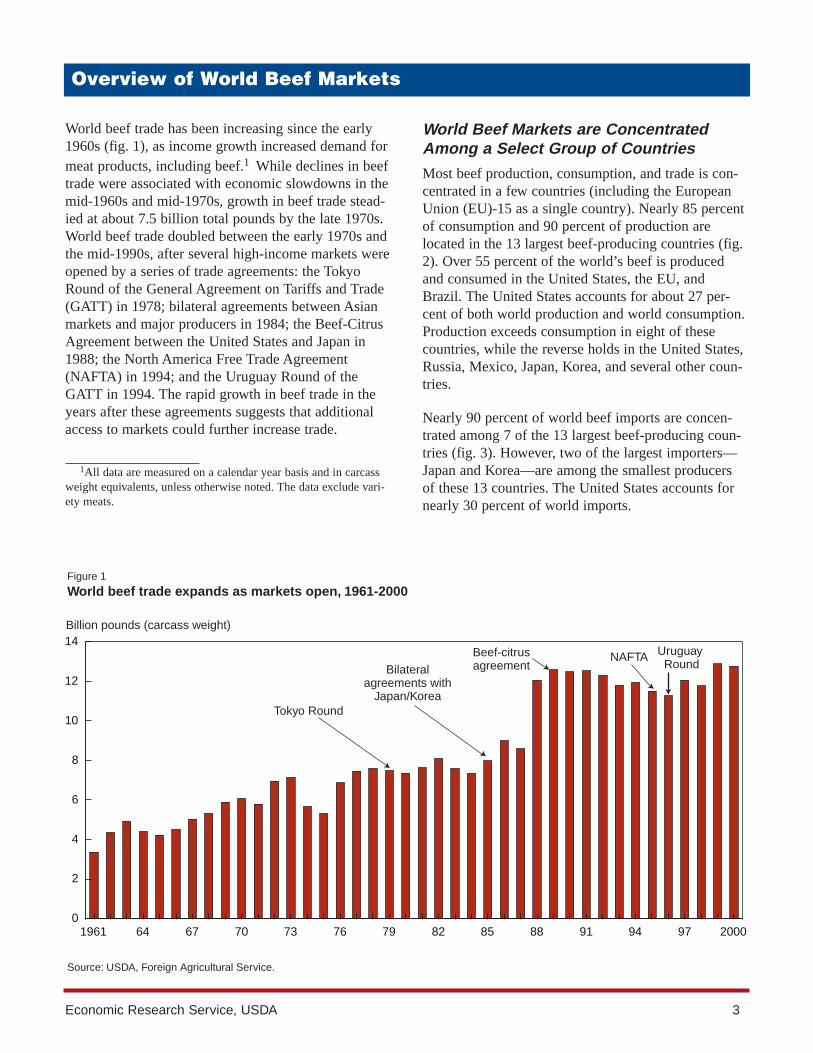
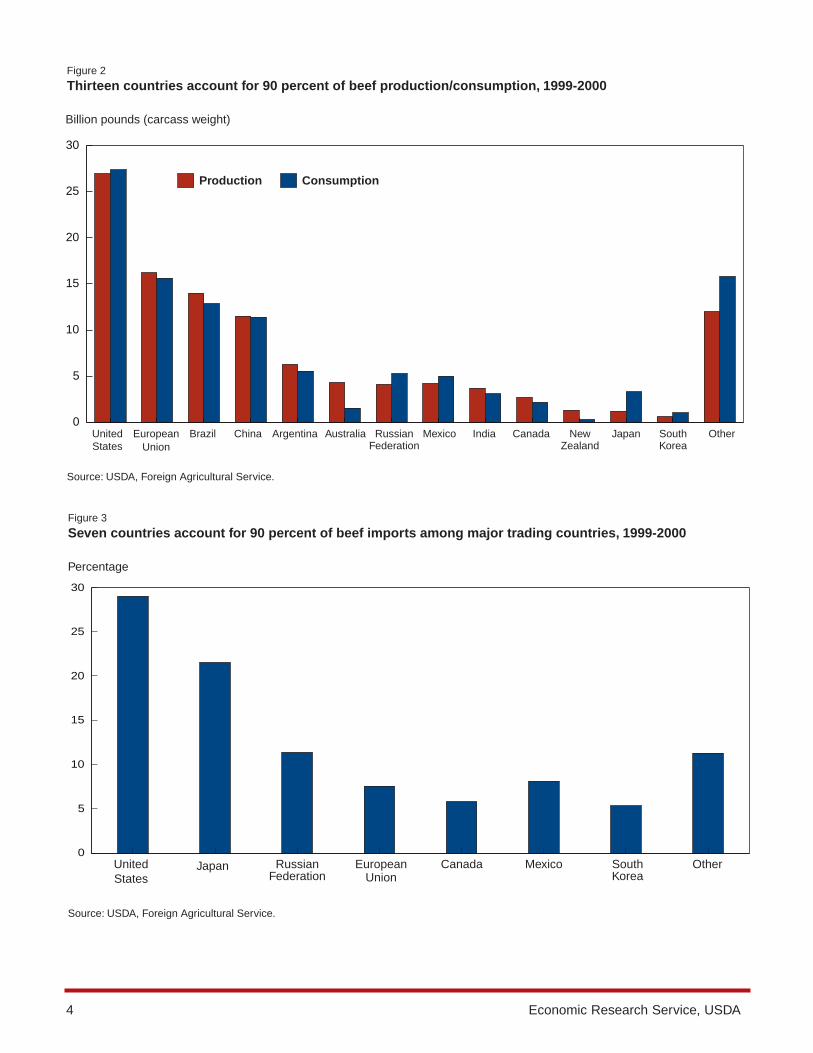
Most beef production, consumption, and trade is con-centrated in a few countries (including the EuropeanUnion (EU)-15 as a single country). Nearly 85 percentof consumption and 90 percent of production arelocated in the 13 largest beef-producing countries (fig.2). Over 55 percent of the world’s beef is producedand consumed in the United States, the EU, andBrazil. The United States accounts for about 27 per-cent of both world production and world consumption.Production exceeds consumption in eight of thesecountries, while the reverse holds in the United States,Russia, Mexico, Japan, Korea, and several other coun-tries.
Nearly 90 percent of world beef imports are concen-trated among 7 of the 13 largest beef-producing coun-tries (fig. 3). However, two of the largest importers—Japan and Korea—are among the smallest producersof these 13 countries. The United States accounts fornearly 30 percent of world imports.
Economic Research Service, USDA 3
Overview of World Beef Markets
1All data are measured on a calendar year basis and in carcassweight equivalents, unless otherwise noted. The data exclude vari-ety meats.
1961 64 67 70 73 76 79 82 85 88 91 94 97 20000
2
4
6
8
10
12
14
Figure 1
World beef trade expands as markets open, 1961-2000
Billion pounds (carcass weight)
Source: USDA, Foreign Agricultural Service.
Bilateralagreements with
Japan/KoreaTokyo Round
NAFTA Uruguay Round
Beef-citrusagreement
4 Economic Research Service, USDA
Figure 2
Thirteen countries account for 90 percent of beef production/consumption, 1999-2000
Billion pounds (carcass weight)
Source: USDA, Foreign Agricultural Service.
0
5
10
15
20
25
30
Production Consumption
UnitedStates
EuropeanUnion
Brazil China Argentina Australia RussianFederation
Mexico India Canada NewZealand
Japan SouthKorea
Other
Figure 3
Seven countries account for 90 percent of beef imports among major trading countries, 1999-2000
Percentage
Source: USDA, Foreign Agricultural Service.
UnitedStates
EuropeanUnion
RussianFederation
MexicoCanadaJapan SouthKorea
Other0
5
10
15
20
25
30
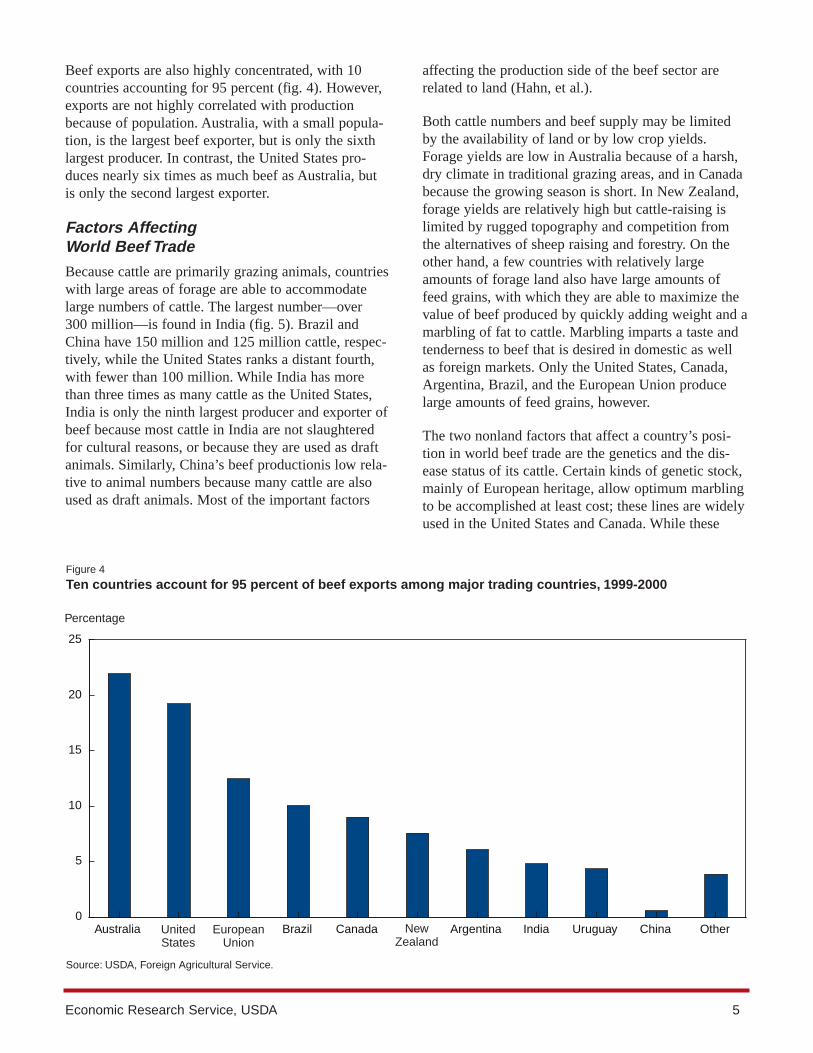
Beef exports are also highly concentrated, with 10countries accounting for 95 percent (fig. 4). However,exports are not highly correlated with productionbecause of population. Australia, with a small popula-tion, is the largest beef exporter, but is only the sixthlargest producer. In contrast, the United States pro-duces nearly six times as much beef as Australia, butis only the second largest exporter.
Factors Affecting World Beef Trade
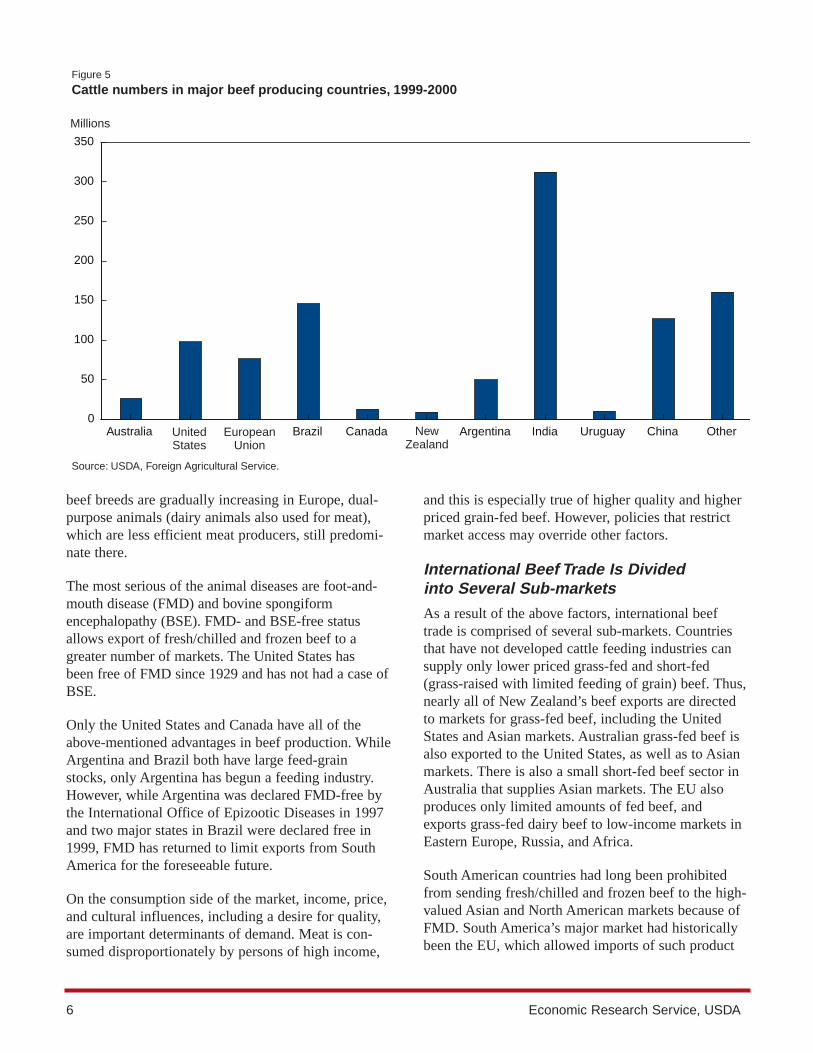
Because cattle are primarily grazing animals, countrieswith large areas of forage are able to accommodatelarge numbers of cattle. The largest number—over 300 million—is found in India (fig. 5). Brazil andChina have 150 million and 125 million cattle, respec-tively, while the United States ranks a distant fourth,with fewer than 100 million. While India has morethan three times as many cattle as the United States,India is only the ninth largest producer and exporter ofbeef because most cattle in India are not slaughteredfor cultural reasons, or because they are used as draftanimals. Similarly, China’s beef productionis low rela-tive to animal numbers because many cattle are alsoused as draft animals. Most of the important factors
affecting the production side of the beef sector arerelated to land (Hahn, et al.).
Both cattle numbers and beef supply may be limitedby the availability of land or by low crop yields.Forage yields are low in Australia because of a harsh,dry climate in traditional grazing areas, and in Canadabecause the growing season is short. In New Zealand,forage yields are relatively high but cattle-raising islimited by rugged topography and competition fromthe alternatives of sheep raising and forestry. On theother hand, a few countries with relatively largeamounts of forage land also have large amounts offeed grains, with which they are able to maximize thevalue of beef produced by quickly adding weight and amarbling of fat to cattle. Marbling imparts a taste andtenderness to beef that is desired in domestic as wellas foreign markets. Only the United States, Canada,Argentina, Brazil, and the European Union producelarge amounts of feed grains, however.
The two nonland factors that affect a country’s posi-tion in world beef trade are the genetics and the dis-ease status of its cattle. Certain kinds of genetic stock,mainly of European heritage, allow optimum marblingto be accomplished at least cost; these lines are widelyused in the United States and Canada. While these
Economic Research Service, USDA 5
Figure 4
Ten countries account for 95 percent of beef exports among major trading countries, 1999-2000
Percentage
Source: USDA, Foreign Agricultural Service.
Australia Brazil Canada Argentina India Uruguay China Other0
5
10
15
20
25
UnitedStates
EuropeanUnion
NewZealand
beef breeds are gradually increasing in Europe, dual-purpose animals (dairy animals also used for meat),which are less efficient meat producers, still predomi-nate there.
The most serious of the animal diseases are foot-and-mouth disease (FMD) and bovine spongiformencephalopathy (BSE). FMD- and BSE-free statusallows export of fresh/chilled and frozen beef to agreater number of markets. The United States has been free of FMD since 1929 and has not had a case ofBSE.
Only the United States and Canada have all of theabove-mentioned advantages in beef production. WhileArgentina and Brazil both have large feed-grainstocks, only Argentina has begun a feeding industry.However, while Argentina was declared FMD-free bythe International Office of Epizootic Diseases in 1997and two major states in Brazil were declared free in1999, FMD has returned to limit exports from SouthAmerica for the foreseeable future.
On the consumption side of the market, income, price,and cultural influences, including a desire for quality,are important determinants of demand. Meat is con-sumed disproportionately by persons of high income,
and this is especially true of higher quality and higherpriced grain-fed beef. However, policies that restrictmarket access may override other factors.
International Beef Trade Is Divided into Several Sub-markets
As a result of the above factors, international beeftrade is comprised of several sub-markets. Countriesthat have not developed cattle feeding industries cansupply only lower priced grass-fed and short-fed(grass-raised with limited feeding of grain) beef. Thus,nearly all of New Zealand’s beef exports are directedto markets for grass-fed beef, including the UnitedStates and Asian markets. Australian grass-fed beef isalso exported to the United States, as well as to Asianmarkets. There is also a small short-fed beef sector inAustralia that supplies Asian markets. The EU alsoproduces only limited amounts of fed beef, andexports grass-fed dairy beef to low-income markets inEastern Europe, Russia, and Africa.
South American countries had long been prohibitedfrom sending fresh/chilled and frozen beef to the high-valued Asian and North American markets because ofFMD. South America’s major market had historicallybeen the EU, which allowed imports of such product
6 Economic Research Service, USDA
Figure 5
Cattle numbers in major beef producing countries, 1999-2000
Millions
Source: USDA, Foreign Agricultural Service.
Australia Brazil Canada Argentina India Uruguay China Other0
50
100
150
200
250
300
350
UnitedStates
EuropeanUnion
NewZealand
from FMD countries subject to specific standards.2
Uruguay and Argentina were declared FMD-free in1996 and 1997, respectively, and efforts were begun toserve the high-value markets, especially NorthAmerica where brand recognition is the most success-ful. However, the reemergence of FMD in early 2001resulted in most countries, including the EU, banningimports of fresh/chilled and frozen product from SouthAmerica. South America remains the largest supplierof prepared and preserved product to North America.
Increased market access has allowed high-quality fed-beef from the United States to become popular inmany high-income markets, although demand may belimited by remaining trade barriers and culinary tradi-tions. However, the most significant limitation for U.S.beef may be the policies of the EU. The EU allowsonly a limited amount of U.S. and Canadian beef ontoits highly protected market at reduced levies, and theremust be certification that hormones have not beenadministered to cattle in the process of producing thebeef. This requirement limits imports from NorthAmerica, in favor of South American beef, which isproduced without added hormones.
Economic Research Service, USDA 7
2The EU standards are that fresh/chilled and frozen producthave a PH no higher than 5.8, be without bone, and meet otherrequirements that eliminate possibility of FMD transmission.
A series of multilateral and bilateral market accessagreements for agricultural products, which began in1978 with the Tokyo Round and ended in 1995 withimplementation of the URAA, has allowed internation-al comparative advantage to influence U.S. beef trade.The United States has a comparative advantage in pro-ducing and exporting higher valued grain-fed beef,while importing lower valued grass-fed beef for grind-ing and as prepared and preserved products. While allof the agreements opened up growing foreign marketsto the United States, the URAA and NAFTA alsoallowed increased access of beef to the U.S. market.
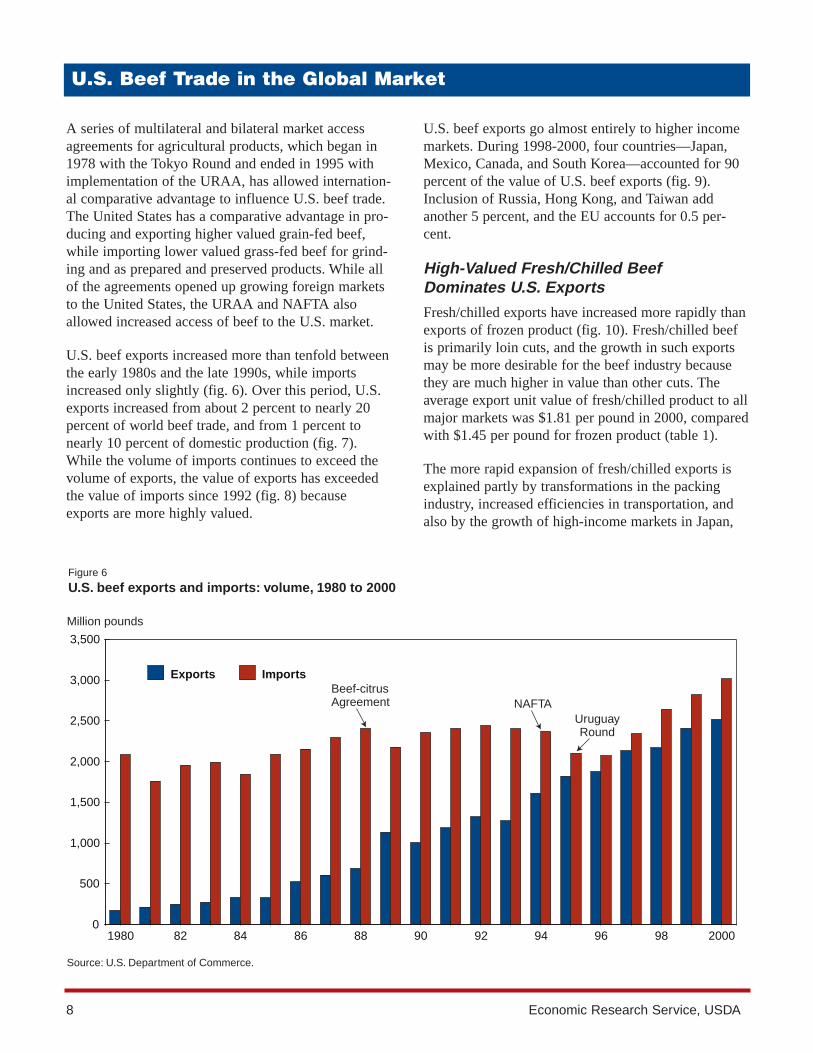
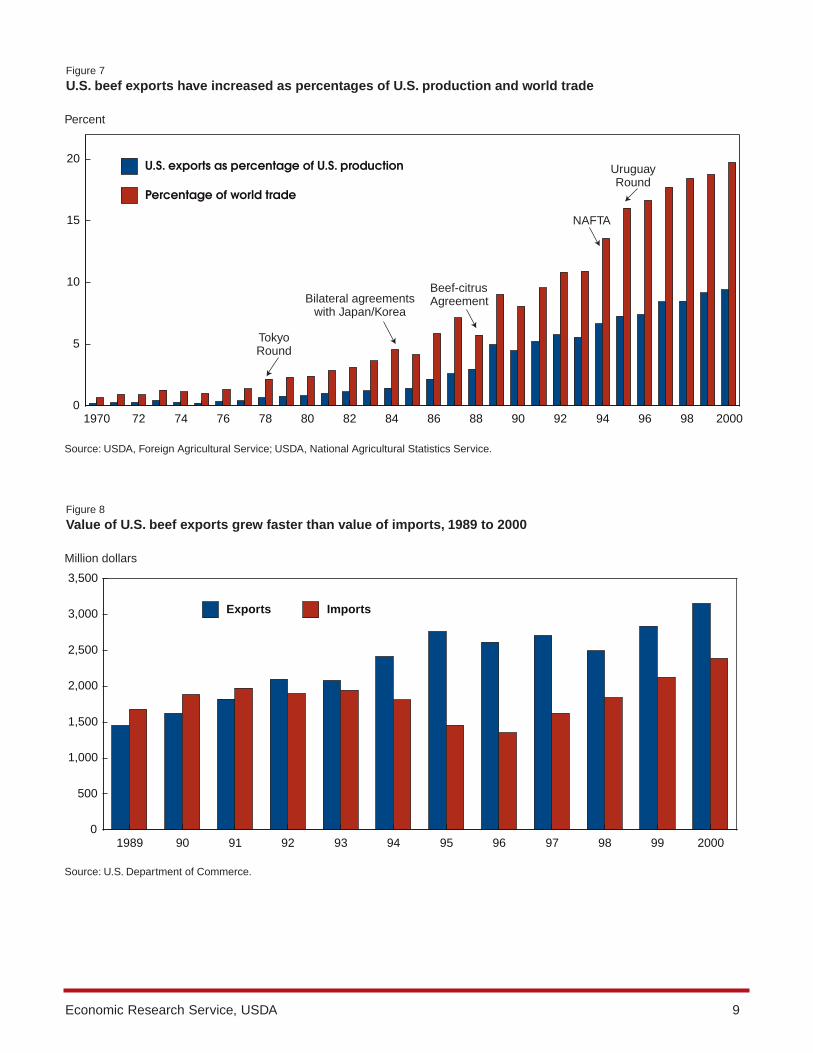
U.S. beef exports increased more than tenfold betweenthe early 1980s and the late 1990s, while importsincreased only slightly (fig. 6). Over this period, U.S.exports increased from about 2 percent to nearly 20percent of world beef trade, and from 1 percent tonearly 10 percent of domestic production (fig. 7).While the volume of imports continues to exceed thevolume of exports, the value of exports has exceededthe value of imports since 1992 (fig. 8) becauseexports are more highly valued.
U.S. beef exports go almost entirely to higher incomemarkets. During 1998-2000, four countries—Japan,Mexico, Canada, and South Korea—accounted for 90percent of the value of U.S. beef exports (fig. 9).Inclusion of Russia, Hong Kong, and Taiwan addanother 5 percent, and the EU accounts for 0.5 per-cent.
High-Valued Fresh/Chilled Beef Dominates U.S. Exports
Fresh/chilled exports have increased more rapidly thanexports of frozen product (fig. 10). Fresh/chilled beefis primarily loin cuts, and the growth in such exportsmay be more desirable for the beef industry becausethey are much higher in value than other cuts. Theaverage export unit value of fresh/chilled product to allmajor markets was $1.81 per pound in 2000, comparedwith $1.45 per pound for frozen product (table 1).
The more rapid expansion of fresh/chilled exports isexplained partly by transformations in the packingindustry, increased efficiencies in transportation, andalso by the growth of high-income markets in Japan,
8 Economic Research Service, USDA
U.S. Beef Trade in the Global Market
Figure 6
U.S. beef exports and imports: volume, 1980 to 2000
Million pounds
Source: U.S. Department of Commerce.
1980 82 84 86 88 90 92 94 96 98 20000
500
1,000
1,500
2,000
2,500
3,000
3,500
Exports ImportsBeef-citrusAgreement NAFTA
UruguayRound
Economic Research Service, USDA 9
Figure 7
U.S. beef exports have increased as percentages of U.S. production and world trade
Percent
Source: USDA, Foreign Agricultural Service; USDA, National Agricultural Statistics Service.
Beef-citrusAgreement
NAFTA
UruguayRound
1970 72 74 76 78 80 82 84 86 88 90 92 94 96 98 20000
5
10
15
20 U.S. exports as percentage of U.S. production
Percentage of world trade
Bilateral agreementswith Japan/Korea
TokyoRound
Figure 8
Value of U.S. beef exports grew faster than value of imports, 1989 to 2000
Million dollars
Source: U.S. Department of Commerce.
1989 90 91 92 93 94 95 96 97 98 99 20000
500
1,000
1,500
2,000
2,500
3,000
3,500
Exports Imports
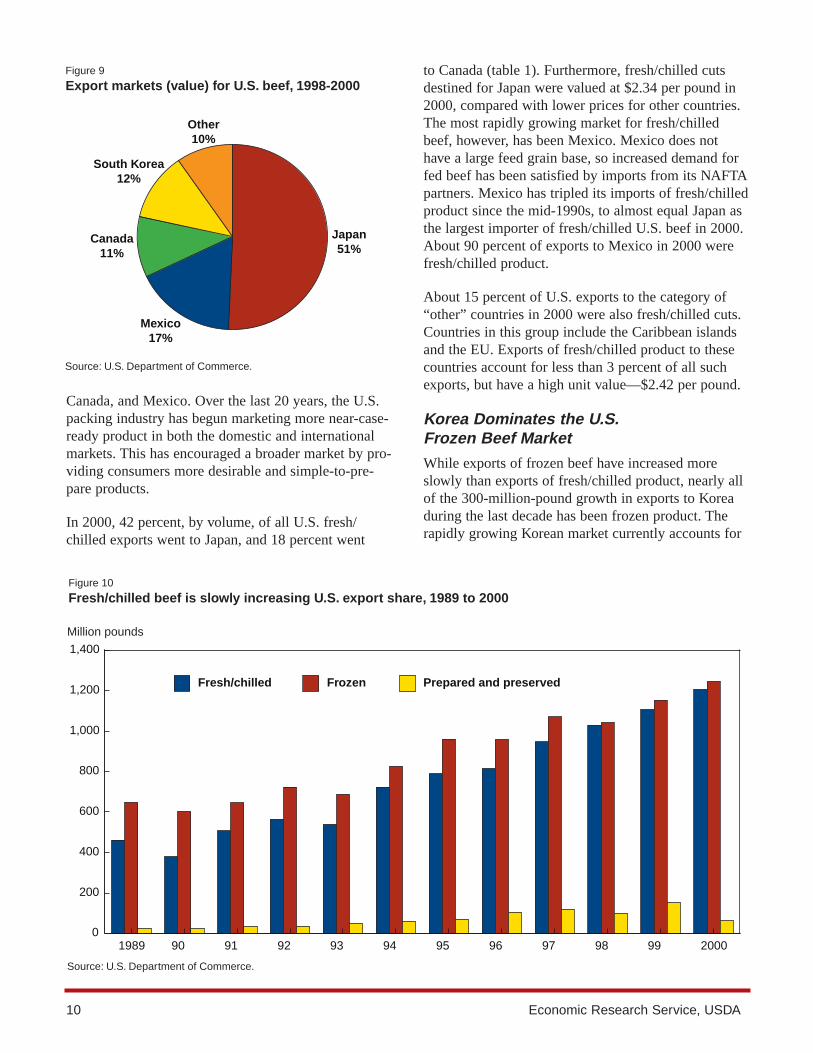
Canada, and Mexico. Over the last 20 years, the U.S.packing industry has begun marketing more near-case-ready product in both the domestic and internationalmarkets. This has encouraged a broader market by pro-viding consumers more desirable and simple-to-pre-pare products.
In 2000, 42 percent, by volume, of all U.S. fresh/chilled exports went to Japan, and 18 percent went
to Canada (table 1). Furthermore, fresh/chilled cutsdestined for Japan were valued at $2.34 per pound in2000, compared with lower prices for other countries.The most rapidly growing market for fresh/chilledbeef, however, has been Mexico. Mexico does nothave a large feed grain base, so increased demand forfed beef has been satisfied by imports from its NAFTApartners. Mexico has tripled its imports of fresh/chilledproduct since the mid-1990s, to almost equal Japan asthe largest importer of fresh/chilled U.S. beef in 2000.About 90 percent of exports to Mexico in 2000 werefresh/chilled product.
About 15 percent of U.S. exports to the category of“other” countries in 2000 were also fresh/chilled cuts.Countries in this group include the Caribbean islandsand the EU. Exports of fresh/chilled product to thesecountries account for less than 3 percent of all suchexports, but have a high unit value—$2.42 per pound.
Korea Dominates the U.S.Frozen Beef Market
While exports of frozen beef have increased moreslowly than exports of fresh/chilled product, nearly allof the 300-million-pound growth in exports to Koreaduring the last decade has been frozen product. Therapidly growing Korean market currently accounts for
10 Economic Research Service, USDA
Figure 9
Export markets (value) for U.S. beef, 1998-2000
Source: U.S. Department of Commerce.
Japan51%
Mexico17%
Canada11%
South Korea12%
Other10%
Figure 10
Fresh/chilled beef is slowly increasing U.S. export share, 1989 to 2000
Million pounds
Source: U.S. Department of Commerce.
1989 90 91 92 93 94 95 96 97 98 99 20000
200
400
600
800
1,000
1,200
1,400
Fresh/chilled Frozen Prepared and preserved
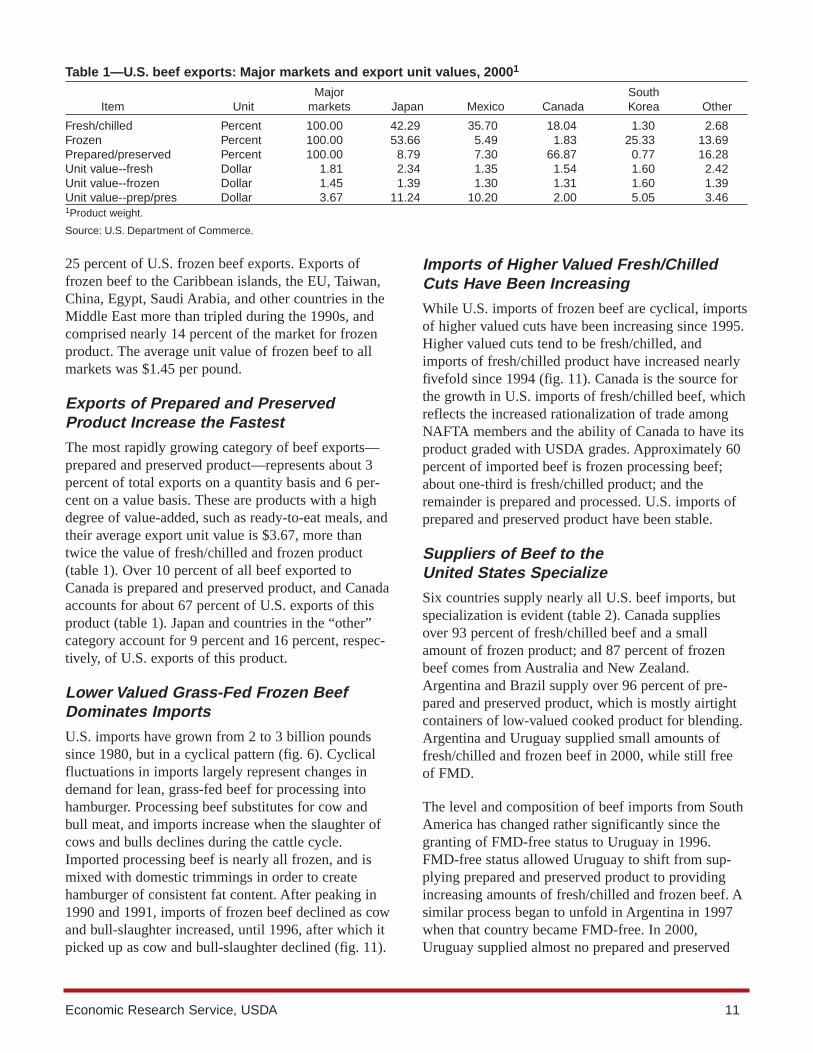
25 percent of U.S. frozen beef exports. Exports offrozen beef to the Caribbean islands, the EU, Taiwan,China, Egypt, Saudi Arabia, and other countries in theMiddle East more than tripled during the 1990s, andcomprised nearly 14 percent of the market for frozenproduct. The average unit value of frozen beef to allmarkets was $1.45 per pound.
Exports of Prepared and PreservedProduct Increase the Fastest
The most rapidly growing category of beef exports—prepared and preserved product—represents about 3percent of total exports on a quantity basis and 6 per-cent on a value basis. These are products with a highdegree of value-added, such as ready-to-eat meals, andtheir average export unit value is $3.67, more thantwice the value of fresh/chilled and frozen product(table 1). Over 10 percent of all beef exported toCanada is prepared and preserved product, and Canadaaccounts for about 67 percent of U.S. exports of thisproduct (table 1). Japan and countries in the “other”category account for 9 percent and 16 percent, respec-tively, of U.S. exports of this product.
Lower Valued Grass-Fed Frozen BeefDominates Imports
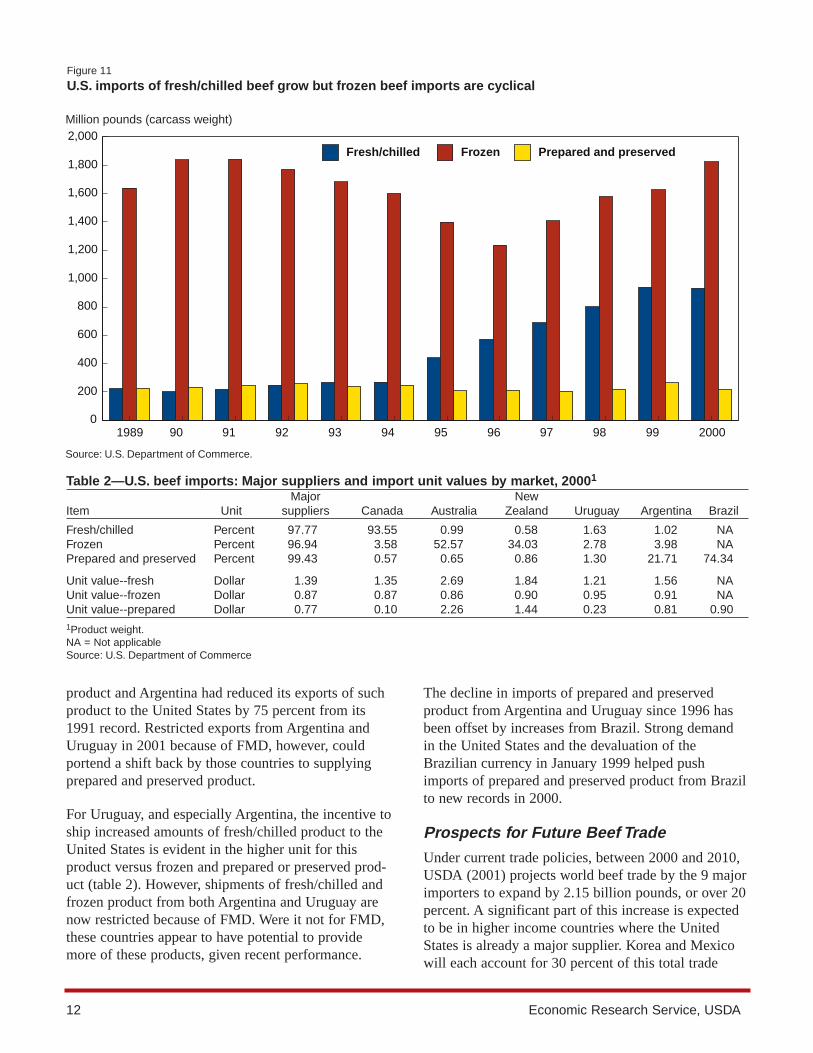
U.S. imports have grown from 2 to 3 billion poundssince 1980, but in a cyclical pattern (fig. 6). Cyclicalfluctuations in imports largely represent changes indemand for lean, grass-fed beef for processing intohamburger. Processing beef substitutes for cow andbull meat, and imports increase when the slaughter ofcows and bulls declines during the cattle cycle.Imported processing beef is nearly all frozen, and ismixed with domestic trimmings in order to createhamburger of consistent fat content. After peaking in1990 and 1991, imports of frozen beef declined as cowand bull-slaughter increased, until 1996, after which itpicked up as cow and bull-slaughter declined (fig. 11).
Imports of Higher Valued Fresh/ChilledCuts Have Been Increasing
While U.S. imports of frozen beef are cyclical, importsof higher valued cuts have been increasing since 1995.Higher valued cuts tend to be fresh/chilled, andimports of fresh/chilled product have increased nearlyfivefold since 1994 (fig. 11). Canada is the source forthe growth in U.S. imports of fresh/chilled beef, whichreflects the increased rationalization of trade amongNAFTA members and the ability of Canada to have itsproduct graded with USDA grades. Approximately 60percent of imported beef is frozen processing beef;about one-third is fresh/chilled product; and theremainder is prepared and processed. U.S. imports ofprepared and preserved product have been stable.
Suppliers of Beef to the United States Specialize
Six countries supply nearly all U.S. beef imports, butspecialization is evident (table 2). Canada suppliesover 93 percent of fresh/chilled beef and a smallamount of frozen product; and 87 percent of frozenbeef comes from Australia and New Zealand.Argentina and Brazil supply over 96 percent of pre-pared and preserved product, which is mostly airtightcontainers of low-valued cooked product for blending.Argentina and Uruguay supplied small amounts offresh/chilled and frozen beef in 2000, while still freeof FMD.
The level and composition of beef imports from SouthAmerica has changed rather significantly since thegranting of FMD-free status to Uruguay in 1996.FMD-free status allowed Uruguay to shift from sup-plying prepared and preserved product to providingincreasing amounts of fresh/chilled and frozen beef. Asimilar process began to unfold in Argentina in 1997when that country became FMD-free. In 2000,Uruguay supplied almost no prepared and preserved
Economic Research Service, USDA 11
Table 1—U.S. beef exports: Major markets and export unit values, 20001
Major SouthItem Unit markets Japan Mexico Canada Korea Other
Fresh/chilled Percent 100.00 42.29 35.70 18.04 1.30 2.68Frozen Percent 100.00 53.66 5.49 1.83 25.33 13.69Prepared/preserved Percent 100.00 8.79 7.30 66.87 0.77 16.28Unit value--fresh Dollar 1.81 2.34 1.35 1.54 1.60 2.42Unit value--frozen Dollar 1.45 1.39 1.30 1.31 1.60 1.39Unit value--prep/pres Dollar 3.67 11.24 10.20 2.00 5.05 3.461Product weight.
Source: U.S. Department of Commerce.
product and Argentina had reduced its exports of suchproduct to the United States by 75 percent from its1991 record. Restricted exports from Argentina andUruguay in 2001 because of FMD, however, couldportend a shift back by those countries to supplyingprepared and preserved product.
For Uruguay, and especially Argentina, the incentive toship increased amounts of fresh/chilled product to theUnited States is evident in the higher unit for thisproduct versus frozen and prepared or preserved prod-uct (table 2). However, shipments of fresh/chilled andfrozen product from both Argentina and Uruguay arenow restricted because of FMD. Were it not for FMD,these countries appear to have potential to providemore of these products, given recent performance.
The decline in imports of prepared and preservedproduct from Argentina and Uruguay since 1996 hasbeen offset by increases from Brazil. Strong demandin the United States and the devaluation of theBrazilian currency in January 1999 helped pushimports of prepared and preserved product from Brazilto new records in 2000.
Prospects for Future Beef Trade
Under current trade policies, between 2000 and 2010,USDA (2001) projects world beef trade by the 9 majorimporters to expand by 2.15 billion pounds, or over 20percent. A significant part of this increase is expectedto be in higher income countries where the UnitedStates is already a major supplier. Korea and Mexicowill each account for 30 percent of this total trade
12 Economic Research Service, USDA
Figure 11
U.S. imports of fresh/chilled beef grow but frozen beef imports are cyclical
Million pounds (carcass weight)
Source: U.S. Department of Commerce.
1989 90 91 92 93 94 95 96 97 98 99 20000
200
400
600
800
1,000
1,200
1,400
1,600
1,800
2,000Fresh/chilled Frozen Prepared and preserved
Table 2—U.S. beef imports: Major suppliers and import unit values by market, 20001
Major NewItem Unit suppliers Canada Australia Zealand Uruguay Argentina Brazil
Fresh/chilled Percent 97.77 93.55 0.99 0.58 1.63 1.02 NAFrozen Percent 96.94 3.58 52.57 34.03 2.78 3.98 NAPrepared and preserved Percent 99.43 0.57 0.65 0.86 1.30 21.71 74.34
Unit value--fresh Dollar 1.39 1.35 2.69 1.84 1.21 1.56 NAUnit value--frozen Dollar 0.87 0.87 0.86 0.90 0.95 0.91 NAUnit value--prepared Dollar 0.77 0.10 2.26 1.44 0.23 0.81 0.901Product weight.NA = Not applicableSource: U.S. Department of Commerce
increase, and Japan will account for another 14 percentof total growth in beef imports. Other Asian countries,such as Taiwan, are also expected to increase importsof U.S. beef. Increased demand in China is projectedto be satisfied with domestic production.
Most of the growth in beef demand by the above coun-tries is expected to be for grain fed, and the UnitedStates is expected to supply about 25 percent ofincreased demand. Greater access to selected marketscould substantially increase trade above this baseline,however. Australia and New Zealand will continue todominate world beef markets by virtue of the size oftheir production relative to consumption. Since the(predominantly grass-fed) beef from both countries isa poor substitute for grain-fed U.S. beef, neither islikely to compete strongly in the growing fed-beefmarkets.
U.S. fed-beef exports are likely to face increased com-petition from Canada and possibly South America.Canada is expected to increase its numbers of animalsand their weights, but its maximum herd size is limitedto about 10 percent the size of the U.S. herd. BothArgentina and Brazil have large feed grain stocks withwhich to support a fed-beef sector, but capital invest-
ment to develop a feedlot sector is not likely to beforthcoming until Argentina is once again FMD-free.Furthermore, any significant shift to high-quality fed-beef production in Brazil would require a shift fromthe Zebu breed of cattle to European breeds thatrespond more desirably to feeding, and such breedswould be limited to more temperate regions.
The growth in beef imports by the United States willcontinue to be influenced by the cyclical need for pro-cessing beef, mainly from Australia and New Zealand.Countries capable of supplying grain-fed beef at com-petitive prices may be attracted to the U.S. marketuntil they can gain entrance to the more lucrativeAsian markets. The main source of growth infresh/chilled imports will continue to be Canada, asbeef and cattle trade between Canada and the UnitedStates becomes more rationalized under the NAFTA.
The prospect of increased foreign supplies, as well asincreased imports from Canada and low-cost SouthAmerican suppliers, underscores the importance toU.S. beef producers of further increasing marketaccess. However, history suggests that U.S. beefexports may benefit most from increases in access tospecific countries.
Economic Research Service, USDA 13
The first significant multilateral trade agreementaffecting beef trade occurred in 1978, as part of theTokyo Round of international trade negotiations.Under this agreement, the United States secured acommitment that an increasing portion of the Japaneseimport quota would be high-quality grain-fed beef,even though these imports would compete with grain-fed Wagu beef, which is produced in Japan. After thisagreement lapsed in 1983, both the United States andAustralia negotiated agreements in 1984 to raise boththe total quota and the high-quality portion, whichonly the United States was capable of supplying.
The next few years saw growing interest by Japaneseconsumers for additional beef imports, as a rapidlygrowing Japanese economy and an appreciating cur-rency gave them the financial ability to purchase addi-tional amounts of higher quality beef. Between thefirst half of 1985 and the latter half of 1989, the Yenappreciated about 50 percent, which meant that itcould buy twice as much foreign goods at a fixed dol-lar price, including beef. Anxious to satisfy this grow-ing potential market, the United States, Australia, andNew Zealand filed objections to the Japanese quotasystem with the GATT.
In 1988, the United States and Japan signed the Beef-Citrus Agreement, which further increased access tothe Japanese market by phasing out Japan’s importquota and the existing 25-percent tariff, and substitut-ing them with a 70-percent tariff beginning in 1991.The new tariff was phased to 60 percent in 1992, andto 50 percent in 1993 and thereafter. In 1989, Koreaalso granted greater market access in a series of simi-lar bilateral agreements with the United States,
Australia, and New Zealand. As a result of theseagreements, U.S. exports to Japan in 1989 increased40 percent, and exports to Korea increased almostfourfold, with Japan accounting for two-thirds of allU.S. beef exports that year.
Market access among North American countries wasliberalized with implementation of the North AmericanFree Trade Agreement (NAFTA) on January 1, 1994.NAFTA eliminated Mexican import tariffs onfresh/chilled and frozen beef of 20 percent and 25 per-cent, respectively, and provided for phasing out the tariff on beef offal over 10 years. Under the Canadian/U.S. Free Trade Agreement, signed in 1989, Canadaexempted the United States from its Meat Import Law,and eliminated tariffs for both beef and cattle. Underthese agreements, the United States reciprocated byeliminating tariffs on Canadian and Mexican beef cat-tle, including a 2.2-cent-per-kilogram tariff on non-breeding animals. This increased incentives to importfeeder cattle into the United States, especially fromMexico where feed grain is limited.
NAFTA has facilitated intra-regional rationalization ofthe North American beef and cattle markets. Non-NAFTA countries face high tariffs for imports abovemaximum import levels, known as tariff rate quotas(TRQs). Since NAFTA, exports of U.S. feeder cattle toCanada and U.S. imports of feeder cattle from Mexicohave increased. Beef imports from NAFTA partnershave increased from 20 percent to about 30 percent oftotal imports, while beef exports have remained atabout 30 percent of total. Exports of beef to Canadahave remained stable while exports to Mexico haveincreased.
14 Economic Research Service, USDA
Pre-Uruguay Round Reductions in Trade Barriers Increased Beef Trade
Of eight rounds of multilateral trade negotiations, theUruguay Round (1986-94) was the first to broadly andsignificantly liberalize agricultural trade-related poli-cies. The Uruguay Round reached agreements forspecified actions by the signatory parties and providedguidelines for continued reforms. Although it is diffi-cult to distinguish the influence of the Uruguay Roundfrom other factors affecting beef trade, the volume ofworld beef imports by major beef trading countries hasincreased 3-4 percent, in total, since 1995. Thisincrease has occurred in spite of a period of cyclicalcontraction in production by the major beef-exportingcountries and economic difficulties in many Asianmarkets. Since much of the pre-1995 expansion oftrade occurred as earlier bilateral trade agreementswere phased in, it seems reasonable to conclude thatliberalizing influences of the Uruguay Round helpedto increase beef trade.
Three major accomplishments of the Uruguay Roundhave had significant effects on beef trade (USDA,1998A; Josling, 1999). The most important of thesewas the Uruguay Round Agreement on Agriculture(URAA) because it most directly liberalized worldagricultural trade. The URAA increased market access,reduced domestic support, and subsidized export lev-els. A second agreement, The Agreement on theApplication of Sanitary and Phytosanitary Measures,or SPS Agreement, provided new disciplines on theallowed use of sanitary and phytosanitary (SPS) meas-ures to restrict trade for valid health and safety rea-sons. Thirdly, the Uruguay Round also provided a newprocess for settling trade disputes.
The URAA Increased Market Access
The URAA increased market access in three ways(WTO, 1997). WTO members were required to:
• eliminate or convert all non-tariff trade barriers totariffs;
• reduce base period (1986-88) tariffs by a minimumof 15 percent, and an average of 36 percent and 24percent for developed and developing countries,respectively, over 6-year and 10-year implementa-tion periods; and
• fix, or “bind” these tariffs at the end-of-period levels.
Countries could apply these tariffs, at either the boundor lower applied levels, to imports exceeding a speci-fied limit, known as the tariff-rate quota (TRQ), butmost were required to assess imports within the TRQat a lower tariff. The average tariff reduction on ani-mals and animal products was 32 percent (WTO,1995). The TRQ system assured that a certain amountof imports would benefit from low tariffs and that amaximum bound tariff could be applied on largeramounts.
TRQs for beef were not part of the URAA for Japan,Korea, and a few other countries. Japan had alreadyconverted an import quota to tariffs under the 1988Beef-Citrus Agreement, and Korea accomplished asimilar agreement before the Uruguay Round.However, under the URAA, Japan reduced beef tariffsfrom 50 percent to 38.5 percent for all countries. TheURAA also provided for Korea to double its minimumimports of beef to 225,000 metric tons (productweight) by the year 2000. Beginning January 1, 2001,imports and distribution of beef in Korea are unre-stricted, but imports continue to be subject to a 41.2-percent tariff that decreases to 40 percent in 2004.
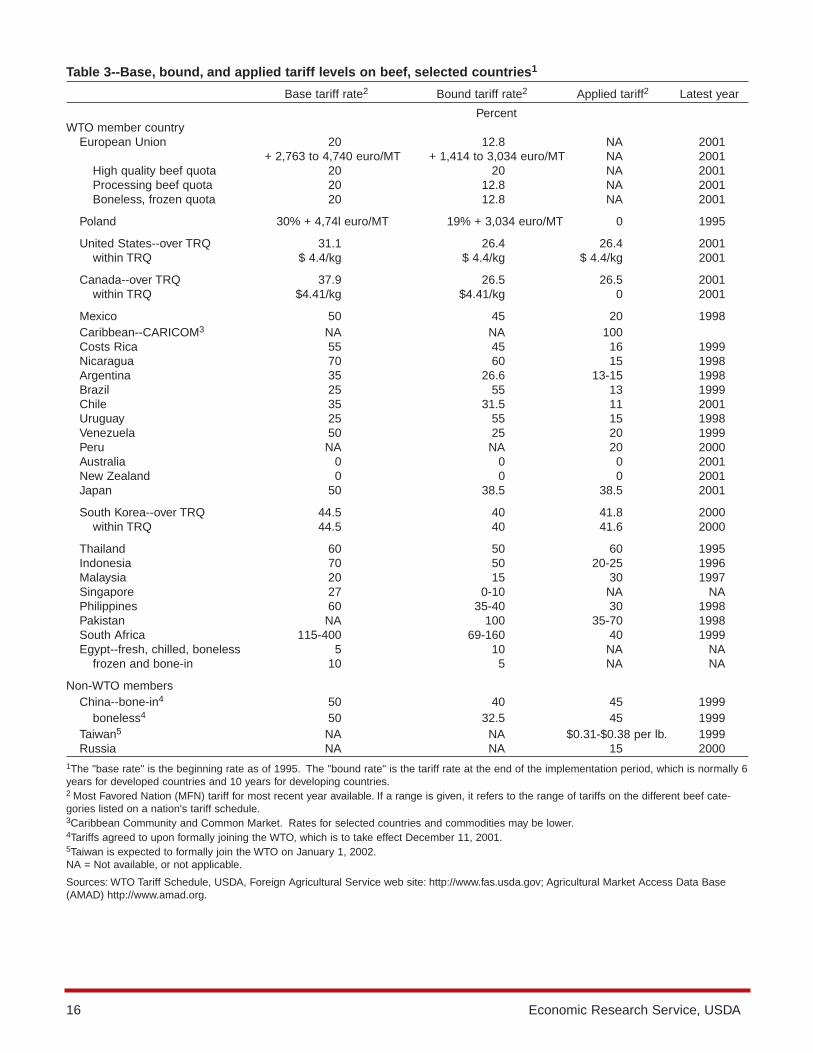
Tariffs on Beef—The tariff structure for beef differs in two important ways from the tariff structure forgrain. First, the bound tariff levels for beef (table 3)are generally much lower than the 78-percent averagebound-tariff for grain (Gibson, et al.). Second, theapplied tariffs for beef are much closer to the boundlevels. This implies that further reductions in boundtariffs under a future WTO agreement may be morelikely to result in reductions in applied tariffs, as well,which may often not be the case with field crops(Dohlman and Hoffman).
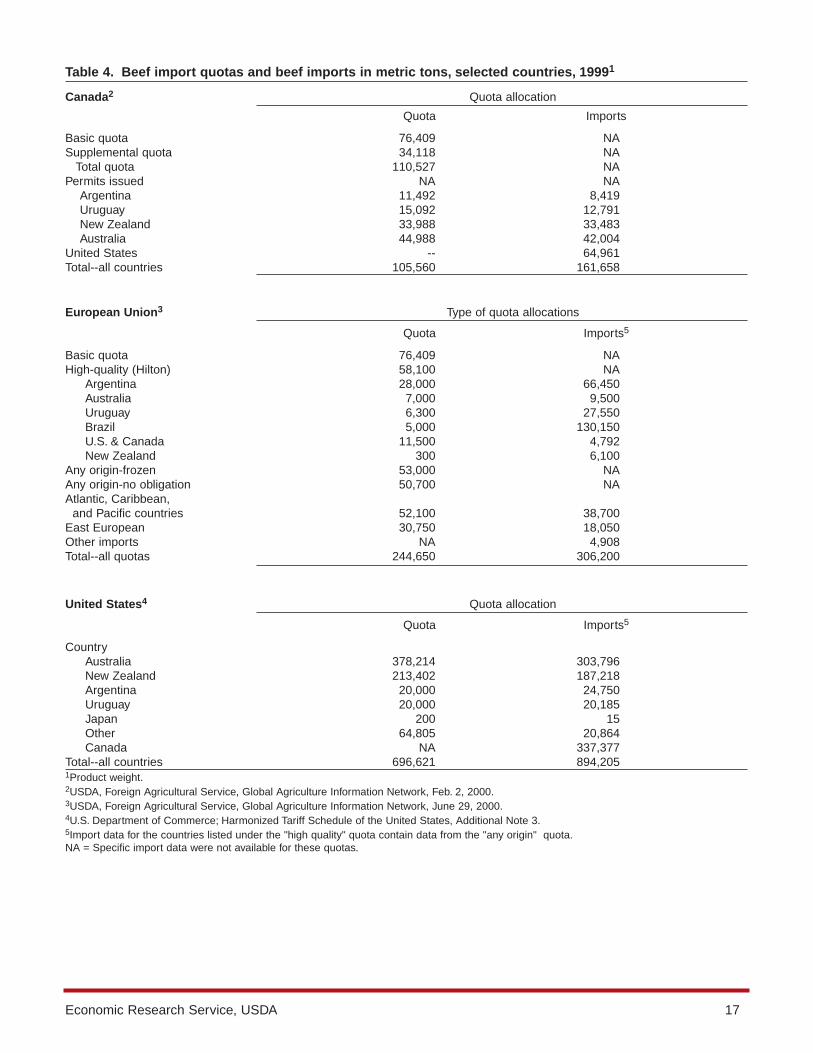
Beef TRQs—The most important countries with TRQsfor beef are the NAFTA countries—the United States,Canada, Mexico—and the EU. The NAFTA countrieshave TRQs for imports from non-member countries,but conduct considerable unrestricted trade with eachother. In 1999, for example, exports to Canada by theUnited States totaled nearly 65,000 tons—about 40percent of Canada’s imports (table 4). This was mainlyhigher quality grain-fed product. U.S. exports to east-ern Canada are expected to continue increasing asWestern Canada shifts more of its production onto the
Economic Research Service, USDA 15
Liberalizing World Beef Markets in the Uruguay Round
16 Economic Research Service, USDA
Table 3--Base, bound, and applied tariff levels on beef, selected countries1
Base tariff rate2 Bound tariff rate2 Applied tariff2 Latest year
PercentWTO member country
European Union 20 12.8 NA 2001+ 2,763 to 4,740 euro/MT + 1,414 to 3,034 euro/MT NA 2001
High quality beef quota 20 20 NA 2001Processing beef quota 20 12.8 NA 2001Boneless, frozen quota 20 12.8 NA 2001
Poland 30% + 4,74l euro/MT 19% + 3,034 euro/MT 0 1995
United States--over TRQ 31.1 26.4 26.4 2001within TRQ $ 4.4/kg $ 4.4/kg $ 4.4/kg 2001
Canada--over TRQ 37.9 26.5 26.5 2001within TRQ $4.41/kg $4.41/kg 0 2001
Mexico 50 45 20 1998Caribbean--CARICOM3 NA NA 100Costs Rica 55 45 16 1999Nicaragua 70 60 15 1998Argentina 35 26.6 13-15 1998Brazil 25 55 13 1999Chile 35 31.5 11 2001Uruguay 25 55 15 1998Venezuela 50 25 20 1999Peru NA NA 20 2000Australia 0 0 0 2001New Zealand 0 0 0 2001Japan 50 38.5 38.5 2001
South Korea--over TRQ 44.5 40 41.8 2000within TRQ 44.5 40 41.6 2000
Thailand 60 50 60 1995Indonesia 70 50 20-25 1996Malaysia 20 15 30 1997Singapore 27 0-10 NA NAPhilippines 60 35-40 30 1998Pakistan NA 100 35-70 1998South Africa 115-400 69-160 40 1999Egypt--fresh, chilled, boneless 5 10 NA NA
frozen and bone-in 10 5 NA NA
Non-WTO membersChina--bone-in4 50 40 45 1999
boneless4 50 32.5 45 1999Taiwan5 NA NA $0.31-$0.38 per lb. 1999Russia NA NA 15 2000
1The "base rate" is the beginning rate as of 1995. The "bound rate" is the tariff rate at the end of the implementation period, which is normally 6years for developed countries and 10 years for developing countries.2 Most Favored Nation (MFN) tariff for most recent year available. If a range is given, it refers to the range of tariffs on the different beef cate-gories listed on a nation's tariff schedule.3Caribbean Community and Common Market. Rates for selected countries and commodities may be lower.4Tariffs agreed to upon formally joining the WTO, which is to take effect December 11, 2001.5Taiwan is expected to formally join the WTO on January 1, 2002.NA = Not available, or not applicable.
Sources: WTO Tariff Schedule, USDA, Foreign Agricultural Service web site: http://www.fas.usda.gov; Agricultural Market Access Data Base(AMAD) http://www.amad.org.
Economic Research Service, USDA 17
Table 4. Beef import quotas and beef imports in metric tons, selected countries, 19991
Canada2 Quota allocation
Quota Imports
Basic quota 76,409 NASupplemental quota 34,118 NA
Total quota 110,527 NAPermits issued NA NA
Argentina 11,492 8,419 Uruguay 15,092 12,791 New Zealand 33,988 33,483 Australia 44,988 42,004
United States -- 64,961 Total--all countries 105,560 161,658
European Union3 Type of quota allocations
Quota Imports5
Basic quota 76,409 NAHigh-quality (Hilton) 58,100 NA
Argentina 28,000 66,450Australia 7,000 9,500Uruguay 6,300 27,550Brazil 5,000 130,150U.S. & Canada 11,500 4,792New Zealand 300 6,100
Any origin-frozen 53,000 NAAny origin-no obligation 50,700 NAAtlantic, Caribbean,
and Pacific countries 52,100 38,700East European 30,750 18,050Other imports NA 4,908Total--all quotas 244,650 306,200
United States4 Quota allocation
Quota Imports5
CountryAustralia 378,214 303,796New Zealand 213,402 187,218Argentina 20,000 24,750Uruguay 20,000 20,185Japan 200 15Other 64,805 20,864Canada NA 337,377
Total--all countries 696,621 894,2051Product weight.2USDA, Foreign Agricultural Service, Global Agriculture Information Network, Feb. 2, 2000.3USDA, Foreign Agricultural Service, Global Agriculture Information Network, June 29, 2000.4U.S. Department of Commerce; Harmonized Tariff Schedule of the United States, Additional Note 3.5Import data for the countries listed under the "high quality" quota contain data from the "any origin" quota.NA = Specific import data were not available for these quotas.
export market. The rest of Canada’s imports are main-ly lower quality manufacturing-grade product fromAustralia, New Zealand, and South America.
Under the URAA, the United States replaced fixedquota imports under the 1979 Meat Import Law (MIL)with TRQs. These TRQs were allocated to countrieson the basis of their historical levels of beef exports tothe United States. In comparison, the total quota underthe MIL averaged 587,193 metric tons between 1990and 1994 (Brester and Wohlgenant), and the currentTRQ totals 696,621 metric tons (table 4). The URAA,therefore, allows about 19 percent more within-quotaimports into the United States than the MIL quota, andprovides opportunities to import more subject to anover-quota tariff. However, imports from NAFTA part-ners are not counted against the U.S. TRQ. In 1999,imports under quota were about 557,000 metric tons,with imports from Canada amounting to an additional337,000 metric tons. Total within-quota U.S. andNAFTA beef imports were about 894,000 metric tons,or more than 52 percent above the average allowedunder the MIL in 1990-94.3
The EU operates the most restrictive TRQ system forimports not eligible for concessionary terms. Non-con-cessionary imports of cattle, calves, beef, and veal aresubject to a so-called complex tariff that includesbound ad valorem custom duties averaging 12.8 per-cent and bound import tariffs ranging from 1,414 to3,034 euros per metric ton, depending upon the cut(CAP Monitor).4 These tariffs equal $0.59 per poundand $1.26 per pound, at the 2000 exchange rate of1.09 euros per U.S. dollar, and are equivalent to 46percent and 85 percent, respectively, of the export unitvalue of fresh/chilled U.S. beef. The net protection onbeef imports from the United States, inclusive of thead valorem customs duty, would therefore range fromabout 59 percent to 98 percent of the U.S. price.
Most beef and cattle have entered the EU under con-cessionary arrangements, however, since the CommonAgricultural Policy (CAP) was introduced in 1967.Nearly 245,000 metric tons of beef enters the EUunder quotas with reduced duties and/or tariffs, if cer-tified free of synthetic growth hormones. The largest—
known as the Hilton Quota—allows 58,100 metric tonsof high-quality beef cuts free of tariff but assesses a20-percent customs duty (CAP Monitor). The secondis 53,000 metric tons of lower grade frozen beefregardless of origin, which has the 12.8-percent cus-toms duty applied but no tariff. The third is a “no-obli-gation” agreement to import 50,700 metric tons offrozen beef for manufacturing subject to the customsduty and reduced tariffs. The fourth is the 52,100-metric-ton African, Caribbean, and Pacific (ACP) con-cession, under which customs duties are waived andtariffs reduced by 92 percent. A fifth concession cov-ers 30,750 metric tons from East European countries,on which duties and tariffs are waived. Finally, dutiesand fees are reduced by 80 percent on 231,000 calvesfrom some East European countries.
Total EU beef imports typically exceed the total quotasbecause of over-quota imports from South America.For example, in 1999, imports from South Americawere 224,150 metric tons, or 81,150 metric tons abovethat region’s high-quality quotas and the “any origin”quotas, and represented 73 percent of EU beefimports. Total EU imports were 25 percent above the245,000-metric-ton preferential beef quota. In contrast,neither the United States nor Canada filled their 20-percent share of high-value quotas.
Such large imports of over-quota beef draw attentionto two advantages that South American beef has in theEU. The most important advantage is that Argentinebeef is certified as free of administered hormones, arequirement for exporting beef to the EU. Consequently,neither Canada nor the United States come close tofilling their 20-percent portion of the Hilton Quotabecause of the hormone-free requirement. Secondly,Argentine beef can undersell U.S. beef because thebase price of grass-fed Argentine beef is much lessthan the price of U.S. product. This price differential isaggravated when ad valorem customs duties add alarger dollar markup to the already higher price ofU.S. product, adding further incentives for EU con-sumers to make the imperfect substitution of Argentinebeef.
The URAA Lowered DomesticSupport Levels
The URAA required a 6-year, 20-percent reduction inthe Aggregate Measurement of Support (AMS), ameasure of internal producer support aggregated overall trade-distorting policies and commodities. These
18 Economic Research Service, USDA
3The MIL quota was varied year-to-year in order to accommo-date market conditions (see Hahn, et al., p. 21), and so might havebeen increased had it remained in effect.
4Tariffs replaced variable levies on July 1, 1995, under theURAA.
trade-distorting policies are known as “amber box”policies, and may be commodity specific or not. Theyinclude government payments and market price sup-ports that are related to the level of current production,prices, resource use, or inputs, and are also known ascoupled payments. Subsidies less than 5 percent of thevalue of production were considered de minimus, andexempt from reduction. Countries could meet theirAMS commitment by choosing among policies andcommodities. With the exception of the interventionsystem in the EU, however, domestic price supportpolicies are not widely applied to beef.
Japan, like all developed countries, committed toreducing its AMS by 20 percent, but beef accountedfor only a small share of the AMS. Internal beef pricesare mainly supported by an import tariff, which hasbeen reduced under the URAA according to the 6-yeartransition schedule. Japan’s cattle herd continues aslow gradual decline.
Korea only notified the WTO of some de-minimusinterest rate subsidies in the URAA, but no price-relat-ed supports. However, late in 2000, the United Statessuccessfully challenged a deficiency-type-paymentsystem provided to Korean beef producers. In spite ofits deficiency payments, Korea’s minimum importsagreed to in the URAA have pushed internal pricesdown and added to the liquidation pressures associatedwith pre-existing financial stress. The beginning cattleinventory in 2001 was down 35 percent from the levelof 1998.
While the EU has reduced intervention buying of beefsince the URAA, overall support has been complicatedby increased use of direct payments. Most headagepayments for beef are considered “blue box,” andtherefore not subject to AMS reduction. Moreover,fluctuations in exchange rates and prices further cloudany assessment of recent effective support in the EU.Finally, the effect of policy changes on stocks are alsodifficult to gauge because the disposal of large num-bers of animals as a result of BSE, FMD, and aid to
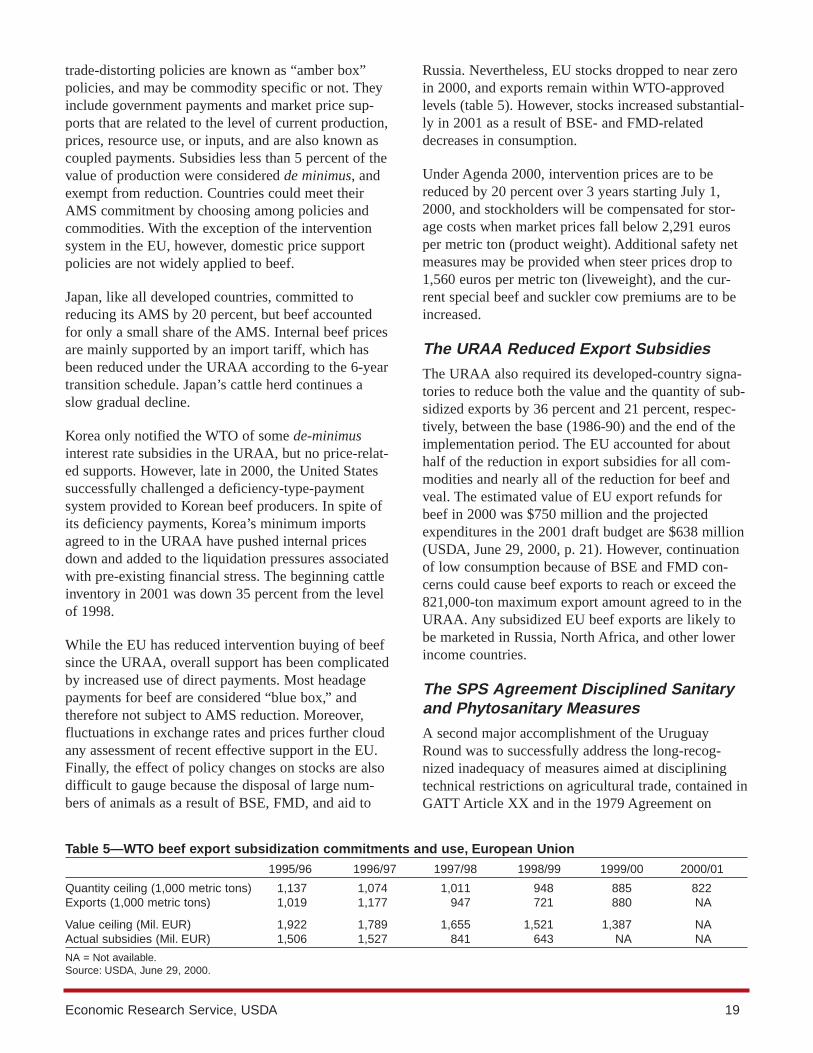
Russia. Nevertheless, EU stocks dropped to near zeroin 2000, and exports remain within WTO-approvedlevels (table 5). However, stocks increased substantial-ly in 2001 as a result of BSE- and FMD-relateddecreases in consumption.
Under Agenda 2000, intervention prices are to bereduced by 20 percent over 3 years starting July 1,2000, and stockholders will be compensated for stor-age costs when market prices fall below 2,291 eurosper metric ton (product weight). Additional safety netmeasures may be provided when steer prices drop to1,560 euros per metric ton (liveweight), and the cur-rent special beef and suckler cow premiums are to beincreased.
The URAA Reduced Export Subsidies
The URAA also required its developed-country signa-tories to reduce both the value and the quantity of sub-sidized exports by 36 percent and 21 percent, respec-tively, between the base (1986-90) and the end of theimplementation period. The EU accounted for abouthalf of the reduction in export subsidies for all com-modities and nearly all of the reduction for beef andveal. The estimated value of EU export refunds forbeef in 2000 was $750 million and the projectedexpenditures in the 2001 draft budget are $638 million(USDA, June 29, 2000, p. 21). However, continuationof low consumption because of BSE and FMD con-cerns could cause beef exports to reach or exceed the821,000-ton maximum export amount agreed to in theURAA. Any subsidized EU beef exports are likely tobe marketed in Russia, North Africa, and other lowerincome countries.
The SPS Agreement Disciplined Sanitaryand Phytosanitary Measures
A second major accomplishment of the UruguayRound was to successfully address the long-recog-nized inadequacy of measures aimed at discipliningtechnical restrictions on agricultural trade, contained inGATT Article XX and in the 1979 Agreement on
Economic Research Service, USDA 19
Table 5—WTO beef export subsidization commitments and use, European Union
1995/96 1996/97 1997/98 1998/99 1999/00 2000/01
Quantity ceiling (1,000 metric tons) 1,137 1,074 1,011 948 885 822Exports (1,000 metric tons) 1,019 1,177 947 721 880 NA
Value ceiling (Mil. EUR) 1,922 1,789 1,655 1,521 1,387 NAActual subsidies (Mil. EUR) 1,506 1,527 841 643 NA NA
NA = Not available.Source: USDA, June 29, 2000.
Technical Barriers to Trade (Roberts). These docu-ments allowed countries to regulate trade in order toprotect public health and/or the environment. However,concern about their inadequacy was heightened duringthe Uruguay Round because it was feared that effec-tive discipline of traditional trade barriers under theURAA could lead countries to rely on SPS barriers torestrict trade. The ensuing SPS agreement wasdesigned to represent an enforceable balance betweenallowing health and environmental protection, and pro-hibiting any such “disguised” restrictions on trade.
The SPS agreement reiterated the right of membercountries to use trade measures to protect “human, ani-mal or plant life, or health,” but conditioned theserights to substantive and procedural disciplines. Themost important substantive provision of the agreementwas to require that SPS measures be based upon scien-tific risk assessment, including the incorporation ofinternational standards when possible. SPS standardsare also expected to be the minimum necessary toachieve the stated goals. In cases where scientific evi-dence related to a perceived hazard is lacking, tempo-rary measures are allowed until an objective riskassessment can be performed. Finally, in recognitionthat pests and diseases do not conform to politicalboundaries, the agreement provides for regional riskassessments and trade flows.
Two important procedural obligations in the agreementincreased the transparency of countries’ SPS measures.First, an SPS Committee was established under theauspices of the WTO to develop policy guidelines andfacilitate discussion among member countries. Second,countries were required to notify the WTO of anypending SPS measures. These procedures greatlyincreased the transparency of countries’ SPS measures.
Both the procedural and substantive obligations of theagreement are believed to have provided incentives formember countries to review their SPS policies, and toreach some bilateral agreements without progressingto the more formal realm of dispute settlement. Forexample, scientific risk assessment played a role in theUnited States-Canada agreement to expedite the exportof feeder cattle by producers in selected States toselected feedlots in Canada. Moreover, the prospect ofgreater WTO discipline on dispute settlement also pro-vided incentive for proactive negotiation.
Improved Dispute Settlement ProvisionsHelp Resolve Complaints
The third major accomplishment of the UruguayRound was to strengthen dispute settlement (for asummary, see Brosch, 1998). The consensus-drivenpre-Uruguay Round dispute settlement process notonly required that three-judge panels be chosen by theprincipal parties to a dispute, but allowed any of theContracting Parties to the GATT to block the forma-tion of such a panel.5 Similarly, any Contracting Partycould block adoption of the final panel report.Furthermore, panels were allowed to defer on makinga decision, citing “incomplete information.” TheUruguay Round shifted dispute settlement moretoward adjudication by adopting the WTOUnderstanding on the Rules and ProceduresGoverning the Settlement of Disputes, which prohibit-ed blocking panel formation and the issuance ofreports, and specifically directed panels to settle dis-putes.
The prospect of WTO discipline proved real, with ninecomplaints advancing to the level of formal complaintsduring the first 3 years of the Agreement, in contrast toa lethargic pace of dispute settlement during the first47 years of the GATT. Several of these nine com-plaints concerned the scientific basis for variousrestrictions that involved beef, among other products.
One of the nine cases involved an objection by theUnited States in May 1995 to the shelf-life standardsfor beef mandated by Korea, which advanced to thelevel of formal consultations. The outcome was thatSouth Korea allowed the use dates of frozen foods andvacuum-packed meat to be set by manufacturers. Thiswas consistent with Article 4 of the SPS Agreement,which provided for the recognition of equivalent stan-dards if the exporter could prove that SPS measuresachieved “…the importer’s appropriate level of protec-tion.” Formal consultations were also used to resolve a1996 complaint against Korean inspection measures atports of entry, which imposed added costs to beefimports. And in December 2000, a panel found thatKorea’s marketing system unfairly required importedbeef to be sold in separate stores from domestic beef,thus excluding it from about 90 percent of stores.
20 Economic Research Service, USDA
5The beef hormone dispute was so long lasting because of suchblocking (Brosch, pp. 38).
The most notable issue resolved under the Agreementwas between the United States and the EU on the useof synthetic hormones in beef cattle feed. The ban bythe EU on hormone-treated beef had been an issuesince 1989, and became one of the disputes heard byformal panels. The EU defended the ban by arguingthat international standards did not meet its publichealth goals and invoking the “precautionary princi-ple” that special regulations be allowed when risks areimperfectly understood. However, the panel ruled the
ban had not been based on a risk assessment because itbore no “rational relationship” to the risks described inscientific studies of hormone-treated beef consump-tion. While the panel agreed that extraordinary meas-ures could be adopted “provisionally,” under Article5.7, they must be temporary, not permanent, as was theEU ban. The panel ruling was upheld upon appeal andthe United States was allowed to retaliate by imposingcompensatory duties on EU products, so long as theEU maintains the hormone ban.
Economic Research Service, USDA 21
The major efforts related to the beef sector in the nextWTO round are expected to focus on expanding thesignificant but still limited achievements of theUruguay Round. Most importantly, these wouldinclude further increases in TRQs and reductions inbound tariffs. Although Japan and Korea do not haveTRQs, reductions in bound tariffs by these countriescould significantly increase U.S. beef exports. Itshould be remembered, however, that about 25 percentof U.S. beef exports receive duty-free treatment underNAFTA. This percentage is likely to increase, sinceMexico is expected to remain the fastest growing mar-ket for U.S. beef exports in the near future.
The United States will likely face pressure to increasequota levels and reduce both its within-quota andabove-quota tariffs. These pressures are expected to bemainly from South American countries, especially inanticipation of eventual regional FMD-free status andincreased fed-beef production.
There is a possibility that some aspects of the liberal-ization of Korean beef imports agreed to in theUruguay Round, and which began on January 1, 2001,may become issues in the next round of negotiations.The measures include no quotas, direct negotiationbetween all buyers and sellers, and a nondiscriminato-ry distribution system that should allow imported beefto have free and unlimited access to all butcher shops.Such possibility of disputes arises, first, because itremains to be seen how Korea accommodates theDecember 2000 WTO ruling against its discriminatoryseparate marketing system for imported beef. Second,on November 6, 1999, the Korean Ministry of
Agriculture announced the “Measures for Stabilizationof the Hanwoo Industry.” While these measures areintended to relieve some of the financial hardship thatmarket liberalization will impose on domestic cattleproducers, they also contain some provisions thatcould restrict free and unlimited distribution of import-ed beef.
The current Korean plan provides direct payments forcalves when market prices fall below certain levels;support for developing alternative feedstuffs; market-ing aids for the opening of specialized Hanwoo meatshops, from 602 in 1999 to 2,000 in 2004; and incen-tives to improve Hanwoo beef quality. An earlier ver-sion of the plan also called for country-of-origin label-ing in restaurants. Any domestic policy that providesfor production-related payments or discriminatesagainst imports by origin runs a risk of becoming atrade issue.
The issue of export subsidies may not be as significantas in the past for EU beef, since the EU has reducedits internal support prices and is committed to theURAA agreement that binds both the amount spent onexport subsidies, as well as the quantity exported. TheUnited States and some other countries are, however,calling for the complete elimination of export subsi-dies. Moreover, the EU has increased the direct pay-ments to its cattle producers as a means to compensatefor the reduction in intervention prices. The net effectof these changes is presently unclear, especially inlight of BSE- and FMD-related declines in EU beefconsumption. Furthermore, while declines in the valueof the euro have brought EU prices closer to world
22 Economic Research Service, USDA
Upcoming Negotiations: Continuation of Reform
levels, a stronger Euro and increased productioninduced by direct payments could make EU exportsand subsidies significant issues.
Sanitary regulations will also be of continued concern.The most important SPS issues facing U.S. beef con-tinue to be the EU’s ban on imports of hormone-treat-ed beef, and the EU’s refusal to abide by the WTO rul-ing of 1999. This refusal is viewed by some as a seri-ous test of the WTO dispute settlement system. Inview of renewed concerns about BSE, the EU mayraise alternate arguments to defend its ban in order to
minimize the effect of imports on their current over-supply situation. Continuation of the EU ban alsounderscores that standardization of SPS rules mayneed additional attention.
Other important issues for which discussions are likelyto include food safety, animal health and disease, andthe recognition of disease-free regions. While technicaltrade barriers related to these issues have been reducedsince the Uruguay Round, concerns still remain thatnot enough has been done to reduce such trade barri-ers.
Economic Research Service, USDA 23
The primary concern of U.S. beef producers in upcom-ing agricultural negotiations is a further increasing ofmarket access, particularly in higher income Asiancountries where preference is high for U.S. beef.Producers also have an interest in the implications ofpotential entrants into the WTO.
Country Accession to the WTO—China and Taiwanare expected to formally join the WTO on December11, 2001 and January 1, 2002, respectively. Of these,the most important for U.S. beef trade is China.China’s accession to the WTO will lower its tarifffrom 45 percent to 12 percent for frozen beef and from45 percent to 25 percent for fresh/chilled beef. WhileChina is a relatively low-income country, rapid eco-nomic development is expected to expand demand forimported beef by higher income families, tourists, andbusiness travelers. Although China’s potential for beefproduction remains unclear, potential for importsexists. Taiwan, on the other hand, is likely to offer thelarger growth market for U.S. beef exports. Increasedbeef consumption in Taiwan is limited, however, bycultural traditions.
Russia is also a likely member of the WTO in thefuture. Russia had been a small but growing market forU.S. beef before economic problems there reduceddemand. Several years are likely to pass before theeconomic situation in Russia has turned around suffi-ciently to again make that country a commercial mar-ket for U.S. beef. Most recently, Russia has maintainedan applied tariff of 15 percent on U.S. beef (table 3).
Other Issues—Animal welfare and trade in productsof agricultural biotechnology are issues likely to bediscussed in the WTO. There is increasing concernthat animals raised for commercial purposes be treatedas humanely as possible, both during the growingprocess as well as at slaughter. The EU has signaled itsintention to include animal welfare as an issue in thenew WTO negotiations. Trade issues related to agricul-tural biotechnology directly concern crop productscurrently, but the topic is likely to become more salientfor beef producers because cattle may consume cropsthat have been genetically engineered. One issue thatis likely to come up in the WTO that will not beimportant for beef is the role of State TradingEnterprises (STEs). STEs are no longer an importantfactor in world beef trade since South Korea alloweddirect negotiations between buyers and sellers.
Two related issues that may arise in the context offood safety concern providing assurances that cattlemay be tracked, from birth, through the marketing sys-tem, and labeling as to country of origin. Both Canadaand the EU have tracking systems for their cattle,allowing disease problems to be detected and resolvedmost efficiently. Such systems are resisted by many,however, due to their cost, and countries without themmay find themselves at a competitive disadvantage intrade. Both tracking requirements and country-of-ori-gin labeling would involve additional complicationsfor the United States because 5-6 percent of annualU.S. cattle slaughter is of Canadian or Mexican origin.
24 Economic Research Service, USDA
New Negotiations: New Issues
U.S. beef exports began to increase with trade liberal-ization in the early 1980s, and have continued increas-ing since the signing of NAFTA and the URAA in themid-1990s. While growth in U.S. beef exports isexpected to continue, additional exports could occur iffurther access were to be granted by countries whereincomes are high and/or growing. Additional access ismost important for the high-valued markets of Japanand Korea, which currently account for about 70 per-cent of total U.S. beef exports. Much of the rest ofU.S. beef exports do not face restrictions because theyare marketed under the NAFTA agreement. Nevertheless,better access to China, the EU, and fast-growing mid-
dle-income countries could also benefit U.S. beefexports as limits in traditional markets are reached.
U.S. beef imports are also expected to continueincreasing, after dropping from their cyclical top, butat a much smaller rate than exports. Frozen productfrom Australia and New Zealand will continue to dom-inate the import market. However, once the FMD issueis resolved in South America, there is likely to be pres-sure for greater access to the U.S. Market by SouthAmerican producers, as well as increased competitionfor the United States in export markets.
Economic Research Service, USDA 25
Conclusions
Brester, C., and M. Wohlgenant. “GATT Could BodeWell for U.S. Cattlemen,” Kansas Stockman. July1997.
Brosch, K. “Improvements in the WTO DisputeSettlement,” in Agriculture in the WTO, Situationand Outlook Series. WRS-98-4. Dec. 1998.
CAP Monitor, Brussels, Belgium. 2001.
Dohlman, E., and L. Hoffman. “The New AgriculturalTrade Negotiations: Background and Issues for theU.S. Wheat Sector,” Wheat: Situation and OutlookYearbook. USDA-ERS. WHS-2000. March 2000.
Gibson, P., J. Wanio, D. Whitley, and M. Bohman.“Profiles of Tariffs in Global Agricultural Markets,”http://www.ers.usda.gov/briefing/WTO, 2001.
Hahn, W., T. Crawford, L. Bailey, and S. Shagam. TheWorld Beef Market—Government Intervention andMultilateral Policy Reform. USDA-ERS-CED. StaffReport No. AGES 9051. Aug. 1990.
Josling, T. “Reform of World Agricultural Trade: TheUruguay Round Outcome,” a presentation to aWTO seminar entitled, “The Lead Up to Seattle,”organized by the Cairns Group, Washington, DC.April 30, 1999.
Roberts, D. “Implementation of the WTO Agreementon the Application of Sanitary and PhytosanitaryMeasures,” in Agriculture in the WTO, Situation andOutlook Series. WRS-98-4. Dec. 1998.
U.S. Department of Agriculture, Economic ResearchService. Agriculture in the WTO, Situation andOutlook Series, International Agriculture and TradeReports, WRS-98-4. 1998.
U.S. Department of Agriculture, Economic ResearchService. Livestock, Dairy, and Poultry Situation andOutlook Series, selected issues.
U.S. Department of Agriculture, Economic ResearchService. USDA Agricultural Baseline Projections to2010. Staff Report, WAOB-2001-1.
U.S. Department of Agriculture, Foreign AgriculturalService. Circular Series, selected issues.
U.S. Department of Agriculture, Foreign AgriculturalService. Global Agriculture Information Network.“European Union Livestock and Animal Products2000,” Report No. E20079, June 29, 2000.
U.S. Department of Agriculture, Foreign AgriculturalService. Global Agriculture Information Network.“Canada, Livestock and Products; ContractionPhase of Cattle Cycle: Hog and Pork Expansion2000.” Report No. CA0009. Feb. 2, 2000.
U.S. Department of Agriculture, NationalAgricultural Statistical Service. LivestockSlaughter, selected issues.
World Trade Organization Secretariat. Tariff and OtherQuotas: Background Paper by the Secretariat, Sept.9, 1997.
World Trade Organization. The Results of the UruguayRound of Multilateral Trade Negotiations. TheLegal Texts. Geneva, Switzerland, 1995.
26 Economic Research Service, USDA
References