Embed Size (px)
Citation preview

THE NEW MATHUNDERSTANDING YOUR
TRUE COST OF DOING BUSINESS

Confidential | © 2015 Chainalytics LLC
WHO IS CHAINALYTICS?
2
11YEARS
GREAT SUPPLYCHAIN PARTNERSupplyChainBrain
18TOP 25
supply chainsof Gartner’s
8 RETAILTOP 10
7 FOOD & BEVERAGETOP 10
6 CPGTOP 10
91 of the
FORTUNE 500
TOP SUPPLY CHAIN SCHOOL
67%
WITH DEGREE FROMconsultants
of
*25BILLION
$
FMIC
FREIGHT SPENDCAPTURED IN
25%
CAGRsince 2009
COOLVENDORin supply chain services
Gartner201310PROS
Supply & Demand Chain Executive
TO KNOW
AMSTERDAMATLANTABANGALOREMILANMINNEAPOLISHELSINKISINGAPORESTOCKHOLMSYDNEY 9offices
GLOBAL

Confidential | © 2015 Chainalytics LLC
StrategicAlignment
PerformanceImprovement
Transformation
Descriptive & Diagnostic Analytics
Predictive & Prescriptive Analytics
IntelligenceNetworks
DecisionSupport
Technology
FACT-BASEDTRANSFORMATION
3

Confidential | © 2015 Chainalytics LLC
OURCOMPETENCIES
4
Supply Chain Design
IntegratedDemand & Supply
Planning
Sourcing& Supplier
Management
Packaging Optimization
Supply Chain Operations
Transportation ServiceSupply Chain
Applying fact-based transformation approaches using top supply chain talent.

Confidential | © 2015 Chainalytics LLC
In supply chain speak, this translates to:
� Profitable
� Individual products and bundles
� “Need it now” delivery (i.e., 0-4 hours)
� Buy multiples, keep one
� Regional sourcing
� Low cost
� Innovative and reusable packaging
� Crowd sourcing returns
� Global sourcing and accountability
� Sustainability
NEW & EMERGING CHALLENGES TO OMNICHANNEL
5
NewCompetitors
Educated Consumers
Connected, Mobile Society
Demand for Individuality

Confidential | © 2015 Chainalytics LLC
The complexity of these new challenges has put an enormous amount of pressure and emphasis on creating an effective, efficient, robust, global, and flexible supply chain to support the ominichannel
Global footprint
Adaptable sourcing and restocking
Efficient network capitalizing on low cost lanes
Optimal packaging, routing and reuse
Regional and local order processing
Integrated inventory visibility and accountability
Regional fulfillment and distribution capabilities
Multi-use, multi-channel facilities
Merged cross-docks
Global integrated providers
Multi-origin destinations
Delivery, last mile competencies
Integrated returns processing and streamlined redistribution
CREATING DYNAMIC, ADAPTABLE NETWORKS
6

Confidential | © 2015 Chainalytics LLC
IMPORTANCE OF A SUPPLY CHAIN DESIGN
7
Source: Gartner / AMR Research
Decisions
20%
Value
Operational
Tactical
Strategic
80%
Supply Chain Design and
Optimization
Advanced Planning and Scheduling
Execution
MRP/ERP
Solutions
The majority of a supply chain’s lifecycle costs are locked-in at the start.
� “Up front” decisions include:
� Inventory Levels
� Inventory Locations
� Assembly network
� Distribution network
� Raw material and packaging suppliers
� Desired raw material, WIP, and FG availability & costs
� In-house vs. contract manufacturers
� Logistics suppliers

Confidential | © 2015 Chainalytics LLC
MAIN SUPPLY CHAIN COSTS
8
� Total network costs are a balanced between the following primary costs:
Number of Warehouses
Co
sts
($
)TOTAL COSTS
Network Cost DriversINBOUND TRANSPORTATION COSTS
INVENTORY COSTS
WAREHOUSING COSTS
DELIVERY TRANSPORTATION COSTS

Confidential | © 2015 Chainalytics LLC
WHAT DRIVES THE DESIGN OF A SUPPLY CHAIN?
9
41% 42%
24%
12%
62%
34%
19% 21%
72%
50%
65%
23%
54%5%
4%
5%5% 5%
2%
6%
29%19%
9%8% 3%
9%2%
5%
14% 14% 12%16%
4% 4%
Inbound Transport Outbound Transport DC Fixed2 Inventory Costs 2 DC Variable
60%63%
72%74% 77%
85%88%
Perc
ent of Tota
l Dis
trib
ution C
osts
High Tech
Regional Retailer
Consumer Fulfillment
Lighting Manufacturer
CPG Manufacturer
National Retailer
Food & Beverage

Confidential | © 2015 Chainalytics LLC
HOW SUPPLY CHAIN COSTS CHANGESTARTING POINT: PALLET BASED DISTRIBUTION EXAMPLE
10
Transport Customer
Warehousing: Fixed
Warehousing: Variable
Inventory Carrying
Transport:Interfacility
MOVING TO CASE OR EACH PICK: COST BREAKDOWN CHANGES
Transport Customer
Warehousing: Fixed
Warehousing: Variable
Inventory Carrying
Transport:Interfacility
OVERALL COSTS INCREASE

Confidential | © 2015 Chainalytics LLC
STANDARD DISTRIBUTION GOALS
11
� Send large shipments of stuff by encouraging larger orders through pricing discounts
� Send it as close as possible to the customer
ALL to get longer shipments with more stuff on them because it is most efficient

Confidential | © 2015 Chainalytics LLC
PER UNIT COSTS: FUNCTION OF DISTANCE & WEIGHT
12
Shipment Size
Sh
ipm
en
t D
ista
nce
Average shipment size
Average shipment distance
Light Below Average Above Average Heavy
12.5
16.00
%
$
3.8
38.00
%
$
4.0
55.00
%
$
3.9
100.00
%
$
5.2
12.00
%
$
3.1
28.00
%
$
2.9
38.00
%
$
3.8
72.00
%
$
8.1
11.00
%
$
4.9
26.00
%
$
4.7
35.00
%
$
5.6
68.00
%
$
12.6
10.00
%
$
7.9
24.00
%
$
8.4
31.00
%
$
8.6
65.00
%
$
Percent of shipments% Cost per
unit to ship$
Confidential | © 2015 Chainalytics LLC
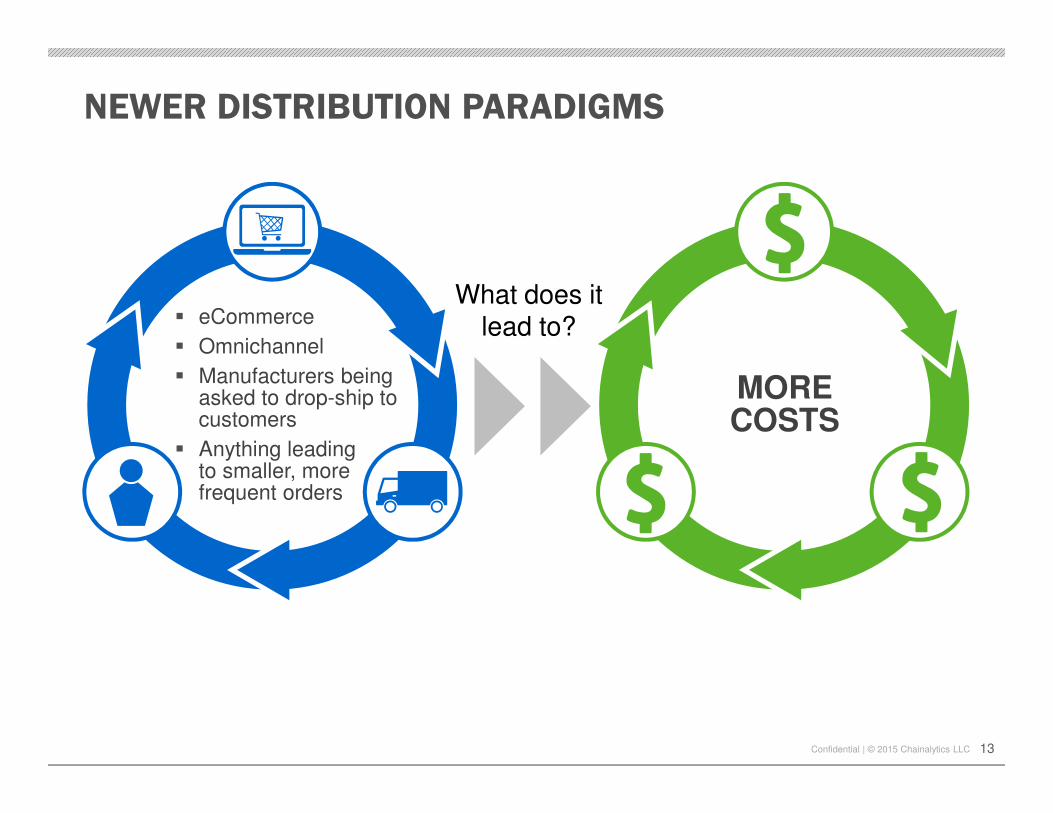
NEWER DISTRIBUTION PARADIGMS
13
� eCommerce
� Omnichannel
� Manufacturers being asked to drop-ship to customers
� Anything leading to smaller, more frequent orders
MORE COSTS
What does it lead to?

Confidential | © 2015 Chainalytics LLC
WHAT CAN YOU DO?
14
Understand the tradeoffs and how your costs changed under different supply chain scenarios
Understand your cost to serve is #1

Confidential | © 2015 Chainalytics LLC
WHAT CAN YOU DO?
15
Multiple Manufacturers Consolidate Warehousing
Multiple ManufacturersShip to Same Retailer
Collaborate

Confidential | © 2015 Chainalytics LLC 16
WHAT CAN YOU DO?Understand
IndustryMonitor Markets
Alternate Solutions
Work together

Confidential | © 2015 Chainalytics LLC
FREIGHT MARKET INTELLIGENCE CONSORTIUM
17
OUR MISSIONElevate the impact of transportation with market-focused competencies
AccelerateMinimize
time-to-insight withground-breaking tools
and technology
TransformMaximize utility of
information impacting material gains
� Launched TL model� 7 members� USA only� 700MM in annual freight data
OUR HISTORYA decade of growth
2004
� Multiple modes for shippers and 3PLs� 140+ members � Global in scope� Over $25B in annual freight data
2015
MARKET-BASED INSIGHTS
All-I
n C
PM
CommunicateProvide information
to inform organization and partners of
market dynamics
NetworkMaximize benefit
of consortium-based interactions and
knowledge

Confidential | © 2015 Chainalytics LLC
NORTH AMERICAN TRUCKLOAD (TL) MARKET
18
Annual TL Freight Market
$300BTransport TopicsTop 10 Carriers
$13B
“Large”$200MM Shipper
ChainalyticsTL Consortium
$19B
North American TL Market is huge and efficient. No buyer or seller can “set” the market.

Confidential | © 2015 Chainalytics LLC
-1.0%
0.0%
1.0%
2.0%
3.0%
4.0%
5.0%
2010 2011 2012 2013 2014 E2015 E2016 E2017
% C
ha
ng
e in
GD
PWHAT IS THE INDICATOR OF LOAD DEMAND?
19
� There is no perfect correlation to rates, but GDP growth is close
� More important is the rate of change in GDP growth
Rates tend to stay with inflation
Source: World Bank (http://data.worldbank.org) and IMF (https://www.imf.org/external/data.htm)
Rates tend to rise greater than inflation
Rates tend to fall relative to inflation

Confidential | © 2015 Chainalytics LLC
FUEL PRICE VOLATILITY
2
2.2
2.4
2.6
2.8
3
3.2
3.4
3.6
3.8
4
4.2
4.4
4.6
4.8
On
Hig
hw
ay P
rice o
f #2 D
iesel
($/g
allo
n)
� Net Impacts:� Huge decrease in FSC paid – most likely offset� Reduction in strategic advantage of fuel efficiency
20
Confidential | © 2015 Chainalytics LLC
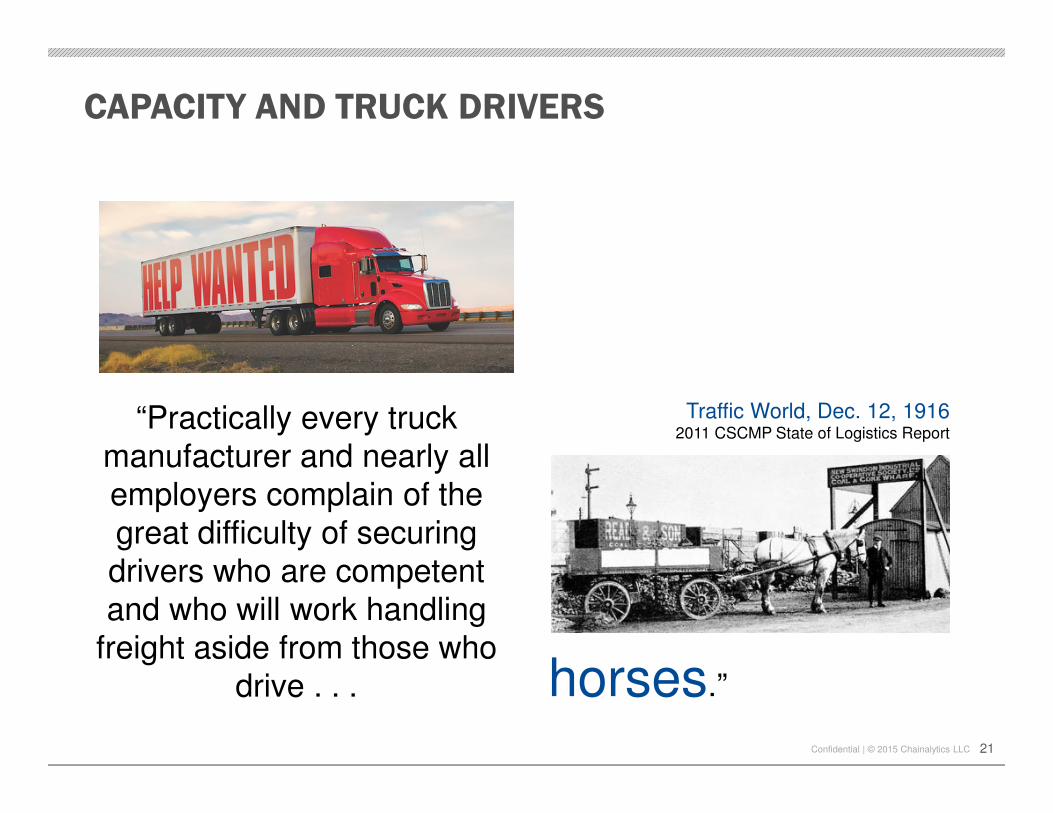
CAPACITY AND TRUCK DRIVERS
21
“Practically every truck manufacturer and nearly all employers complain of the great difficulty of securing drivers who are competent and who will work handling
freight aside from those who drive . . .
Traffic World, Dec. 12, 19162011 CSCMP State of Logistics Report
horses.”

Confidential | © 2015 Chainalytics LLC
DRY VANMARKET PERCENT TREND BY SHIPPER SIZE
22
14 Companies 29 Companies 35 Companies
Mark
et P
erc
ent In
dex
All spend categories exhibit an upward trend pattern in rates; rate increase over the two years varies between 9% to 9.4%

Confidential | © 2015 Chainalytics LLC 23
RED
Indicates greater pricing pressure in market due to increased spot market
rates for truckload capacity
GREEN
Indicates weakening pricing pressure in market due to lower spot market
rates for truckload capacity
BU
Y-S
IDE
LE
VE
RA
GE
SE
LL-S
IDE
LE
VE
RA
GE
FREIGHT DEMAND INDEX: DRY VAN

Confidential | © 2015 Chainalytics LLC
RATE FORECASTS FROM OUR MEMBERS – 2015Q4
24

Confidential | © 2015 Chainalytics LLC
CRYSTAL BALL PREDICTION
25
� Capacity has been right-sized over last few years
� Taking spillover TL freight and benefitting from omni-channel, but a bit of a pullback recently
� Rates likely up ~3% this year
� Lots of new vessels still being delivered. Capacity is outstripping demand putting downward pressure on rates
� Fedex and UPS both just announced their annual ~5% increases
� They even raised fuel surcharges….as fuel is dropping
� Those with multi-year contracts have some protections, but the trend is almost always up in an industry with little competition
LESS-THAN-TRUCKLOAD
PARCEL
OCEAN

Confidential | © 2015 Chainalytics LLC
TRUCKLOAD
CRYSTAL BALL PREDICTION
26
� Based on multiple years of freight data, truckload markets go up roughly 2-3% each year.
� 2016 looks to be more of the same ~3%
� When electronic on-board recorder mandates kick in, expect some more capacity to leave the system and put pressure on prices
� Driver shortage and demographic issues not likely to go away…at least until autonomous trucks come into play
� Current equilibrium is prone to shocks from weather (Winter 2014), regulatory changes, global economics