Embed Size (px)
Citation preview
The New Role of Drug Supply Planning in Adaptive Trials
Nitin R. Patel,
Chairman and C.T.O.
Cytel Inc.

Clinical Supply Forecasting Summit, Philadelphia, April 2009 2
Acknowledgements
My colleagues at Cytel Suresh Ankolekar
Pralay Senchaudhuri Judith Quinlan
Clinical Supply Forecasting Summit, Philadelphia, April 2009 3
Outline • How are adaptive trials different? • Adaptive Phase 2 trials • Case study of an Adaptive Ph 2a trial
– Combined trial: Proof of Concept + Dose Ranging – Advantage of Adaptive Bayesian design over 2
standard trials – Drug supply planning for Bayesian design – Drug supply planning for simpler Drop Arms
Adaptive Design • Conclusions
Clinical Supply Forecasting Summit, Philadelphia, April 2009 4
What’s different about adaptive designs?
• Standard clinical trial designs have fixed sample sizes and results are observed only after trials are complete.
• Adaptive clinical trials employ predefined processes (“adaptive by design”) to use data not available at the start of the trial to dynamically improve the statistical performance of the trial
Clinical Supply Forecasting Summit, Philadelphia, April 2009 5
Regulatory Perspective • FDA guidance document expected to be released in
a few months.
• EMEA has already released reflection paper.
• Use of adaptive designs for learning stage (Phase 1 and 2 trials) is encouraged.
• For confirmatory trials (Phase 3) need to provide sound rationale for adaptive approach and rigorous demonstration of integrity and statistical validity.
Clinical Supply Forecasting Summit, Philadelphia, April 2009 6
Common Adaptive Designs • Dynamically change randomization ratios
– to achieve balance in base-line prognostic factors
– to assign fewer subjects to doses that are too low or too high
• Drop ineffective treatment arms after interim analysis
• Stop early for futility or when efficacy has been adequately demonstrated
• Increase sample size if observed variance is larger or effect size is smaller than expected
• Combine trials e.g. Ph2b+3, Ph2 PoC+Dose finding
Clinical Supply Forecasting Summit, Philadelphia, April 2009 7
Potential Benefits of Adaptive Trials • Shorten trial duration and reduce costs
– End trials early for efficacy, futility or safety – Combine two trials into one integrated trial (eliminate
“white space”, fewer subjects required) • Improve chances of success
– Increase the sample size based on interim estimates – Change randomization ratios dynamically to increase
learning • Ethically Superior
– Fewer patients on ineffective doses, quicker identification of efficacious drugs
Clinical Supply Forecasting Summit, Philadelphia, April 2009 8
• Significant changes in the traditional process for design and implementation of clinical trials
• More up front time and effort for design, e.g. cannot use formulas to calculate sample size, computer simulation needed to find an effective design, need for software tools
• More co-ordination and detailed planning, e.g. randomization and drug supply
Gaining these benefits requires...
Clinical Supply Forecasting Summit, Philadelphia, April 2009 9
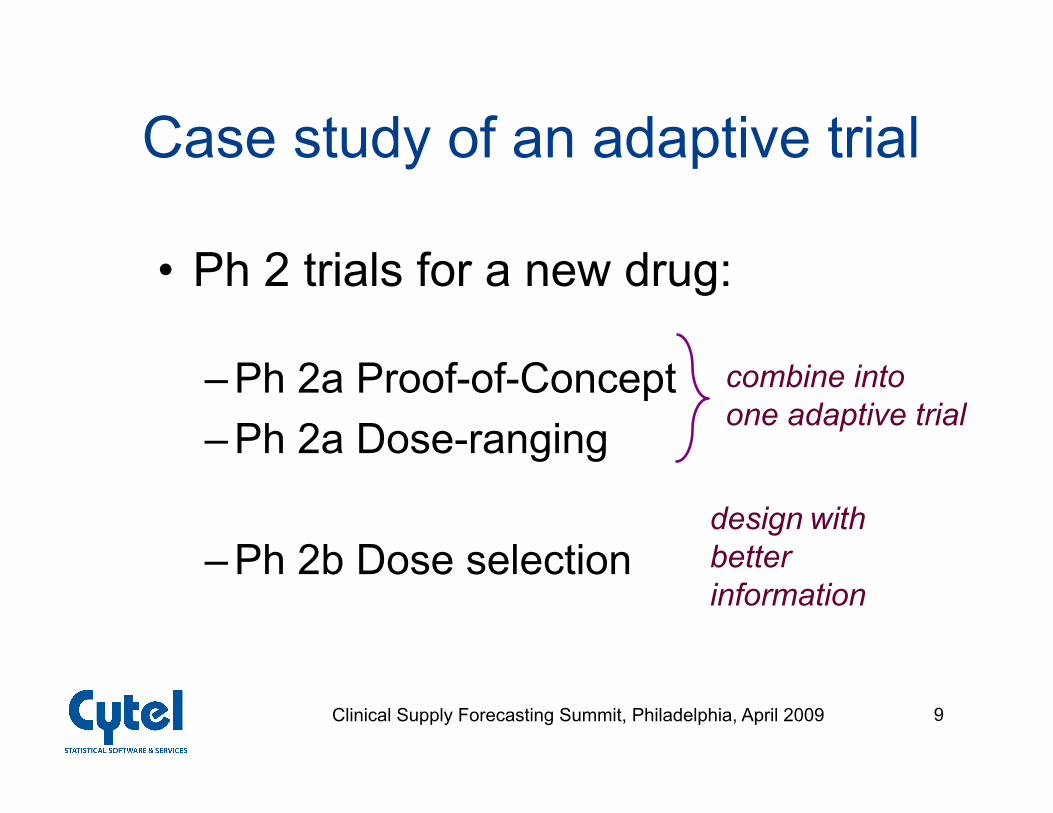
Case study of an adaptive trial
• Ph 2 trials for a new drug:
– Ph 2a Proof-of-Concept – Ph 2a Dose-ranging
– Ph 2b Dose selection
combine into one adaptive trial
design with better information
Clinical Supply Forecasting Summit, Philadelphia, April 2009 10
Standard Phase 2a Trials
• Proof of Concept trial – 2 parallel treatments (highest dose vs placebo) – Double blind, randomized equally to each
treatment.
• Dose-ranging trial – Double blind with equal randomization to each
dose and placebo – No model for dose-response
Clinical Supply Forecasting Summit, Philadelphia, April 2009 11
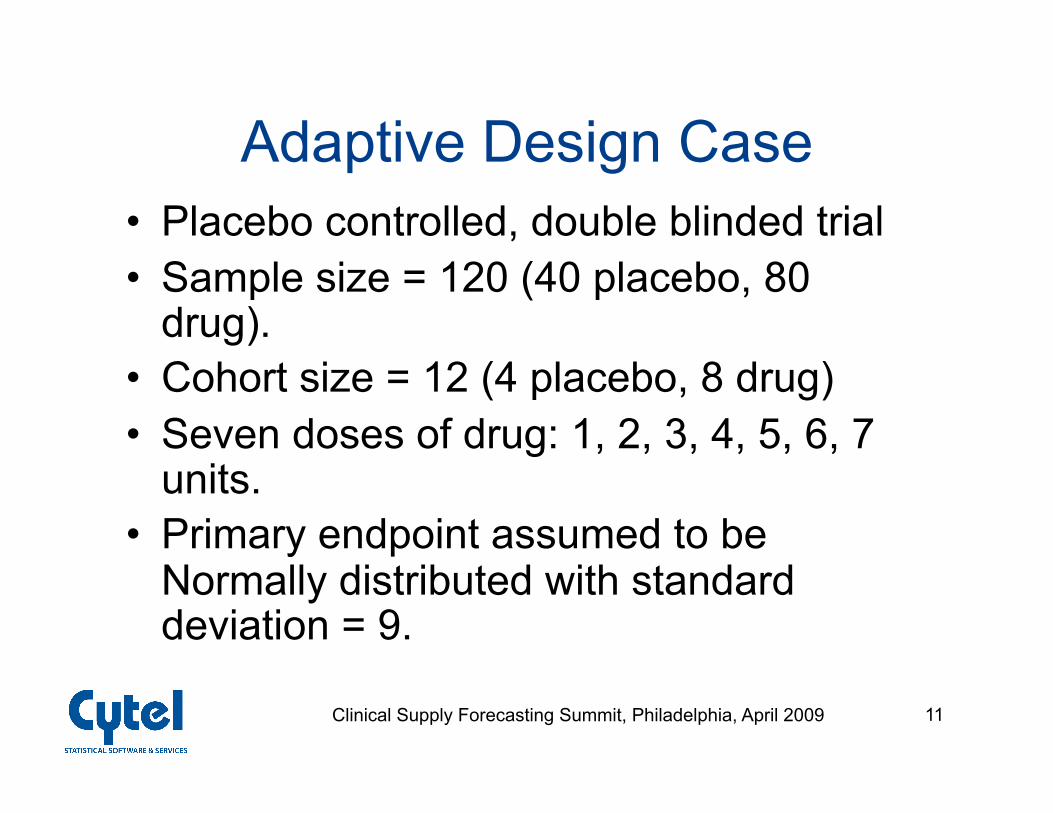
Adaptive Design Case • Placebo controlled, double blinded trial • Sample size = 120 (40 placebo, 80
drug). • Cohort size = 12 (4 placebo, 8 drug) • Seven doses of drug: 1, 2, 3, 4, 5, 6, 7
units. • Primary endpoint assumed to be
Normally distributed with standard deviation = 9.
Clinical Supply Forecasting Summit, Philadelphia, April 2009 12
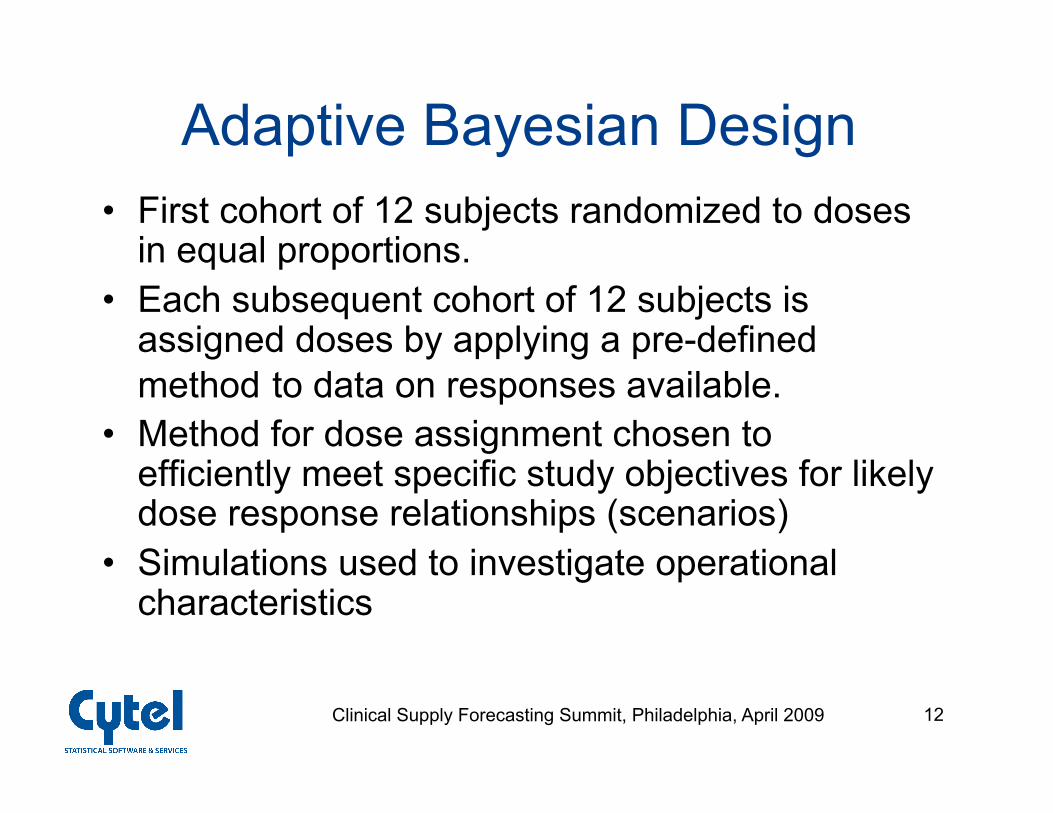
Adaptive Bayesian Design • First cohort of 12 subjects randomized to doses
in equal proportions. • Each subsequent cohort of 12 subjects is
assigned doses by applying a pre-defined method to data on responses available.
• Method for dose assignment chosen to efficiently meet specific study objectives for likely dose response relationships (scenarios)
• Simulations used to investigate operational characteristics
Clinical Supply Forecasting Summit, Philadelphia, April 2009 13
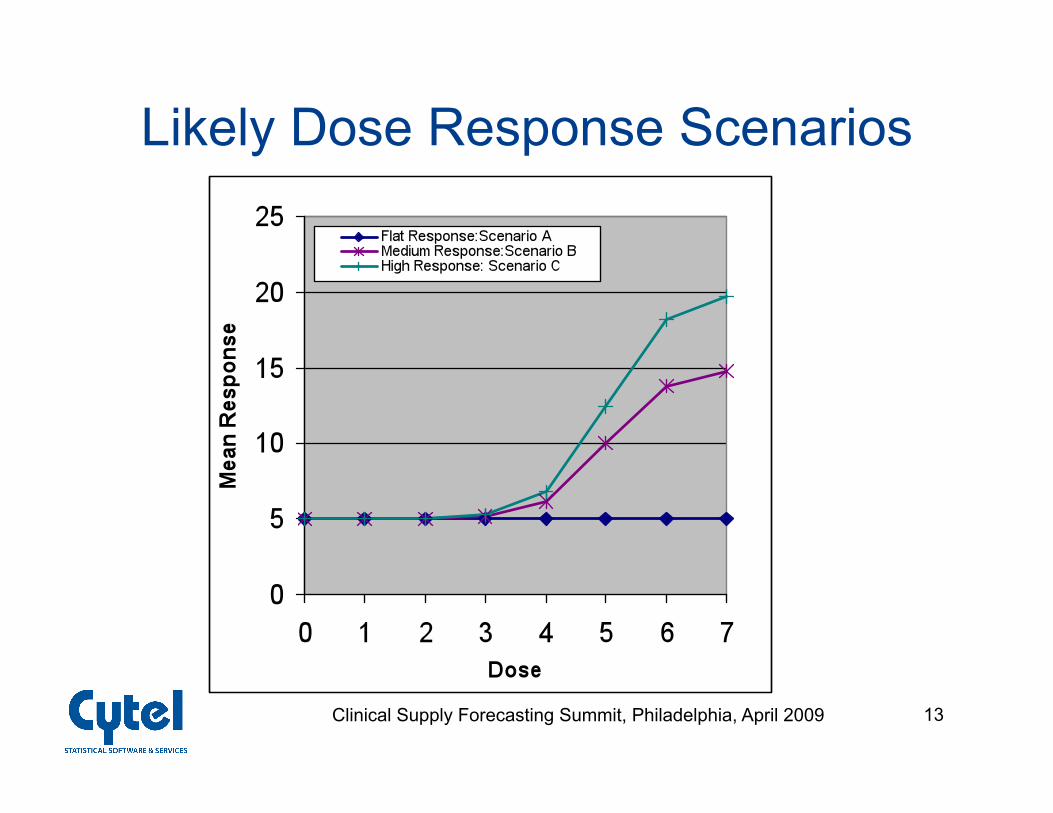
Likely Dose Response Scenarios
Clinical Supply Forecasting Summit, Philadelphia, April 2009 14
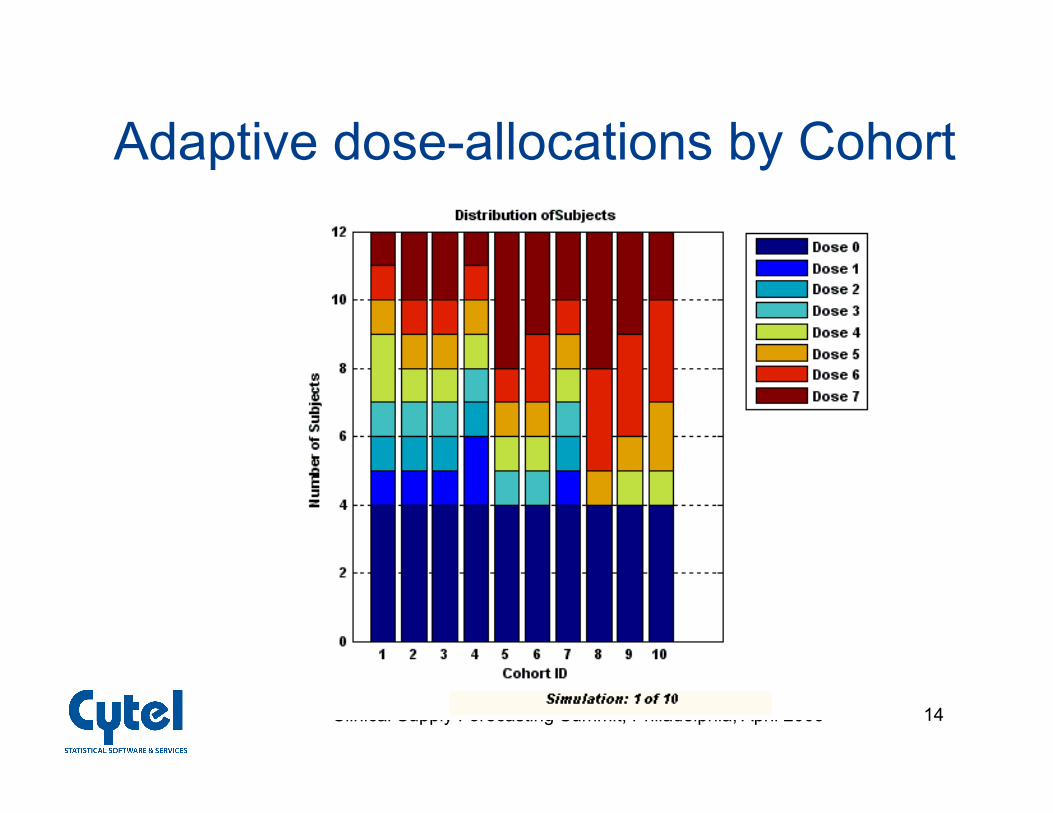
Adaptive dose-allocations by Cohort
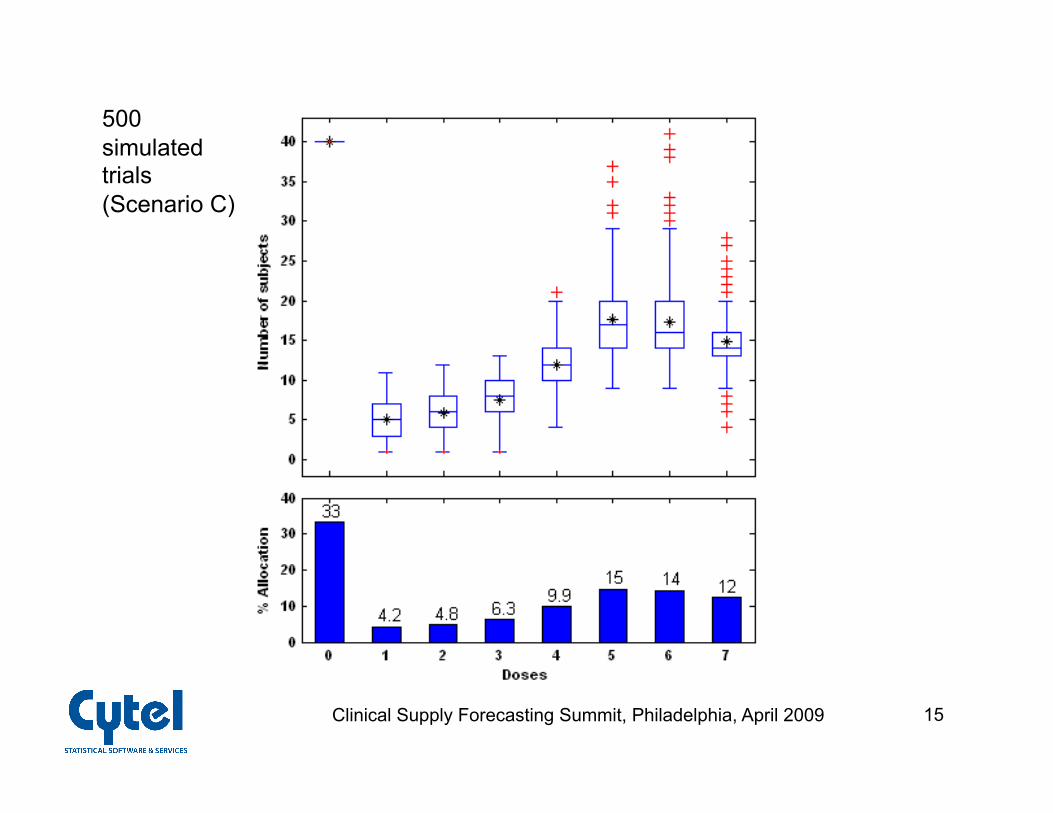
Clinical Supply Forecasting Summit, Philadelphia, April 2009 15
500 simulated trials (Scenario C)
Clinical Supply Forecasting Summit, Philadelphia, April 2009 16
Criteria for Comparing Adaptive to Standard designs
• Proof-of-Concept: Power
• Dose-ranging: Efficiency in response estimation at each dose (using mean squared error metric)
Clinical Supply Forecasting Summit, Philadelphia, April 2009 17
Scenario C • Proof-of-Concept
– Power of standard design = 0.99 – Power of adaptive design > 0.99
• Response Estimation – Adaptive Bayesian Design is more efficient by more
than a factor of 2 compared to standard design for all doses
(1000 simulations used for calculations)
Clinical Supply Forecasting Summit, Philadelphia, April 2009 18
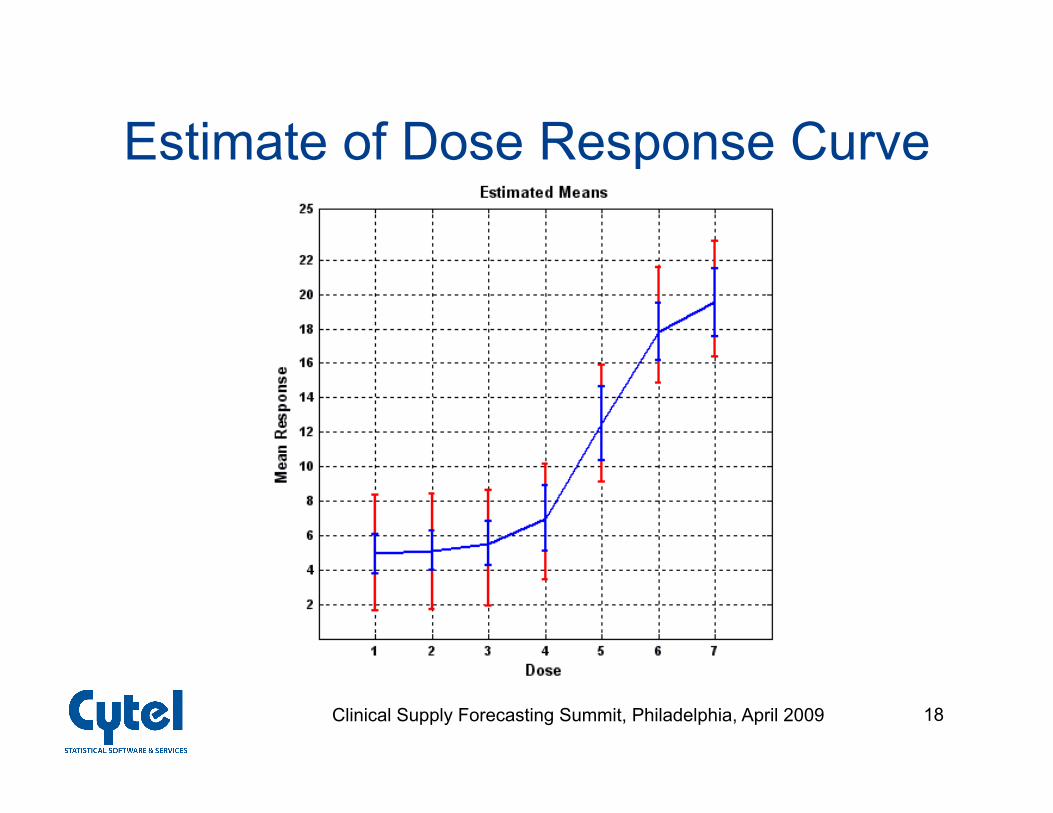
Estimate of Dose Response Curve
Clinical Supply Forecasting Summit, Philadelphia, April 2009 19
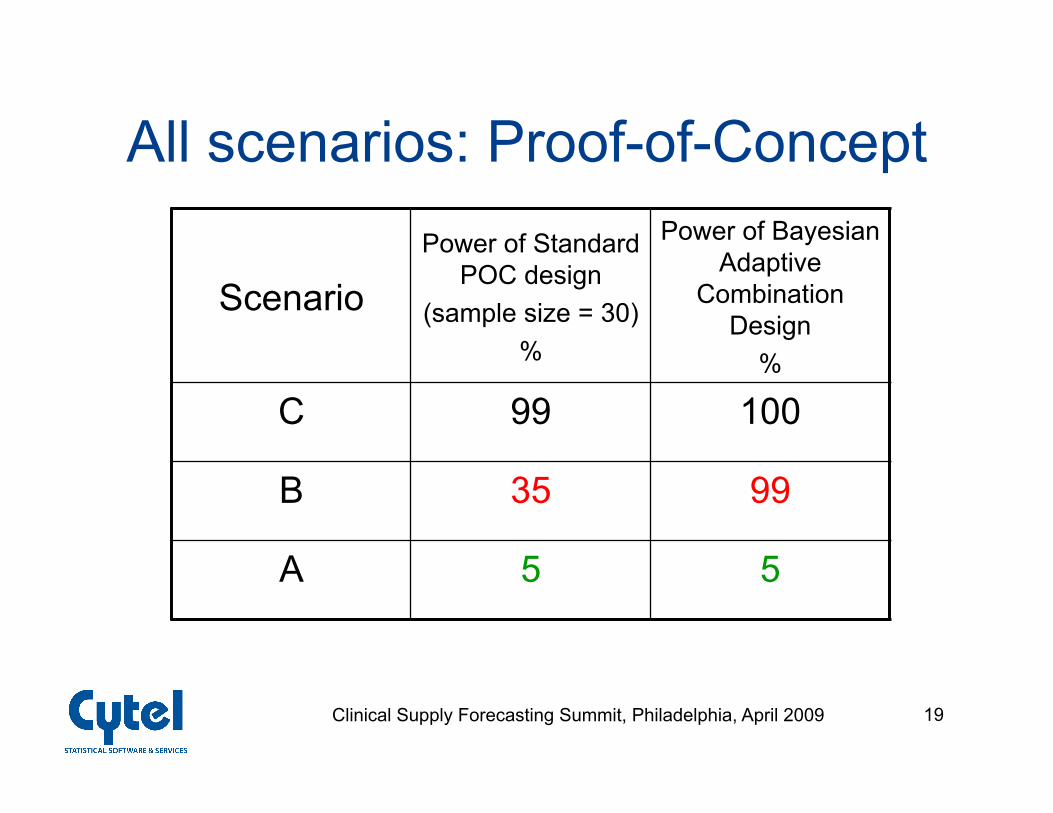
All scenarios: Proof-of-Concept
Scenario Power of Standard
POC design (sample size = 30)
%
Power of Bayesian Adaptive
Combination Design
%
C 99 100
B 35 99
A 5 5
Clinical Supply Forecasting Summit, Philadelphia, April 2009 20
All scenarios: Dose Response Estimation
Adaptive design is twice as efficient as the standard design in dose response estimation
at each dose for Scenarios B and C
(Dose response is irrelevant for Scenario A)
(1000 simulations used for calculations)
Clinical Supply Forecasting Summit, Philadelphia, April 2009 21
Implementation of Adaptive Design
• On-call person (unblinded statistician) to generate doses to be assigned dynamically
• Rapid transfer of needed data (email, IVRS).
• Both functions could be automated • Drug supply is challenging because of
dynamically changing randomization ratios
Clinical Supply Forecasting Summit, Philadelphia, April 2009 22
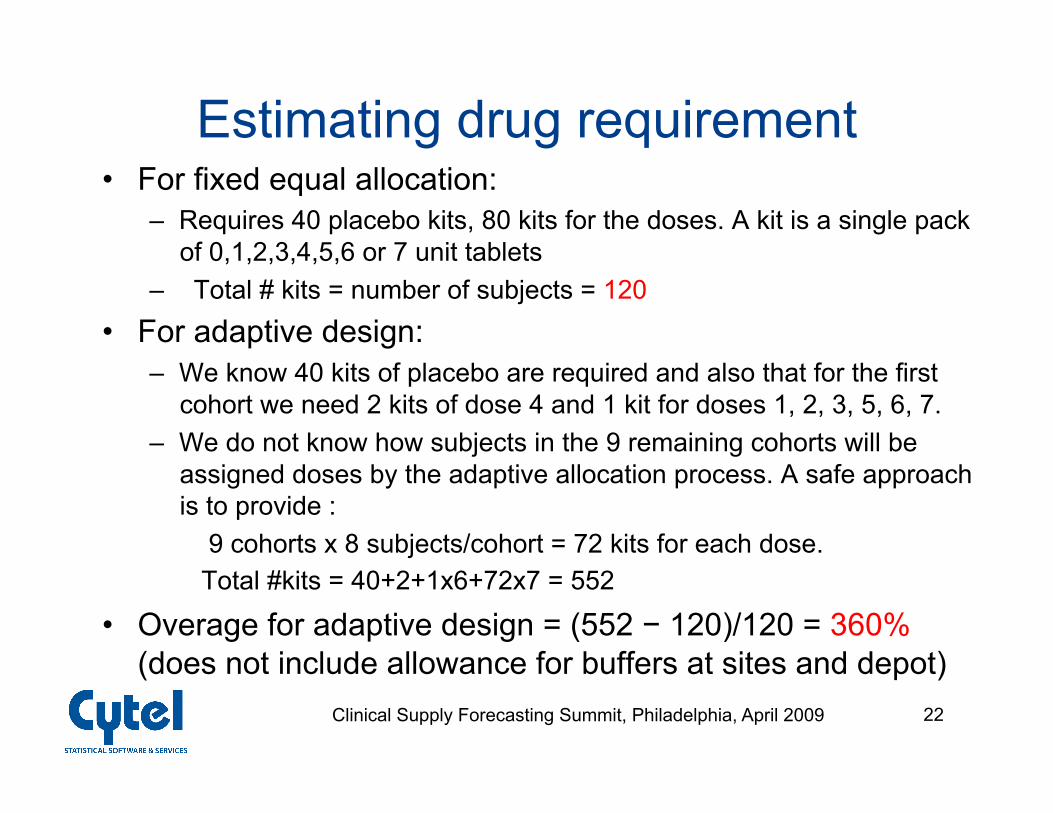
Estimating drug requirement • For fixed equal allocation:
– Requires 40 placebo kits, 80 kits for the doses. A kit is a single pack of 0,1,2,3,4,5,6 or 7 unit tablets
– Total # kits = number of subjects = 120 • For adaptive design:
– We know 40 kits of placebo are required and also that for the first cohort we need 2 kits of dose 4 and 1 kit for doses 1, 2, 3, 5, 6, 7.
– We do not know how subjects in the 9 remaining cohorts will be assigned doses by the adaptive allocation process. A safe approach is to provide :
9 cohorts x 8 subjects/cohort = 72 kits for each dose. Total #kits = 40+2+1x6+72x7 = 552
• Overage for adaptive design = (552 − 120)/120 = 360% (does not include allowance for buffers at sites and depot)
Clinical Supply Forecasting Summit, Philadelphia, April 2009 23
Modeling drug requirement • The safe approach is very conservative. It seems very
unlikely that the adaptive allocation will assign all subjects in cohorts 2 to 10 to a single dose
• If we consider specifics of the adaptive design and likely scenarios considered in the design we can strike a better balance between risk of randomization failure (risk of stock-out) and overage.
Clinical Supply Forecasting Summit, Philadelphia, April 2009 24
Combining design simulation with drug supply simulation
• The statistical design simulation tool was extended to simulate the drug supply chain to enable optimization of drug supply for the set of likely scenarios.
• Supply chain inputs that describe subject accrual rates at centers, drug requirements of the treatments and supply chain parameters were used to simulate – stocking and replenishment process at depots and
centers (floor/ceiling system for replenishment). – enrolment randomness over time at each site
• Five hundred simulations were generated for each scenario
Clinical Supply Forecasting Summit, Philadelphia, April 2009 25
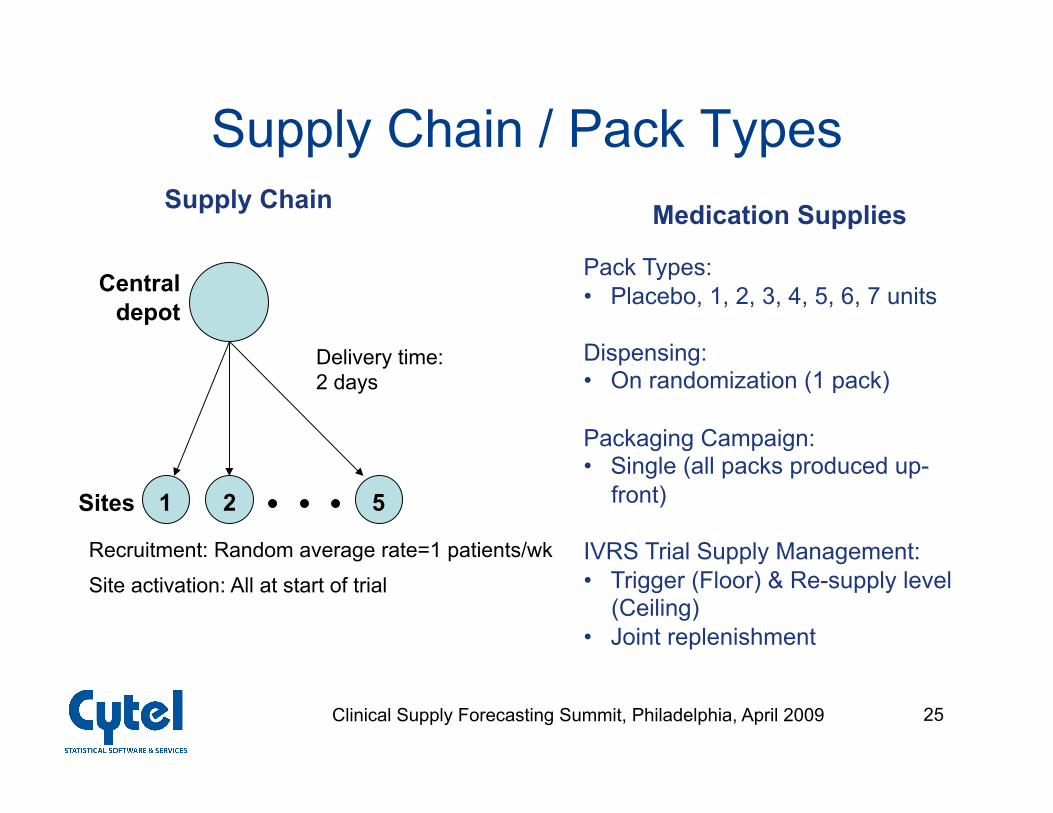
Supply Chain / Pack Types
Sites
Supply Chain
Central depot
1 2 5
Recruitment: Random average rate=1 patients/wk
Site activation: All at start of trial
Delivery time: 2 days
Medication Supplies
Pack Types: • Placebo, 1, 2, 3, 4, 5, 6, 7 units
Dispensing: • On randomization (1 pack)
Packaging Campaign: • Single (all packs produced up-
front)
IVRS Trial Supply Management: • Trigger (Floor) & Re-supply level
(Ceiling) • Joint replenishment
Clinical Supply Forecasting Summit, Philadelphia, April 2009 26
Inventory Control • The ‘trigger/resupply’ or ‘floor/ceiling’ system of inventory
control with joint replenishment is very commonly used with IVRS at centers and depots.
• The system works as follows: • Initially a specific amount of stock is sent to each site. • Each day the IVRS compares the inventory position ( = stock on
hand + on order – back-orders) for each type of pack at each center with the trigger (or floor) level.
• If the inventory position is greater no order is placed. • If it is equal or lower, an order is placed for the pack type. The
size of the order is the difference between the resupply level (or ceiling) and the inventory position for that pack type. In addition, for all other packs an order is placed for an amount equal to the difference between ceiling and the inventory position.
Clinical Supply Forecasting Summit, Philadelphia, April 2009 27
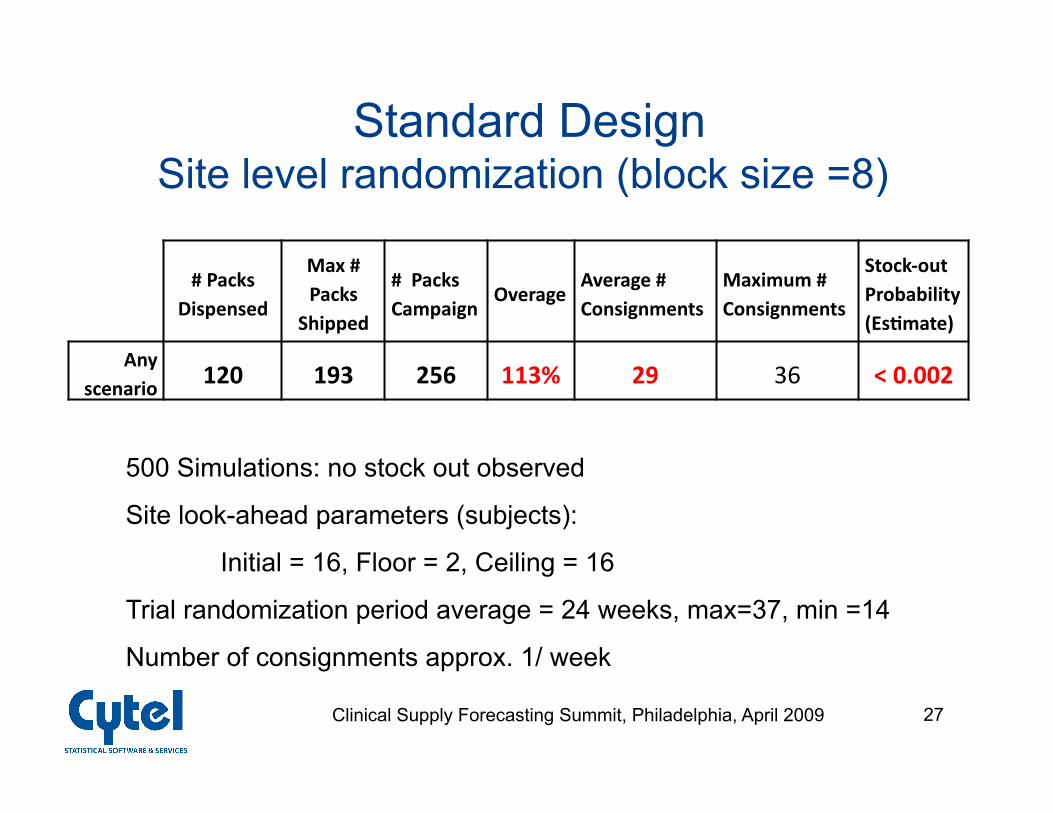
Standard Design Site level randomization (block size =8)
#PacksDispensed
Max#Packs
Shipped
#PacksCampaign
OverageAverage#Consignments
Maximum#Consignments
Stock‐outProbability(EsBmate)
Anyscenario 120 193 256 113% 29 36 <0.002
500 Simulations: no stock out observed
Site look-ahead parameters (subjects):
Initial = 16, Floor = 2, Ceiling = 16
Trial randomization period average = 24 weeks, max=37, min =14
Number of consignments approx. 1/ week
Clinical Supply Forecasting Summit, Philadelphia, April 2009 28
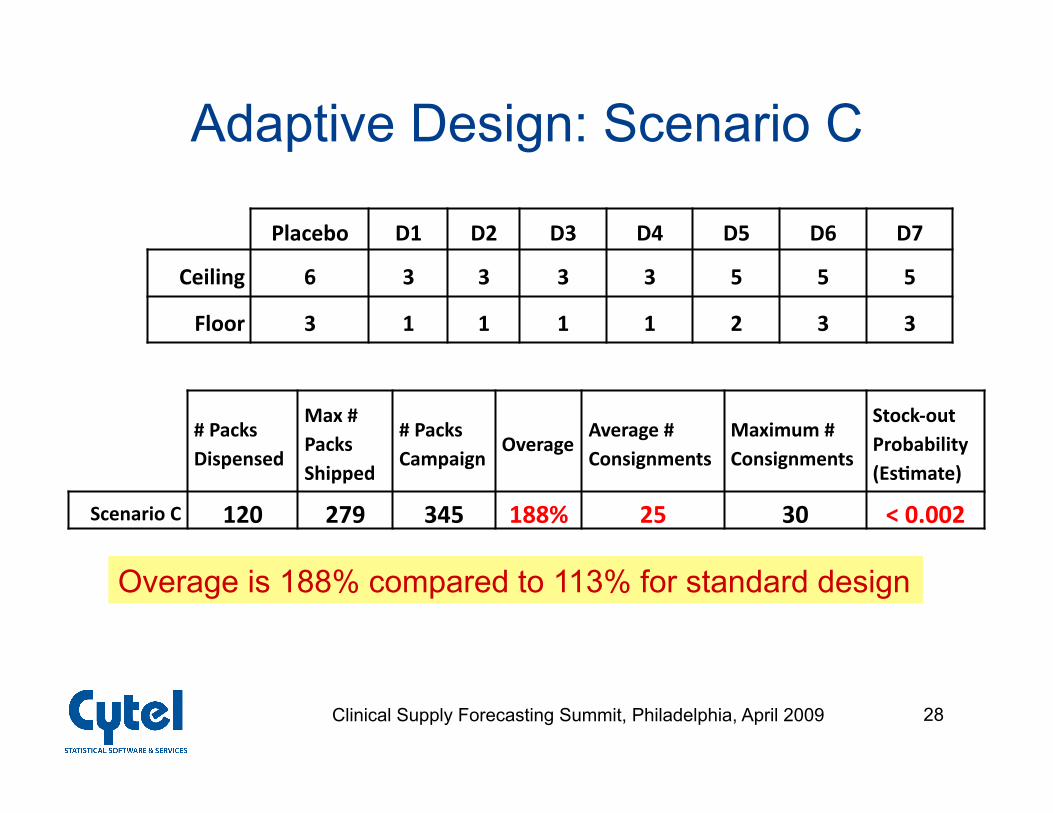
Adaptive Design: Scenario C
Placebo D1 D2 D3 D4 D5 D6 D7
Ceiling 6 3 3 3 3 5 5 5
Floor 3 1 1 1 1 2 3 3
#PacksDispensed
Max#PacksShipped
#PacksCampaign
OverageAverage#Consignments
Maximum#Consignments
Stock‐outProbability(EsBmate)
ScenarioC 120 279 345 188% 25 30 <0.002
Overage is 188% compared to 113% for standard design
Clinical Supply Forecasting Summit, Philadelphia, April 2009 29
Combining Scenarios
• Method 1: – Use supply strategy that works no matter
which scenario is the true scenario • Method 2:
– Bayesian approach to combine scenarios using prior probability of each scenario
• We will use Method 1 (more conservative)
Clinical Supply Forecasting Summit, Philadelphia, April 2009 30
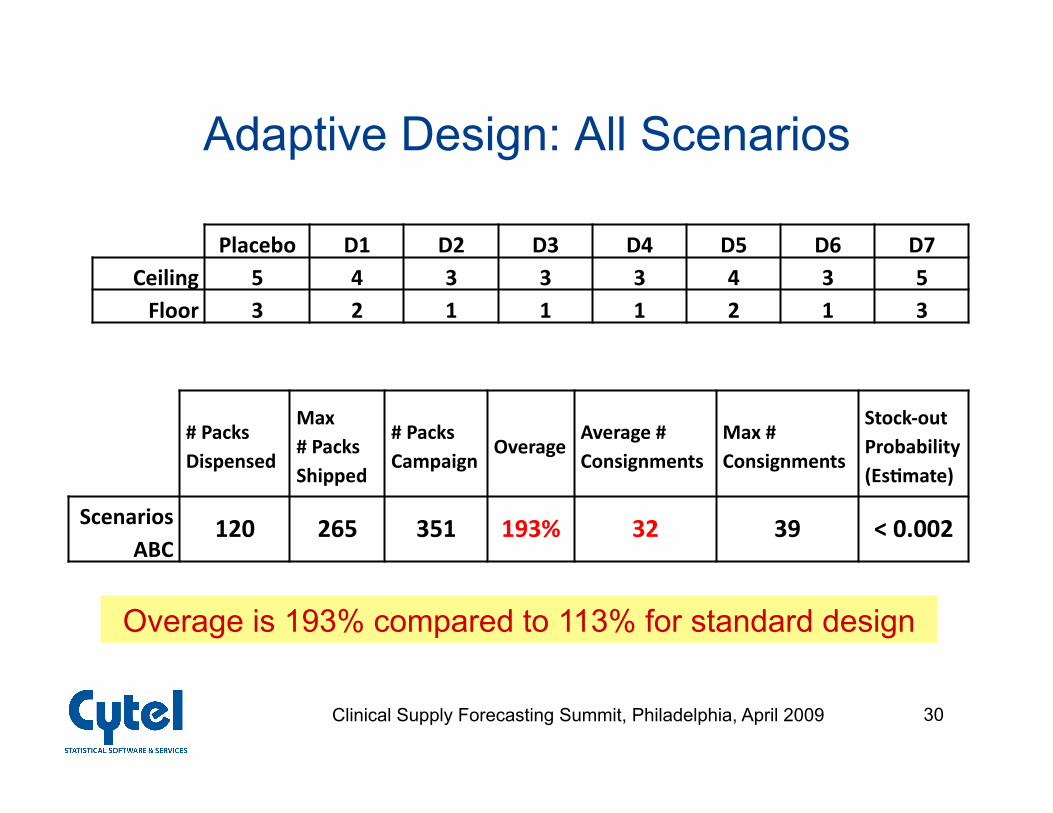
Adaptive Design: All Scenarios
Placebo D1 D2 D3 D4 D5 D6 D7Ceiling 5 4 3 3 3 4 3 5Floor 3 2 1 1 1 2 1 3
#PacksDispensed
Max#PacksShipped
#PacksCampaign
OverageAverage#Consignments
Max#Consignments
Stock‐outProbability(EsBmate)
ScenariosABC
120 265 351 193% 32 39 <0.002
Overage is 193% compared to 113% for standard design
Clinical Supply Forecasting Summit, Philadelphia, April 2009 31
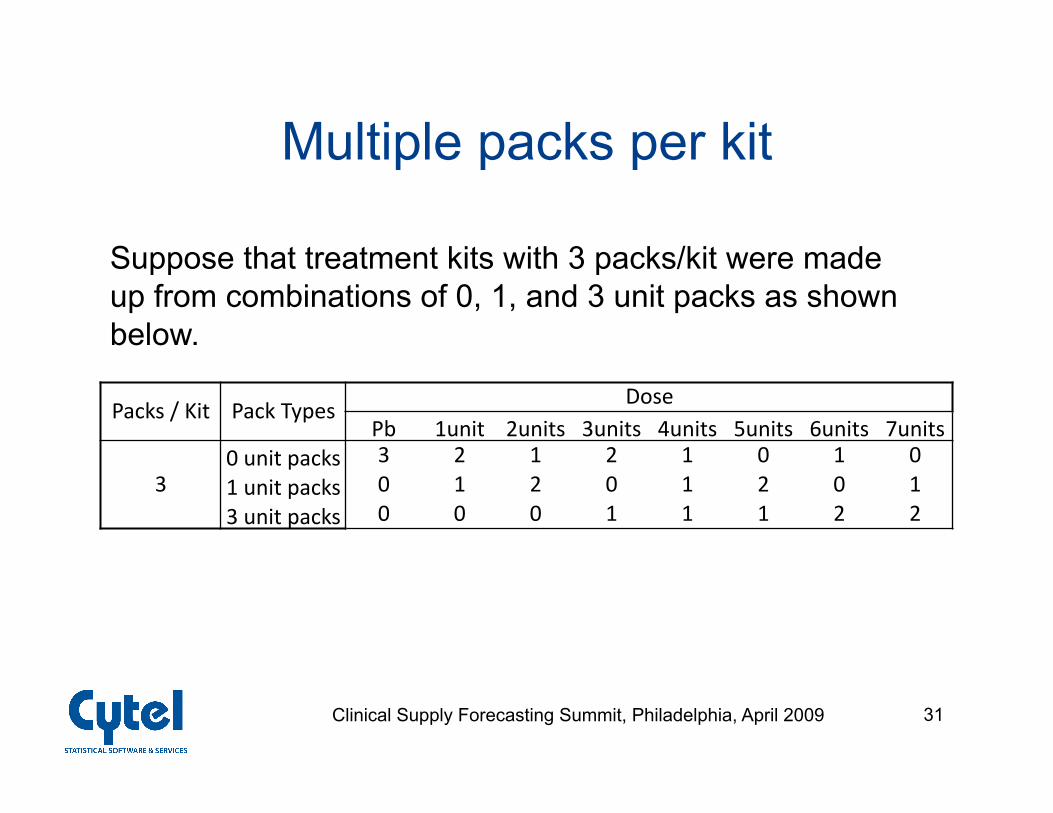
Multiple packs per kit
Packs/Kit PackTypesDose
Pb 1unit 2units 3units 4units 5units 6units 7units
30unitpacks 3 2 1 2 1 0 1 01unitpacks 0 1 2 0 1 2 0 13unitpacks 0 0 0 1 1 1 2 2
Suppose that treatment kits with 3 packs/kit were made up from combinations of 0, 1, and 3 unit packs as shown below.
Clinical Supply Forecasting Summit, Philadelphia, April 2009 32
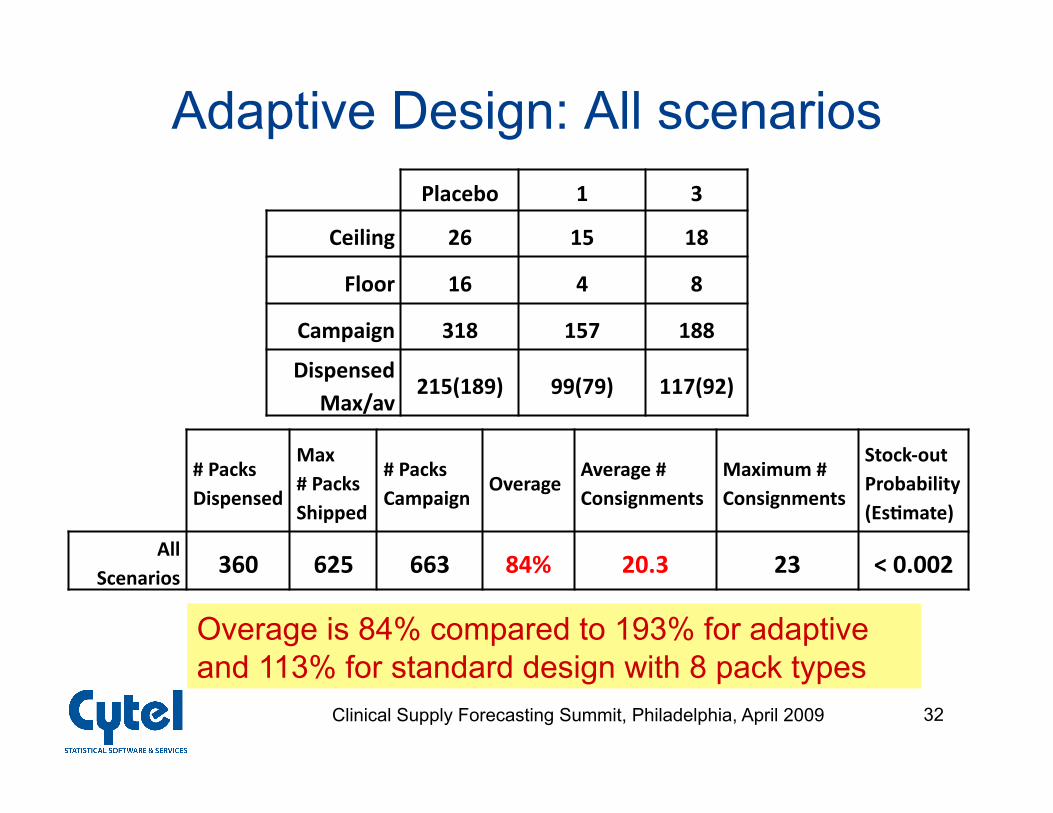
Adaptive Design: All scenarios
Placebo 1 3
Ceiling 26 15 18
Floor 16 4 8
Campaign 318 157 188
DispensedMax/av
215(189) 99(79) 117(92)
#PacksDispensed
Max#PacksShipped
#PacksCampaign
OverageAverage#Consignments
Maximum#Consignments
Stock‐outProbability(EsBmate)
AllScenarios 360 625 663 84% 20.3 23 <0.002
Overage is 84% compared to 193% for adaptive and 113% for standard design with 8 pack types
Clinical Supply Forecasting Summit, Philadelphia, April 2009 33
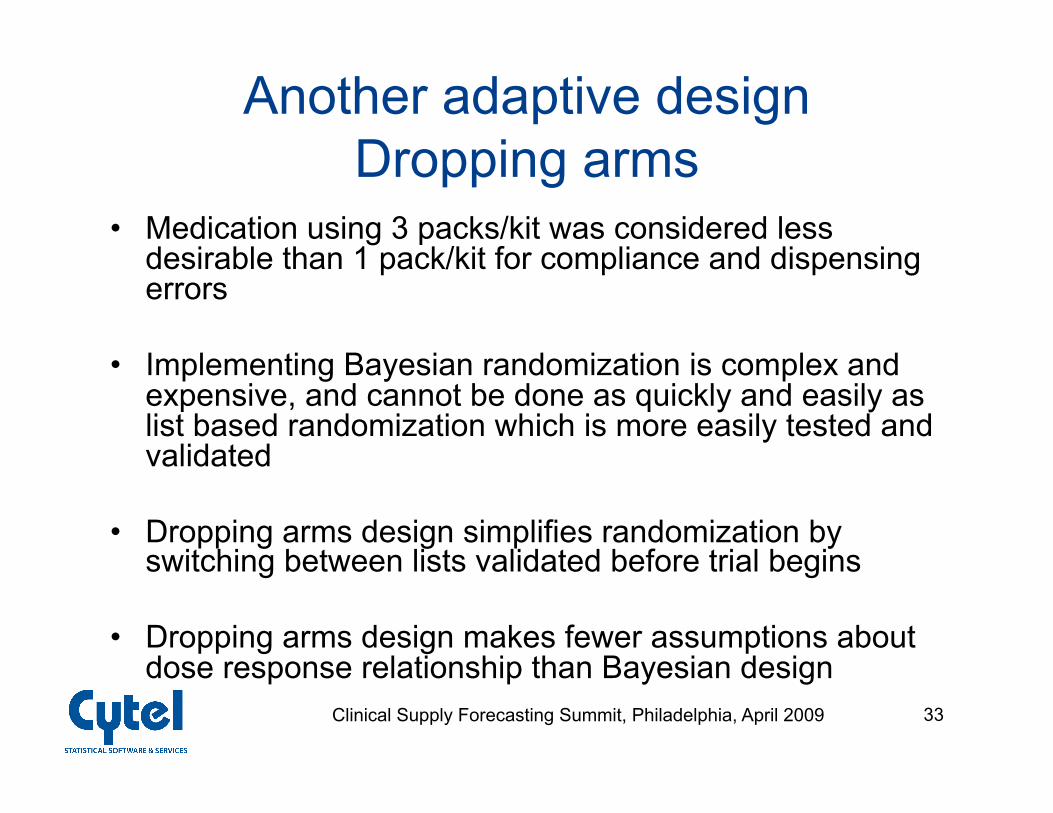
Another adaptive design Dropping arms
• Medication using 3 packs/kit was considered less desirable than 1 pack/kit for compliance and dispensing errors
• Implementing Bayesian randomization is complex and expensive, and cannot be done as quickly and easily as list based randomization which is more easily tested and validated
• Dropping arms design simplifies randomization by switching between lists validated before trial begins
• Dropping arms design makes fewer assumptions about dose response relationship than Bayesian design
Clinical Supply Forecasting Summit, Philadelphia, April 2009 34
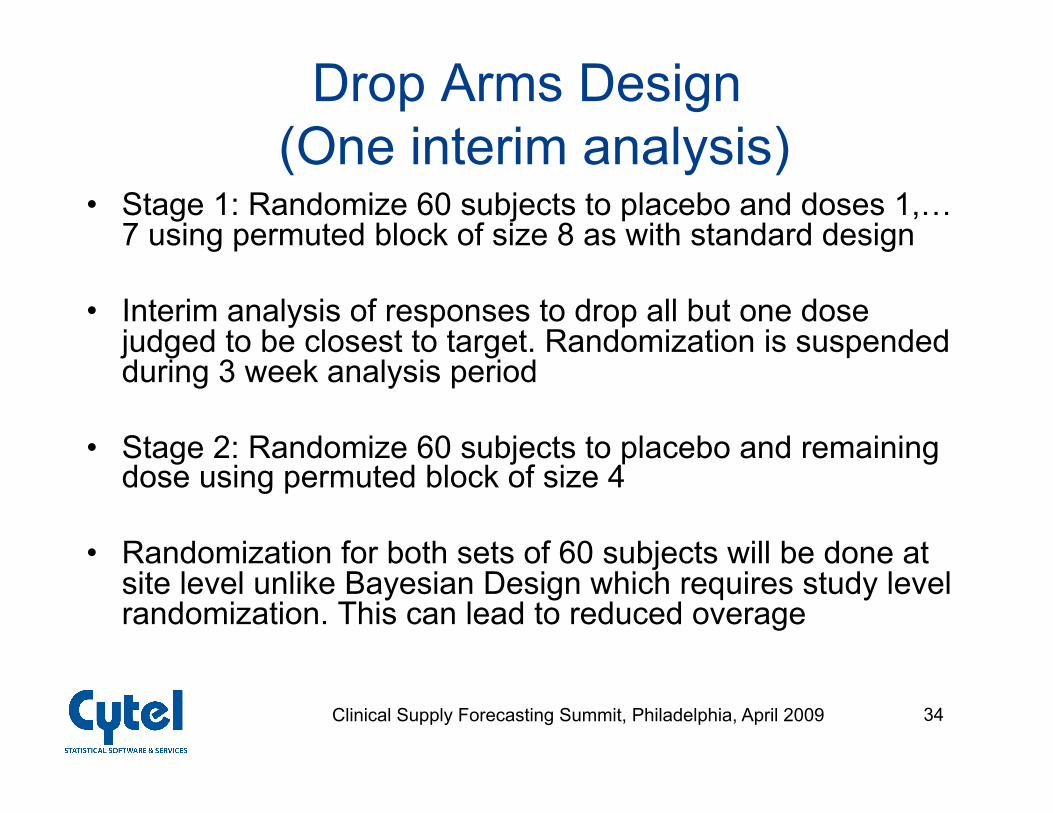
Drop Arms Design (One interim analysis)
• Stage 1: Randomize 60 subjects to placebo and doses 1,…7 using permuted block of size 8 as with standard design
• Interim analysis of responses to drop all but one dose judged to be closest to target. Randomization is suspended during 3 week analysis period
• Stage 2: Randomize 60 subjects to placebo and remaining dose using permuted block of size 4
• Randomization for both sets of 60 subjects will be done at site level unlike Bayesian Design which requires study level randomization. This can lead to reduced overage
Clinical Supply Forecasting Summit, Philadelphia, April 2009 35
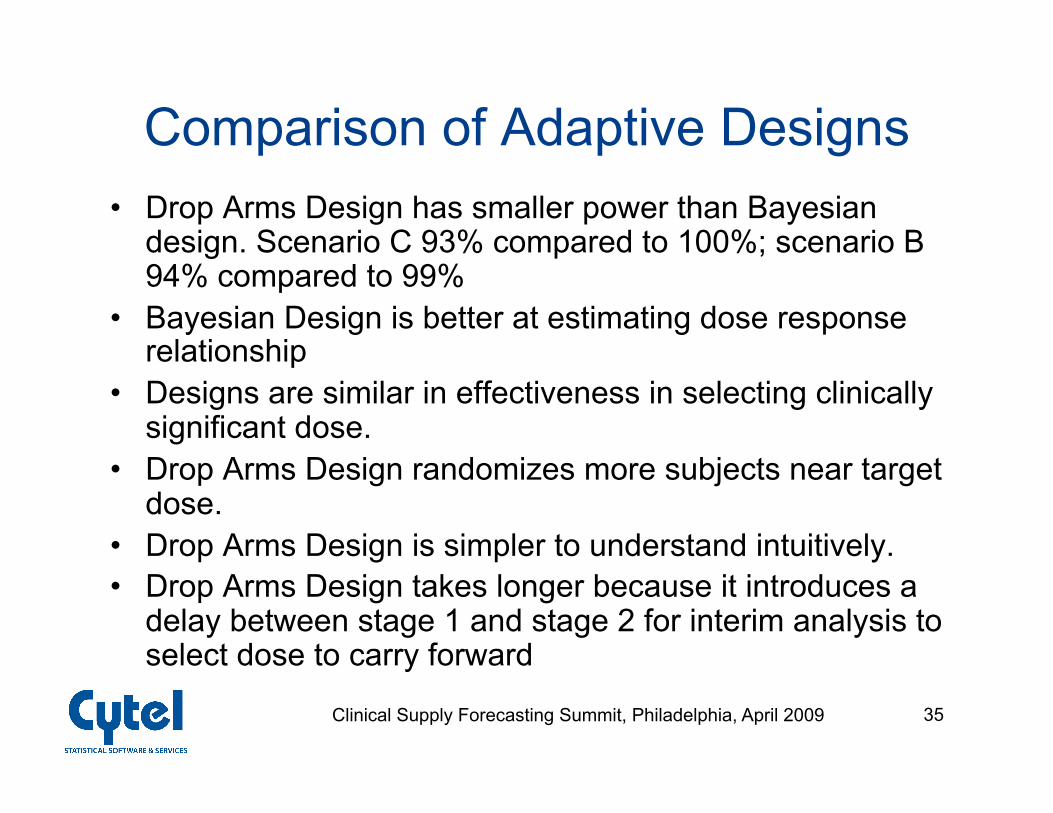
Comparison of Adaptive Designs • Drop Arms Design has smaller power than Bayesian
design. Scenario C 93% compared to 100%; scenario B 94% compared to 99%
• Bayesian Design is better at estimating dose response relationship
• Designs are similar in effectiveness in selecting clinically significant dose.
• Drop Arms Design randomizes more subjects near target dose.
• Drop Arms Design is simpler to understand intuitively. • Drop Arms Design takes longer because it introduces a
delay between stage 1 and stage 2 for interim analysis to select dose to carry forward
Clinical Supply Forecasting Summit, Philadelphia, April 2009 36
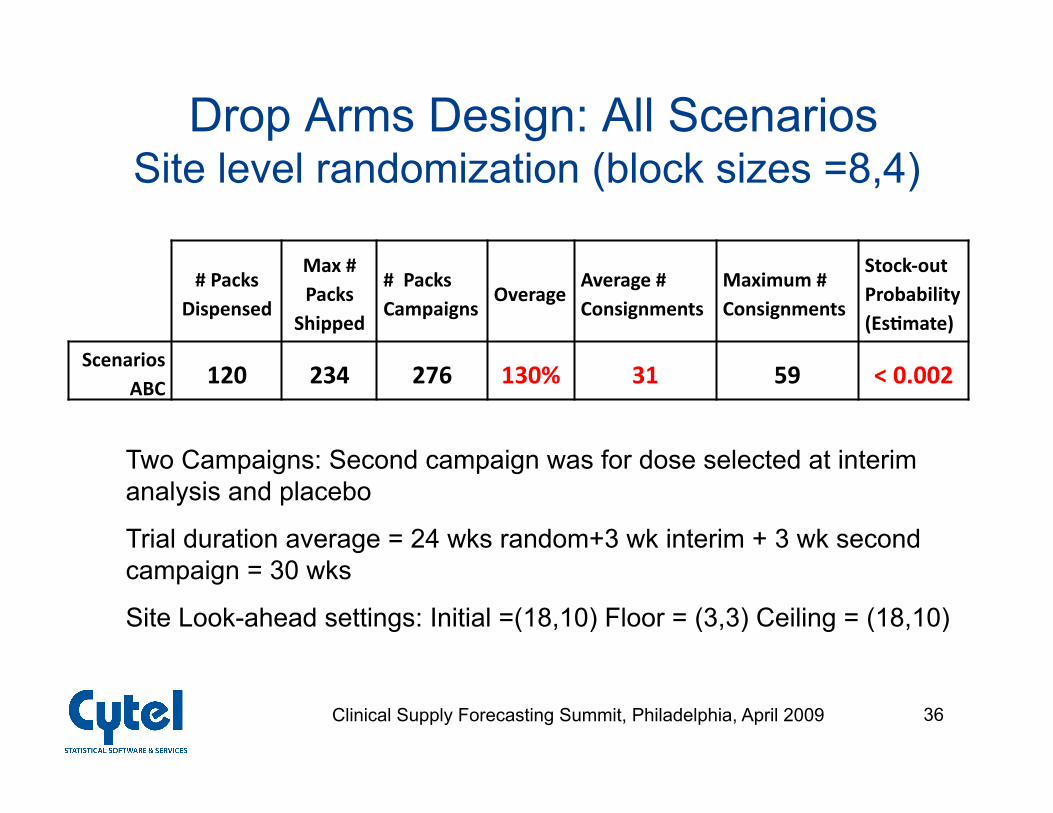
Drop Arms Design: All Scenarios Site level randomization (block sizes =8,4)
#PacksDispensed
Max#Packs
Shipped
#PacksCampaigns
OverageAverage#Consignments
Maximum#Consignments
Stock‐outProbability(EsBmate)
ScenariosABC 120 234 276 130% 31 59 <0.002
Two Campaigns: Second campaign was for dose selected at interim analysis and placebo
Trial duration average = 24 wks random+3 wk interim + 3 wk second campaign = 30 wks
Site Look-ahead settings: Initial =(18,10) Floor = (3,3) Ceiling = (18,10)
Clinical Supply Forecasting Summit, Philadelphia, April 2009 37
And the winner is… • Standard design was ruled out due to poor
statistical performance. • Adaptive Bayesian design gave the best
statistical performance but had acceptable overage only with 3 packs/treatment and was complex to implement
• Adaptive Drop Arms design was chosen – statistical performance substantially better than
standard design – simple to implement – lower overage than the Bayesian design – moderate increase in overage compared to standard
design
Clinical Supply Forecasting Summit, Philadelphia, April 2009 38
Conclusions • Simple approaches to planning drug supply for adaptive
trials can lead to large overages for multicenter trials
• Software tools that combine simulation of adaptive designs with simulation of the drug supply system can substantially reduce overage
• Drug supply planning for adaptive trials needs to be closely coordinated with statistical design to strike the best balance between statistical efficiency and drug supply feasibility.
Clinical Supply Forecasting Summit, Philadelphia, April 2009 39 Adap>veClinicalTrials:Schering‐PloughSeminar2,13thNov08 39
Implementing adaptive designs is not a relay race…
For adaptive trials, design and implementation are critically interdependent

Clinical Supply Forecasting Summit, Philadelphia, April 2009 40
…it’s a game of basketball