Embed Size (px)
Citation preview
The new Sunspot NumberA full recalibration
Frédéric CletteWorld Data Center SILSO, Royal Observatory of Belgium
L. Svalgaard Stanford UniversityJ.M. Vaquero Universidad de ExtremaduraE.W. Cliver National Solar Observatory, Sunspot
ROB STCE
11th European Space Weather Week, Liège 2
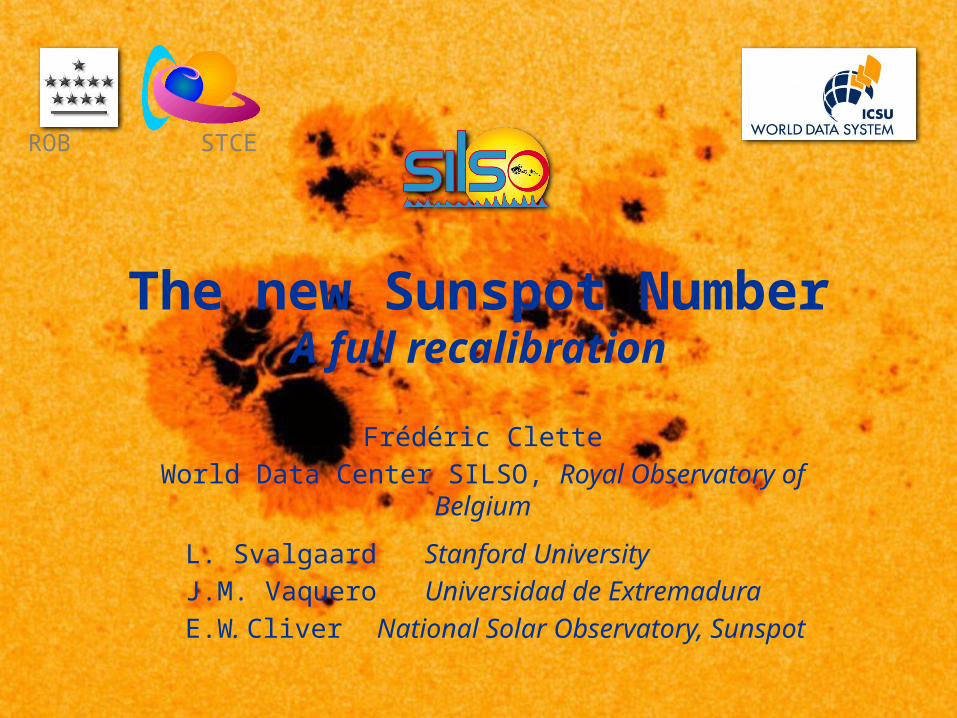
Sunspot Number: definition
• Wolf Number (Wolf 1851): W= 10 Ng +
Ns • ≠ Sunspot number:
– Multiple stations– Statistical k personal
scaling factors
18/11/2014
Wide range of applications:
• Constraint for solar dynamo models
• Quantitative reference for solar irradiance and solar wind reconstructions, cosmogenic isotopes, as timebase for Sun-driven processes
• Tracer of the long-term solar influences on Earth (climate change, atmospheric drag, cumulative GIC effects).
Fröhlich & Lean 2004
11th European Space Weather Week, Liège 3
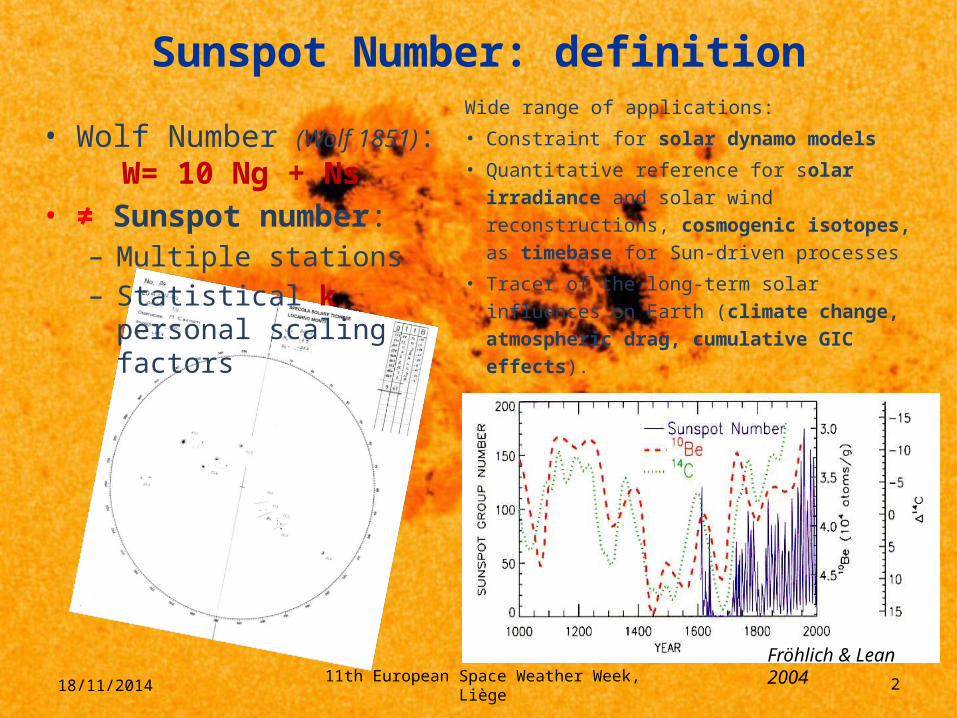
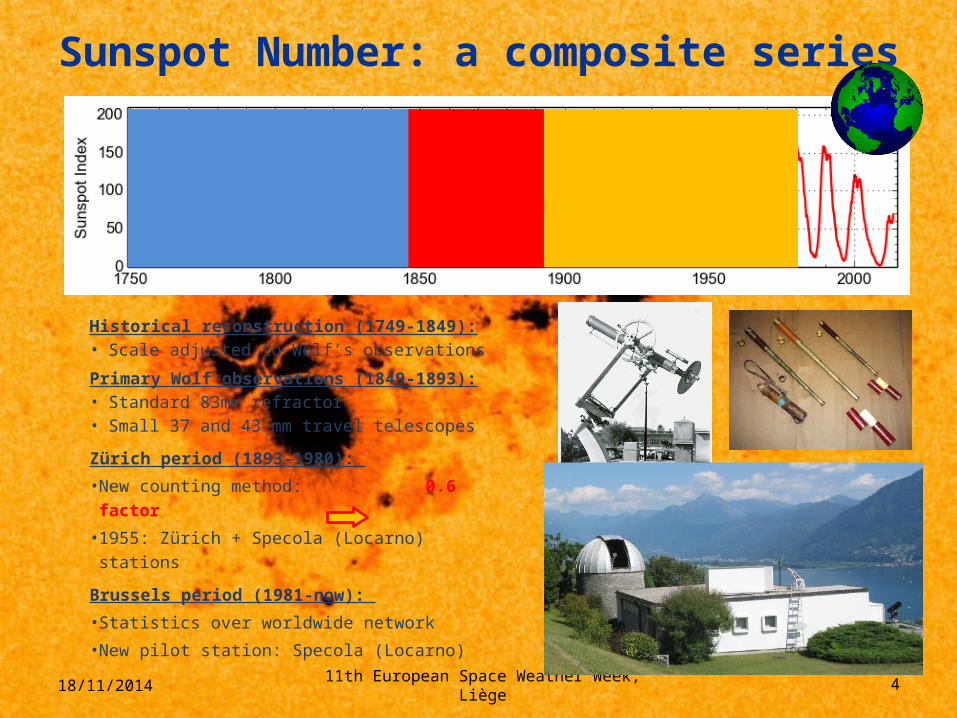
Sunspot Number: a composite series
Historical reconstruction (1749-1849): • Scale adjusted to Wolf’s observations
Primary Wolf observations (1849-1893): • Standard 83mm refractor• Small 37 and 43 mm travel telescopes
Zürich period (1893-1980):
• New counting method: 0.6 factor
• 1955: Zürich + Specola (Locarno) stations
18/11/2014
11th European Space Weather Week, Liège 4
Sunspot Number: a composite series
Historical reconstruction (1749-1849): • Scale adjusted to Wolf’s observations
Primary Wolf observations (1849-1893): • Standard 83mm refractor• Small 37 and 43 mm travel telescopes
Zürich period (1893-1980):
• New counting method: 0.6 factor
• 1955: Zürich + Specola (Locarno) stations
Brussels period (1981-now):
• Statistics over worldwide network
• New pilot station: Specola (Locarno)18/11/2014
11th European Space Weather Week, Liège 5
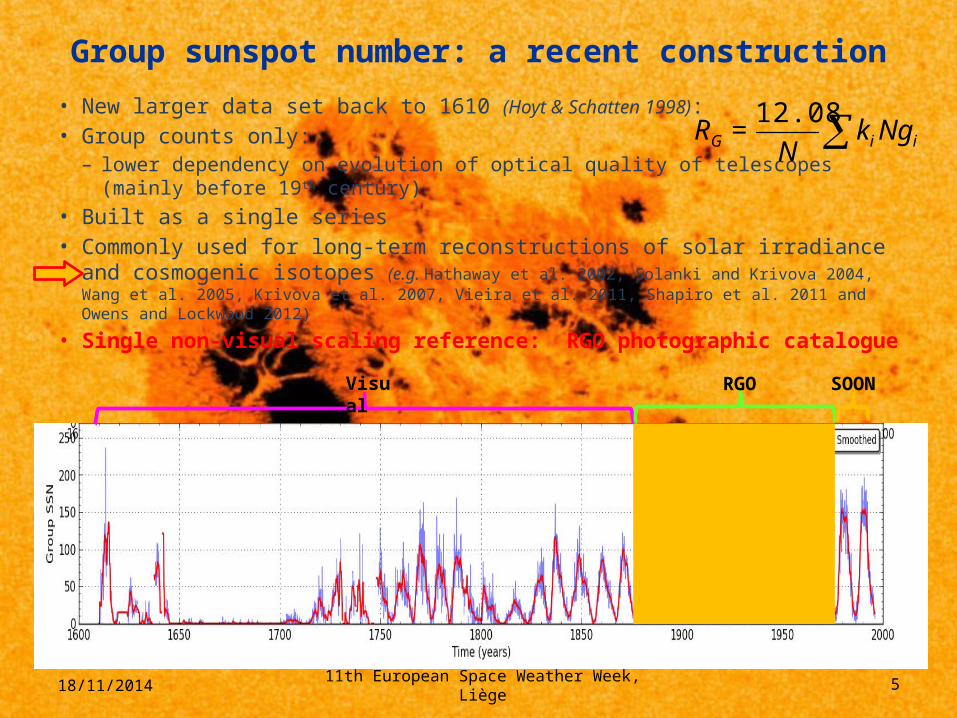
Group sunspot number: a recent construction• New larger data set back to 1610 (Hoyt & Schatten 1998):• Group counts only: – lower dependency on evolution of optical quality of telescopes (mainly before
19th century)• Built as a single series• Commonly used for long-term reconstructions of solar irradiance and
cosmogenic isotopes (e.g. Hathaway et al. 2002, Solanki and Krivova 2004, Wang et al. 2005, Krivova et al. 2007, Vieira et al. 2011, Shapiro et al. 2011 and Owens and Lockwood 2012)
• Single non-visual scaling reference: RGO photographic catalogue
18/11/2014
iiG NgkN
=R12.08
Visual RGO SOON
11th European Space Weather Week, Liège 6
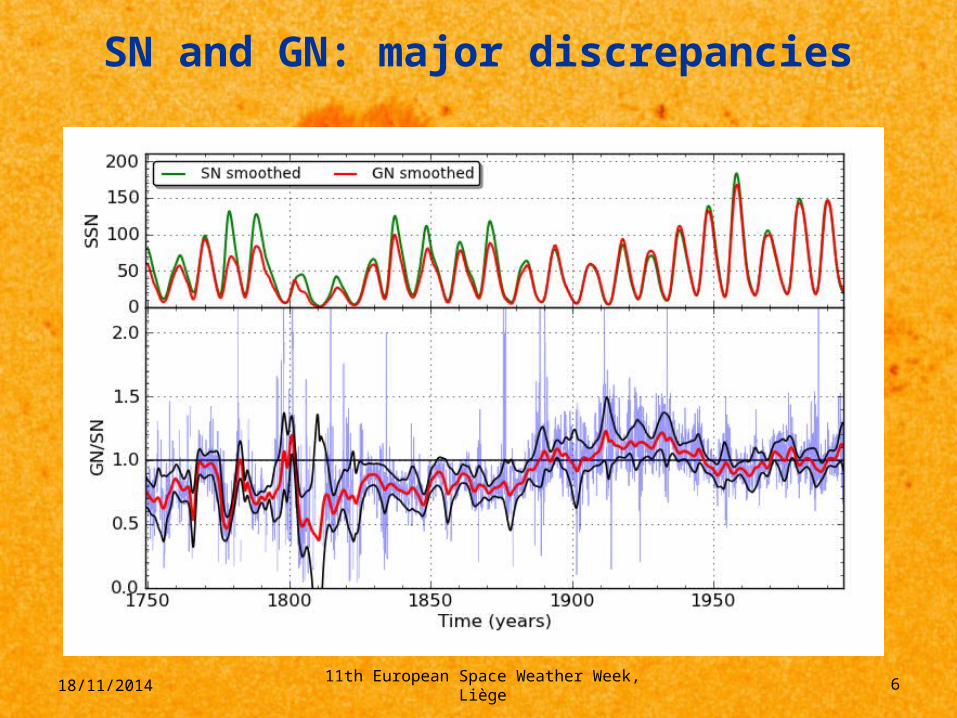
SN and GN: major discrepancies
18/11/2014
11th European Space Weather Week, Liège 7
Metrological approach• SN treated like any absolute index (e.g. TSI):
– Accuracy: based on a model of the measuring process• Base data:
– Exclusively direct sunspot counts (tables, drawings)– Original documents (metadata):
• Instrument and method descriptions• Indications of changes
– Re-counting (statistical tests, effect of a change of method)• No use of any external calibration reference:
– geomagnetic indices, cosmogenic isotopes: only indirect indices– Subject to additional disturbing factors (Earth magnetism,
deposition processes)– Parallel data series are used only for final validation
18/11/2014
11th European Space Weather Week, Liège 8
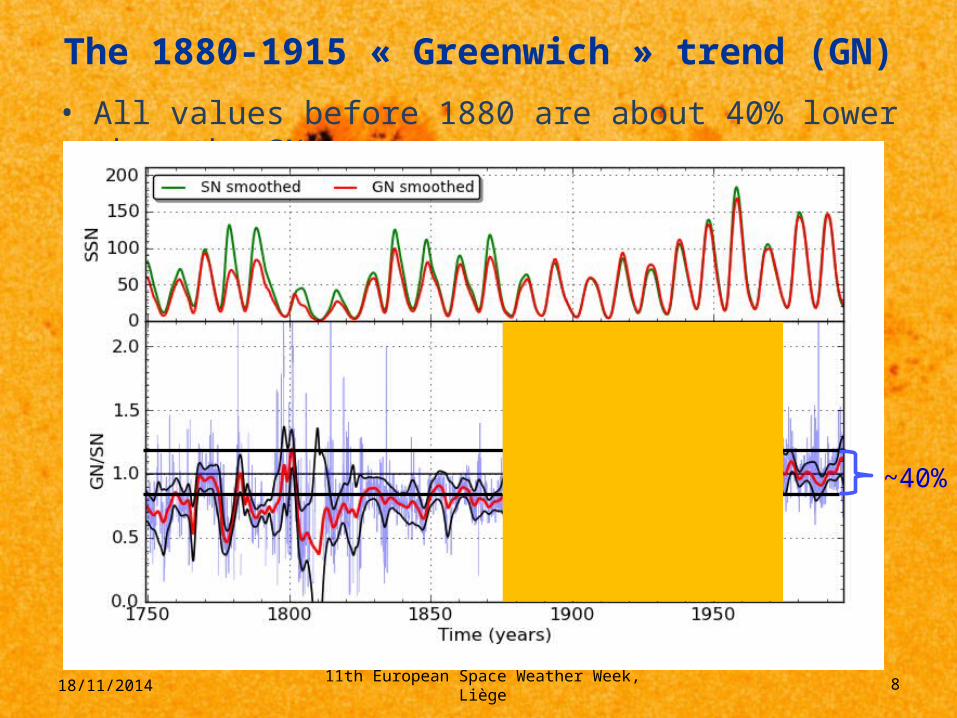
The 1880-1915 « Greenwich » trend (GN)• All values before 1880 are about 40% lower than the SN
18/11/2014
~40%
11th European Space Weather Week, Liège 9
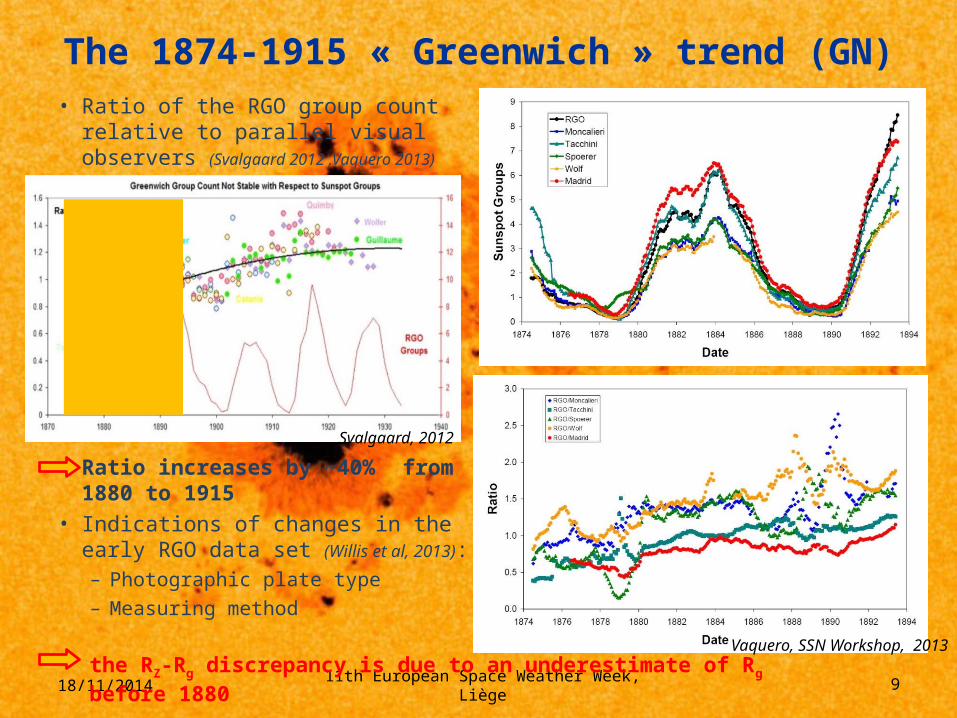
The 1874-1915 « Greenwich » trend (GN)• Ratio of the RGO group count relative to
parallel visual observers (Svalgaard 2012 ,Vaquero 2013)
• Ratio increases by ~40% from 1880 to 1915
• Indications of changes in the early RGO data set (Willis et al, 2013):– Photographic plate type– Measuring method
18/11/2014
Vaquero, SSN Workshop, 2013
Svalgaard, 2012
the RZ-Rg discrepancy is due to an underestimate of Rg before 1880
11th European Space Weather Week, Liège 10
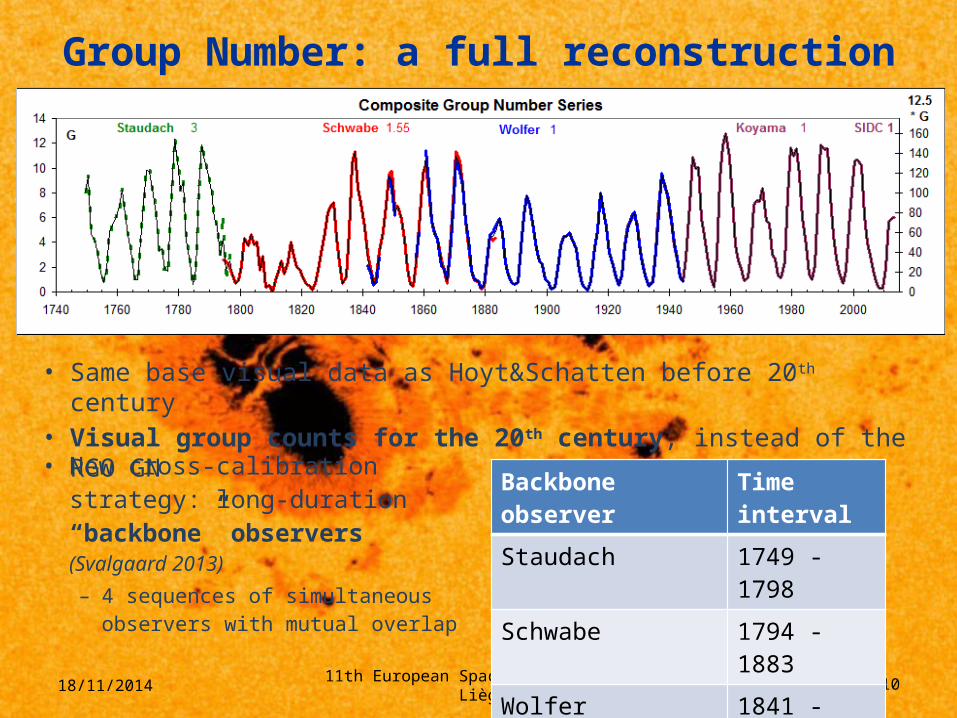
Group Number: a full reconstruction
• Same base visual data as Hoyt&Schatten before 20th century• Visual group counts for the 20th century, instead of the RGO GN
18/11/2014
Backbone observer Time interval
Staudach 1749 - 1798
Schwabe 1794 - 1883
Wolfer 1841 - 1944
Koyama 1916 - 2014
• New cross-calibration strategy: long-duration “backbone” observers (Svalgaard 2013)– 4 sequences of simultaneous
observers with mutual overlap
11th European Space Weather Week, Liège 11
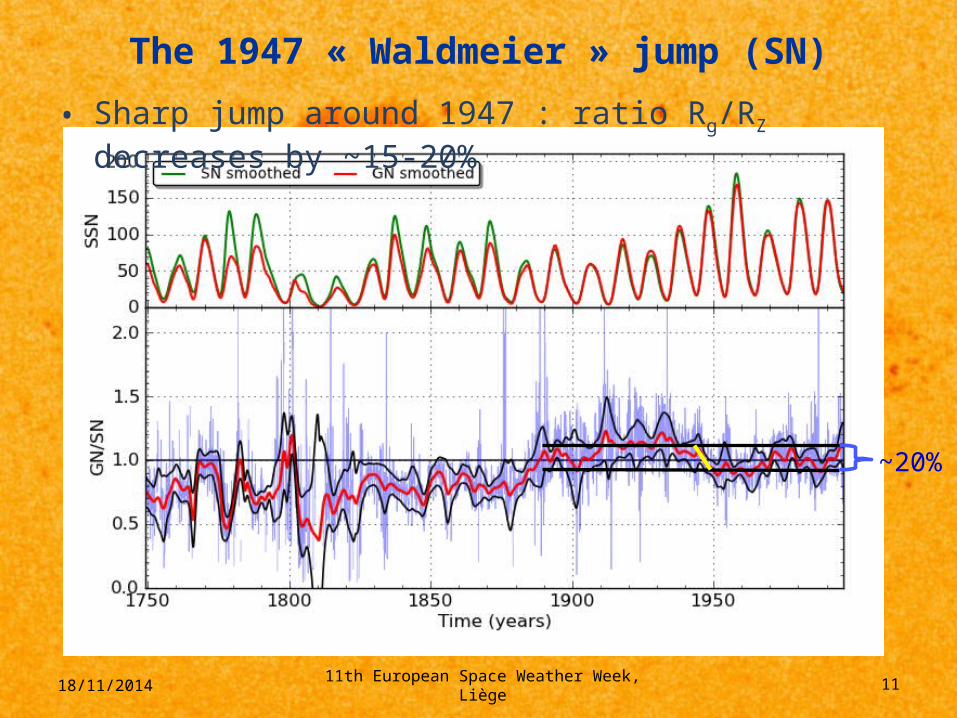
The 1947 « Waldmeier » jump (SN)• Sharp jump around 1947 : ratio Rg/RZ decreases by ~15-20%
18/11/2014
~20%
11th European Space Weather Week, Liège 12
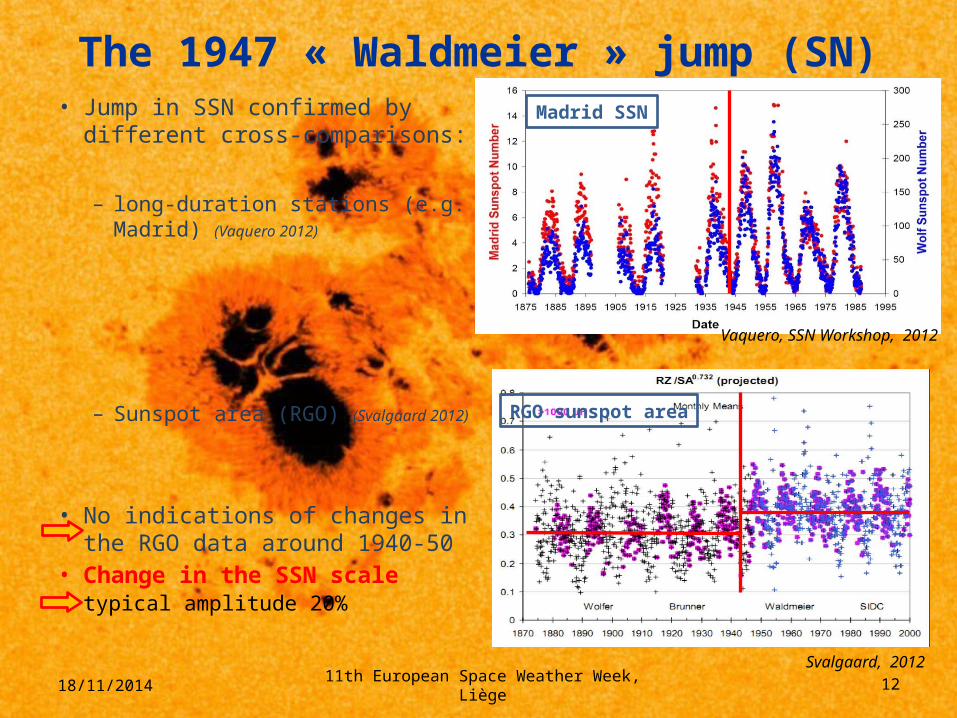
The 1947 « Waldmeier » jump (SN)• Jump in SSN confirmed by
different cross-comparisons:
– long-duration stations (e.g. Madrid) (Vaquero 2012)
– Sunspot area (RGO) (Svalgaard 2012)
• No indications of changes in the RGO data around 1940-50
• Change in the SSN scaletypical amplitude 20%
18/11/2014
Vaquero, SSN Workshop, 2012
Svalgaard, SSN Workshop, 2012
Madrid SSN
SSN - NG
RGO sunspot area
Svalgaard, 2012
11th European Space Weather Week, Liège 13
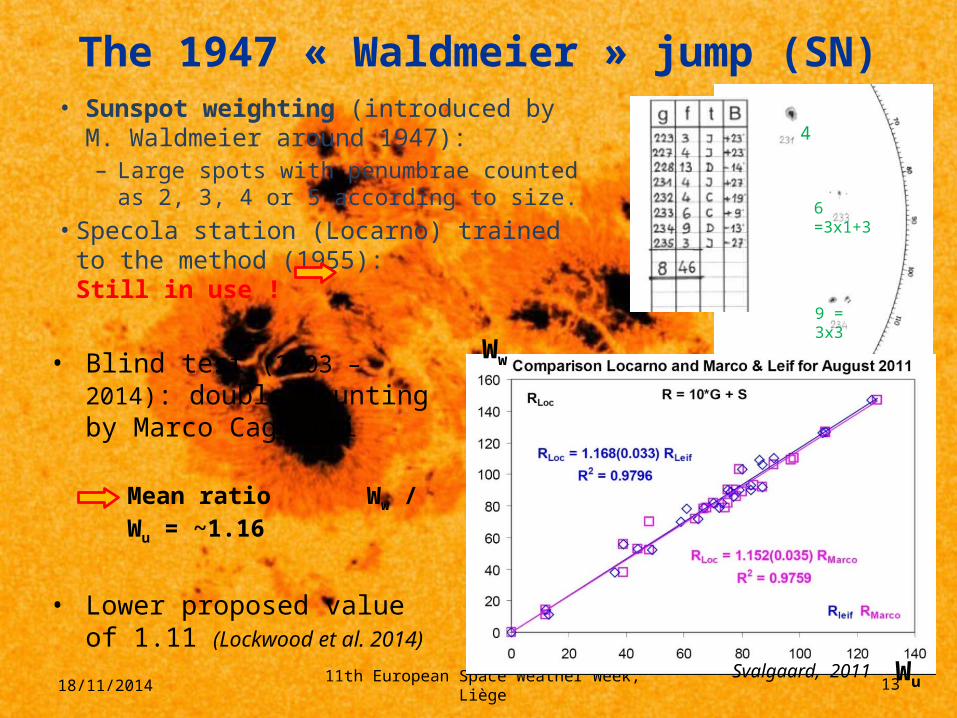
The 1947 « Waldmeier » jump (SN)• Sunspot weighting (introduced by M.
Waldmeier around 1947): – Large spots with penumbrae counted as
2, 3, 4 or 5 according to size.• Specola station (Locarno) trained to the
method (1955): Still in use !
18/11/2014
• Blind test (2003 – 2014): double counting by Marco Cagnotti
– Mean ratio Ww / Wu = ~1.16
• Lower proposed value of 1.11 (Lockwood et al. 2014)
Ww
WuSvalgaard, 2011
4
9 = 3x3
6 =3x1+3
11th European Space Weather Week, Liège 14
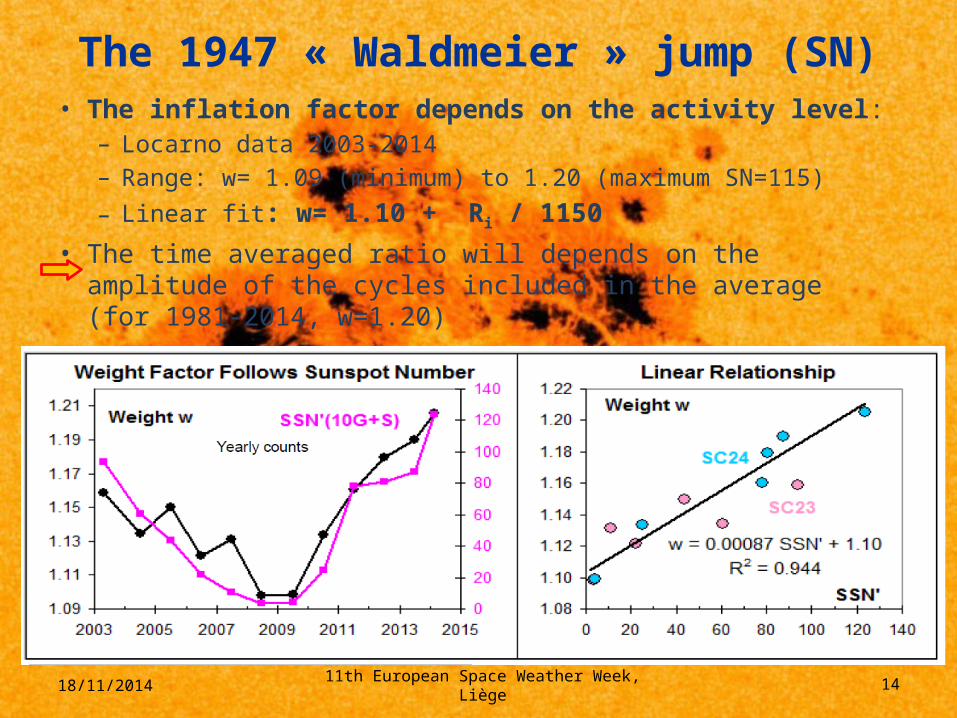
The 1947 « Waldmeier » jump (SN)• The inflation factor depends on the activity level:
– Locarno data 2003-2014 – Range: w= 1.09 (minimum) to 1.20 (maximum SN=115)– Linear fit: w= 1.10 + Ri / 1150
• The time averaged ratio will depends on the amplitude of the cycles included in the average (for 1981-2014, w=1.20)
18/11/2014
11th European Space Weather Week, Liège 15
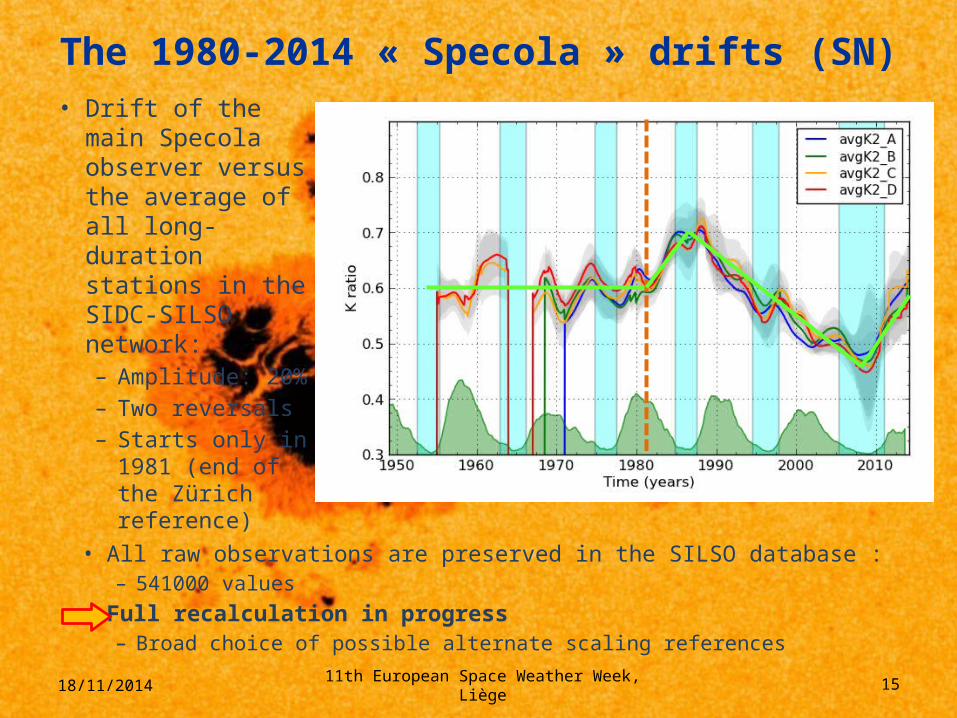
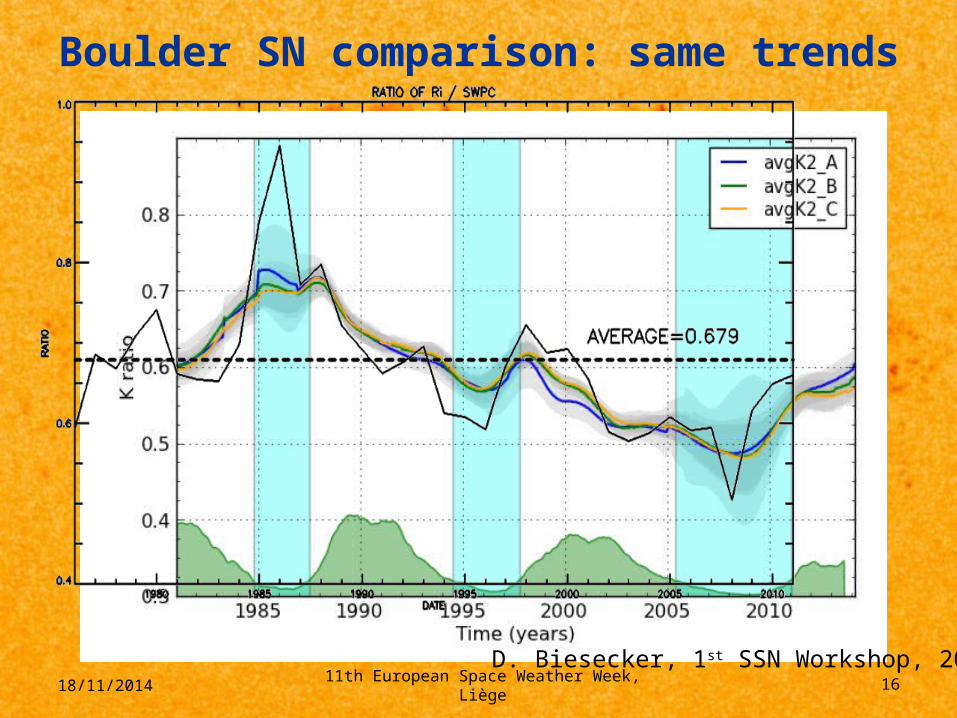
The 1980-2014 « Specola » drifts (SN)
18/11/2014
• All raw observations are preserved in the SILSO database :– 541000 values
• Full recalculation in progress– Broad choice of possible alternate scaling references
• Drift of the main Specola observer versus the average of all long-duration stations in the SIDC-SILSO network:– Amplitude: 20%– Two reversals– Starts only in
1981 (end of the Zürich reference)
11th European Space Weather Week, Liège 16
Boulder SN comparison: same trends
18/11/2014D. Biesecker, 1st SSN Workshop, 2011
11th European Space Weather Week, Liège 17
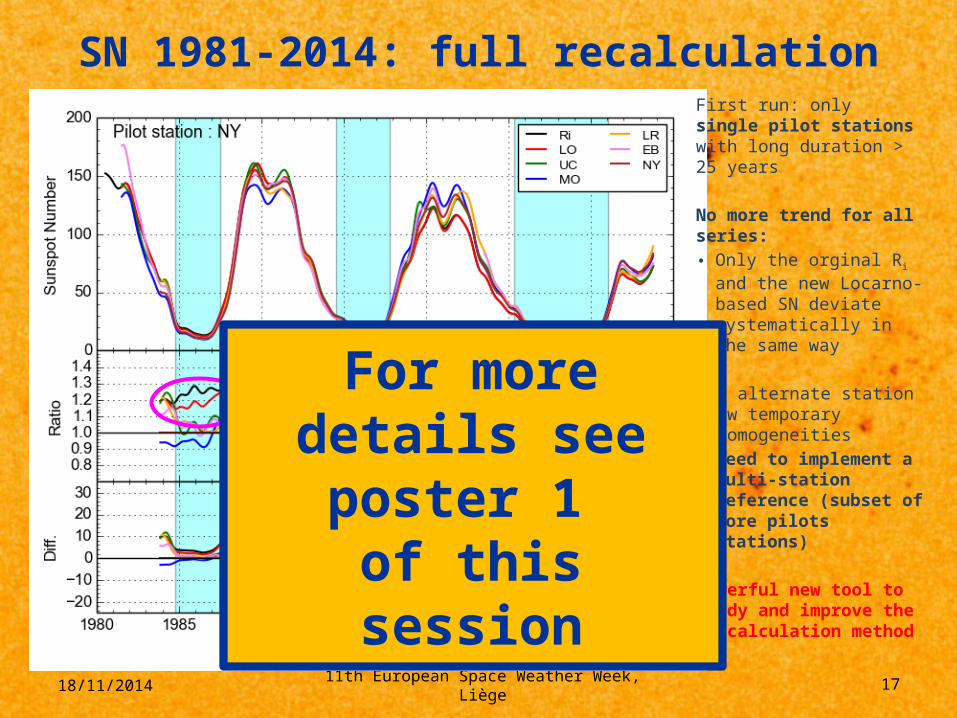
SN 1981-2014: full recalculation
18/11/2014
First run: only single pilot stations with long duration > 25 years
No more trend for all series:• Only the orginal Ri and
the new Locarno-based SN deviate systematically in the same way
All alternate station show temporary inhomogeneities• Need to implement a
multi-station reference (subset of core pilots stations)
Powerful new tool to study and improve the SN calculation method
For more details see poster 1
of this session
11th European Space Weather Week, Liège 18
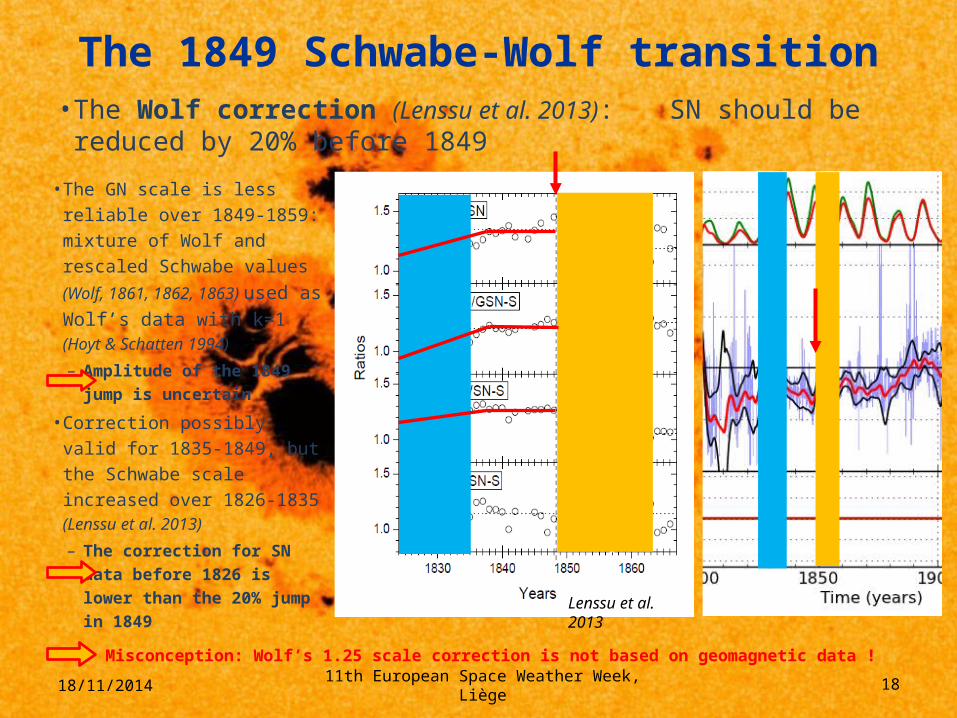
• The GN scale is less reliable over 1849-1859: mixture of Wolf and rescaled Schwabe values (Wolf, 1861, 1862, 1863)
used as Wolf’s data with k=1 (Hoyt & Schatten 1994)
– Amplitude of the 1849 jump is uncertain
• Correction possibly valid for 1835-1849, but the Schwabe scale increased over 1826-1835 (Lenssu et al. 2013)
– The correction for SN data before 1826 is lower than the 20% jump in 1849
The 1849 Schwabe-Wolf transition• The Wolf correction (Lenssu et al. 2013): SN should be
reduced by 20% before 1849
18/11/2014
Lenssu et al. 2013
Misconception: Wolf’s 1.25 scale correction is not based on geomagnetic data !
11th European Space Weather Week, Liège 19
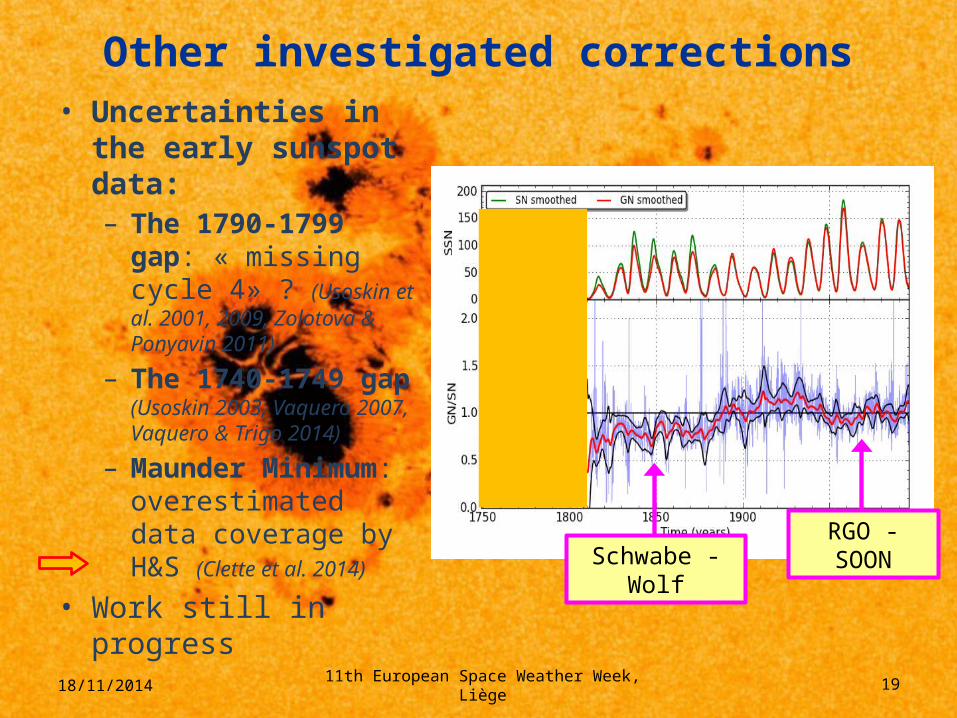
Other investigated corrections• Uncertainties in the
early sunspot data:– The 1790-1799 gap:
« missing cycle 4» ? (Usoskin et al. 2001, 2009, Zolotova & Ponyavin 2011)
– The 1740-1749 gap (Usoskin 2003, Vaquero 2007, Vaquero & Trigo 2014)
– Maunder Minimum: overestimated data coverage by H&S (Clette et al. 2014)
• Work still in progress
18/11/2014
Schwabe - WolfRGO - SOON
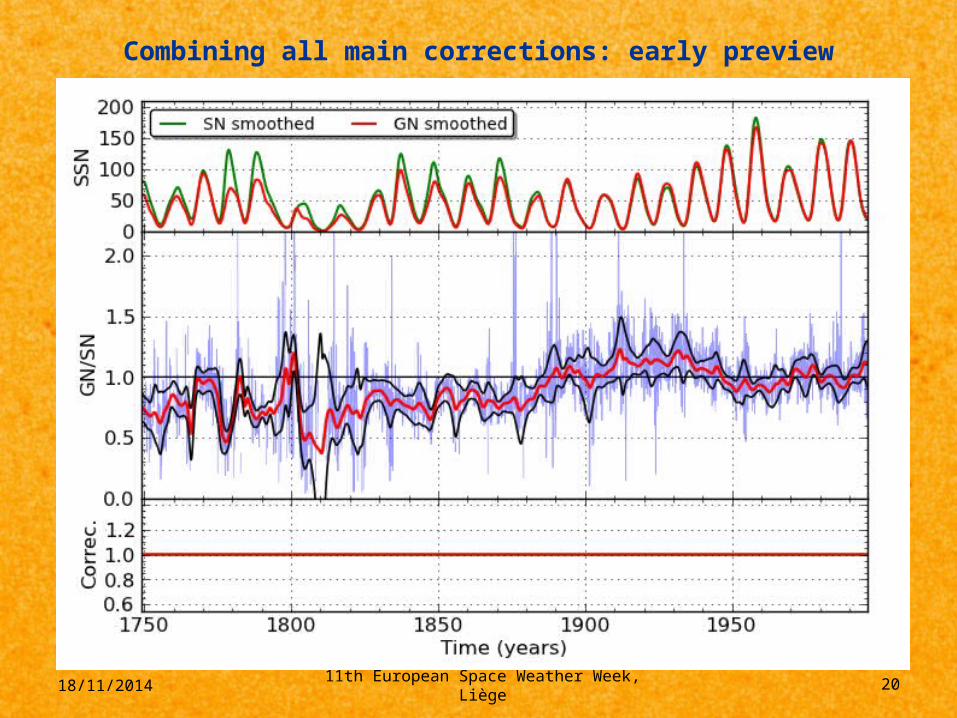
11th European Space Weather Week, Liège 20
Combining all main corrections: early preview• aa
18/11/2014
11th European Space Weather Week, Liège 21
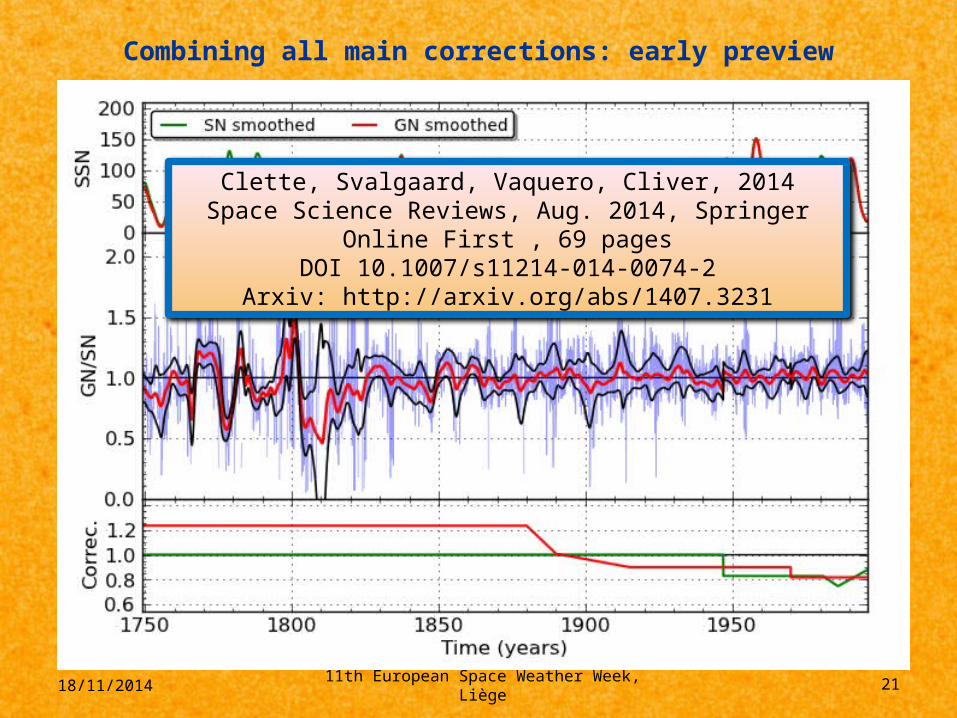
Combining all main corrections: early preview• aa
18/11/2014
Clette, Svalgaard, Vaquero, Cliver, 2014Space Science Reviews, Aug. 2014, Springer Online First , 69 pages
DOI 10.1007/s11214-014-0074-2Arxiv: http://arxiv.org/abs/1407.3231
11th European Space Weather Week, Liège 22
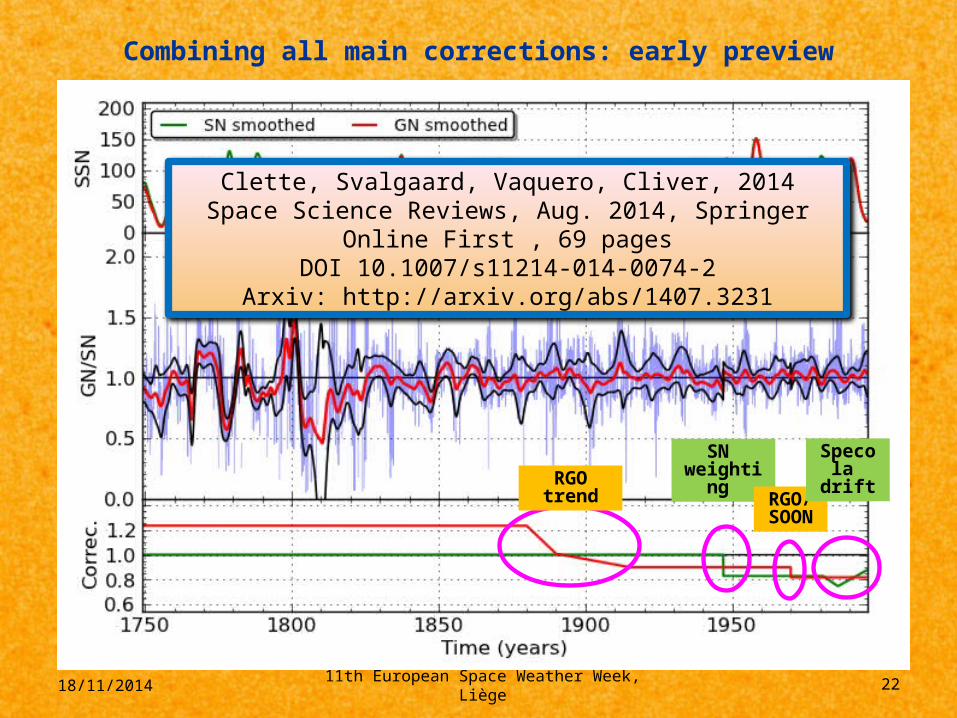
Combining all main corrections: early preview• aa
18/11/2014
RGO trendSN
weighting
RGO/SOON
Specola drift
Clette, Svalgaard, Vaquero, Cliver, 2014Space Science Reviews, Aug. 2014, Springer Online First , 69 pages
DOI 10.1007/s11214-014-0074-2Arxiv: http://arxiv.org/abs/1407.3231
11th European Space Weather Week, Liège 23
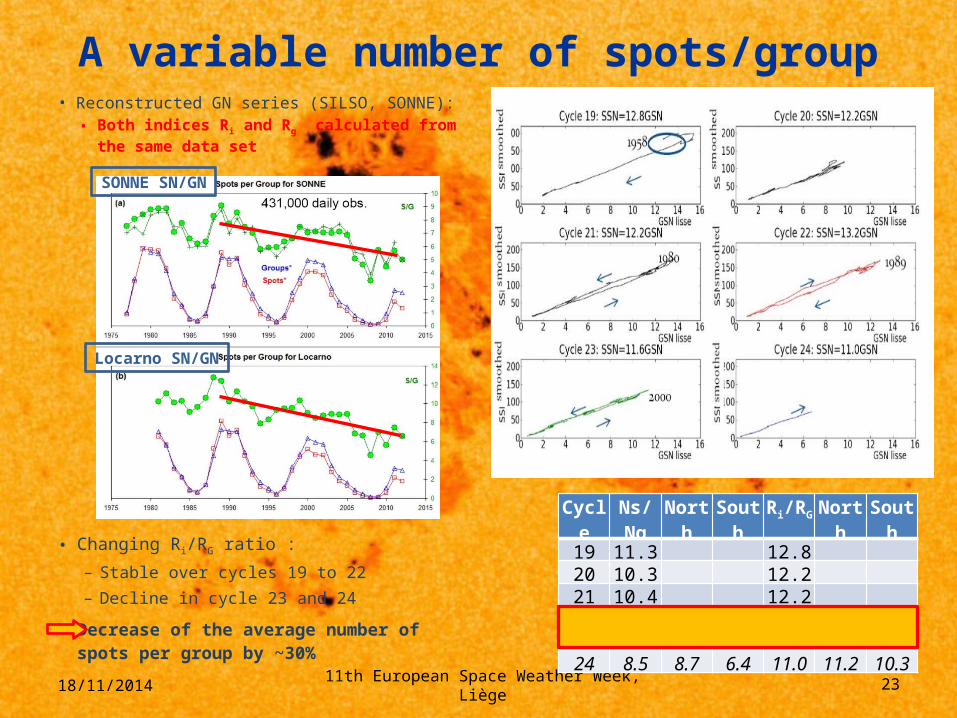
A variable number of spots/group• Reconstructed GN series (SILSO, SONNE):
• Both indices Ri and Rg calculated from the same data set
18/11/2014
SONNE SN/GN
Locarno SN/GN
Cycle Ns/Ng North South Ri/RG North South19 11.3 12.820 10.3 12.221 10.4 12.222 11.9 12.5 10.7 13.0 13.5 12.523 9.3 9.5 8.7 11.6 11.5 11.924 8.5 8.7 6.4 11.0 11.2 10.3
• Changing Ri/RG ratio :– Stable over cycles 19 to 22– Decline in cycle 23 and 24
• Decrease of the average number of spots per group by ~30%
11th European Space Weather Week, Liège 24
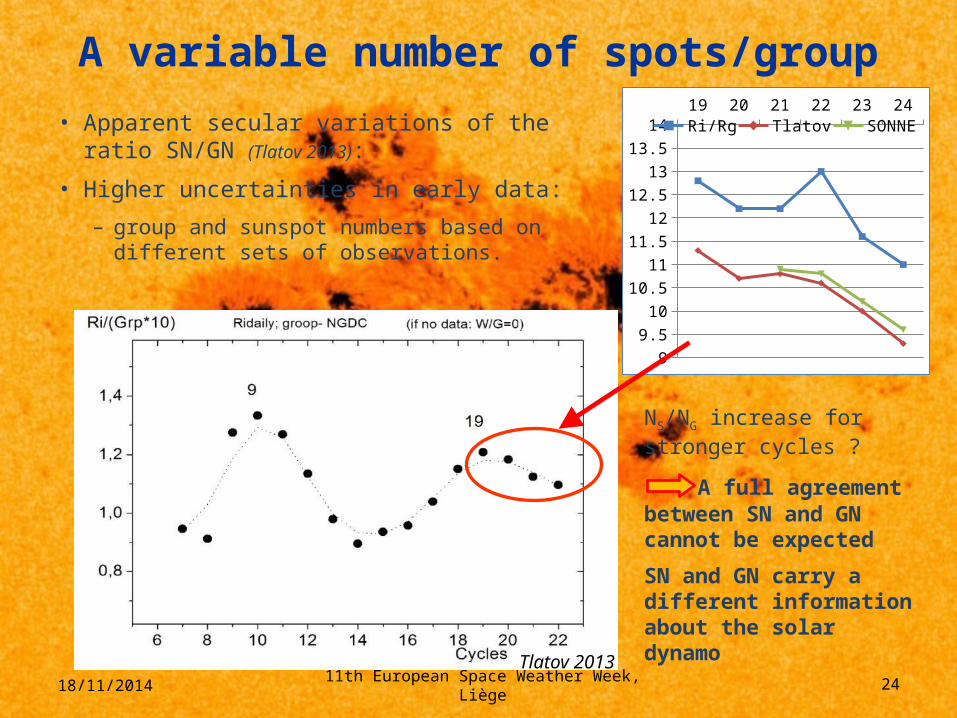
NS/NG increase for stronger cycles ?
A full agreement between SN and GN cannot be expected
SN and GN carry a different information about the solar dynamo
A variable number of spots/group
• Apparent secular variations of the ratio SN/GN (Tlatov 2013):
• Higher uncertainties in early data:
– group and sunspot numbers based on different sets of observations.
18/11/2014
19 20 21 22 23 24
99.510
10.511
11.512
12.513
13.514 Ri/Rg Tlatov SONNE
Tlatov 2013
11th European Space Weather Week, Liège 25
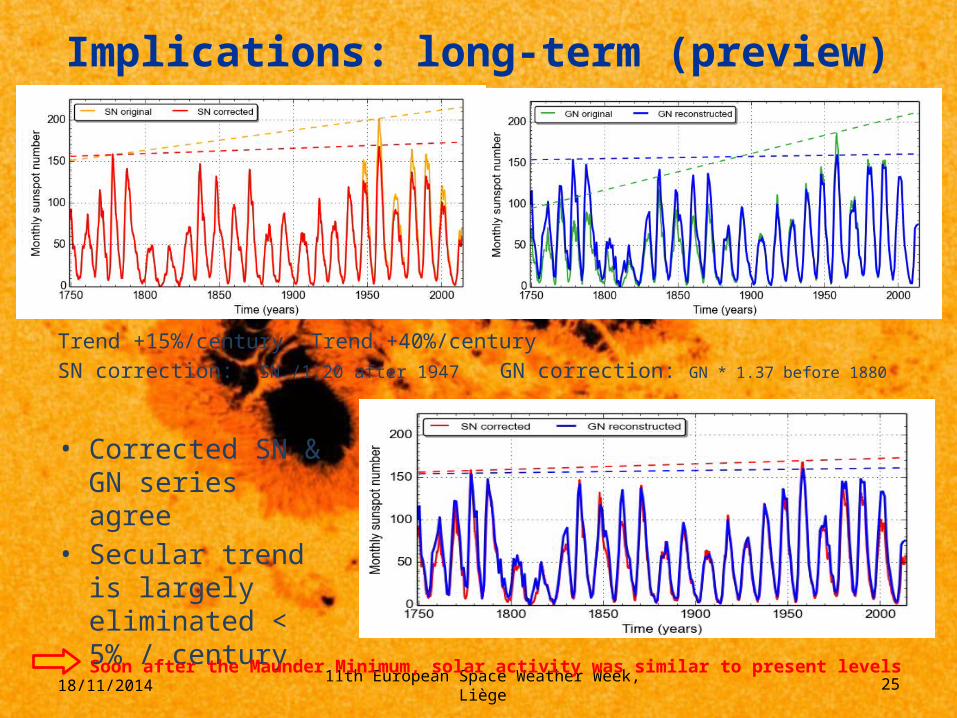
Implications: long-term (preview)
• Corrected SN & GN series agree
• Secular trend is largely eliminated < 5% / century
18/11/2014
Trend +15%/century Trend +40%/centurySN correction: SN /1.20 after 1947 GN correction: GN * 1.37 before 1880
Soon after the Maunder Minimum, solar activity was similar to present levels
11th European Space Weather Week, Liège 26
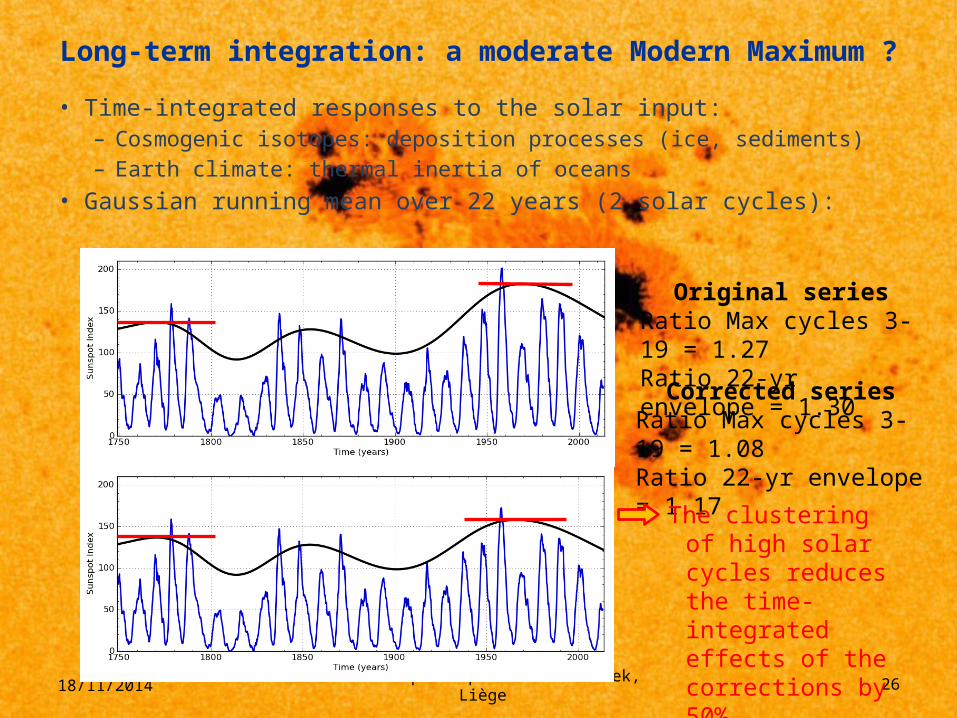
Long-term integration: a moderate Modern Maximum ?
• Time-integrated responses to the solar input:– Cosmogenic isotopes: deposition processes (ice, sediments)– Earth climate: thermal inertia of oceans
• Gaussian running mean over 22 years (2 solar cycles):
18/11/2014
Original seriesRatio Max cycles 3-19 = 1.27Ratio 22-yr envelope = 1.30
Corrected seriesRatio Max cycles 3-19 = 1.08Ratio 22-yr envelope = 1.17
The clustering of high solar cycles reduces the time-integrated effects of the corrections by 50%
11th European Space Weather Week, Liège 27
Conclusions and prospects• Release of new SN and GN series in spring 2015:• In preparation:
– Uncertainties (error bars)– Implementation of a versioning system– New conventions:
• Removing the 0.6 Zürich factor• Continuous mean SN values between 0 and 11 (no more 0-11 jump)
• Implications:– Variable number of spots per group (scale-dependant mechanism)– Limited rise of average solar activity since the Maunder minimum:– Reconstructions of the solar output need revision: e.g. concept of a
Grand Maximum in the 20th century is questioned (Solanki et al. 2004, Abreu et al. 2008, Usoskin et al. 2012, 2014)
• Full recalculation of the modern SN now started: – Improved method: composite multi-station reference (to be identified)– Powerful tool for assessing the role of various factors on the SN (statistics of
k coefficients, group splitting, visual observer practices)18/11/2014
11th European Space Weather Week, Liège 28
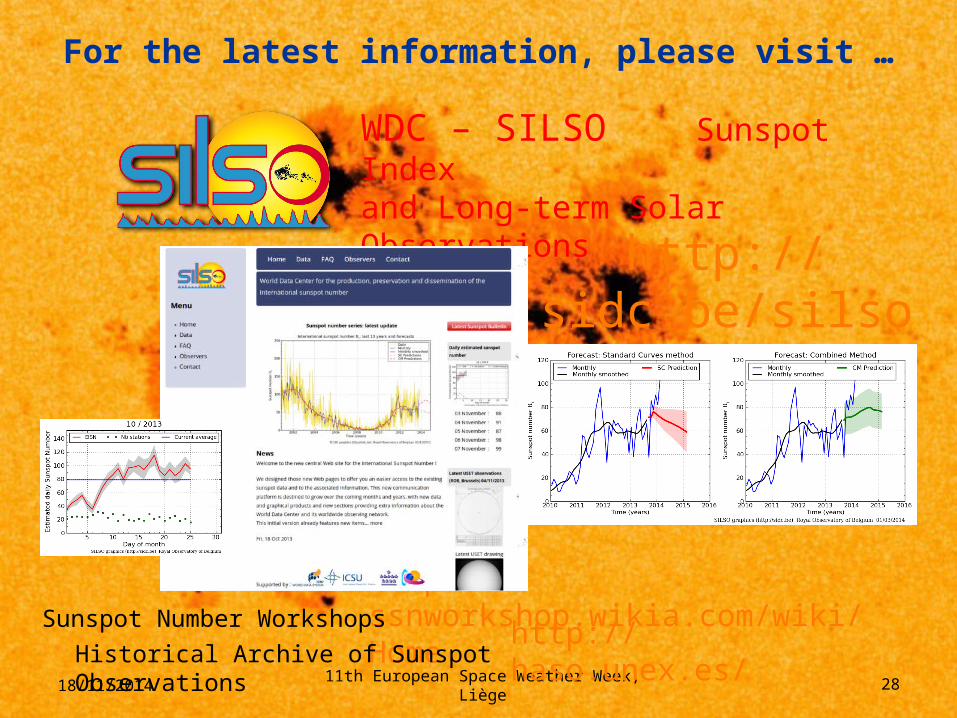
For the latest information, please visit …
18/11/2014
http://sidc.be/silso
http://ssnworkshop.wikia.com/wiki/Home
WDC – SILSO Sunspot Index and Long-term Solar Observations
http://haso.unex.es/Sunspot Number WorkshopsHistorical Archive of Sunspot Observations
11th European Space Weather Week, Liège 2918/11/2014
11th European Space Weather Week, Liège 30
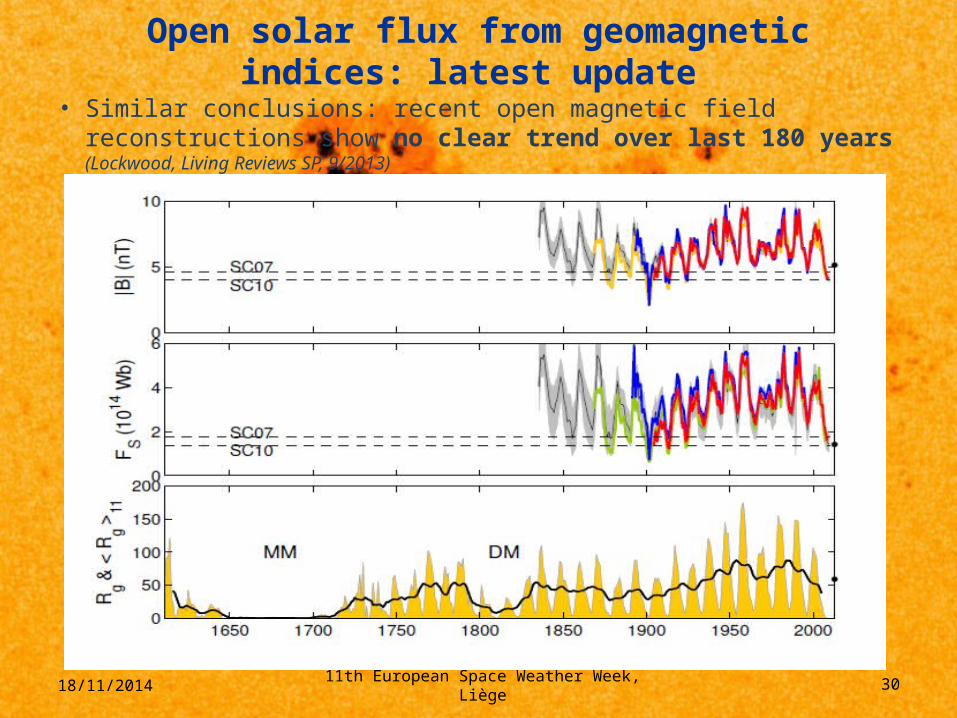
Open solar flux from geomagnetic indices: latest update
• Similar conclusions: recent open magnetic field reconstructions show no clear trend over last 180 years (Lockwood, Living Reviews SP, 9/2013)
18/11/2014
11th European Space Weather Week, Liège 31
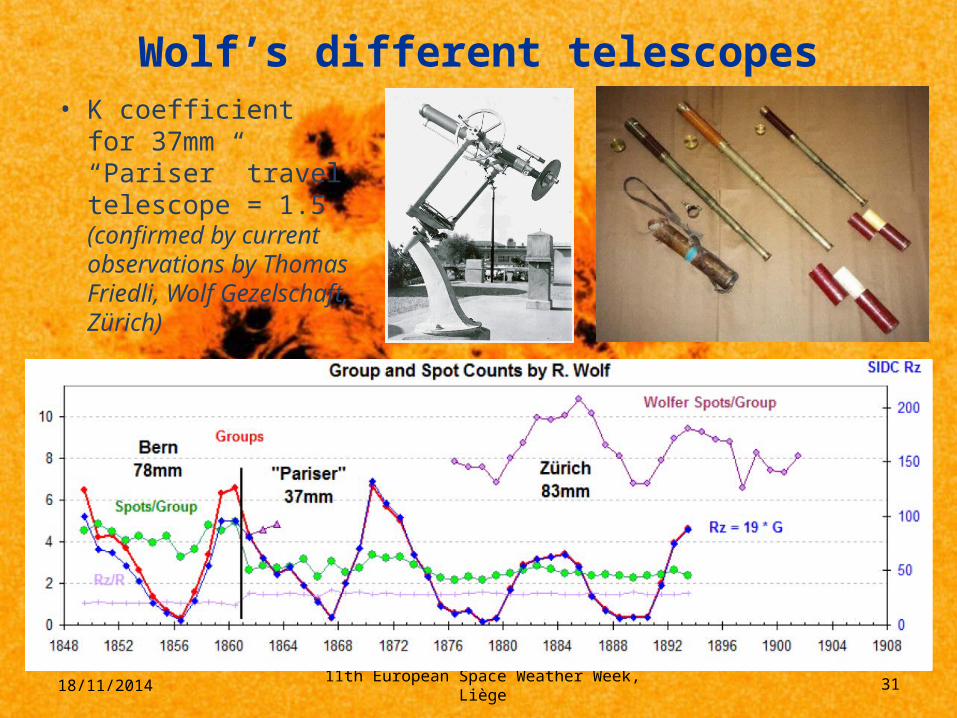
Wolf’s different telescopes• K coefficient for
37mm “Pariser” travel telescope = 1.5 (confirmed by current observations by Thomas Friedli, Wolf Gezelschaft, Zürich)
18/11/2014

11th European Space Weather Week, Liège 32
The 1893 Wolf-Wolfer transition (SN)• Simultaneous Wolf & Wolfer observations 1876-1893 (17 years)
• Origin of the 0.6 = 1/1.667 Zürich factor applied to SN after 1892
• Our determination (ratios of yearly means): 1.653 +/- 0.047 (agreement to better than 1%)
• Very robust scaling of the SN over the 1876 visual-to-photography transition in the H&S Group Number
18/11/2014
11th European Space Weather Week, Liège 33
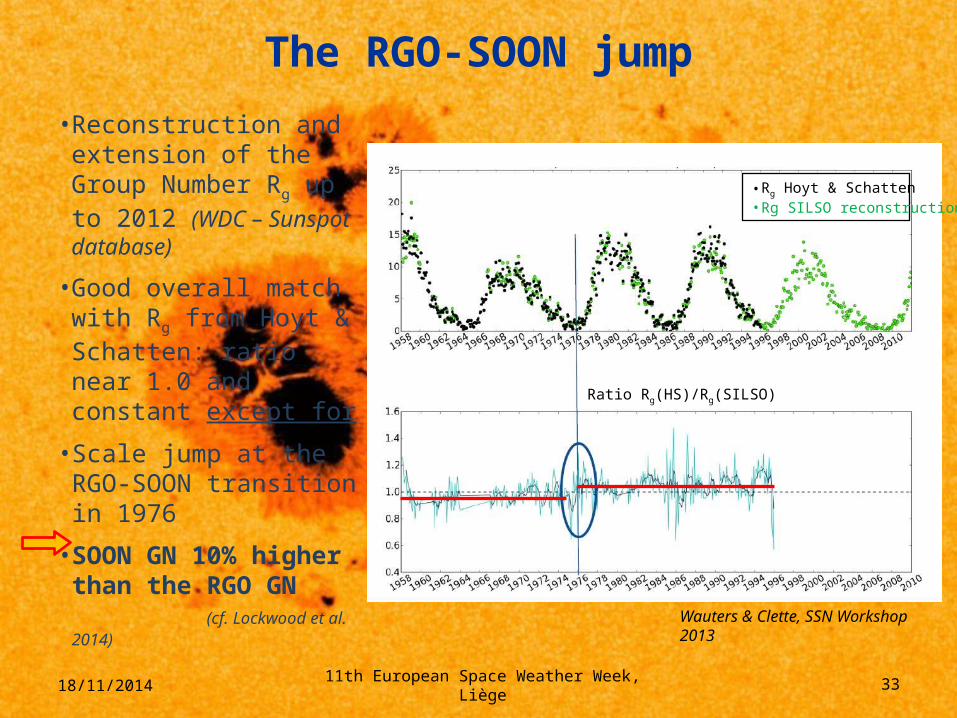
The RGO-SOON jump
• Reconstruction and extension of the Group Number Rg up to 2012 (WDC – Sunspot database)
• Good overall match with Rg from Hoyt & Schatten: ratio near 1.0 and constant except for
• Scale jump at the RGO-SOON transition in 1976
• SOON GN 10% higher than the RGO GN (cf. Lockwood et al. 2014)
18/11/2014
Wauters & Clette, SSN Workshop 2013
• Rg Hoyt & Schatten• Rg SILSO reconstruction
Ratio Rg(HS)/Rg(SILSO)
11th European Space Weather Week, Liège 34
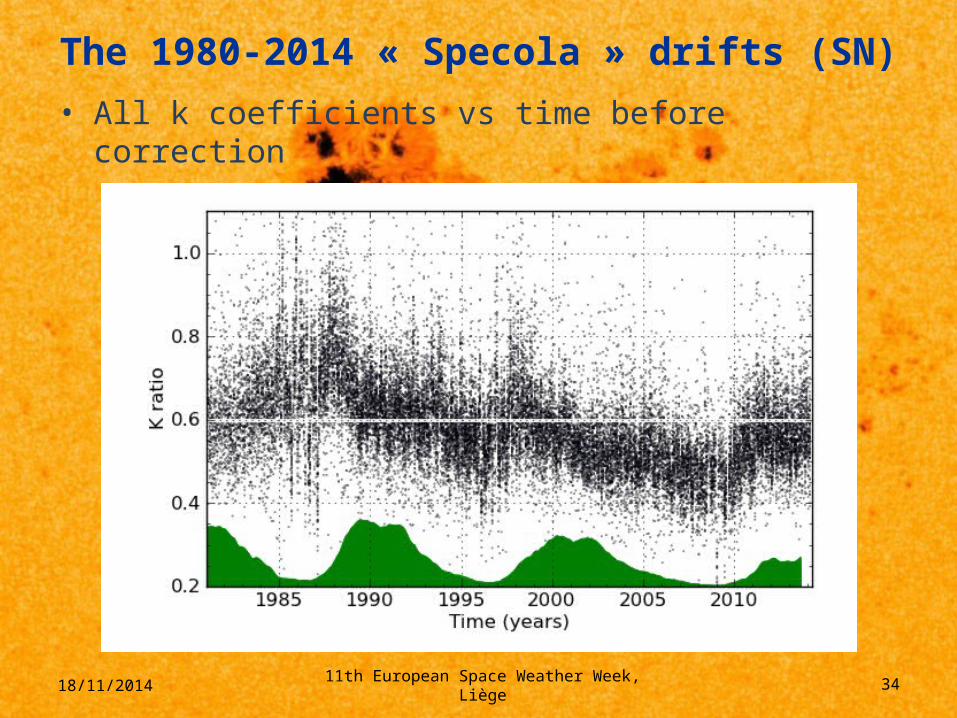
The 1980-2014 « Specola » drifts (SN)• All k coefficients vs time before correction
18/11/2014
11th European Space Weather Week, Liège 35
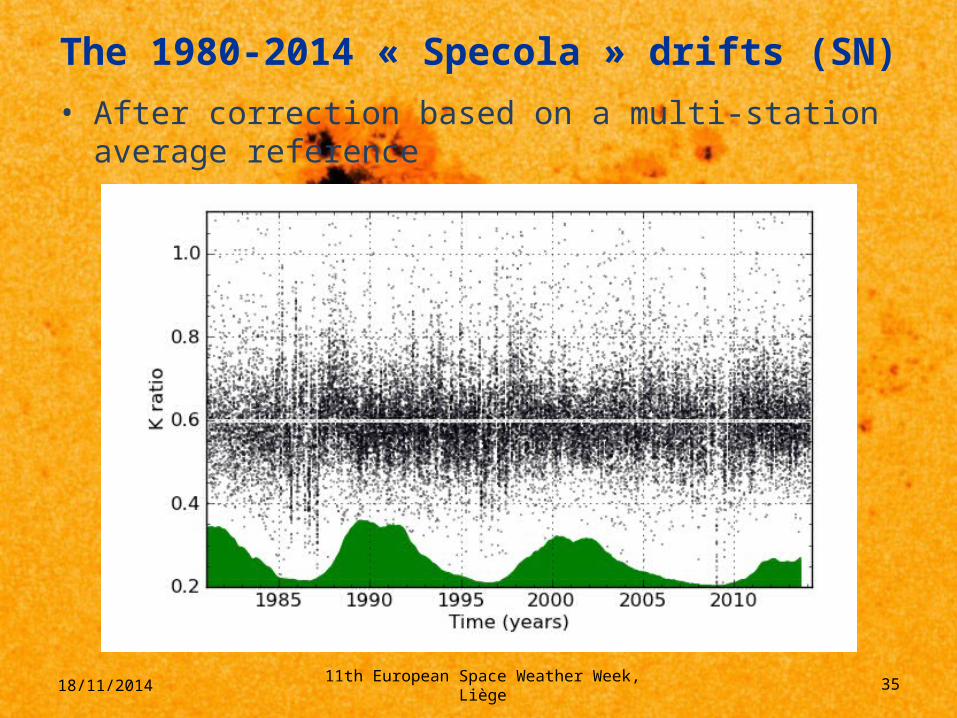
The 1980-2014 « Specola » drifts (SN)• After correction based on a multi-station average reference
18/11/2014
11th European Space Weather Week, Liège 36
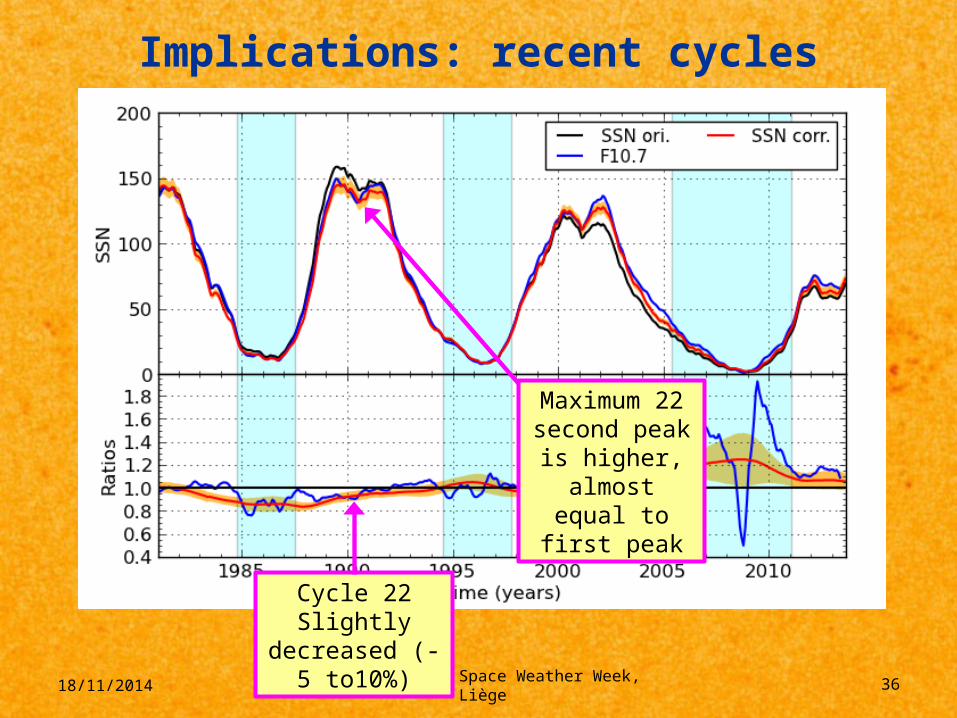
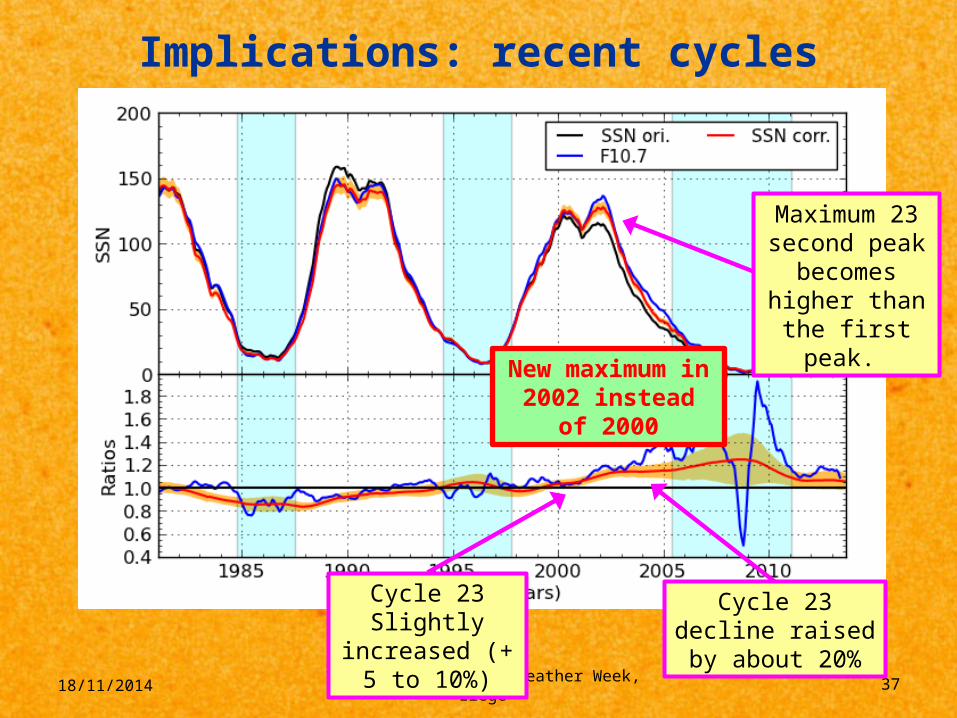
Implications: recent cycles
18/11/2014
Cycle 22Slightly decreased
(- 5 to10%)
Maximum 22 second peak is higher, almost equal to first
peak
11th European Space Weather Week, Liège 37
Implications: recent cycles
18/11/2014
Cycle 23Slightly increased
(+ 5 to 10%)
Maximum 23 second peak
becomes higher than the first
peak.
Cycle 23 decline raised by about 20%
New maximum in 2002 instead of 2000
11th European Space Weather Week, Liège 38
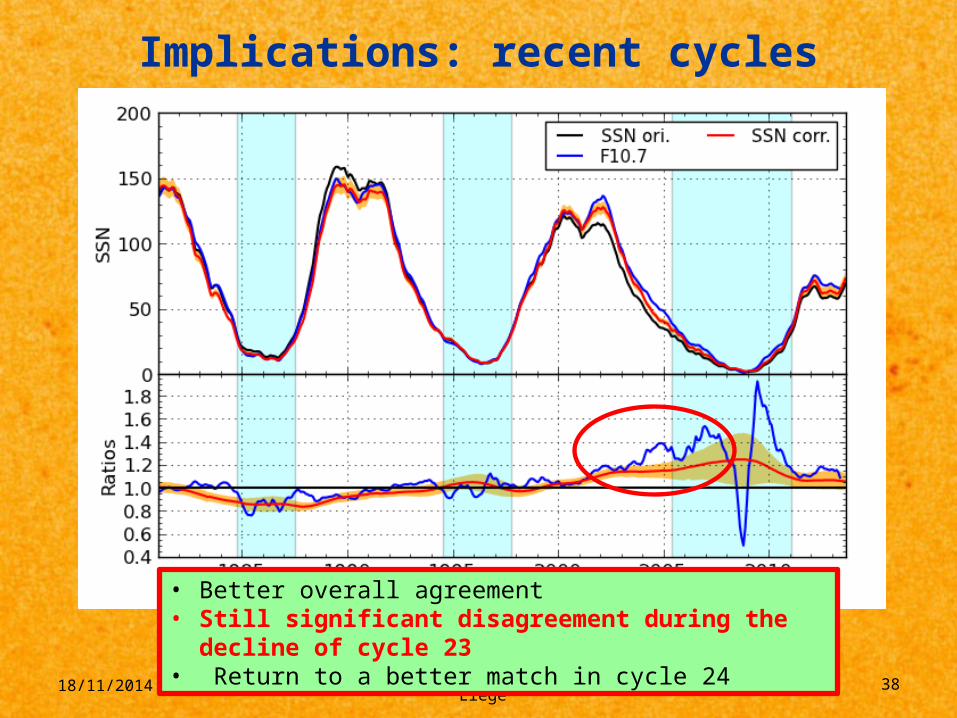
Implications: recent cycles
18/11/2014
• Better overall agreement• Still significant disagreement during the decline of cycle 23• Return to a better match in cycle 24
11th European Space Weather Week, Liège 39
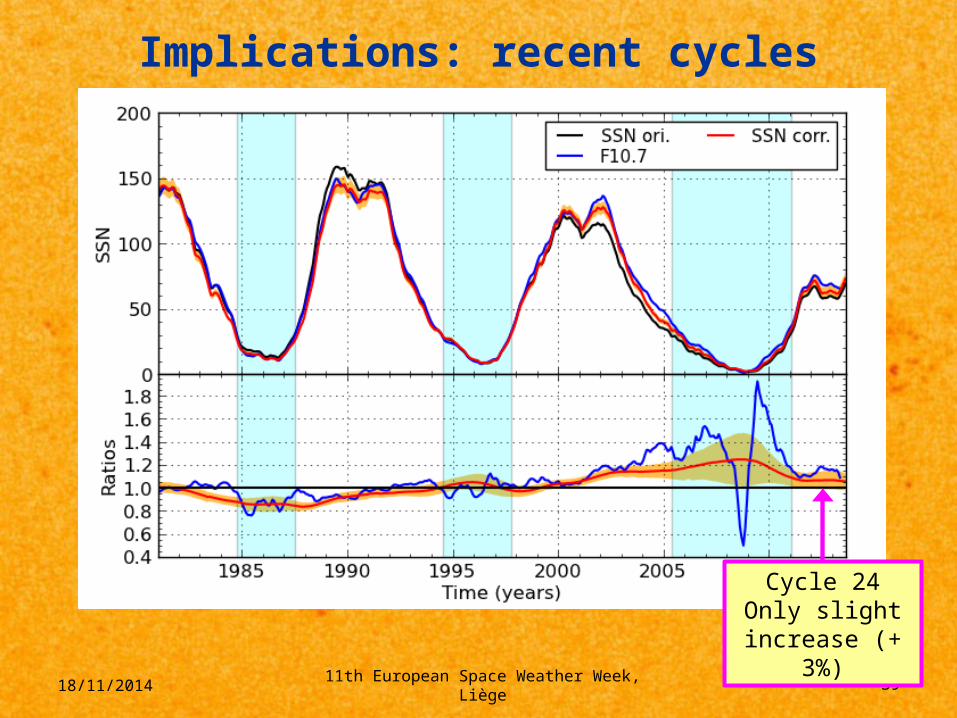
Implications: recent cycles
18/11/2014
Cycle 24Only slight
increase (+ 3%)
11th European Space Weather Week, Liège 40
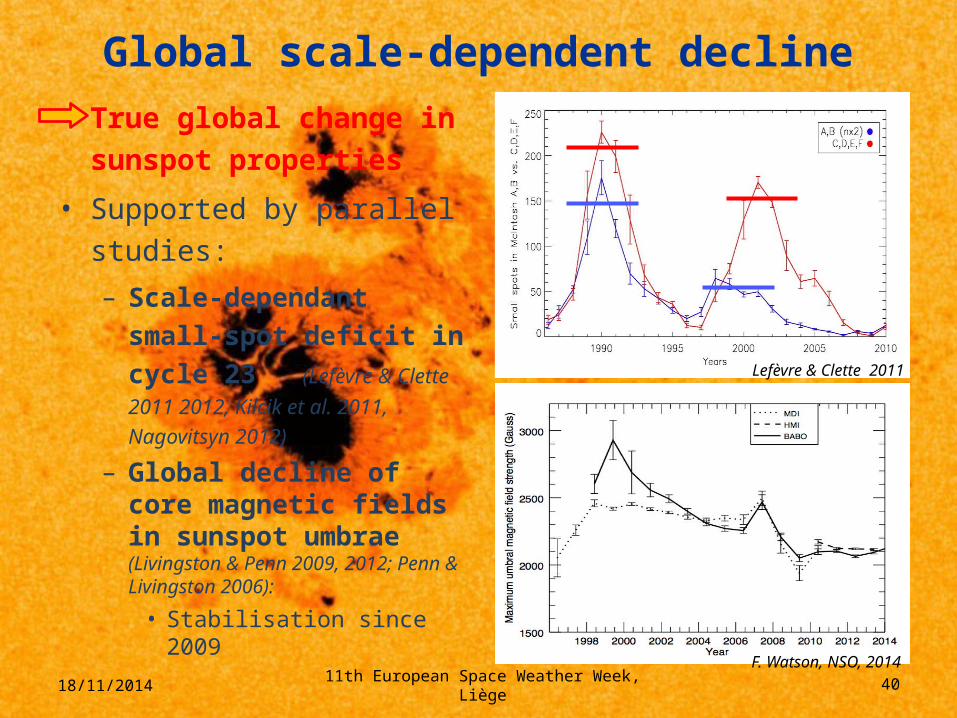
Global scale-dependent decline• True global change in
sunspot properties
• Supported by parallel studies:
– Scale-dependant small-spot deficit in cycle 23 (Lefèvre & Clette 2011 2012, Kilcik et al. 2011, Nagovitsyn 2012)
– Global decline of core magnetic fields in sunspot umbrae (Livingston & Penn 2009, 2012; Penn & Livingston 2006):
• Stabilisation since 2009
18/11/2014
Lefèvre & Clette 2011
F. Watson, NSO, 2014