Embed Size (px)
Citation preview

The Next Needed Thing: The impact of the Jeanes Fund on
Black schooling in the South, 1900–1930
Daniel Kreisman
Georgia State University
December, 2015
Abstract
At the outset of the 20th century, two large philanthropies targeted southern black schools
to combat “separate but equal”. The first, The Rosenwald Fund, built nearly 5,000 school-
houses. The second, The Jeanes Fund, built a corps of trained “Supervisors” who undertook
tasks ranging from teacher training to fundraising – hence their motto, “the next needed
thing.” I exploit variation in the timing and placement of Jeanes and Rosenwald to esti-
mate the impact of the Jeanes Fund, to revise estimates of the effects of Rosenwald, and to
compare per-dollar effects of investments in human resources (Jeanes) and physical capital
(Rosenwald) respectively.
JEL No. I24, I25, N01, N32.
Keywords: Education, Achievement Gap, Philanthropy, Jeanes, Rosenwald.
∗Dept. of Economics, Georgia State University, P.O. Box 3992, Atlanta, GA 30302-3992. Thanks to Jeff Grog-ger, Kerwin Charles, Bob Lalonde and two anonymous referees for two rounds of suggestions and insight, to DanAaronson and Bhash Mazumder for Rosenwald data and helpful suggestions, to Celeste Carruthers and MarianneWanamaker for county level educational records, and to Josiah Pamoja, Kayin Shabazz, Katherine Hollis andPeyman Firouzi for archival work and research assistance. Thanks also to seminar participants at the Universityof Chicago, the University of Michigan, UPenn and UMass Amherst, and to Chicago’s Committee on Educationand the Institute of Education Science for fellowship support. This research was directly supported by a grant fromthe American Educational Research Association which receives funds for its Grants Program from the NationalScience Foundation under Grant #DRL-0941014. Opinions reflect those of the author and do not necessarilyreflect those of the granting agencies. Any and all errors are my own.
1

1 IntroductionIn the years between the end of Reconstruction in the late 1870’s and Brown v. Board of Edu-
cation in 1954, educational resources for Southern blacks were a fraction of those for whites. By
as late as 1940, black per-pupil expenditures were less than half, student-teacher ratios were 25
percent higher and the average term was 10 percent shorter (Margo, 1990; Card and Krueger,
1992). Yet, Southern blacks born between 1900 and 1930, during the height of “Jim Crow”, im-
proved on their white counterparts and their Northern black peers in both schooling outcomes
and even school inputs (see Figure 1). Margo (1990, 1991) attributes some of this to improved
schooling conditions resulting from the threat of northern migration. He and others (Donohue,
Heckman and Todd, 2002; Collins and Margo, 2006) also cite the existence of large Northern
philanthropies, but stop short of estimating their impact. Recent empirical evidence has begun
to emerge demonstrating that these philanthropies indeed played an instrumental role. Aaronson
and Mazumder (2011) estimate that the Julius Rosenwald Fund, which built nearly 5,000 rural
schools for Southern black students between 1914 and 1931, accounts for up to 40% of gains in
enrollment and literacy made by blacks relative to whites during these years. Subsequent work
by Carruthers and Wanamaker (2013) suggests, though, that these funds crowded out additional
public expenditures for blacks, mitigating relative gains in school inputs.
I add to this literature by estimating the impact of the Anna T. Jeanes Fund, which built
a corps of trained and experienced black educators to serve as “Supervisors” in Southern black
schools beginning in 1909. These “Jeanes Supervisors,” most of them women, were assigned to
Southern counties and served a variety of tasks in each county’s black schools, including: teacher
training, curriculum development, administrative work and fundraising, often for Rosenwald
Schools, amongst myriad other tasks. The varied nature of their work inspired their motto, The
next needed thing. By 1930 the Jeanes Fund had placed Supervisors in over 40% of Southern
counties, ostensibly reaching nearly half of Southern black pupils. To my knowledge, no attempt
has been made to estimate the program’s effects and little research, even of an historical nature,
exists.1
In the following I use novel county-level data created from recently archived administrative
records from the Jeanes Fund to estimate the program’s impact on enrollment and literacy
measured in the Decennial Census from 1900-1930. I combine these data with records from the
Rosenwald Fund to estimate the impact of each program through 1930, exploiting variation in
timing, location and level of treatment across counties and birth cohorts. I take advantage of the
fact that each program targeted only black students by differencing off the white population,
effectively estimating impacts on black-white gaps, allowing me to control for county fixed effects
and state-cohort time trends. Variation in both the timing and nature of these two efforts allows
me to compare returns on investments in human resources (Jeanes Supervisors) and physical
1See Fultz (1995), Jones (1937), Liston (1928), McCluer (2009) and Pincham (2005) for historical studies ofthe Jeanes program.
2

infrastructure (Rosenwald Schools) as inputs in education when initial resource levels are low.
I find that “full exposure” to a Jeanes Supervisor, ranging from 8 to 14 years of a Supervisor’s
presence in the county by including lags, would have closed the black-white enrollment gap by
approximately 3.5 percentage points and the literacy gap by between 3.5 and 4.3 percentage
points. In relative terms, this is enough to close the baseline enrollment gap of 8.5 percentage
point by roughly 40%, and the baseline literacy gap of 10 percentage points by almost the same
margin. In reality, few if any students experienced this level of “full” exposure. Black children
born between the turn of the century and 1915 in fact had a Jeanes Supervisor for about 3.2
years on average between the time they were born and when they exited middle school. Taking
into account the actual level of exposure Southern black children experienced, I estimate that
the Jeanes program decreased the black-white literacy gap by 1 percentage point, or 5% of the
20 percentage point decrease in the black-white gap between 1900 and 1930.
Importantly, I estimate that each year a Supervisor was in the county increased the like-
lihood of getting a Rosenwald School by 5 percent, and that accounting for the presence of
the Jeanes program reduces estimates of the effect of Rosenwald on enrollment and literacy
by roughly one-third. Ultimately, I use these estimates to calculate per-dollar impacts of both
Jeanes and Rosenwald using archived records of salary and construction costs respectively. I find
that Rosenwald investments yielded higher returns per-dollar spent by between 17 and 42 per-
cent, suggesting that when initial physical resource levels are very low or non-existent, returns
to infrastructure investments can be high.
The remainder of the paper is as follows. Section 2 discusses background on both programs,
relevant literature and historical context; Section 3 describes the data used for analysis; Section
4 lays out the empirical strategy and estimates impacts on enrollment and literacy; Section 5
discusses the relationship between Jeanes Supervisors and the placement of Rosenwald Schools;
Section 6 presents back of the envelope comparisons of dollar-for-dollar impacts; and Section 7
summarizes with suggestions for future research.
2 Background
2.1 Race, Education and Philanthropy in the South
In 1896 the Supreme Court ruled in Plessy v. Ferguson that laws enacted with the explicit
purpose of segregating blacks from whites, known as “separate but equal,” did not violate the
14th Amendment as long as the separate facilities were in fact equal. In reality, the resulting
differences were quite large and it would be another 58 years until the Court would overturn
this ruling in Brown v. Board of Education.
The effects of “separate but equal” were most obvious in education, evidenced in the sub-
standard conditions chronicled by DuBois (1911), Myrdal (1944), Bond (1966) and others. In
comprehensive work on the relationship between race, education and earnings, Margo (1986,
1990) argues that even had educational resources been equalized, black children still would have
3

lagged due to overwhelming differences in family background; what he calls “intergenerational
drag”; Fishback and Baskin (1991) reach a similar conclusion using individual-level from Geor-
gia. There is some evidence of convergence in school quality during this time though. Donohue
et al. (2002) argue that from 1910 to the mid-1930’s black school quality in the South improved,
but much less so relative to whites. Fewer explanations are offered for convergence in schooling
outcomes during these years, when the effects of “Jim Crow” were most harshly felt. Donohue
et al. conclude that schools built by Northern philanthropies, primarily Rosenwald, accounted
for at most one-third of the decrease in the black-white gap between 1910 and 1930, and put
no estimate on the effects of other funds such as Jeanes and Slater.2 The key questions are,
what factors led to this early input convergence, and why did modest input convergence lead to
relatively large gains in achievement?
While the role of philanthropy in these matters has been documented in the historical lit-
erature, attempts at causal estimates of the impacts of these programs on schooling outcomes
are scarce.3 Evidence presented here, in Aaronson and Mazumder (2011), and in Carruthers
and Wanamaker (2013), indicates that Northern philanthropy played an instrumental role in
black education before 1940 supporting both infrastructure and human resources, ultimately
narrowing the black-white attainment gap, and less so the black-white resource gap. Of note,
The George Peabody Fund, which supported Southern education (although primarily not for
blacks) between 1867 and 1914, became a template for American philanthropy. The John F.
Slater Fund similarly donated over 1 million dollars in 1882 to higher education and training
schools for blacks, where much of this money was used for black normal schools and Historically
Black Colleges. Between 1902 and 1964, John D. Rockefeller and Frederick T. Gates donated
several million dollars to various causes in the South benefitting both blacks and whites, includ-
ing agricultural development and state universities. Despite robust support for higher education
and denominational schools for blacks, the Jeanes and Rosenwald Funds would be among the
first to give to secular black primary schools.
2.2 The Jeanes Fund
In 1907 Anna T. Jeanes, a wealthy widow from Pennsylvania with family money from coal
investments, donated 1 million dollars to be used in her words, “solely to the assistance of Rural,
Community, or Country Schools for Southern Negroes, and not for the benefit or use of large
institutions, but for the purpose of rudimentary education.”4 This money became the foundation
of the Rural Negro School Fund, renamed the Anna T. Jeanes Fund a few years later, whose
original board members included Booker T. Washington, William Taft, Hollis Frissell, George
2The authors mistakenly claim that the Jeanes Fund’s activites ended in 1928, which they did not. The JeanesFund was active through 1937 when it merged with remaining money left over from the Rosenwald and SlaterFunds, amongst others, to form the Southern Education Foundation. Jeanes Supervisors were active in the Souththrough the early 1960’s.
3See Eric Anderson and Moss (1999) for an overview of philanthropy, and James Anderson (1978, 1988) for acomprehensive review of black education in the South.
4From Anna Jeanes will (Wright, 1933). Italics are the original author’s (Jeanes’) emphasis.
4

Peabody and Andrew Carnegie.
The first request for money came from Jackson Davis, superintendent of schools in Henrico
County, Virginia. Davis requested funds, $40 per month, to pay Virginia Randolph, a highly
regarded teacher in one of the county’s rural black schools, to help other teachers in the county
improve their schools in a similar fashion. Mrs. Randolph combined an academic education with
training in industrial skills and a strong belief in the importance of well maintained facilities,
much along the lines of Booker T. Washington’s philosophy. This became known as the “Henrico
Plan” and set a template for the Fund’s activities in the early years.5
Between 1909 and 1937, the Jeanes Fund placed trained educators in counties to serve as
“supervising teachers.” Supervisors’ work varied widely from county to county, but a theme
of industrial education and fundraising was prevalent in the early years. Among other tasks,
Supervisors provided teaching support, trained local educators, gave lectures on health and
sanitation, organized canning drives and book clubs, taught courses and raised funds for school
improvements, often this money went to match Rosenwald grants.
Supervisors were each assigned to a county in which they would live and work, and each
of that county’s schools would ostensibly fall under the Supervisor’s purview. Administrative
records from the Jeanes Fund in most cases do not list which schools within a county each
Supervisor attended. Reports and travel expenses indicate that most if not all schools were visited
regularly. The assignment process involved State Agents for Negro Education, Southern whites
sympathetic to black education who served as liaisons between philanthropic organizations and
state and local school districts. Agents worked with the directors of the Fund, local county
superintendents and local schools to seek out and hear appeals for the placement of Jeanes
Supervisors, in addition to Rosenwald Schools. Figure 2 shows the location of Jeanes Supervisors
and Rosenwald Schools through 1930. Supervisors were predominantly female, most were either
former or current teachers with six years of experience on average according to Fund records.
Many of these women were educated at Historically Black Colleges or normal schools; their
salaries varied primarily by location, number of months worked and the difficulty of travel in
their county.
By 1914, five years into the Fund’s activities, 10 percent of Southern counties had a Jeanes
Supervisor working with local schools and just over 15 percent of counties had a Jeanes Super-
visor at some point in the past five years. In the same year, the Jeanes Fund began receiving
matching funds for Supervisors from local school districts. As the Fund progressed, investments
from other philanthropic organizations, including the Rosenwald, Peabody and Slater funds,
augmented the initial endowment. After a few years, the Jeanes Fund begin paying local teach-
ers and Jeanes Supervisors a stipend to attend summer teaching institutes at normal schools and
5Mrs. Randolph would be remembered as the first Jeanes Supervisor and became an icon within theJeanes organization. In 1954 the Virginia Randolph Foundation was established to award scholarships toHenrico County high school students attending a four year college. This fund is still active today. Visithttp://www.varfoundation.org/index.html
5

Historically Black Colleges. By 1920, spending had reached $100,000 annually and by 1930 the
Jeanes Fund had sent trained teachers to over 600 individual Southern counties, nearly one-half
of all Southern counties. Figure 3 shows coverage by county through 1930.
[Figures 2 and 3 about here.]
2.3 The Rosenwald Fund
Julius Rosenwald, a wealthy Chicago businessman and philanthropist, funded the construction
of six rural schools in Alabama in 1912 with the aid of Booker T. Washington. The success of
these schools, the first of which opened in 1914, led to the founding of the Julius Rosenwald Fund
in 1917, with the goal of building rural schools for black communities throughout the South.
Aaronson and Mazumder (2011) undertake a detailed analysis of the program’s impact find-
ing large and significant effects on several outcomes. The authors exploit the rural nature of
Rosenwald Schools and estimate a triple-difference, using the interaction between black, rural
and exposure to a Rosenwald School as their primary measure. They estimate that moving from
no exposure to a Rosenwald School to full exposure between ages 7 and 13, where full exposure
is defined as having enough Rosenwald Schools to house all rural black pupils in a county, close
the enrollment gap by 6.5 percentage points and the literacy gap by 16.5 percentage points
between 1900 and 1930. Using WWII enlistment records, the authors estimate that the effect
of full exposure is a 1.2 to 1.4 year increase in completed schooling and a 0.20 to 0.45 standard
deviation increase on a standardized ability test. It is unclear from the Rosenwald data whether
and to what extent each school building either increased the schooling capacity of the county
or simply provided improved facilities, possibly by consolidating several previously unsuitable
schools. Moreover, it is unclear how teacher supply responded to these changes in both quantity
and quality. The authors do find that the program’s effects are largest in counties with initially
low enrollment rates in 1900 and 1910. Their analysis does not take into account the Jeanes
Fund in any way.
The establishment of a matching grant was a major factor in the longevity and success
of the Rosenwald Fund. It not only required counties to increase funding levels for black ed-
ucation, an unlikely prospect in the program’s absence, but also guaranteed that the schools
would be maintained by the community after the program’s initial funding ceased. Rosenwald
Schools were required to meet minimum standards, including a required length of school term,
satisfactory teaching resources and at least two sanitary facilities, all of which were significant
improvements on existing conditions. By 1927, additional Rosenwald funds were used to build
libraries, extend school terms, and in some cases provide transportation for students to consol-
idated schools. Funds were raised by local communities, primarily through taxes and in large
part from contributions made by the local black community, and less so from whites. In many
cases, Jeanes Supervisors were instrumental in helping secure local funds to meet Rosenwald’s
matching criteria, which typically required local counties to raise 85% of funds.
6

Carruthers and Wanamaker (2013) estimate the impact of Rosenwald Schools on public
school resources during that time, concluding that although Rosenwald school construction led
to short term improvements for black students, some of these funds were diverted to serve
white students mitigating long-term relative impacts on black-white spending differentials. They
estimate that each private dollar contributed led to an additional $2.12 of public spending on
black and white schools, $1.34 of which, 63%, went to white schools. The authors ultimately
conclude that although the black-white school spending gap decreased less than dollar for dollar
from private funds, these expenditures had a relatively larger impact on black students, likely
due to very low initial levels of public investment.
3 Data
3.1 Census data
I estimate the impact of the Jeanes Fund on both enrollment and literacy in the Decennial
Census, 1900-1930.6 The 1900 and 1920 samples are 1-in-100 nationally representative samples
while the 1910 sample includes a 1.4% oversample of blacks and the 1930 is a 1-in-20 sample,
thus sampling weights are applied. The Census in these years was taken in person and allowed
for proxy responses. I use all black and white respondents not living in group quarters with
literacy or enrollment data. I also omit Macon County, Georgia, where the original Rosenwald
Schools were built around Tuskegee University as this was not a typical case. Individual and
family level controls are included to account for heterogeneity across families. Table 1 shows
demographic characteristics for each sample.
[Table 1 about here.]
3.1.1 Enrollment
For respondents ages 6 and older, interviewers ask about enrollment in school between a fixed
date and the interview date. In the 1900 Census, enrollment is defined as having been enrolled
in school between June 1 and the Census date, 1910 refers to enrollment between April 15 and
the Census date, January 1 in 1920, and between April 1 and the Census date in 1930. It is
important to note that enrollment at a given age does not imply that the respondent has been
enrolled in previous years; program effects should therefore be interpreted as each program’s
impact on enrollment in that Census year. Panel A of Figure 4 shows rates by age, race and
Census year. Evident from this figure and Table 1 is that while white enrollment increased
substantially between 1900 and 1910 and then leveled off, black enrollment saw large increases
between 1900 and 1910, and then again between 1910 and 1920. Carruthers and Wanamaker
largely limit their analysis to the effects of Rosenwald Schools build after 1920 as the quality of
these buildings was much higher than those built during the war years. The substantive increase
in black enrollment and closing of the black-white gap between 1910 and 1920, coupled with
6IPUMS; Ruggles, et al. (2010).
7
the fact that the Rosenwald program was not in full effect until after 1920, suggests that other
factors were at play. Amongst candidates such as increasing school funding, northern migration
and evolving social, political and economic conditions of the type mentioned by Margo (1991),
I demonstrate that the Jeanes Fund also played an important role.
3.1.2 Literacy
Literacy is asked of respondents ages 10 and older in each year and is defined by four categories:
Can neither read nor write, Can read but cannot write, Can write but cannot read, Can both
read and write. Few respondents were classified in the second category and very few in the
third. To avoid ambiguity I classify only those who can both read and write as literate. To avoid
confounding effects of enrollment on literacy, and to make results interpretable with respect to
previous work, I estimate literacy for respondents ages 15 and older. This has the added benefit
of abstracting the measure from age as there is little change in literacy for respondents older than
15, while literacy is increasing in these cohorts between ages 10-15. The sample is bounded at
age 22 in order to avoid spurious correlation resulting from high literacy adults moving to Jeanes
or Rosenwald counties. Aaronson and Mazumder in fact find that moving the upper bound to
age 30 weakens the effect of literacy, suggesting that selective migration is not affecting results.
Literacy should be interpreted here as a measure of basic literacy and, unlike enrollment,
is subject to interpretation by Census respondents. By including county fixed effects and main
effects and interactions for age, state and Census year in the primary econometric specification, I
control for differential interpretation across counties and within states over time. As a validation
check, I estimate enrollment rates for four occupations reported by both black and white respon-
dents in each Census year, two of which should have literacy rates of 100 percent (teachers and
clergy), and two that should vary over time (farm workers and farm laborers). Figure 5 shows
mean literacy rates for respondents ages 15 to 45 in these occupations by race and year. The
occupational definitions are taken from the harmonized 1950 occupational classification and do
not vary over time. The consistency of trends both within and across race and occupation over
time support the use of literacy as an outcome measure. Panel B of Figure 4 shows literacy rates
by age, race and Census year.
[Figure 4 about here.]
3.2 The Jeanes Fund
Data for the Jeanes Fund come from the Southern Education Foundation Archive housed in
The Woodruff Library in Atlanta, Georgia. The archive contains an individual record for each
county that had a Jeanes Supervisor, indicating the years in which a Supervisor was present,
the Supervisor’s name, salary paid by the Fund, salary paid by the county if any, and number of
months worked. Data was collected for all Southern states: AL, MS, LA, VA, GA, SC, TN, TX,
NC, MD, AR, KY, FL and OK. Missouri and Delaware were dropped from the final analysis
for inconsistent reporting and lack of treatment variation across counties respectively. Data on
8
salaries were only available for selected states: AL, KY, LA, MS, NC, SC and TN.
In few cases more than one Supervisor was present in a county in a given year in larger
counties. Records do not distinguish if the two or more Supervisors’ terms overlapped or were
consecutive. I assume that Supervisors are perfect substitutes and define treatment as the total
number of months in a given year, thus in some cases this number is greater than 1. Similarly,
in approximately four percent of cases one Supervisor served in two or more small neighboring
counties. I treat these as separate occasions as there is little distinction between two small
neighboring counties and one larger county in terms of Jeanes Supervision. Results are robust
to relaxing either or both of these assumptions.
These records allow me to create a panel of treatment intensity by county from 1909 through
1930. I then match this county level panel to Census records from 1900-1930. From this combined
data I can identify retrospectively at which ages each Census respondent would have been
exposed to a Jeanes Supervisor and the number of treatment months at each age.
Estimating exposure to a Jeanes Supervisor requires assumptions about the rate of depreci-
ation of the impact Jeanes Supervisors had on the quality of education in each county. In the
empirical exercises below I compare different parameterizations of Jeanes exposure that account
for contemporaneous impacts (having a Supervisor in the year enrollment is measured), for
lagged impacts (residual impacts that account for cases where a Supervisor was present in prior
years but not in the current year), plus specifications that assume the impacts of a Supervisor’s
presence decay at a various rates of depreciation. These specifications assume i) that impacts are
increasing in the number of years a Supervisor was present in a given county, and ii) that once
a Supervisor leaves, there are residual effects that linger for some number of years following.
Details of each exposure measure are described in each empirical specification.
Data for the Jeanes Fund was not present in the archive for 6 states in years 1928-1930. I
use Jeanes presence in previous years and Rosenwald presence in previous and subsequent years
along with several county specific measures to impute the likelihood that theses counties had a
Supervisor and the number of months. Details of the imputation are provided in the Appendix.
Robustness checks will show that results are not sensitive to the omission of these states in these
years.
3.3 The Rosenwald Fund
Data for the Rosenwald Fund were created by Aaronson and Mazumder (2011) from digitized
archives at Fisk University containing detailed records of all Rosenwald Schools created through
1931, including location by county, date of completion and teacher and student capacity. The
authors calculate the number of students that could be accommodated by each school by mul-
tiplying the number of classrooms by 45. They then calculate the number of black school-age
children in the county using searches on www.ancestry.com, which contains full Census counts by
race and year of birth from years 1900-1930. The authors calculate their exposure measure using
the share of black, rural children who could be accommodated in each county. In the following
9

I use the share of all black students since the Jeanes fund targeted the entire county and I do
not difference off of the rural population. Sensitivity checks show that this decision does not
affect the relative contributions of Jeanes and Rosenwald on either outcome, but does make the
estimate of each program larger than if I only use the share of rural black children.
Records for the Rosenwald Fund specify where but not when Rosenwald Schools built between
1914 and 1919 were constructed. Most were likely built after 1916-17, when the Fund was
officially incorporated, and likely in 1919-1920 after price declines following WWI. Carruthers
and Wanamaker (2013) limit their analysis to schools completed on or after 1920 as historical
documentation indicates that Rosenwald Schools built prior to 1920 were of inferior quality.
Similar to Aaronson and Mazumder, I assign these Schools a completion date of 1919 to avoid
assigning treatment to untreated individuals. This does not significantly impact the estimation
of enrollment effects, as having a Rosenwald School in the Census year accounts for nearly the
entire impact of the program and there are no Schools unaccounted for by 1920.
3.4 Exposure
Table 2 shows levels of exposure to both Jeanes Supervisors and Rosenwald Schools for black
school aged students (7-14) in each Census year. The measure Jeanes At Census shows the
share of black children ages 7-14 living in a county with a Jeanes Supervisor in each Census
year. Column 2 shows that as early as 1910, 16 percent of black southern children were living
in a county with a Jeanes Supervisor. By 1920, 38 percent of children lived in a county with a
Supervisor, and by 1930, 43.5 percent of Black children lived in a county currently served by
Jeanes. Similarly the second measure, Jeanes Ever, shows the share of black children living in
a county that had ever had a Jeanes Supervisor by each Census year. By 1930, two-thirds of
black children between 7 and 14 lived in a county that had a Supervisor at some point since
1909. Since Jeanes and Rosenwald focused on counties with large black populations, the share
of children treated by the Jeanes and Rosenwald philanthropies was substantially larger than
the share of counties that saw these programs.
Next, Months Ever / 9 in Table 2 shows the average cumulative number of months Jeanes
Supervisors had been present since 1909 divided by 9 to make the measure such that a one unit
change is equivalent to a school year’s worth of exposure. I estimate that in 1920, on average,
black children lived in counties that had a Supervisor for 2.5 years since 1909, and that by 1930
this rose to an average of 6.8 years of cumulative treatment. Similarly, Years of Jeanes shows
the average cumulative years in which a Supervisor was present in each respondent’s county
regardless of the number of months. When present, Supervisors averaged 8-9 months of work in
a county, which is reflected in similarity between Years of Jeanes and Months Ever / 9. These
measures show that in 1910, on average 19% of black students lived in a county that had ever had
a Supervisor, and that by 1930 fully 66% of black children lived in a county that was ever visited
by a Supervisor. The discrepancy between Jeanes At Census and the cumulative measures below
is informative insofar the impact of a Supervisor may last beyond her presence in the county. To
10

illustrate, although in 1920 on average black students lived in counties that had been visited by
a Supervisor on 3 separate occasions (Years of Jeanes), only 38% of students currently lived in a
county with a Supervisor present (Jeanes at Census). The econometric exercises below attempt
to accurately capture this relationship.
The last two elements of Table 2 show average exposure to Rosenwald Schools for black
students. Any Rosenwald At Census shows the share of black students living in a county with a
Rosenwald School by each census year, and Rosenwald Coverage At Census shows, on average,
the share of black students that could be accommodated by Rosenwald Schools. For example by
1930, 89% of black students lived in a county with a Rosenwald School, and on average black
students lived in a county where Rosenwald Schools could accommodate 24.4% of black students.
[Table 2 about here.]
3.5 Placement of Jeanes Supervisors and Rosenwald Schools
A central concern to the identification strategy is the selective placement of Supervisors and
Schools across counties. To address this I test for pre-existing trends in black enrollment, and
in the black-white enrollment gap, in counties that received Jeanes and/or Rosenwald by 1920
compared with those that did not. Table 3 shows results from a pooled regression of enrollment
on treatment indicators, state level time trends and a full set of individual level controls for
respondents ages 7-14 in Census years 1900 and 1910.
In column 1 I begin with enrollment trends for black children only. Jeanes 1920 is the
number of years a Supervisor was in the county by 1920, and Rose 1920 is a dummy indicating if
a Rosenwald School was built in that county by 1920; Year 1910 is an indicator for Census year
1910. Results in column 1 suggest that conditional on a full set of individual level covariates and
state and birth year dummies, there were no enrollment trend differences for black children in
counties that did and did not receive Jeanes Supervisors or Rosenwald Schools.
In column 2, I test for trends in the black-white gap by interacting dummies for black
and Census year 1910 with the pre-treatment indicators. The coefficient on Rose 1920*Year
1910, 0.096, indicates that enrollment for white students was increasing in counties receiving
a Rosenwald School by 1920. The negative coefficient on Black*Rose2 190* Year 1910, -0.113,
suggests that the black-white gap in enrollment in counties that received a Rosenwald School by
1920 was widening compared to those that did not receive a school. There is no evidence of a pre-
treatment effect for the number of years a Jeanes Supervisor would be present by 1920. Taken
together, there is some evidence confirming results in Aaronson and Mazumder that Rosenwald
Schools were targeting counties with initially low enrollment, or widening enrollment gaps, while
there is little evidence in trend differences for Jeanes.
A separate issue concerns the relationship between having a Jeanes Supervisor and a Rosen-
wald School. The few existing historical studies on Jeanes Supervisors suggest that a large part
of what Jeanes Supervisors did was raise money for Rosenwald Schools. This raises concerns
that estimated impacts from exposure to Jeanes Supervisors reflect both the direct impact of
11
Jeanes Supervisors on black-white schooling gaps, and the impact Jeanes Supervisors had on
increasing the likelihood of raising sufficient funds for a Rosenwald School. I address the exact
nature of this relationship in Section 5.
[Table 3 about here.]
4 Main estimationTo estimate effects of each program, I define “treatment” in terms of exposure to either Jeanes
Supervisors or Rosenwald Schools. This exposure measure is defined differently for each program
and for each outcome, enrollment and literacy. This is necessary for several reasons. First, I
assume enrollment is only affected by the level of treatment in the current Census year. In the
case of Rosenwald Schools, this means having a school in one’s county last year has no effect on
enrollment this year, once I take into account the fact that the presence of a Rosenwald school
in year t-1 naturally implies presence in year t (i.e. schools are fixed objects). Yet, this same
reasoning cannot not apply to exposure to Jeanes Supervisors. Since, unlike schools, Supervisors
can come and go in a county, the presence of a Supervisor in year t-1 does not necessarily imply
that the same Supervisor was there in year t. Thus, when defining exposure to Jeanes, I take
into account lagged treatment effects. For example, a Supervisor may have been in a county in
year t-2, but not in year t-1 or in year t. This does not mean that there is no impact of the
Jeanes program in year t on enrollment, it simply implies that impacts will be the result of
residual effects from Jeanes presence two years prior. In empirical exercises, this requires taking
into account that the impacts in year t from the presence of a Supervisor in some year t-τ will
depreciate over time.
Estimating impacts on literacy requires a slightly different parameterization, though the same
principles apply. Literacy, which is measured post-schooling, is the result of cumulative exposure
to each program. Therefore, to measure exposure over the lifetime, I quantify exposure at each
age and average over the schooling years. For Rosenwald, this means measuring Rosenwald
coverage at each age and averaging over ages 7-14 (as in Aaronson and Mazumder). For Jeanes,
this means taking exposure at each age, including depreciated exposure as described above, and
averaging over the schooling years. Details of these measures are described below.
The empirical strategy relies on variation in the placement of Supervisors and Schools across
counties over time. To identify program effects, I exploit variation in exposure to each “treat-
ment” as a function of what year Census respondents were born and which county they lived in.
A main concern is that the placement of Supervisors or Schools is not random. To address this,
I difference effects off of the white population, who were not beneficiaries of these programs,
allowing me to include county fixed effects in regression models. The result is a difference-in-
differences model where I estimate effects on the black-white gap in enrollment and literacy
across children who were exposed to more or fewer years of Jeanes and Rosenwald.
12
At its most basic, I estimate versions of the following:
yibct = α+ β1Blacki + γ1f(Rosebct) + γ2f(Jeanesbct) (1)
+ δ1Blacki∗f(Rosebct) + δ2Blacki∗f(Jeanesbct) +XiΩ + ϕt + θc + ψbst + εibct
Where Rose is a measure of exposure to Rosenwald Schools and Jeanes is a measure of exposure
to Jeanes Supervisors. Xi is a vector of individual level controls, including: female, a quadratic
in age, farm status, home ownership, dummies for metropolitan status, dummies for mother’s
and father’s literacy and a quadratic in mother’s age at first birth, which are not reported for
parsimony. ϕt are indicators for Census year, θc is a set of county fixed effects, and ψbst includes
a full set of interactions between age (b), state (s) and year (t). Taken together, these control for
state by birth-cohort trends in enrollment, and difference out unobserved time-invariant county
level effects. εibct is an idiosyncratic error term, and standard errors are clustered on counties in
all specifications. As described below, I test several definitions of both Rose and Jeanes to avoid
arbitrary assumptions about the relationship between exposure to the treatment and outcomes.
4.1 Estimating impacts on enrollment
I begin by estimating impacts of Jeanes and Rosenwald presence on the black-white enrollment
gap between 1900-1930. Aaronson and Mazumder have the benefit of exploiting the rural nature
of the Rosenwald program, as it specifically targeted rural schools. Thus they estimate a triple
difference, including interactions between Black∗Rural∗Rosenwald, allowing them to include
county-by-year fixed effects. Since Jeanes Supervisors ostensibly were responsible for entire coun-
ties, and since their work included raising funds, assuming that non-rural areas were untreated
is inappropriate here; thus, I restrict my analysis to a difference-in-differences estimate using
the black-white gap. I use data provided by Aaronson and Mazumder to measure Rosenwald
exposure, which they define as the share of rural black students ages 7-17 in a given county, c,
that could have been housed by all existing Rosenwald Schools in each Census year, t. Since I
am not differencing off of the rural population, I define exposure simply as the share of all black
students that could have been accommodated by existing Rosenwald Schools.
Rosect =# Rosenwald classroomsct ∗ 45
# black studentsct(2)
Moving from 0 to 1 on this measure then shows the effect of going from a county with no
Rosenwald Schools to one with enough Rosenwald Schools to house all black students. Dividing
by all black students, rather than only rural black students, increases the estimated impact of
Rosenwald Schools since more students are assigned treatment, fewer of whom likely received it.
Yet, Aaronson and Mazumder do find that non-rural black students also benefited from exposure
to Rosenwald Schools, and that the non-rural black-white gap declined with exposure as well.
Given that schools could not restrict non-rural students from attending, that most students lived
13
in rural areas, and that Jeanes affected the entire county, this specification seems appropriate.
Sensitivity checks show that reestimating impacts using the number of rural black students have
no effect on the relative effects of Jeanes and Rosenwald on either enrollment or literacy.
Because Supervisors can come and go in a county over time, simply measuring the impact
of the existence of a Supervisor in a given census year will not accurately capture the degree to
which that Supervisor affected enrollment. For example, if a Supervisor was present in a county
in 1919, and during that year she conducted teacher training and secured resources for local
black schools, even if she subsequently left before the 1920 school year, her presence may have
had lasting impacts. To capture this relationship I begin by creating two measures of exposure
to Jeanes. The first, is an indicator equal to 1 if there is a Jeanes Supervisor in county c in census
year t, 1[Jeanes Census]ct in Equation 3. I then create a continuous measure of the cumulative
number of school years (equal to total number of months/9) a Supervisor has been present in
the county up until census year t, termed Jeanes Y earsct below. Taken together these measures
account for contemporaneous and lagged impacts of Jeanes Supervisors on student enrollment.
In the full specification, which also includes measures of exposure to Rosenwald Schools and a
full set of interactions between both exposure measures and an indicator for black, treatment
impacts are interpreted as effects of exposure to Rosenwald and/or Jeanes on the black-white
gap in schooling with county and state-cohort fixed effects differenced out. The full specification
in terms is as follows:
Enrolledibct = α+ βBlacki + γ11[Jeanes Census]ct + δ1Black∗1[Jeanes Census]ct
+ γ2Jeanes Y earsct + δ2Blacki∗Jeanes Y earsct (3)
+ γ3Rosebct + δ3Blacki∗Rosebct +XiΩ + ϕt + θc + ψbst + εibct.
Results from Equation 3, estimated using a linear probability model, are shown in Table 4 below;
the sample is composed of census respondents ages 7-14 in census years 1900-1930. For reference,
column 1 shows that the black-white gap in enrollment during this time, conditional only on
county, age and cohort-by-state effects, was 13.8 percentage points. Adding controls for individ-
ual characteristics in column 2 reduces this gap by more than half, to 7.1 percentage points.
The coefficient on Black∗Rose in column 3 indicates that without accounting for the presence
of Jeanes Supervisors, having enough Rosenwald Schools to house all black students in a county
would have increased enrollment for blacks relative to whites by 11.8 percentage points, similar
to diff-in-diff estimates found in Aaronson & Mazumder (2011). Adding only a binary indica-
tor for the presence of a Jeanes Supervisor in the census year in column 4, 1[Jeanes Census],
suggests that the presence of a Supervisor decreased the black-white enrollment gap by 2.2 per-
centage points. Moreover, simply accounting for Jeanes presence in each Census year lowers the
estimated impact of Rosenwald by 1.7 percentage points, or about 14 percent.
In column 5 I drop the binary indicator for Jeanes in the Census year and add a measure
14
of the cumulative school years of Jeanes exposure up until, but not including, Census year t.
This specification is meant to set up the full model in column 6. If it is the case that the Jeanes
Supervisors only affect enrollment in the contemporaneous year, then accounting for treatment
in years prior to Census year t will have no impact on the coefficient on Black∗1[Jeanes Census]
as we move from column 4 to column 6. If, on the other hand, it is the case that Jeanes presence in
prior years has staying power, then we should expect the coefficient on Black∗1[Jeanes Census]
to move toward 0 moving from columns 4 to 6, and the coefficient on Black∗Jeanes Y ears to
be relatively unchanged as we move from column 5 to column 6. The realization of this exercise
suggests that the impact of Jeanes Supervisors in prior years has staying power and retains a
measurable effect on enrollment even when Jeanes presence in the current year is accounted for.
Moreover, I find that once this residual treatment is accounted for, the impact of a Supervisor in
the current year is positive, but not statistically distinguishable from zero. That is, accounting
for Jeanes presence in years prior to Census year t reduces the estimated impact of having
a Supervisor in year t from 2.2 percentage points to 0.7 percentage points and is no longer
statistically significant. On the other hand, accounting for presence in the current year has no
impact on the estimated effect of each additional year of presence prior to year t. This exercise
suggests that accounting for lagged treatment is important in accurately estimating the effects
of the Jeanes program on both enrollment and likely literacy as well. Importantly, this set of
regressions also shows the degree to which impacts of Rosenwald Schools on enrollment are
overestimated by not accounting for the Jeanes program. Differences in point estimates across
specifications show that accounting for Jeanes reduces the estimate effect of full exposure to
Rosenwald from 11.8 percentage points to 7.7, or by roughly one-third.
These estimates suggest that the impact of Jeanes Supervisors is increasing in cumulative
years of presence, on the order of about a 1 percentage point decrease in the black-white gap
for every 3 to 4 years a supervisor was in the county. This interpretation makes sense if we
think that there are lasting impacts of the work that Supervisors undertook. Yet, this basic
specification treats each year a Supervisor was in the county equally, regardless of how long
in the past the treatment occurred. That is, as measured in 1920 for example, this simple
linear specification applies the same level of exposure to a Census respondent living in a county
where a Supervisor was present only in 1919 the same as a respondent in a county where a
Supervisor was present only in 1909. This would only be correct in the case where there is no
depreciation of the services that Jeanes Supervisors undertook – an unlikely scenario. Thus, a
more detailed specification should fully take into account three elements: first, that the work of
Jeanes Supervisors, such as training, materials or support, likely has lasting effects even after a
Supervisor is no longer present; second, that impacts increase with each additional year a Jeanes
Supervisor was in a county; and third, that these impacts may depreciate (or accumulate) over
time. Thus, estimating impacts from exposure to Jeanes Supervisors requires taking into account
both the rate of depreciation and cumulative years treatment. Whether and to what rate these
15

effects accrue and/or depreciate is unknown. For example, teacher training might have lingering
effects for several years, or might even proliferate from teacher to teacher, but might also be
mooted by high teacher turnover. If Supervisors only visited each county once, one could then
estimate the rate of depreciation using variation in the timing of the Supervisor’s presence
relative to the census year in question. But, since Supervisors were present over a number of
years, their impact in any one year might be a product of their presence in that year plus
the cumulative impact of all of the years a Supervisor was there before. One could also try to
estimate the impact of lagged exposure by estimating a regression with a series of lagged inputs
on the right hand side. But, since the likelihood of having a Supervisor in any one year is highly
correlated with the likelihood of having on in the prior or subsequent year, estimates are not
well identified in empirical exercises. In fact, only 6 percent of districts with no Jeanes presence
in year t have a Supervisor in year t + 1, and only 13 percent of districts with a Supervisor in
year t do not have one the following year.
In lieu of a series of lags, I create two composite measures of exposure to Jeanes Supervisors
in a manner more refined than those in Equation 3. In this case, rather than including a simple
indicator for Jeanes presence in the current Census year, I define Jeanes LagLc,t in Equation 4
below as the total number of school years a Supervisor was present in county c in census year
t over the past L years. For example, a lag of L=1 would count the number of years in the
current Census year plus one lag, and a lag of L=0 would just include the number of years in
the current Census year. Then, I create an analogous measure of cumulative exposure in the
years between 1909 and year t−L, termed Jeanes Pre LagLc,t. This is equal to the number
of years a Supervisor was present in the years between the beginning of the program (1909)
up until the last year of the lag included in Jeanes LagLc,t. The purpose of this exercise is to
empirically determine how many lags are relevant without assuming, a priori, any particular
rate of depreciation. That is, δ1 in regression Equation 5 below tells us the decrease in the
black-white enrollment gap for each year a Jeanes Supervisor was in the county over the past L
years, conditional on the number of years a Supervisor was present in the county between 1909
and the beginning of the lag. In a series of regression equations, I will sequentially increase the
number of lags included in Jeanes LagLc,t, which mechanically decreases the number of years
included in Jeanes Pre LagLc,t, until the coefficient on Jeanes Pre LagLc,t is no longer relevant.
Jeanes LagLc,t and Jeanes Pre LagLc,t are defined as follows:
Jeanes LagLc,t =
L∑l=0
monthst−l9
; Jeanes Pre LagLc,t =t−1909∑l=L+1
monthst−l9
(4)
16
over lag lengths L = 1 . . . 6. These measures are then included in the full specification below:
Enrolledibct = α+ βBlacki (5)
+ γ1Jeanes LagLct + δ1Black∗Jeanes LagLct
+ γ2Jeanes Pre LagLct + δ2Blacki∗Jeanes Pre LagLct
+ γ3Rosect + δ3Blacki∗Rosect+XiΩ + ϕt + θc + ψbst + εibct
iterated over lag lengths L = 1 . . . 6
Estimates from Equation 5 are presented in Table 5 below. Moving across rows shows estimates
from separate regressions of different lag and pre-lag lengths; means of the two Jeanes exposure
measures for black children are shown at the bottom of each panel for reference. For example
column 1 shows results for a lag length of 1, meaning that Jeanes LagL=1c,t includes the number
of school years a Supervisor was in a county in the current Census year plus a lag of 1 (i.e.
1930 and 1929 for Census year 1930), and Jeanes Pre LagL=1c,t then includes the total number
of school years a Supervisor was present beginning in 1909 up until the current Census year
plus a lag of 1 (i.e. all years between 1909 through 1928 in Census year 1930). The coefficient
on Black∗Jeanes Pre Lag, 0.002, suggests a 0.2 percentage point decrease in the black-white
enrollment gap for every year a Supervisor was present between 1909 and two years before
the current Census. The coefficient on Black ∗ Jeanes Lag in column 1 is not statistically
distinguishable from zero, suggesting that once a long history of Jeanes presence is accounted
for, contemporaneous effects are difficult to distinguish.
The purpose of Table 5 is to determine at what point prior presence of Jeanes Supervisors no
longer impacts contemporaneous enrollment. Empirically, this is when Black∗Jeanes Pre Lagno longer predicts enrollment, conditional on Black∗Jeanes Lag. Economically, this is important
for calculating back of the envelope gains per dollar spent. Moving across columns and comparing
coefficients suggests that once 6 lags are included, meaning the current year plus 6 prior lags,
the impact of Jeanes presence in prior years does not predict enrollment in the current Census
year. Taking column 6 as the preferred specification suggests that each school year a Jeanes
Supervisor was present in a county closed the black-white enrollment gap by 0.5 percentage
points. If we define “full exposure” as having a Supervisor for an average of 9 months over each
of the past 7 years (the current Census year plus 6 lags), we can then say that full exposure
would have decreased the enrollment gap by 3.5 percentage points. In comparative terms, this
suggests that full exposure to Jeanes, or 7 consecutive years of Jeanes presence, would have
closed the enrollment gap by roughly one-half as much as enough Rosenwald Schools to house
all black rural students would have done. In other words, it does not appear that full exposure
to Jeanes could have achieved the same increase in enrollment as new or improved schools would
have.
17
While this tells us what the effect of full exposure would have been, multiplying the treatment
effect by the average amount of treatment black Census respondents experienced will give us the
impact of the program on the actual enrollment gap. Using the means provided at the bottom of
the table, on average black respondents lived in counties where Jeanes Supervisors were present
for 2.15 of the past 7 school years. Multiplying this by the treatment effect suggests that on
average the program closed the black-white enrollment gap by approximately 1 percentage point,
or approximately 6.7 percent of the unconditional (15 percentage point) black-white enrollment
gap in 1910.
[Table 5 about here.]
The specification above does not apply a rate of depreciation but rather infers a rate by
empirically estimating how long treatment lingers. Another way to do this would be to assume a
rate of depreciation and apply this to the treatment measure. While we might have prior beliefs
about the rate of depreciation of physical capital, for example, there is little benchmark for the
rate of depreciation of teacher support. In fact one could argue in this case for an accumulative
effect; for example, if a Supervisor’s tasks include teaching how to design a curriculum, the
regular teachers in the county might become more proficient in this skill every year, even in the
Supervisor’s subsequence absence. While in my preferred specification above I am agnostic on
the rate of depreciation, as a specification check I re-estimate these models assuming various
different rates of depreciation. In this case, I re-define Jeanes Lag and Jeanes Pre Lag as
follows:
Jeanes LagL,ρc,t =
L∑l=0
monthst−l9
∗(1 − ρ)l (6)
Jeanes Pre LagL,ρc,t =t−1909∑l=L+1
monthst−l9
∗(1 − ρ)l
For L = 1 . . . 6 and ρ = 0.1, 0.3, 0.5
Thus, when ρ = 0, Jeanes LagL,ρc,t would be the same as in the prior specification. When 0<ρ<1,
Jeanes LagL,ρc,t measures the cumulative depreciated number of months a Supervisor was present,
assuming that treatment depreciates at rate equal to ρ. Assuming ρ = 1 implies that there is no
residual impact of Jeanes presence and that only the contemporaneous year matters, as was the
case in Table 4 when only an indicator for presence in the current Census year was included. I
then re-estimate the Equation 5 including these new terms. Results are shown in Table 6 below.
Since estimates for main effects and the impact of Rosenwald are substantively unchanged by
this re-parameterization, I omit them for brevity.7
7I do not apply depreciation to Rosenwald Schools for two reasons, first to be consistent with previous workas depreciation rates are not applied in Aaronson and Mazumder, and second because construction of RosenwaldSchools were predicated on counties maintaining the schools over time.
18
Using the same method of identifying the appropriate lag length applied above to Table 6
suggests that at a depreciation rate of 10%, 5 lags are relevant; at a depreciation rate of 30%, 5
lags are relevant; and at a depreciation rate of 50%, 6 lags are relevant. These indicate treatment
effects from ranging between 1 percentage points at a 10% depreciation rate and 0.9 percent-
age points at a 50% rate of depreciation, suggesting that estimates not explicitly applying a
presupposed rate of depreciation in Table 5 are accurate.
[Table 6 about here.]
4.2 Estimating impacts on literacy
Estimating and comparing impacts of Jeanes Supervisors and Rosenwald Schools on literacy is
more straightforward than for enrollment as literacy is a cumulative process with treatment ap-
plied retrospectively. Moreover, while enrollment is not an end in itself, literacy is a better metric
for educational gains. To estimate impacts I follow specifications by Aaronson and Mazumder
and define Rosenwald exposure as the average exposure to Rosenwald Schools a student expe-
rienced over ages 7-14.8 That is, for each respondent age 15-22 in Census year t in county c, I
calculate exposure at each age a and average over ages 7-14 as described in Equation 7 below.
Moving from 0 to 1 on this measure is equivalent to going from no Rosenwald Schools to having
enough Rosenwald classrooms to accommodate all black children in a respondent’s county for
every year between ages 7 and age 14.
Rose7−14 =1
8
14∑a=7
# Rosenwald classroomsca∗45
# black studentsca(7)
Similarly, I begin with a measure of Jeanes exposure that approximates the Rosenwald exposure
variable. This measures the total number of school years (months/9) a Supervisor was present
in the respondent’s county between ages 7-14. Dividing this by 8, for ages 7-14, measures the
share of schooling years a supervisor was present. Thus, moving from 0 to 1 on this measure is
equivalent to having a Jeanes Supervisor for an average of 9 months for all schooling years.9
Jeanes7−14 =1
8
14∑a=7
Monthsca9
(8)
8Aaronson and Mazumder use 7-13 because they don’t know which schools built after 1926 were high schools.Their results are not changed by using 7-17. I add age 14 to be consistent with the ages over which outcomes aremeasured. Results are not substantively different here either.
9For fewer than 1 percent of the sample, Jeanes exposure is greater than 1. This results from the case whereon average a Supervisor was in a county for more than 9 months per year. In some cases, Supervisors did workduring summer months as well, including their own inservice programs at Historically Black Colleges.
19
I then estimate the following equation:
Yibct = α+Blackiβ1 + γ1Jeanesbct + γ2Rosebct (9)
+ δ1Blacki∗Jeanesbct + δ2Blacki∗Rosebct +XiΩ + ϕt + θc + ψbst + εibct.
Notice that in Equation 9 above both treatment measures are indexed by county c, Census year,
t, and birth cohort, b, unlike the enrollment measures which were only indexed by c and t. Unlike
the case for enrollment where treatment was measured in the current Census year, treatment
for literacy is measured retrospectively in terms of cumulative exposure. Thus children in the
same county born in different years may have experienced different levels of exposure, allowing
treatment effects to be estimated off of both across and within county differences. Results from
Equation 9 are shown in Table 7. I begin by showing the black-white gap in literacy for 15-22
year olds in the 1910-1930 Censuses in column 1,10 which includes only age-by-year-by-state
and county fixed effects (ϕt + θc + ψbst), and in column 2, which adds controls for individual
demographics (Xi). The inclusion of these individual-level covariates reduces the black-white
literacy gap from 14.2 to 9.3 percentage points. In column 3 I include Rosenwald exposure
and an interaction with black. Estimates in column 3 suggest that, without accounting for
Jeanes, full exposure to Rosenwald would have closed the black-white literacy gap by about
18.7 percentage points. Repeating this exercise for Jeanes in column 4 suggests that, without
accounting for Rosenwald Schools in the regression model, having a Jeanes Supervisor for an
average of 9 months per year from ages 7-14 would have closed the black-white literacy gap by
4.9 percentage points. Including both measures in the full model in column 5 suggests that full
exposure to Rosenwald would have closed the black-white gap by 13.6 percentage points, and
full exposure to Jeanes would have closed the gap by 3.5 percentage points.
This final specification highlights two key results. First, that full exposure to Jeanes Su-
pervisors would have decreased the black-white literacy gap by 3.5 percentage points even af-
ter accounting for the presence of Rosenwald Schools, under the identifying assumption that
conditional on county fixed effects and age-by-year-by-state trends, the placement of Jeanes
Supervisors and Rosenwald Schools are independent of the black-white gap. Second, that the
initial estimated treatment effect of exposure to Rosenwald Schools, 18.7 percentage points in
the difference-in-difference specification shown here, is reduced by roughly one-third to 13.6
percentage points by accounting for exposure to Jeanes.
[Table 7 about here.]
While this simple parameterization of Jeanes exposure is useful in estimating impacts of
contemporaneous exposure to Jeanes Supervisors, i.e. while students are school-age, and for
10Since literacy is measures beginning at age 15, no respondents in the 1910 Census were exposed to eithertreatment. Thus I only use one pre-treatment Census wave, 1910, and omit 1900. Results are similar with theirinclusion.
20
assessing how accounting for Jeanes affects estimates of the impact of the Rosenwald program,
it fails to account for residual effects of Jeanes Supervisors in the years prior to ages 7-14 of
the type described for enrollment. In other words, if a Census respondent had a Supervisor in
her county at ages 5 and 6 but never again, the measure Jeanes included in Equation 9 above
would be 0. Yet, models specifying residual impacts on enrollment suggest that lags up to 6
years are relevant. Similarly, this parameterization fails to account for the fact that if hysteresis
exists, exposure only at age 7, e.g., should have larger effects than exposure only at age 14, all
else equal. Accordingly, I respecify the model above to account for residual effects in a manner
similar to that for enrollment, defined as follows:
JeanesL =
(1
L+1
)(1
8
) 14∑a=7
L∑l=0
Monthsc,(a−l)
9(10)
for lag lengeths L = 1. . . 6
To create a full exposure measure, I first divide by what full exposure would be at each age
(L+1), and then divide by 8 to average over schooling ages as above. Full exposure should now
be interpreted as having a Supervisor on average for 9 months at each age and for an average
of 9 months in each of the L years prior. Thus, moving from 0 to 1 when L=1 is equivalent
to having no Jeans Supervisors to having one for an average of 9 months at each age 6-14. For
L=2, an average of 9 months at each age 5-14, and for L=6, an average of 9 months at each age
1-14. The purpose of this exercise is to test how sensitive estimates are to different assumptions
about how long effects of Supervisors linger.
Using this definition of Jeanes exposure I reestimate Equation 9 above iterating over lag
lengths L = 1 . . . 6 for person i in birth cohort b in county c in census year t:
Yibct = α+Blackiβ1 + γ1JeanesLbct + γ2Rosebct (11)
+ δ1Blacki∗JeanesLbct + δ2Blacki∗Rosebct +XiΩ + ϕt + θc + ψbst + εibct
over lags L = 1 . . . 6
Comparing differences in δ1 across different lag lengths shows how effects vary with the inclusion
of each additional lag in assigning exposure. Results from Equation 11 are shown in Table 8
below. Each column replicates the full model with different numbers of lags included in JeanesL.
For example, the coefficient on Black∗JeanesL in column 1 indicates that having a Supervisor
for an average of 9 months over ages 6-14 would have closed the black-white literacy gap by
3.6 percentage points, nearly identical to the 3.5 percentage point decrease in Table 7. Moving
across rows shows that in fact estimates without including lags were biased upwards. That is,
comparing column 5 of Table 7 with column 6 of Table 8 shows that when exposure is measured
only over ages 7-14, having a Supervisor for all 8 years would have closed the literacy gap by 3.5
percentage points, or 0.44 percentage points per year. Yet, when measuring exposure over ages
21
1-14, having a Supervisor over all 14 years would have closed the gap by 4.3 percentage points,
or 0.3 percentage points per year. While there is no way to determine, statistically, which of
these parameterizations is “correct”, we can use the range to determine upper and lower bounds
on the effect (per-dollar) of Jeanes Supervisors. I take the conservative estimate in column 6 of
Table 8 as my preferred specification.
[Table 8 about here.]
4.3 Specification checks
To ensure that these results are not sensitive to decision rules or sample definitions, I estimate
a series of robustness checks, shown in Table 9. The first column replicates column 6 of Table 8,
indicating a 3.6 percentage point decrease in the black-white literacy gap from full exposure with
full treatment including 6 lags. In column 2 I then reestimate the same specification where Rose,
defined in Equation 7 as the share of all black children in the county who could be accommodated
by Rosenwald Schools, is now share of all rural black children who could be accommodated as in
Aaronson and Mazumder (2011). While this decreases the estimated impact of both Rosenwald
and Jeanes on literacy by 1.8 and 0.7 percentage points, or 14 and 16 percent, respectively, the
relative contribution of Jeanes compared to Rosenwald is essentially unchanged. In column 3
I drop states for which results Jeanes presence was imputed in years 1928-1930, the result of
which increases the estimated impact of Jeanes treatment to a 5.7 percentage point decrease in
the black-white literacy gap. In column 4 I drop respondents who were school-age in 1917 or
1918 and who lived in counties where Rosenwald Schools and Jeanes Supervisors were present
by 1919. These children lived in counties where the timing of Rosenwald School construction
was unknown (though most likely in 1919), meaning I might have applied treatment only to
Jeanes when in fact they were also treated by Rosenwald as well. The result of omitting these
respondents again slightly increases the estimated impact of Jeanes, suggesting that this was
not the case. In column 5 I restrict the sample only to rural respondents as the Rosenwald
focused on rural school construction, while the Jeanes program was not, though it favored rural
counties. The result of omitting non-rural respondents is an increase in the estimated impact of
Rosenwald, as expected, but no change in the estimated impact of Jeanes.
In column 6 I limit the regression sample to Census years 1910 and 1920 and keep only
counties where Rosenwald was not present by 1920, meaning I am estimating impacts of Jeanes
such that the impact of Rosenwald could not have played a role as no children were yet exposed.
In addition, I add a indicator to the regression equal to 1 if respondents are black and live in
a county where a Rosenwald School would be present by 1930 (the main effect is differenced
out). The result is a doubling of the estimated impact of full exposure to Jeanes, from 4.3 to
7.2 percentage points. Yet, the estimate is not statistically different from zero likely due to the
decrease in sample size, from nearly 400,000 to just under 81,000. Still, that the coefficient moves
away from zero provides some evidence that effects from Jeanes could not have been entirely
22
explained by the presence of Rosenwald. Finally, in columns 7 and 8 I reestimate the preferred
specification in column 1 separately for men and women finding no difference in the effect of
either Jeanes or Rosenwald by gender.
[Table 9 about here.]
As a final specification check, I apply a rate of depreciation to the exposure measure in a
manner similar to enrollment:
JeanesLρ =
(1∑L
l=0(1 − ρ)l
)(1
8
)[ 14∑a=7
L−1∑l=0
Months(a−l)
9∗ (1 − ρ)l
](12)
The differences between JeanesLρ and JeanesL above are that I now apply a rate of depreciation
to Jeanes treatment and, rather than dividing by full exposure, 1(L+1) , I divide by full exposure
under each rate of depreciation, 1∑Ll=0(1−ρ)l
. The econometric specification is then the same as
Equation 11 above, iterated over various values of L and ρ. Results are shown in Table 10 below
with three panels corresponding to depreciation rates ρ = 0.1, 0.3, 0.5 and six columns showing
lags 1. . .6. The purpose is to avoid arbitrarily assuming a single rate of depreciation, or that at
a given rate of depreciation impacts can be detected a certain number of years prior. I choose
relatively low rates of depreciation to estimate lower bounds on treatment impacts. Included in
the bottom of each panel is the mean of Jeanes exposure, indicating the average depreciated
exposure black black Southern children experienced at each age.
The array of parameter estimates in Table 10 indicate that including lags beyond 5 has little
effect on estimated impacts, implying that at any rate of depreciation no more than roughly 5
lags matters. Moreover, as the imposed rate of depreciation increases, the importance of each
additional lag included is smaller, as expected. As a whole, the panel suggests treatment effects
ranging from a 3.6 to a 4.2 percentage point decrease in the literacy gap from full exposure.
The key difference between these estimates is that when more lags are included, the cost of full
exposure increases, as it takes more years to achieve the full impact. Thus, while estimates in
Tables 7- 10 are consistent in suggesting that the upper bound of full exposure to Jeanes is
roughly a 4.3 percentage point decrease in the black-white literacy gap, and the lower bound is
a 3.5 percentage point decrease, the depreciation rate and number of included lags will affect
the cost estimate of full exposure described in Section 6.
[Table 10 about here.]
5 The relationship between Jeanes and Rosenwald placementSince the work of Jeanes Supervisors included raising funds for Rosenwald Schools, it is fair
to assume that part of the impact of Jeanes presence on enrollment and literacy was indirect,
resulting from the increased likelihood of exposure to Rosenwald. To explore this, I estimate
23

the impact of Jeanes on the likelihood of receiving a Rosenwald School. To do so, I create
a county-by-year panel of Jeanes and Rosenwald presence, and a set of county-by-race level
measures of enrollment, literacy and demographics in 1900 and 1910. I add to this measures of
student-teacher ratios and student-school ratios by race from 1910 using data from Carruthers
and Wanamaker (2013). I use only measures from 1910 or earlier assuming that there was little
if any impact of Jeanes by 1910 and to avoid endogenously modeling the relationship between
Jeanes and public expenditures on schooling thereafter. That is, these measures are meant to
account for pre-program county-by-race level characteristics. Student-teacher and student-school
ratios were only available for AL, GA, NC, SC and TN, thus I limit this analysis to these states.
To estimate the impact of Jeanes Supervisors on Rosenwald placement, I assume that each
county has some probability of receiving a Rosenwald School beginning in 1919, and that this
probability is a function of baseline county-level characteristics, cumulative Jeanes presence, and
time. Figure 6, a chart of the relative timing of Jeanes and Rosenwald, shows that of counties ever
receiving either Jeanes or Rosenwald, 38% received Jeanes first, 14% received Rosenwald first,
and that while 32% received Jeanes but no Rosenwald, only 5% received only a Jeanes Supervisor.
Assuming Rosenwald Schools built between 1916-19 were build in 1919 would increase the share
of counties that had Jeanes first.
[Figure 6 about here.]
To model the relationship I estimate a hazard function where I define each year as a spell
and characterize failure as the first year in which a county receives a Rosenwald School. I begin
the panel in 1918, assuming that the first Rosenwald Schools were built in 1919 or later. In
Equation 13 below, the hazard is a function of time, t, a dummy indicating whether a jeanes
supervisor was present by 1918, county demographic characteristics for black and white students
in 1910, county level changes in these characteristics between 1900 and 1910, and student-teacher
and school-teacher ratios in 1910. Lastly, I include a time-varying measure of the cumulative
years of Jeanes presence in the county, defined by the total number of months/9 up to and
including year t. In terms, the model is:
λ(t, Jeanes(t), X) = λ0(t) exp(γ1Jeanes1918 + γ2Jeanes(t) + β1X1910 + β2X∆1910−1900) (13)
Figure 7 shows the baseline survival probabilities for counties with and without a Jeanes Su-
pervisor by 1918, where analysis time=0 in 1918. The intercept shift indicates that over half of
counties with a Supervisor by 1918 received a Rosenwald School in the first years of construction
while fewer than 20% of those without Jeanes received a school. Figure 7 also suggests that the
hazard rate was steeper for these counties with a Supervisor by by 1918 in the first 5 years of
post-war Rosenwald construction.
Table 11 shows results from Equation 13, which conditions on covariate measures from 1900
and 1910, and includes a time varying measure of cumulative Jeanes presence up to year t.
24

Results suggest that each additional school year of Jeanes presence increased the likelihood of
receiving a Rosenwald School by 5.6 percentage points. While not necessarily causal, this result
suggests that Jeanes impacts estimated above are not pure Jeanes effects, but also partially
explained by Jeanes work to raise money for Rosenwald Schools.
[Figure 7, and Table 11 about here.]
6 Marginal dollar impactsEstimating marginal impacts will have to take into account the scalability of each program. While
schools have fixed capacity constraints, Supervisors were authorized to maximize their impact
on students through the most effective means at their disposal - hence “the next needed thing.”
Still, there likely exists a tradeoff between how many schools or towns a Supervisor visited in her
county each school year and her impact. Yet, community organizing, in the form of fundraising
for school resources, lobbying for improved conditions, canning drives and lessons in health and
sanitation, or teacher training, might exhibit larger economies of scale than working directly
with pupils. To address the relationship between county size and Supervisors’ effectiveness, I
reestimate my preferred specification for literacy by black county-level population.11 Results
shown in Table 12 suggest that Supervisors were far more effective in smaller counties. Column
1 of Table 12 shows results from column 6 of Table 8 for respondents in the smallest 2 quintiles
of black population, with roughly 210 black school-age children per county. Results suggest that
full exposure, including 6 lags, or 14 years in total, would have closed the black-white gap by
7.3 percentage points, equal to the effect of full exposure to Rosenwald for counties that size
and larger than the roughly 4 percentage point effect estimated on the full sample. Yet, for
districts in the 3rd and 4th quintles of black population, with 1,277 black children on average,
the impact of full exposure to Jeanes shrinks considerably, to a 2.4 percentage point decrease in
the black-white gap, while the impact of full exposure to Rosenwald increases to 11.5 percentage
points. This trend persists for the largest 20 percent of counties by black population. Column 3
shows that for the largest counties, with 4,183 black children on average, there is small, positive
but not statistically significant impact of Jeanes, and a robust 10 percentage point impact of
Rosenwald. Taken together these results suggest that the impact of Jeanes was clearly decreasing
in county size, but not so for Rosenwald.
[Table 12 about here.]
I use actual cost estimates from Rosenwald School construction records and salary records
from Jeanes Supervisors to back out comparative per-dollar impacts. Figure 8 shows total Jeanes
expenditures between 1909 and 1930 and the share that was paid by the Fund and the share paid
11I use the 1930 census to determine county size since it is a 5% sample whereas the other waves are 1 or 1.2percent samples and thereby far less accurate for small counties. Aaronson and Mazumder (2011) use a web scrapeof Ancestry.com to get more precise counts, but their data only contains this for Rosenwald counties.
25

through public funds. After 1920, the share and amount of public funds increased dramatically,
coinciding with the implementation of Rosenwald Schools. From 1909-1920 the Jeanes fund spent
approximately $80,000 per year, after 1920 the Fund spent over $200,000 per year, reaching
nearly $300,000 in 1930 (all in real 1925 dollars). Figure 9 shows average monthly salaries for
Supervisors in selected states. Average monthly salaries remained around $80 per month until
WWI when they dipped to around $60 and then recovered and increased steadily through 1930,
averaging about $95 per month during the years both Jeanes and Rosenwald were active, or
about $855 per school year of treatment. Monthly salary does not appear to vary systematically
across states.
[Figures 8 and 9 about here.]
Rosenwald Schools varied in cost depending on several factors, including the number of
schools built in the same county in the same year and school size, measured by number of
classrooms. Figure 10 shows school construction costs (in real 1925 dollars) by the number of
classrooms (or teachers) and by the number of schools built in that county-year.12 The data
suggest that there is no savings to building larger schools with more teachers. Schools with
one classroom per building cost as much per classroom as schools with 5, each at about $1,600
per room. Similarly, cost is declining only marginally with each additional school built in that
county-year. When only one school is built at a time, which was the modal case, for 32% of
schools, the cost was nearly $6,000 per school. When 2 schools were built in a year, the case for
24% of schools, the cost per building fell to around $5,000 per school. For 3 schools in a year,
15% of cases, the cost is only $4,500 per school. These patterns hold in conditional means as
well. Regressing cost per school on the number of schools built in that county-year, the number
of classrooms, and state and year fixed effects shows that the cost of each additional classroom
is $1,700 and the cost declines only slightly with each additional school built.
[Figure 10 about here.]
I combine these figures with impact estimates from Table 12 by county size to compare
marginal dollar impacts of Jeanes and Rosenwald to compare returns per dollar spent on human
resources and physical infrastructure respectively. Column 1 of Table 12 suggests that for districts
with an average of 210 black school-age children the effect of 14 consecutive years of Jeanes is
roughly equivalent to building enough Rosenwald Schools to house all 210 students. At a salary
of approximately $855 per school year, the total cost of Jeanes would be $11,970 over 14 years.
At a discount rate of 3% the present value of this stream of payments is $9,947.
To calculate the cost of housing all 210 students, I assume that schools will each have 2
classrooms at 45 students each, as is the modal case. Thus, 2.33 2-classroom buildings are
12I omit 43 schools (1.3%) costing over $40,000. These were most likely county training, or high schools, andwhich were disproportionately expensive.
26

required on average. The average cost per school of constructing 2 schools with 2 teachers was
$3,109 (sd=932) on average for the 381 cases matching this description in the Rosenwald data.
Then, 2.33 schools would cost approximately $7,243. Using point estimates from column 1 of
Table 12 showing a 7.5 percentage point decrease in the black-white gap from full exposure to
Rosenwald suggests that the per-dollar impact for these smaller counties is an approximately
0.1 percentage point decrease in the black-white gap per $100 spent on Rosenwald Schools.
Conducting the same calculation for Jeanes using a 7.3 percentage point effect size and total
discounted cost of $9,947 suggests a 0.07 percentage point decrease in the black-white gap per
$100 spent on Jeanes. Taken together these estimates suggest that, in smaller counties, the
impact of Jeanes was 30% smaller than Rosenwald per dollar spent.
Conducting the same calculation for larger counties yields different results. Column 2 of
Table 12 shows effect sizes for the 3rd and 4th quintiles of county size with an average of 1,277
black children per county. The cost of the 28 classrooms with 45 students each necessary to house
all pupils, assuming 4 rooms per school, would be $44,106 in total, or $6,288 per school. The
effect of full coverage for Rosenwald for these larger districts was 11.5 percentage points, giving
a per-dollar impact of 0.028 percentage points per $100 dollars spent. Using the $9,947 salary
cost for a Jeanes Supervisor and an effect of 2.4 percentage points yields a 0.024 percentage
point decrease in the black-white gap per $100 spent on Jeanes. A rate of return roughly 85%
of that realized by Rosenwald.
These results suggest that to some degree Jeanes Supervisors were able to economize on
scale in a manner that Rosenwald Schools could not. Column 3 of Table 12 suggests that effects
of Jeanes are not distinguishable from zero in the largest counties, but given their size nearly
any effect would have had a higher rate of return per dollar than Rosenwald. Because in nearly
all cases only one Supervisor was sent to a county, I cannot estimate how returns to multiple
Supervisors would have been different, I can only estimate the effect of those who were there
longer. Taken together these results results suggest that per-dollar Rosenwald was more effective,
with the caveat that we do not know how effective multiple Supervisors in each county would
have been. Likely constraints on the supply of trained educators was a limiting factor.
It is also important to note that these estimates are based on what the impact of full exposure
would have been. In reality, gross impacts of the Jeanes Fund were very small compared with
those of the Rosenwald Fund. Taking a conservative estimate of a rate of depreciation of 0.1
and including 6 lags from the literacy estimate in Table 10, where the average black student
experienced 3.22 years of depreciated exposure on average (or 23% of full exposure) implies
that the Jeanes Fund closed the black-white literacy gap by 1 percentage point in total. If the
literacy gap closed by 20 percentage points between 1900 and 1930, one could argue that roughly
5 percent of this decline can be attributed to Jeanes. Moreover, if each year of Jeanes increased
the likelihood of Rosenwald by 5%, then 14 years of exposure would have virtually guaranteed
a Rosenwald school. In this sense, completely disentangling the impacts of these two programs
27

is difficult if not impossible. Historical evidence makes clear that the two programs were indeed
intertwined both financially and organizationally, including cooperation with State Agents for
Negro Education and shared board members. Taking these facts into account suggests that
recent studies estimating the impact of the Rosenwald Fund on convergence in the fates of black
and white students in the first part of the 20th century are missing an important contributing
factor in the Jeanes Fund. For an initial investment of one million dollars, it seems like a nice
payoff.
7 ConclusionDespite dramatic inequalities in educational expenditures, rural Southern blacks born between
1900 and 1920 made significant educational gains on their white counterparts. Several factors
contributed to this, among them Northern philanthropies played a substantive role. I estimate
the impact of two large scale interventions aimed at improving the quality of black schooling
in the South between 1900 and 1930, one that sent trained teachers to support black schools
through teacher training, administrative work and fundraising, while the other focused largely
on improving and expanding physical infrastructure. By estimating the impact of the Jeanes
Fund, and the combined effects of the Jeanes and Rosenwald Funds, I add to a robust literature
chronicling factors that contributed to convergence in enrollment and literacy rates between
black and white students in the early 20th century.
I find that full exposure to Jeanes Supervisors over a 14 year period would have decreased
the black-white literacy gap by between 3.5 and 4.3 percentage points. On average during this
time black children had a Supervisor in their county for an average of 3.2 years between birth
and age 14, suggesting that in total the Jeanes program closed the black-white literacy gap
by approximately 1 percentage point in total. That is, of the 20 percentage point decrease in
the gap between 1900 and 1930, the Jeanes Fund may explain up to 5 percent. This impact
is attributable to both the direct effect of Jeanes on teacher quality and student learning, and
through a secondary impact whereby each year of Jeanes presence increased the likelihood of
securing a Rosenwald School by roughly 5%.
Back of the envelope cost estimates suggest that Jeanes Supervisors were able to economize
on scale. In smaller counties, each dollar spent by Rosenwald closed the black-white gap by 42%
more than each dollar spent by Jeanes. Yet, in larger counties this advantage narrowed to 17%.
Thus, while these results suggest that at the time Rosenwald was more effective dollar-for-dollar,
and certainly more impactful in total as the program was considerably larger, concluding that
all funding should have gone to physical infrastructure would be mistaken. In fact, estimates
presented here suggest that had the supply of trained educators and program funding allowed for
multiple Supervisors per county, investments in skilled labor may well have been more effective.
That said, teachers and pupils need schools, and the evidence here suggests that when initial
school facilities are inadequate or non-existent, building schools is at least if not more important
than additional labor. While these conclusions may not have direct bearing on education in
28

the US today, they certainly speak to developing nations where infrastructure is often low and
inequality often runs along ethnic, racial or gender lines.
Despite the remarkable efforts of Jeanes Supervisors over several decades, this study is the
first to estimate the Fund’s impact on black education in the 100 years since its inception. The
results presented here are significant not only in an historical sense. The influence of philan-
thropic spending on educational resources and education policy is increasing, both at home and
abroad. Moreover, such programs often target disadvantaged groups, in particular minorities.
These findings demonstrate that such programs can affect educational outcomes, even under the
most arduous of circumstances.
29
ReferencesAaronson, D. and Mazumder, B. (2011). The impact of rosenwald schools on black achievement.
Journal of Political Economy, 119(5):821 – 888.
Anderson, E. and Moss, A. A. (1999). Dangerous donations: northern philanthropy and southernBlack education, 1902 – 1930. University of Missouri Press.
Anderson, J. D. (1978). Northern foundations and the shaping of southern black rural education,1902–1935. History of Education Quarterly, 18(4):371–396.
Anderson, J. D. (1988). The education of Blacks in the South, 1860–1935. Chapel Hill: Universityof North Carolina Press.
Bond, H. M. (1966). The Education of the Negro in the American Social Order. New York, NY:Octagon Books.
Card, D. and Krueger, A. (1996). School resources and student outcomes: an overview of theliterature and new evidence from north and south carolina. The Journal of Economic Per-spectives, 10(4):31–50.
Carruthers, C. and Wanamaker, M. (2013). Closing the gap? the effect of private philanthropyon the provision of african-american schooling in the u.s. south. Journal of Public Economics,(101):53–67.
Collins, W. J. and Margo, R. A. (2006). Historical perspectives on racial differences in schoolingin the united states. Handbook of the Economics of Education, 1:107–154.
Donohue III, J., Heckman, J., and Todd, P. (2002). The schooling of southern blacks: Theroles of legal activism and private philanthropy, 1910-1960. Quarterly Journal of Economics,117(1):225–268.
DuBois, W. and (Eds.), A. D. (1911). The Common School and the Negro American. New York:Arno Press.
Fishback, P. and Baskin, J. (1991). Narrowing the black–white gap in child literacy in 1910:The roles of school inputs and family inputs. Review of Economics and Statistics, 64:725–728.
Fultz, M. (1995). Teacher training and african american education in the south, 1900-1940. TheJournal of Negro Education, 64(2):196–210.
Georgia Association of Jeanes Curriculum Directors and Southern Education Foundation (1975).Jeanes Supervision in Georgia Schools: A Guiding Light in Education: a History of the Pro-gram from 1908-1975. The Georgia Association of Jeanes Curriculum Directors in Cooperationwith The Southern Education Foundation.
Jones, L. G. E. (1937). The Jeanes Teacher in the United States, 1908—1933: An Accountof Twenty-five Years’ Experience in the Supervision of Negro Rural Schools. Chapel Hill:University of North Carolina Press.
Liston, H. (1928). A study of the work of the jeanes supervising teachers for negro rural schools.Unpublished Master’s Thesis, University of Chicago: Chicago, IL.
30

Loeb, S. and Bound, J. (1996). The effect of measured school inputs on academic achievement:Evidence from the 1920s, 1930s and 1940s birth cohorts. The Review of Economics andStatistics, 78(4):653–664.
Margo, R. A. (1986). Educational achievement in segregated school systems: The effects of“separate-but-equal”. The American Economic Review, 76(4):794–801.
Margo, R. A. (1990). Race and schooling in the South, 1880-1950: an economic history. Uni-versity of Chicago Press.
Margo, R. A. (1991). Segregated schools and the mobility hypothesis: A model of local govern-ment discrimination. Quarterly Journal of Economics, 106:301–310.
McClure, P. (2009). Jeanes Teachers: a View Into Black Education in the Jim Crow South.BookSurge Publishing.
McCuistion, F. (1931). The South’s Negro Teaching Force. Nashville, TN. Phamplet.
Myrdal, G. (1944). An American Dilemma. Harper and Brothers, NY.
Rubin, D. B. (1987). Multiple Imputation for Nonresponse in Surveys. J. Wiley & Sons, NewYork.
Ruggles, S., Alexander, J. T., Genadek, K., Goeken, R., Schroeder, M. B., and Sobek, M. (2010).Integrated public use microdata series: Version 5.0 [machine-readable database].
Williams, M. et al. (1979). The jeanes story: A chapter in the history of american education,1908-1968. Southern Education Foundation.
Wright, A. D., Jeanes, A. T., and Redcay, E. E. (1933). The Negro Rural School Fund, Inc.(Anna T. Jeanes Foundation) 1907-1933: A Record of the Establishment of the Fund, a Sketchof Its Donor, the Minutes of the Proceedings of the Board of Trustees from 1908 to 1932, andthe Policies Developed Under the Directions of the Board of Trustees. Negro Rural SchoolFund.
31

Tables
Table 1: Summary statistics.
A: Enrollment sample, ages 7-14.
1900 1910 1920 1930black white black white black white black white
Female 0.49 0.50 0.50 0.49 0.50 0.49 0.50 0.49Rural 0.87 0.85 0.87 0.82 0.83 0.78 0.77 0.73Farm 0.61 0.66 0.63 0.61 0.68 0.58 0.60 0.50MSA-Metro 0.02 0.02 0.03 0.03 0.03 0.04 0.06 0.07MSA-City 0.04 0.06 0.04 0.08 0.06 0.09 0.12 0.13Mom Literate 0.28 0.75 0.44 0.81 0.58 0.86 0.69 0.90Dad Literate 0.30 0.74 0.41 0.78 0.49 0.81 0.54 0.84OwnHome 0.25 0.56 0.26 0.54 0.25 0.51 0.26 0.46Enrolled 0.42 0.63 0.65 0.85 0.80 0.91 0.83 0.91
n 16,054 30,138 23,762 58,360 14,769 41,989 84,056 223,387N 492,515Counties 1,361
B: Literacy sample, ages 15-22.
1910 1920 1930black white black white black white
Female 0.52 0.50 0.53 0.50 0.53 0.50Rural 0.79 0.72 0.77 0.72 0.72 0.68Farm 0.52 0.50 0.59 0.52 0.54 0.46MSA-Metro 0.03 0.04 0.04 0.05 0.05 0.06MSA-City 0.08 0.10 0.10 0.13 0.14 0.16Mom Literate 0.23 0.53 0.33 0.60 0.43 0.64Dad Literate 0.22 0.50 0.27 0.55 0.33 0.58OwnHome 0.25 0.49 0.23 0.49 0.25 0.45Literate 0.72 0.91 0.80 0.96 0.87 0.98
n 20,171 52,429 12,343 34,121 79,613 201,237N 399,914Counties 1,353
Table shows means for black and white respondents ages 7-14 in panel A and ages 15-22 in panel B in decennialCensus years 1900-1930 in Southern states (AL, MS, LA, FL, GA, TX, NC, SC, TN, KY, AR, OK, MD andVA). IPUMS sample weights are applied.
32
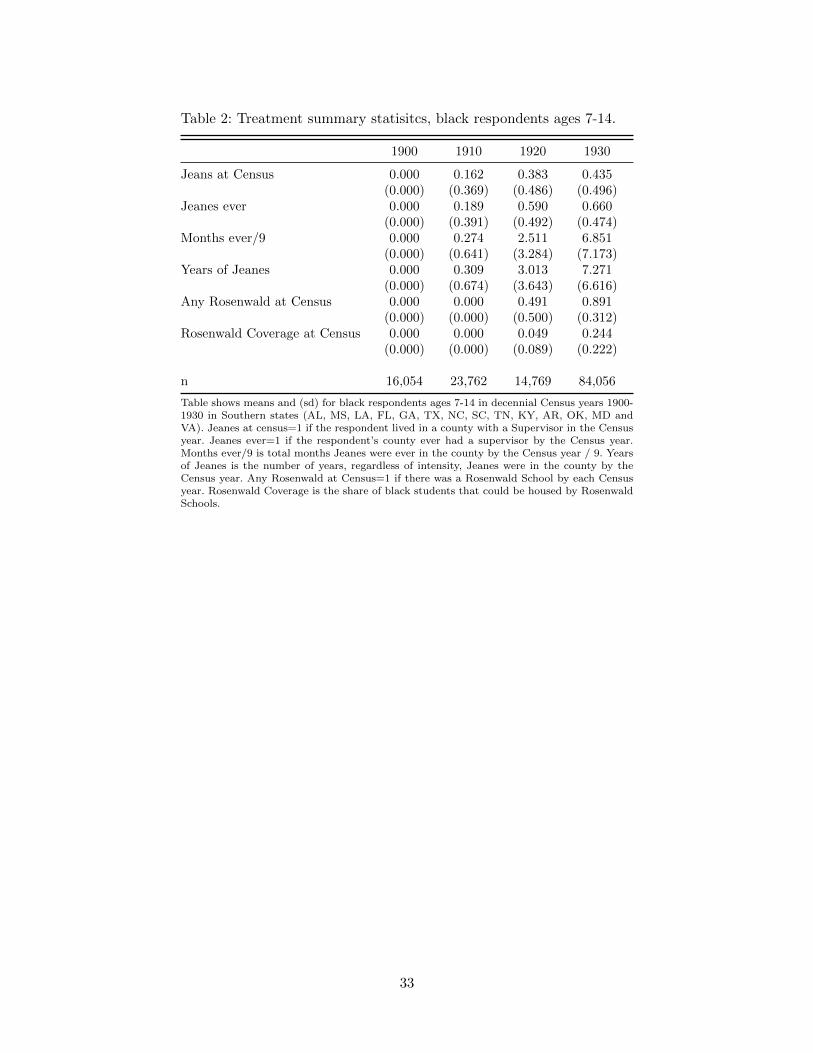
Table 2: Treatment summary statisitcs, black respondents ages 7-14.
1900 1910 1920 1930
Jeans at Census 0.000 0.162 0.383 0.435(0.000) (0.369) (0.486) (0.496)
Jeanes ever 0.000 0.189 0.590 0.660(0.000) (0.391) (0.492) (0.474)
Months ever/9 0.000 0.274 2.511 6.851(0.000) (0.641) (3.284) (7.173)
Years of Jeanes 0.000 0.309 3.013 7.271(0.000) (0.674) (3.643) (6.616)
Any Rosenwald at Census 0.000 0.000 0.491 0.891(0.000) (0.000) (0.500) (0.312)
Rosenwald Coverage at Census 0.000 0.000 0.049 0.244(0.000) (0.000) (0.089) (0.222)
n 16,054 23,762 14,769 84,056
Table shows means and (sd) for black respondents ages 7-14 in decennial Census years 1900-1930 in Southern states (AL, MS, LA, FL, GA, TX, NC, SC, TN, KY, AR, OK, MD andVA). Jeanes at census=1 if the respondent lived in a county with a Supervisor in the Censusyear. Jeanes ever=1 if the respondent’s county ever had a supervisor by the Census year.Months ever/9 is total months Jeanes were ever in the county by the Census year / 9. Yearsof Jeanes is the number of years, regardless of intensity, Jeanes were in the county by theCensus year. Any Rosenwald at Census=1 if there was a Rosenwald School by each Censusyear. Rosenwald Coverage is the share of black students that could be housed by RosenwaldSchools.
33
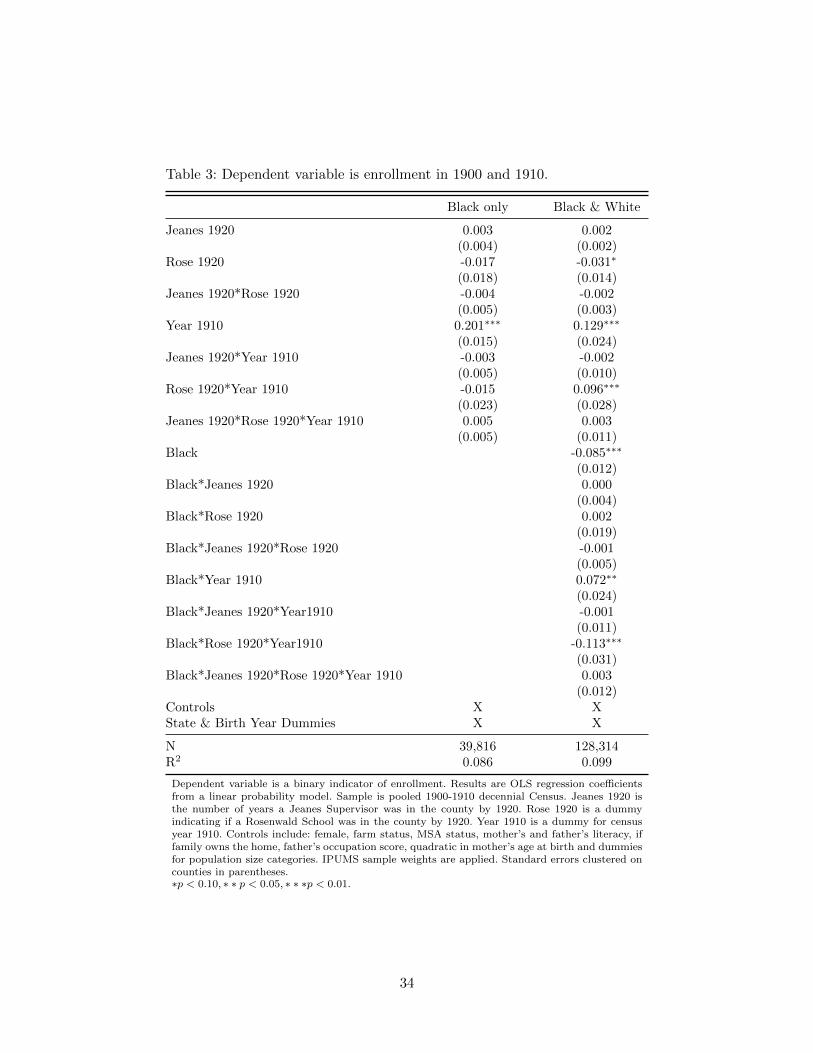
Table 3: Dependent variable is enrollment in 1900 and 1910.
Black only Black & White
Jeanes 1920 0.003 0.002(0.004) (0.002)
Rose 1920 -0.017 -0.031∗
(0.018) (0.014)Jeanes 1920*Rose 1920 -0.004 -0.002
(0.005) (0.003)Year 1910 0.201∗∗∗ 0.129∗∗∗
(0.015) (0.024)Jeanes 1920*Year 1910 -0.003 -0.002
(0.005) (0.010)Rose 1920*Year 1910 -0.015 0.096∗∗∗
(0.023) (0.028)Jeanes 1920*Rose 1920*Year 1910 0.005 0.003
(0.005) (0.011)Black -0.085∗∗∗
(0.012)Black*Jeanes 1920 0.000
(0.004)Black*Rose 1920 0.002
(0.019)Black*Jeanes 1920*Rose 1920 -0.001
(0.005)Black*Year 1910 0.072∗∗
(0.024)Black*Jeanes 1920*Year1910 -0.001
(0.011)Black*Rose 1920*Year1910 -0.113∗∗∗
(0.031)Black*Jeanes 1920*Rose 1920*Year 1910 0.003
(0.012)Controls X XState & Birth Year Dummies X X
N 39,816 128,314R2 0.086 0.099
Dependent variable is a binary indicator of enrollment. Results are OLS regression coefficientsfrom a linear probability model. Sample is pooled 1900-1910 decennial Census. Jeanes 1920 isthe number of years a Jeanes Supervisor was in the county by 1920. Rose 1920 is a dummyindicating if a Rosenwald School was in the county by 1920. Year 1910 is a dummy for censusyear 1910. Controls include: female, farm status, MSA status, mother’s and father’s literacy, iffamily owns the home, father’s occupation score, quadratic in mother’s age at birth and dummiesfor population size categories. IPUMS sample weights are applied. Standard errors clustered oncounties in parentheses.∗p < 0.10, ∗ ∗ p < 0.05, ∗ ∗ ∗p < 0.01.
34
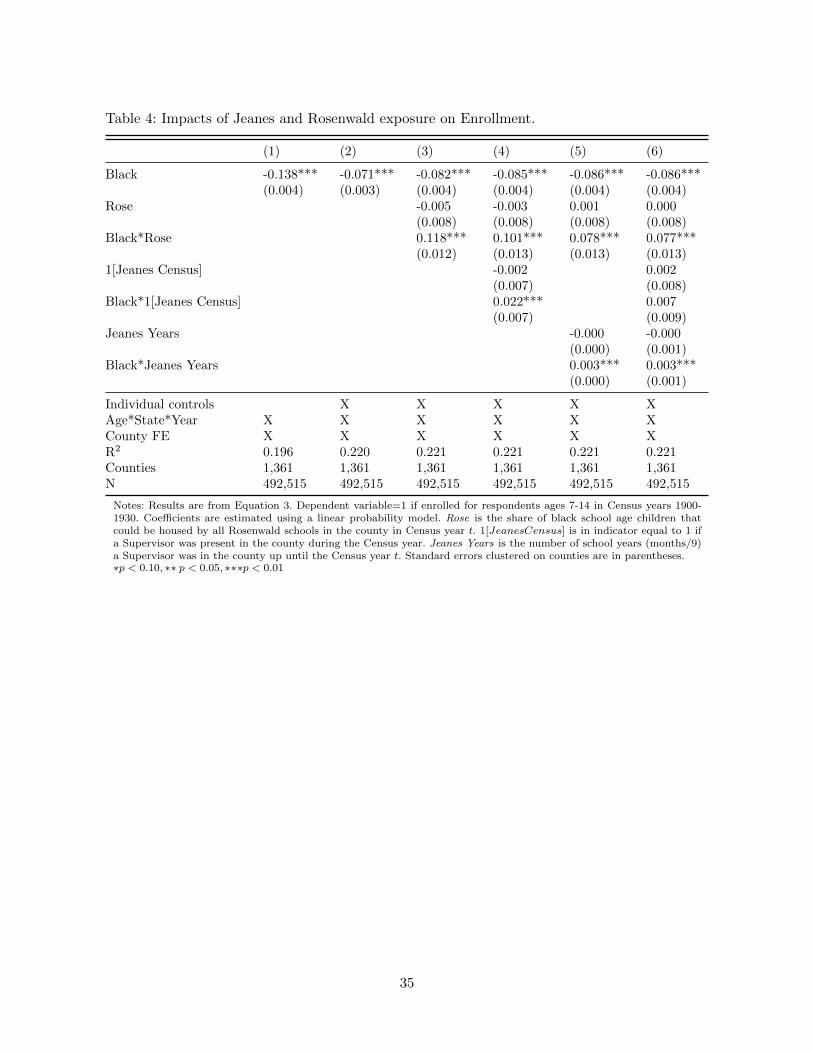
Table 4: Impacts of Jeanes and Rosenwald exposure on Enrollment.
(1) (2) (3) (4) (5) (6)
Black -0.138*** -0.071*** -0.082*** -0.085*** -0.086*** -0.086***(0.004) (0.003) (0.004) (0.004) (0.004) (0.004)
Rose -0.005 -0.003 0.001 0.000(0.008) (0.008) (0.008) (0.008)
Black*Rose 0.118*** 0.101*** 0.078*** 0.077***(0.012) (0.013) (0.013) (0.013)
1[Jeanes Census] -0.002 0.002(0.007) (0.008)
Black*1[Jeanes Census] 0.022*** 0.007(0.007) (0.009)
Jeanes Years -0.000 -0.000(0.000) (0.001)
Black*Jeanes Years 0.003*** 0.003***(0.000) (0.001)
Individual controls X X X X XAge*State*Year X X X X X XCounty FE X X X X X XR2 0.196 0.220 0.221 0.221 0.221 0.221Counties 1,361 1,361 1,361 1,361 1,361 1,361N 492,515 492,515 492,515 492,515 492,515 492,515
Notes: Results are from Equation 3. Dependent variable=1 if enrolled for respondents ages 7-14 in Census years 1900-1930. Coefficients are estimated using a linear probability model. Rose is the share of black school age children thatcould be housed by all Rosenwald schools in the county in Census year t. 1[JeanesCensus] is in indicator equal to 1 ifa Supervisor was present in the county during the Census year. Jeanes Years is the number of school years (months/9)a Supervisor was in the county up until the Census year t. Standard errors clustered on counties are in parentheses.∗p < 0.10, ∗∗ p < 0.05, ∗∗∗p < 0.01
35
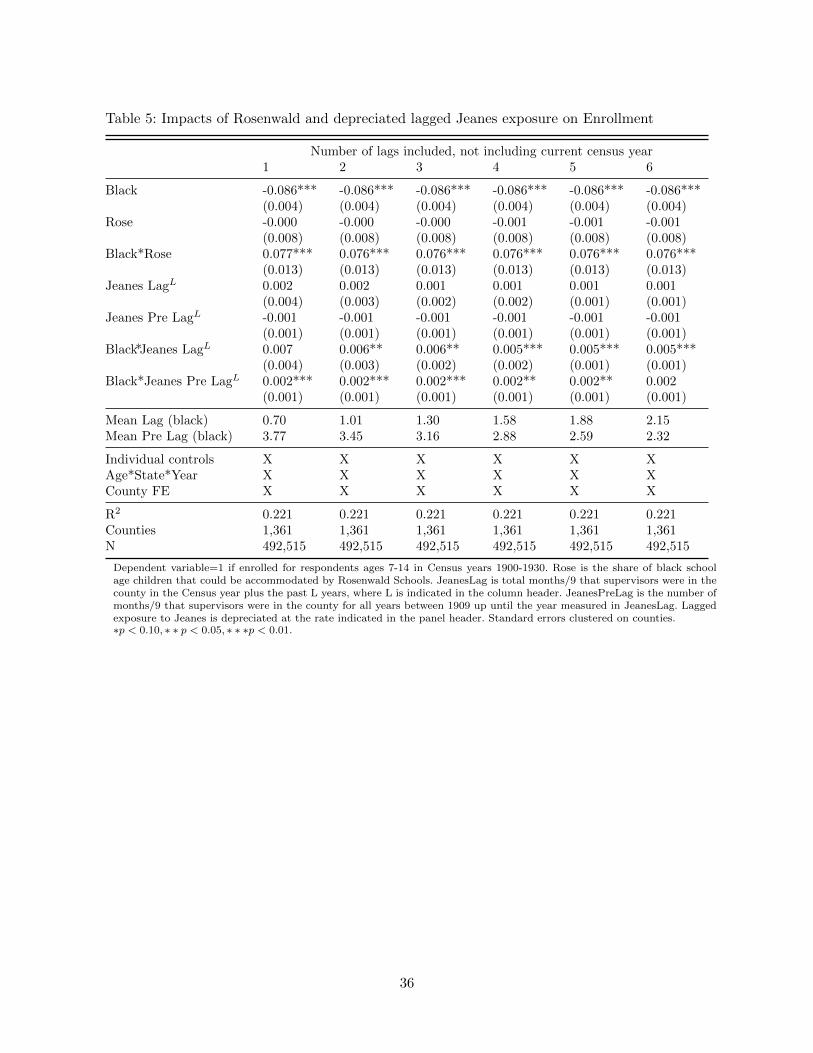
Table 5: Impacts of Rosenwald and depreciated lagged Jeanes exposure on Enrollment
Number of lags included, not including current census year1 2 3 4 5 6
Black -0.086*** -0.086*** -0.086*** -0.086*** -0.086*** -0.086***(0.004) (0.004) (0.004) (0.004) (0.004) (0.004)
Rose -0.000 -0.000 -0.000 -0.001 -0.001 -0.001(0.008) (0.008) (0.008) (0.008) (0.008) (0.008)
Black*Rose 0.077*** 0.076*** 0.076*** 0.076*** 0.076*** 0.076***(0.013) (0.013) (0.013) (0.013) (0.013) (0.013)
Jeanes LagL 0.002 0.002 0.001 0.001 0.001 0.001(0.004) (0.003) (0.002) (0.002) (0.001) (0.001)
Jeanes Pre LagL -0.001 -0.001 -0.001 -0.001 -0.001 -0.001(0.001) (0.001) (0.001) (0.001) (0.001) (0.001)
Black*Jeanes LagL 0.007 0.006** 0.006** 0.005*** 0.005*** 0.005***(0.004) (0.003) (0.002) (0.002) (0.001) (0.001)
Black*Jeanes Pre LagL 0.002*** 0.002*** 0.002*** 0.002** 0.002** 0.002(0.001) (0.001) (0.001) (0.001) (0.001) (0.001)
Mean Lag (black) 0.70 1.01 1.30 1.58 1.88 2.15Mean Pre Lag (black) 3.77 3.45 3.16 2.88 2.59 2.32
Individual controls X X X X X XAge*State*Year X X X X X XCounty FE X X X X X X
R2 0.221 0.221 0.221 0.221 0.221 0.221Counties 1,361 1,361 1,361 1,361 1,361 1,361N 492,515 492,515 492,515 492,515 492,515 492,515
Dependent variable=1 if enrolled for respondents ages 7-14 in Census years 1900-1930. Rose is the share of black schoolage children that could be accommodated by Rosenwald Schools. JeanesLag is total months/9 that supervisors were in thecounty in the Census year plus the past L years, where L is indicated in the column header. JeanesPreLag is the number ofmonths/9 that supervisors were in the county for all years between 1909 up until the year measured in JeanesLag. Laggedexposure to Jeanes is depreciated at the rate indicated in the panel header. Standard errors clustered on counties.∗p < 0.10, ∗ ∗ p < 0.05, ∗ ∗ ∗p < 0.01.
36
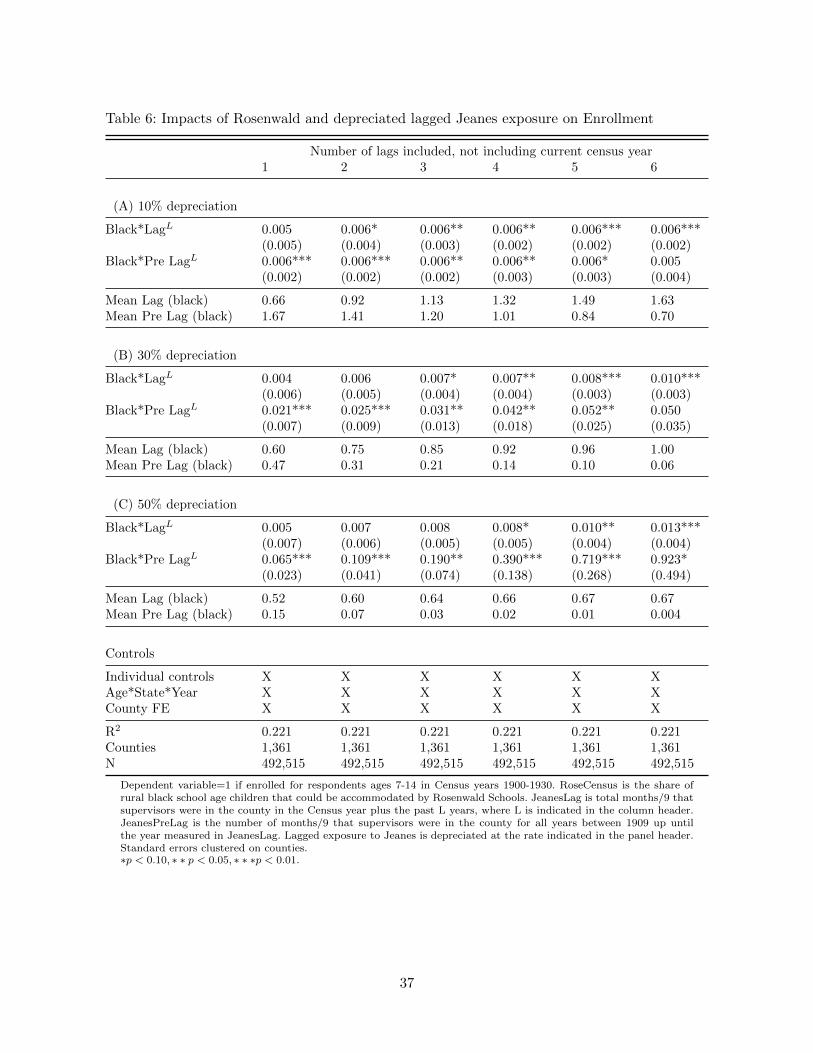
Table 6: Impacts of Rosenwald and depreciated lagged Jeanes exposure on Enrollment
Number of lags included, not including current census year1 2 3 4 5 6
(A) 10% depreciation
Black*LagL 0.005 0.006* 0.006** 0.006** 0.006*** 0.006***(0.005) (0.004) (0.003) (0.002) (0.002) (0.002)
Black*Pre LagL 0.006*** 0.006*** 0.006** 0.006** 0.006* 0.005(0.002) (0.002) (0.002) (0.003) (0.003) (0.004)
Mean Lag (black) 0.66 0.92 1.13 1.32 1.49 1.63Mean Pre Lag (black) 1.67 1.41 1.20 1.01 0.84 0.70
(B) 30% depreciation
Black*LagL 0.004 0.006 0.007* 0.007** 0.008*** 0.010***(0.006) (0.005) (0.004) (0.004) (0.003) (0.003)
Black*Pre LagL 0.021*** 0.025*** 0.031** 0.042** 0.052** 0.050(0.007) (0.009) (0.013) (0.018) (0.025) (0.035)
Mean Lag (black) 0.60 0.75 0.85 0.92 0.96 1.00Mean Pre Lag (black) 0.47 0.31 0.21 0.14 0.10 0.06
(C) 50% depreciation
Black*LagL 0.005 0.007 0.008 0.008* 0.010** 0.013***(0.007) (0.006) (0.005) (0.005) (0.004) (0.004)
Black*Pre LagL 0.065*** 0.109*** 0.190** 0.390*** 0.719*** 0.923*(0.023) (0.041) (0.074) (0.138) (0.268) (0.494)
Mean Lag (black) 0.52 0.60 0.64 0.66 0.67 0.67Mean Pre Lag (black) 0.15 0.07 0.03 0.02 0.01 0.004
Controls
Individual controls X X X X X XAge*State*Year X X X X X XCounty FE X X X X X X
R2 0.221 0.221 0.221 0.221 0.221 0.221Counties 1,361 1,361 1,361 1,361 1,361 1,361N 492,515 492,515 492,515 492,515 492,515 492,515
Dependent variable=1 if enrolled for respondents ages 7-14 in Census years 1900-1930. RoseCensus is the share ofrural black school age children that could be accommodated by Rosenwald Schools. JeanesLag is total months/9 thatsupervisors were in the county in the Census year plus the past L years, where L is indicated in the column header.JeanesPreLag is the number of months/9 that supervisors were in the county for all years between 1909 up untilthe year measured in JeanesLag. Lagged exposure to Jeanes is depreciated at the rate indicated in the panel header.Standard errors clustered on counties.∗p < 0.10, ∗ ∗ p < 0.05, ∗ ∗ ∗p < 0.01.
37
Table 7: Effects of cumulative exposure on Literacy.
(1) (2) (3) (4) (5)
Black -0.142*** -0.093*** -0.100*** -0.102*** -0.104***(0.004) (0.003) (0.004) (0.004) (0.004)
Rose7−14 -0.030*** -0.022**(0.011) (0.010)
Black*Rose7−14 0.187*** 0.136***(0.020) (0.019)
Jeanes -0.010** -0.008*(0.005) (0.005)
Black*Jeanes 0.049*** 0.035***(0.006) (0.006)
Individual controls X X X XAge*State*Year X X X X XCounty FE X X X X X
R2 0.121 0.173 0.174 0.174 0.174Counties 1,353 1,353 1,353 1,353 1,353N 399,914 399,914 399,914 399,914 399,914
Notes: Dependent variable=1 if literate for respondents ages 15-22 in Census years 1910-1930. Rose7−14
is the average share of black school age children that could be housed by Rosenwald schools in therespondent’s county. Jeanes is exposure to Jeanes averaged over ages 7-14.
38
Table 8: Effects of cumulative exposure on Literacy, including lags.
Number of lags includedL=1 L=2 L=3 L=4 L=5 L=6
Black -0.104*** -0.104*** -0.104*** -0.104*** -0.104*** -0.104***(0.004) (0.004) (0.004) (0.004) (0.004) (0.004)
Rose7−14 -0.022** -0.022** -0.022** -0.021** -0.021** -0.021**(0.010) (0.010) (0.010) (0.010) (0.010) (0.010)
Black*Rose7−14 0.134*** 0.133*** 0.133*** 0.132*** 0.131*** 0.131***(0.019) (0.019) (0.019) (0.019) (0.020) (0.020)
JeanesLag=L -0.008* -0.008 -0.008 -0.008 -0.008 -0.008(0.005) (0.005) (0.005) (0.005) (0.005) (0.005)
Black*JeanesLag=L 0.036*** 0.037*** 0.038*** 0.040*** 0.041*** 0.043***(0.006) (0.006) (0.007) (0.007) (0.007) (0.007)
Mean JeanesLag=L, black 0.278 0.268 0.259 0.249 0.240 0.230
Individual controls X X X X X XAge*State*Year X X X X X XCounty FE X X X X X XR2 0.174 0.174 0.174 0.174 0.174 0.174Counties 1,353 1,353 1,353 1,353 1,353 1,353N 399,914 399,914 399,914 399,914 399,914 399,914
Notes: Dependent variable=1 if literate for respondents ages 15-22 in Census years 1910-1930. Rose7−14 is the average shareof black school age children that could be housed by Rosenwald schools in the respondent’s county. JeanesL is averageexposure to Jeanes including L lags at each age.
39
Table 9: Literacy robustness checks.
(1) (2) (3) (4) (5) (6) (7) (8)
Black -0.104*** -0.104*** -0.123*** -0.103*** -0.122*** -0.088*** -0.121*** -0.088***(0.004) (0.004) (0.005) (0.004) (0.004) (0.014) (0.005) (0.005)
Rose7−14 -0.021** -0.047*** -0.024* -0.018* -0.046*** -0.019 -0.026*(0.010) (0.013) (0.012) (0.010) (0.009) (0.012) (0.012)
Black*Rose7−14 0.131*** 0.113*** 0.126*** 0.141*** 0.176*** 0.132*** 0.134***(0.020) (0.015) (0.023) (0.021) (0.020) (0.025) (0.021)
JeanesL=6ρ=0 -0.008 -0.004 -0.016*** -0.013** -0.005 -0.014 -0.006 -0.010
(0.005) (0.006) (0.006) (0.006) (0.006) (0.020) (0.007) (0.006)Black*JeanesL=6
ρ=0 0.043*** 0.036*** 0.057*** 0.049*** 0.041*** 0.072 0.042*** 0.044***(0.007) (0.008) (0.009) (0.010) (0.008) (0.044) (0.011) (0.009)
Black*1[Rose by 1930] -0.024(0.016)
Main specification XRose div. by black, rural XNon-imputed states XOnly known Jeanes timing XRural counties only XNo Rosenwald by 1920 XMales only XFemales only X
R2 0.174 0.174 0.184 0.177 0.184 0.188 0.196 0.149n 1,353 1,353 652 1,353 1,329 949 1,353 1,352N 399,914 399,914 219,460 364,186 282,713 81,300 196,622 203,292
Notes: Column 1 is the same specification as column 6 of Table 8. Rose div. by black, rural means shows results when Rosenwald capacity is dividedby the rural black students, rather than all black students in the county. The non-imputed states sample omits six states in three years where Jeanespresence was imputed due to missing data. Only known jeanes timing omits counties during which the exact timing of Rosenwald Schools is notknown between 1916 and 1919. Rural counties only restricts to entirely rural counties. No Rosenwald by 1920 restricts the sample to year 1910 and1920 in counties that did not have a Rosenwald School by 1920.
40
Table 10: Effects of cumulative depreciated exposure on Literacy, including lags.
Number of lags includedL=1 L= 2 L= 3 L=4 L=5 L=6
At 10% depreciation (ρ = 0.1)
JeanesLag=L -0.008* -0.008 -0.008 -0.008 -0.008 -0.008(0.005) (0.005) (0.005) (0.005) (0.005) (0.005)
Black*JeanesLag=L 0.036*** 0.037*** 0.038*** 0.039*** 0.041*** 0.042***(0.006) (0.006) (0.006) (0.007) (0.007) (0.007)
Mean JeanesLag=L, black 0.278 0.269 0.260 0.249 0.240 0.230
At 30% depreciation (ρ = 0.3)
JeanesLag=L -0.008* -0.008 -0.008 -0.008 -0.008 -0.008(0.005) (0.005) (0.005) (0.005) (0.005) (0.005)
Black*JeanesLag=L 0.036*** 0.037*** 0.037*** 0.038*** 0.039*** 0.040***(0.006) (0.006) (0.006) (0.006) (0.007) (0.007)
Mean JeanesLag=L, black 0.279 0.273 0.267 0.262 0.258 0.255
At 50% depreciation (ρ = 0.5)
JeanesLag=L -0.008* -0.008 -0.008 -0.008 -0.008 -0.008(0.005) (0.005) (0.005) (0.005) (0.005) (0.005)
Black*JeanesLag=L 0.036*** 0.036*** 0.037*** 0.037*** 0.037*** 0.037***(0.006) (0.006) (0.006) (0.006) (0.006) (0.006)
Mean JeanesLag=L, black 0.280 0.276 0.273 0.271 0.270 0.269
Controls
Individual controls X X X X X XAge*State*Year X X X X X XCounty FE X X X X X XR2 0.174 0.174 0.174 0.174 0.174 0.174Counties 1,353 1,353 1,353 1,353 1,353 1,353N 399,914 399,914 399,914 399,914 399,914 399,914
Notes: Dependent variable=1 if literate for respondents ages 15-22 in Census years 1910-1930. JeanesL is average exposureto Jeanes including L lags at each age assuming treatment depreciates at rate ρ.
41
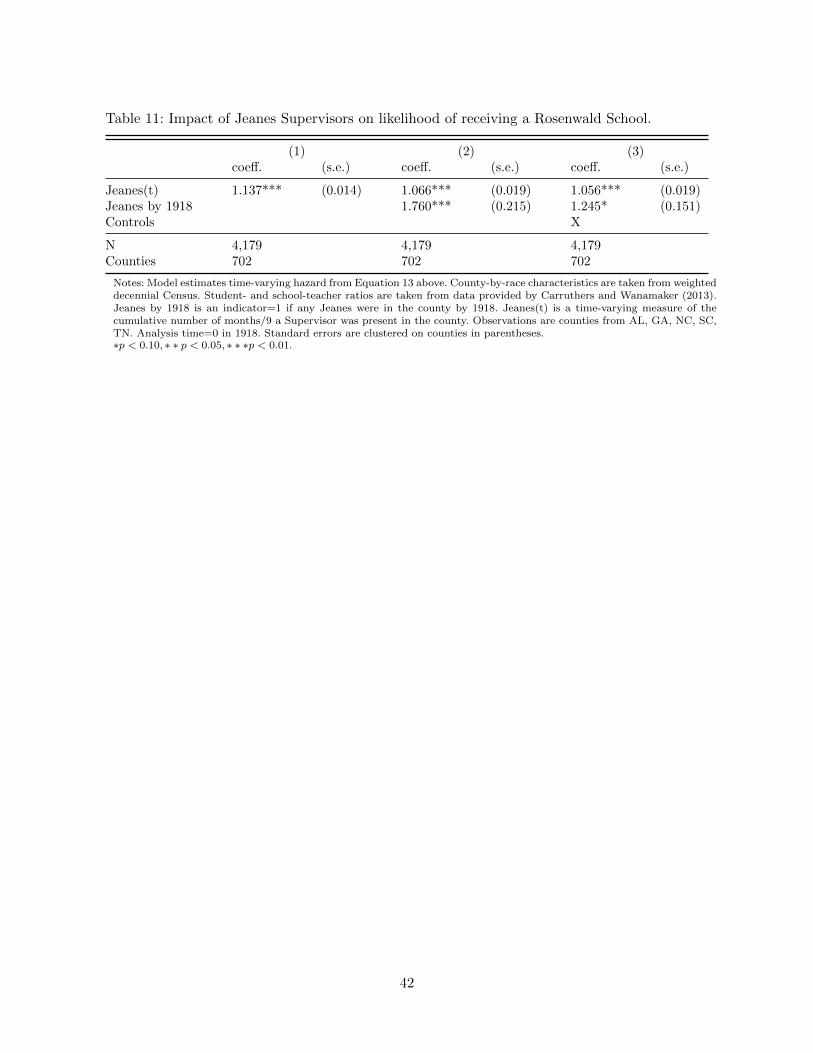
Table 11: Impact of Jeanes Supervisors on likelihood of receiving a Rosenwald School.
(1) (2) (3)coeff. (s.e.) coeff. (s.e.) coeff. (s.e.)
Jeanes(t) 1.137*** (0.014) 1.066*** (0.019) 1.056*** (0.019)Jeanes by 1918 1.760*** (0.215) 1.245* (0.151)Controls X
N 4,179 4,179 4,179Counties 702 702 702
Notes: Model estimates time-varying hazard from Equation 13 above. County-by-race characteristics are taken from weighteddecennial Census. Student- and school-teacher ratios are taken from data provided by Carruthers and Wanamaker (2013).Jeanes by 1918 is an indicator=1 if any Jeanes were in the county by 1918. Jeanes(t) is a time-varying measure of thecumulative number of months/9 a Supervisor was present in the county. Observations are counties from AL, GA, NC, SC,TN. Analysis time=0 in 1918. Standard errors are clustered on counties in parentheses.∗p < 0.10, ∗ ∗ p < 0.05, ∗ ∗ ∗p < 0.01.
42
Table 12: Effects of Jeanes and Rosenwald on Literacy by county-level black population.
(1) (2) (3)
Black -0.060*** -0.088*** -0.092***(0.006) (0.005) (0.007)
JeanesLag=6ρ=0 0.001 0.006 0.011
(0.016) (0.011) (0.010)
Black*JeanesLag=6ρ=0 0.073** 0.024* 0.015
(0.036) (0.014) (0.011)Rose7−14 0.007 -0.065*** -0.101***
(0.007) (0.018) (0.027)Black*Rose7−14 0.075*** 0.115*** 0.100***
(0.022) (0.018) (0.027)
Quintiles of black pop. 1-2 3-4 5Average # of black children 210 1,277 4,183Individual controls X X XAge*State*Year X X XCounty FE X X X
R2 0.148 0.169 0.162n 468 468 233N 94,204 123,987 159,596
Notes: Model repeats the specification in column 6 of Table 8 by quintiles of county-level black population in 1930. Dependentvariable=1 if literate for respondents ages 15-22 in Census years 1910-1930. Rose7−14 is the average share of black schoolage children that could be housed by Rosenwald schools in the respondent’s county. JeanesL is average exposure to Jeanesincluding L lags at each age.∗p < 0.10, ∗ ∗ p < 0.05, ∗ ∗ ∗p < 0.01.
43
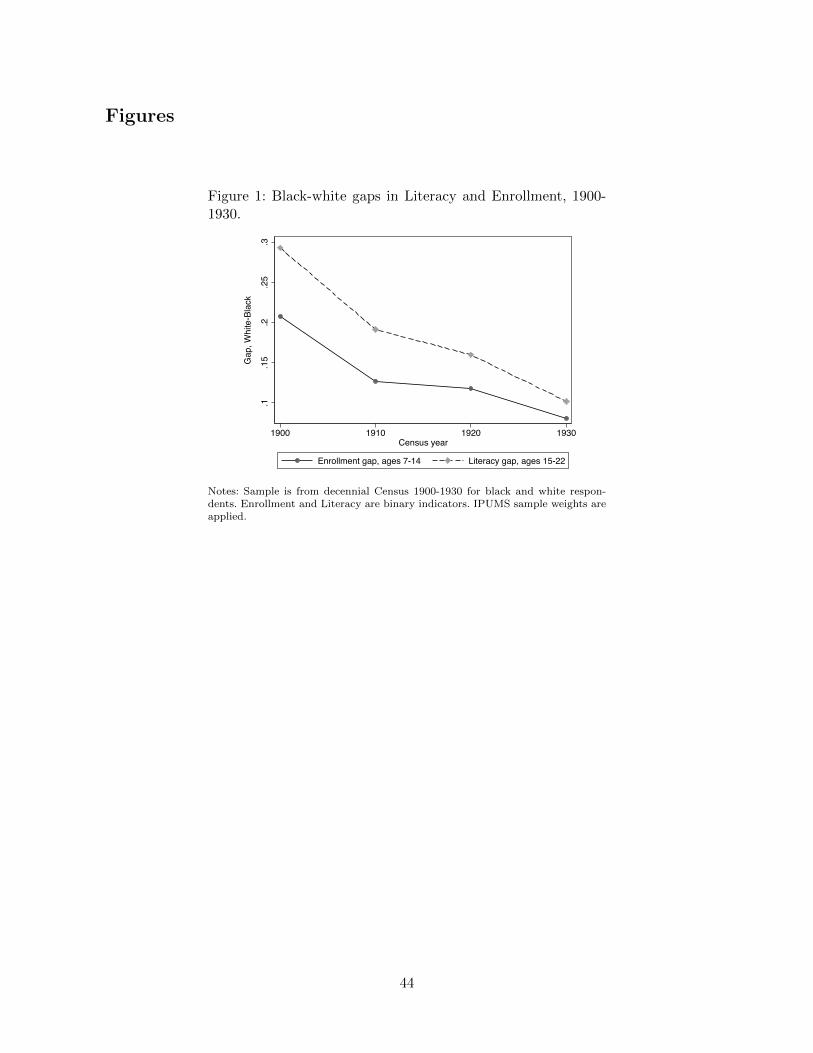
Figures
Figure 1: Black-white gaps in Literacy and Enrollment, 1900-1930.
.1.1
5.2
.25
.3
Gap
, Whi
te-B
lack
1900 1910 1920 1930Census year
Enrollment gap, ages 7-14 Literacy gap, ages 15-22
Notes: Sample is from decennial Census 1900-1930 for black and white respon-dents. Enrollment and Literacy are binary indicators. IPUMS sample weights areapplied.
44
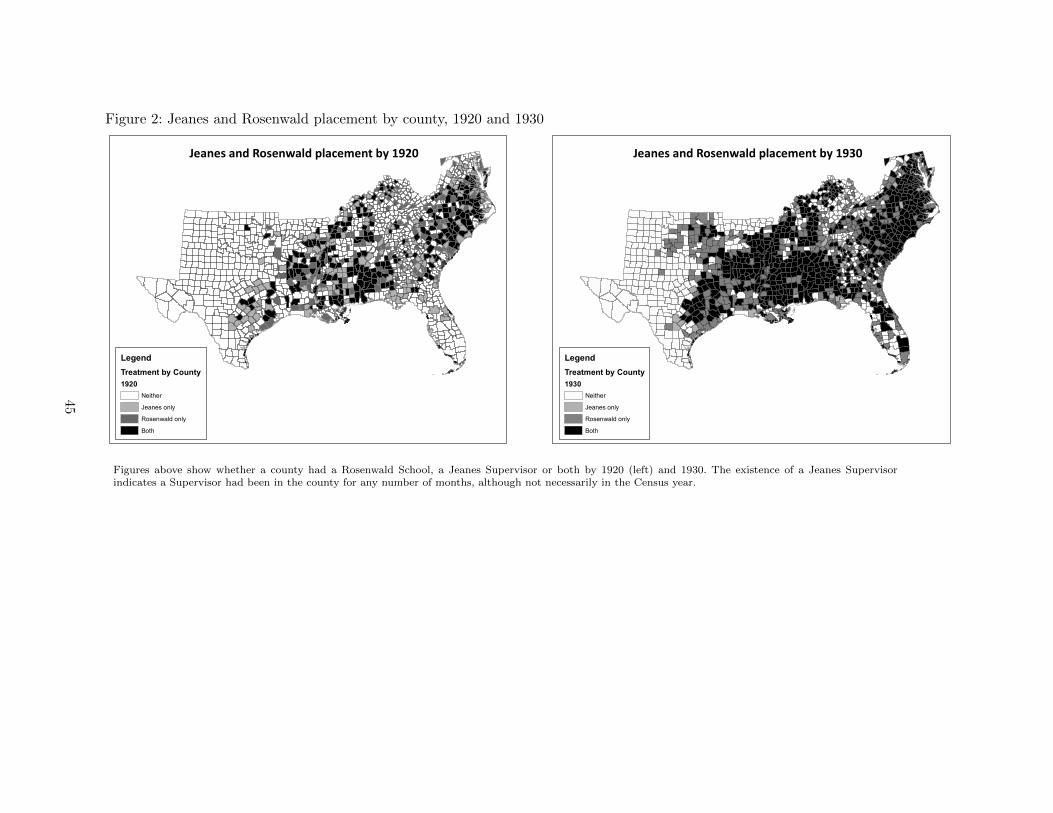
Figure 2: Jeanes and Rosenwald placement by county, 1920 and 1930
Jeanes and Rosenwald placement by 1920
LegendTreatment by County1920
NeitherJeanes onlyRosenwald onlyBoth
Jeanes and Rosenwald placement by 1930
LegendTreatment by County1930
NeitherJeanes onlyRosenwald onlyBoth
Figures above show whether a county had a Rosenwald School, a Jeanes Supervisor or both by 1920 (left) and 1930. The existence of a Jeanes Supervisorindicates a Supervisor had been in the county for any number of months, although not necessarily in the Census year.
45
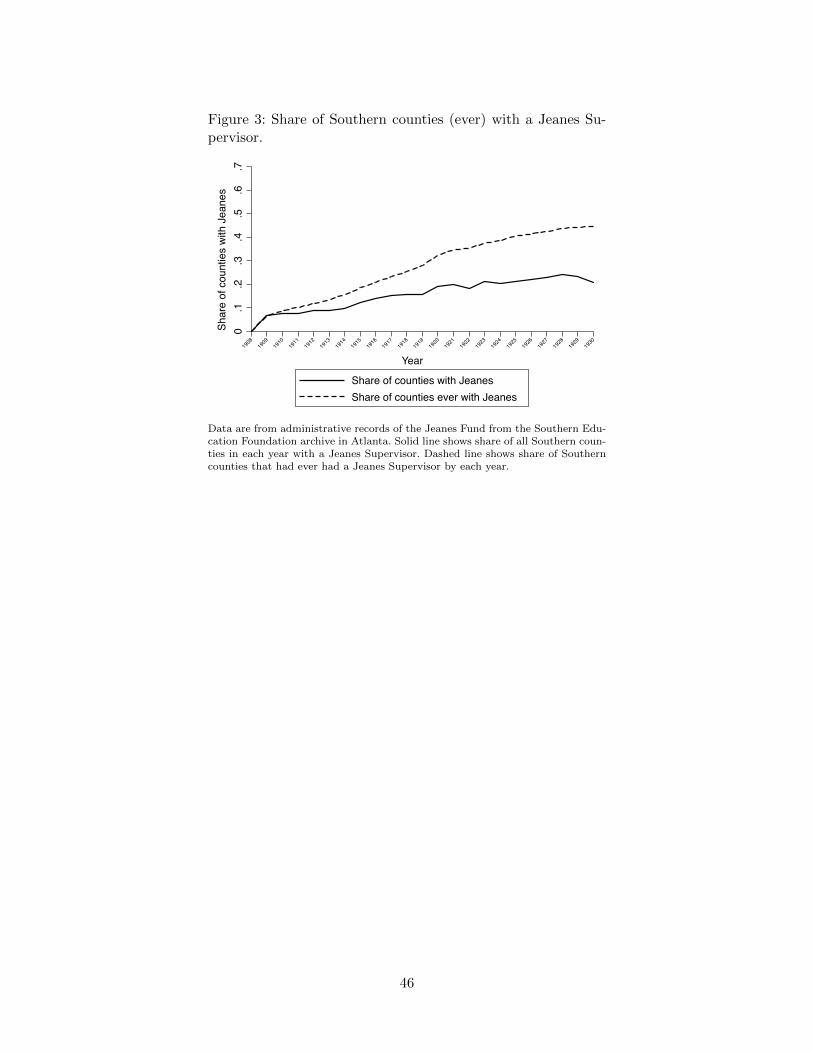
Figure 3: Share of Southern counties (ever) with a Jeanes Su-pervisor.
0.1
.2.3
.4.5
.6.7
1908
1909
1910
1911
1912
1913
1914
1915
1916
1917
1918
1919
1920
1921
1922
1923
1924
1925
1926
1927
1928
1929
1930
Share of counties with JeanesShare of counties ever with Jeanes
Shar
e of
cou
ntie
s w
ith J
eane
s
Year
Data are from administrative records of the Jeanes Fund from the Southern Edu-cation Foundation archive in Atlanta. Solid line shows share of all Southern coun-ties in each year with a Jeanes Supervisor. Dashed line shows share of Southerncounties that had ever had a Jeanes Supervisor by each year.
46
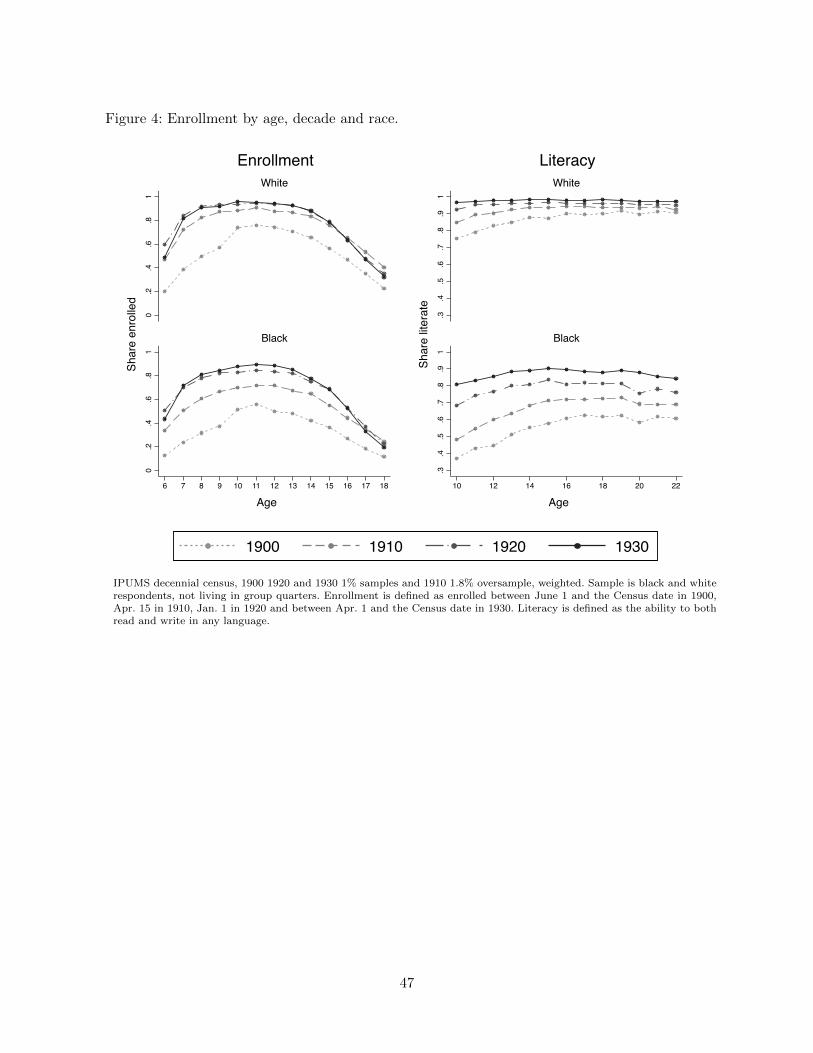
Figure 4: Enrollment by age, decade and race.
0.2
.4.6
.81
0.2
.4.6
.81
6 7 8 9 10 11 12 13 14 15 16 17 18
White
Black
Shar
e en
rolle
d
Age
Enrollment
.3.4
.5.6
.7.8
.91
.3.4
.5.6
.7.8
.91
10 12 14 16 18 20 22
White
Black
Shar
e lit
erat
e
Age
Literacy
1900 1910 1920 1930
IPUMS decennial census, 1900 1920 and 1930 1% samples and 1910 1.8% oversample, weighted. Sample is black and whiterespondents, not living in group quarters. Enrollment is defined as enrolled between June 1 and the Census date in 1900,Apr. 15 in 1910, Jan. 1 in 1920 and between Apr. 1 and the Census date in 1930. Literacy is defined as the ability to bothread and write in any language.
47
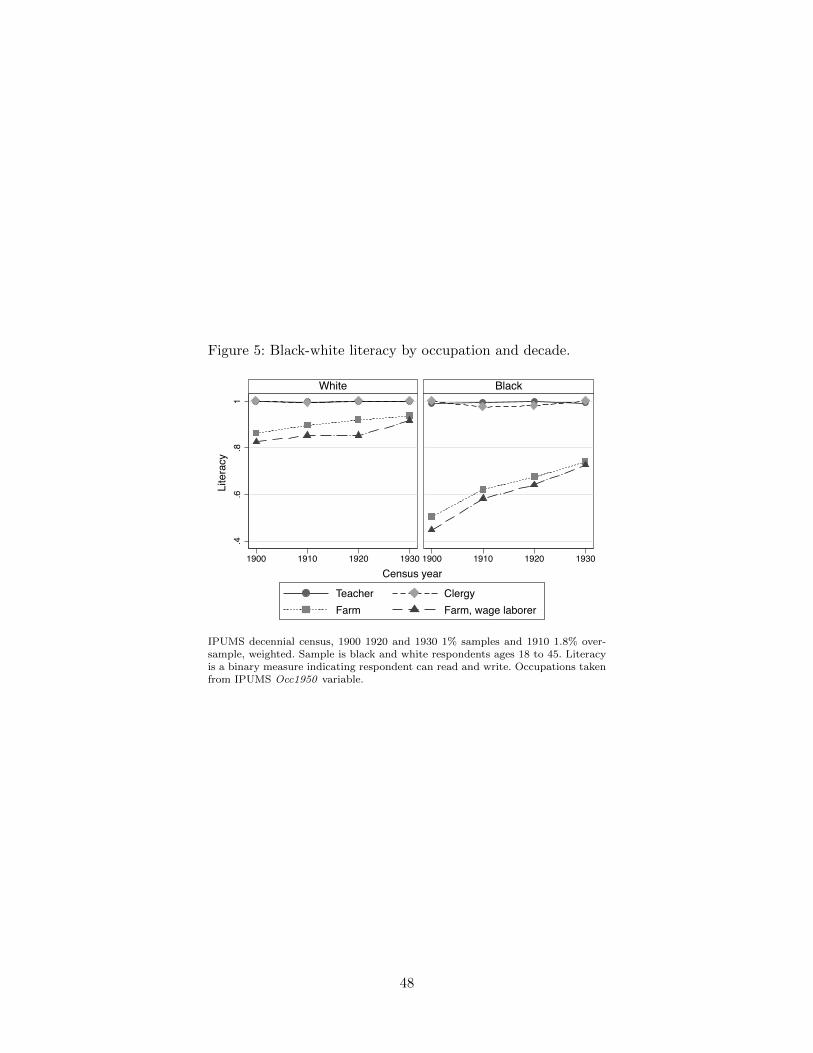
Figure 5: Black-white literacy by occupation and decade.
.4.6
.81
1900 1910 1920 1930 1900 1910 1920 1930
White Black
Teacher ClergyFarm Farm, wage laborer
Lite
racy
Census year
IPUMS decennial census, 1900 1920 and 1930 1% samples and 1910 1.8% over-sample, weighted. Sample is black and white respondents ages 18 to 45. Literacyis a binary measure indicating respondent can read and write. Occupations takenfrom IPUMS Occ1950 variable.
48
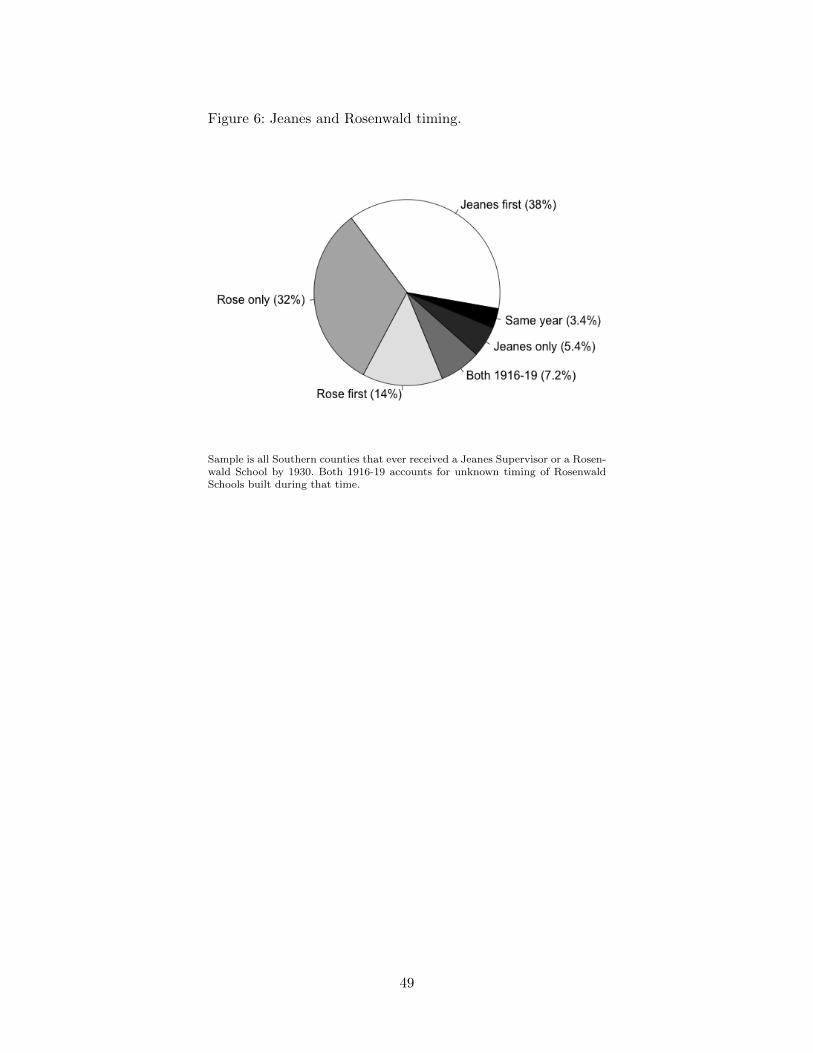
Figure 6: Jeanes and Rosenwald timing.
Sample is all Southern counties that ever received a Jeanes Supervisor or a Rosen-wald School by 1930. Both 1916-19 accounts for unknown timing of RosenwaldSchools built during that time.
49
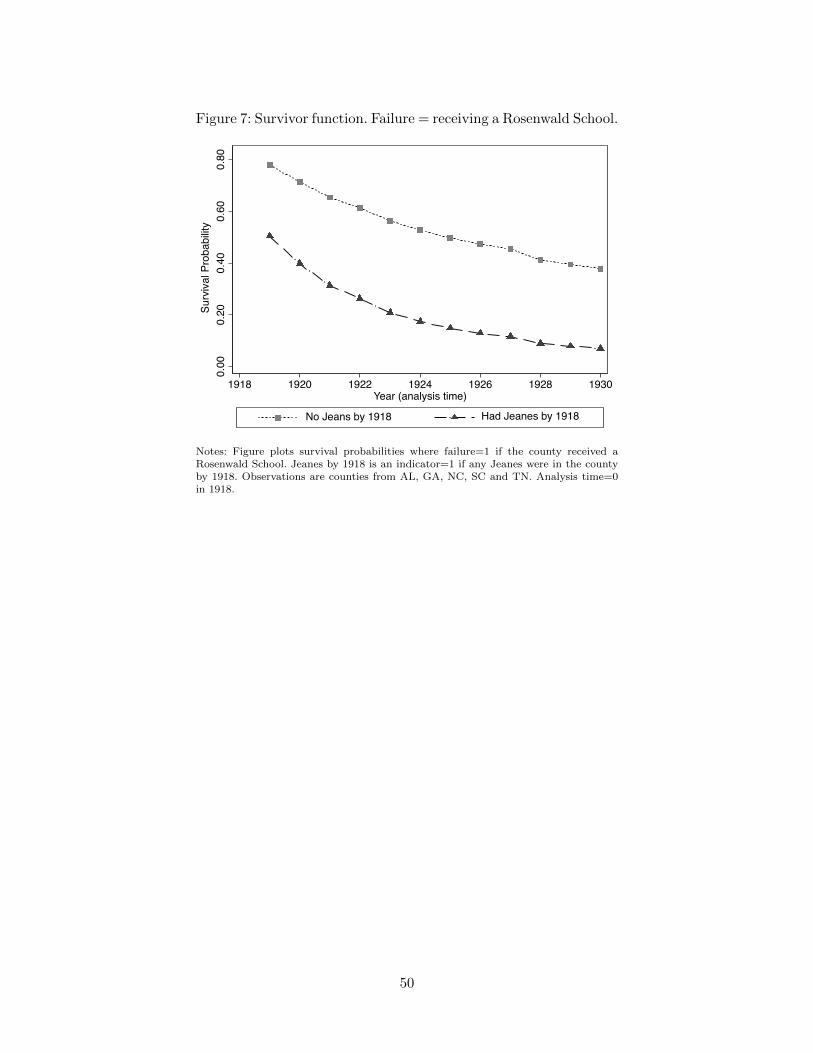
Figure 7: Survivor function. Failure = receiving a Rosenwald School.
0.00
0.20
0.40
0.60
0.80
Surv
ival
Pro
babi
lity
1918 19221920 1924 1926 1928 1930Year (analysis time)
No Jeans by 1918 Had Jeanes by 1918
Notes: Figure plots survival probabilities where failure=1 if the county received aRosenwald School. Jeanes by 1918 is an indicator=1 if any Jeanes were in the countyby 1918. Observations are counties from AL, GA, NC, SC and TN. Analysis time=0in 1918.
50
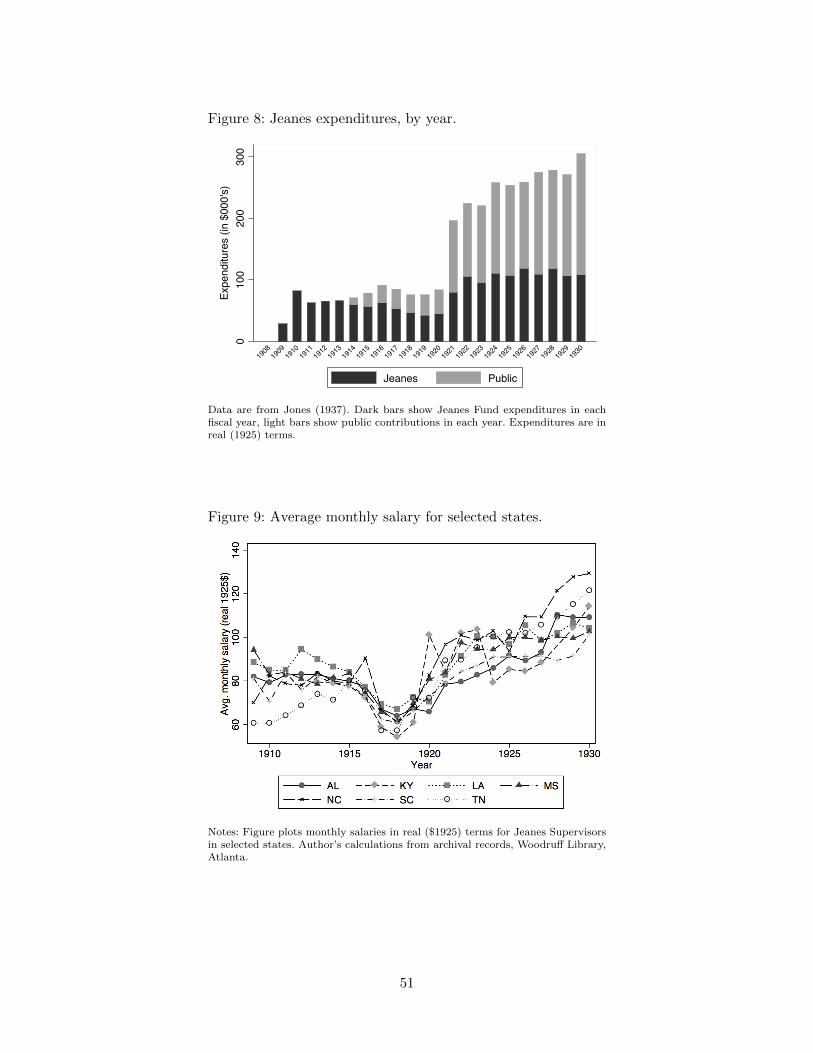
Figure 8: Jeanes expenditures, by year.
010
020
030
0Ex
pend
iture
s (in
$00
0's)
1908
1909
1910
1911
1912
1913
1914
1915
1916
1917
1918
1919
1920
1921
1922
1923
1924
1925
1926
1927
1928
1929
1930
Jeanes Public
Data are from Jones (1937). Dark bars show Jeanes Fund expenditures in eachfiscal year, light bars show public contributions in each year. Expenditures are inreal (1925) terms.
Figure 9: Average monthly salary for selected states.
Notes: Figure plots monthly salaries in real ($1925) terms for Jeanes Supervisorsin selected states. Author’s calculations from archival records, Woodruff Library,Atlanta.
51
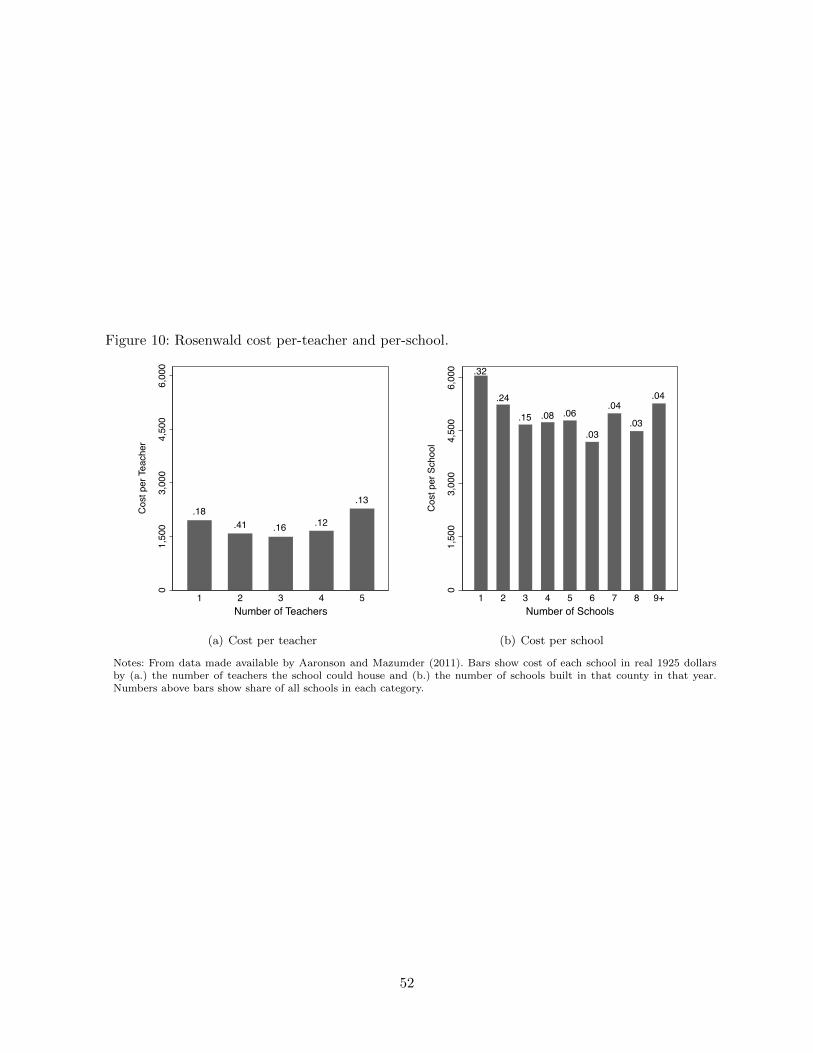
Figure 10: Rosenwald cost per-teacher and per-school.
.18.41 .16 .12
.13
01,
500
3,00
04,
500
6,00
0
Cos
t per
Tea
cher
1 2 3 4 5Number of Teachers
(a) Cost per teacher
.32
.24
.15 .08 .06
.03
.04
.03
.04
01,
500
3,00
04,
500
6,00
0
Cos
t per
Sch
ool
1 2 3 4 5 6 7 8 9+Number of Schools
(b) Cost per school
Notes: From data made available by Aaronson and Mazumder (2011). Bars show cost of each school in real 1925 dollarsby (a.) the number of teachers the school could house and (b.) the number of schools built in that county in that year.Numbers above bars show share of all schools in each category.
52
AppendixImputed treatment
Jeanes Fund data for 6 states (AR, FL, GA, MD, TX and VA) was not available at the time
of data collection. It is not clear if these items are permanently missing or if they have yet to
be archived. These missing data affect respondents who were ages 7-14 between 1928 and 1930
in these 6 states in the 1930 Census, accounting for 7% of the total sample. To resolve this, I
impute Jeanes presence and a Jeanes intensity (months) variable at the county level for these
three years via multiple imputation (see Rubin, 1987).
First, I predict a binary treatment likelihood from a logistic regression. To ensure that all
individuals in the same birth-cohort and county receive the same imputed treatment, imputation
is at the county-year level. I condition on state, Jeanes months in 1910, 1920 and 1923-1927,
Rosenwald presence in 1920, 1927 and 1930, a quadratic in the black population, the black rural
share of the population, and the black literacy and enrollment rates in 1920. I run 10 iterations
of each equation and take the mean of the resulting values. Thus the binary predictor results
in a value ranging from 0 to 1 for each county with missing values in each year. I then repeat
this procedure for months of Jeanes presence using predictive mean matching. In both cases I
exploit the monotone nature of the missing variables in imputation.
Tables A1 and A2 below show results of the imputation for each variable. The first two
columns compare means for imputed counties with non-imputed counties for counties that had
a Jeanes Supervisor present in 1927. The last two columns repeat this for counties without a
Jeanes Supervisor in 1927. The predictive power of the regression appears to decline slightly
over time possibly under-predicting in the final two years. This will assign treated individuals
to the control group, weakening the estimated effects of the Jeanes program and strengthening
the estimated effects of the two have complementary effects.
53
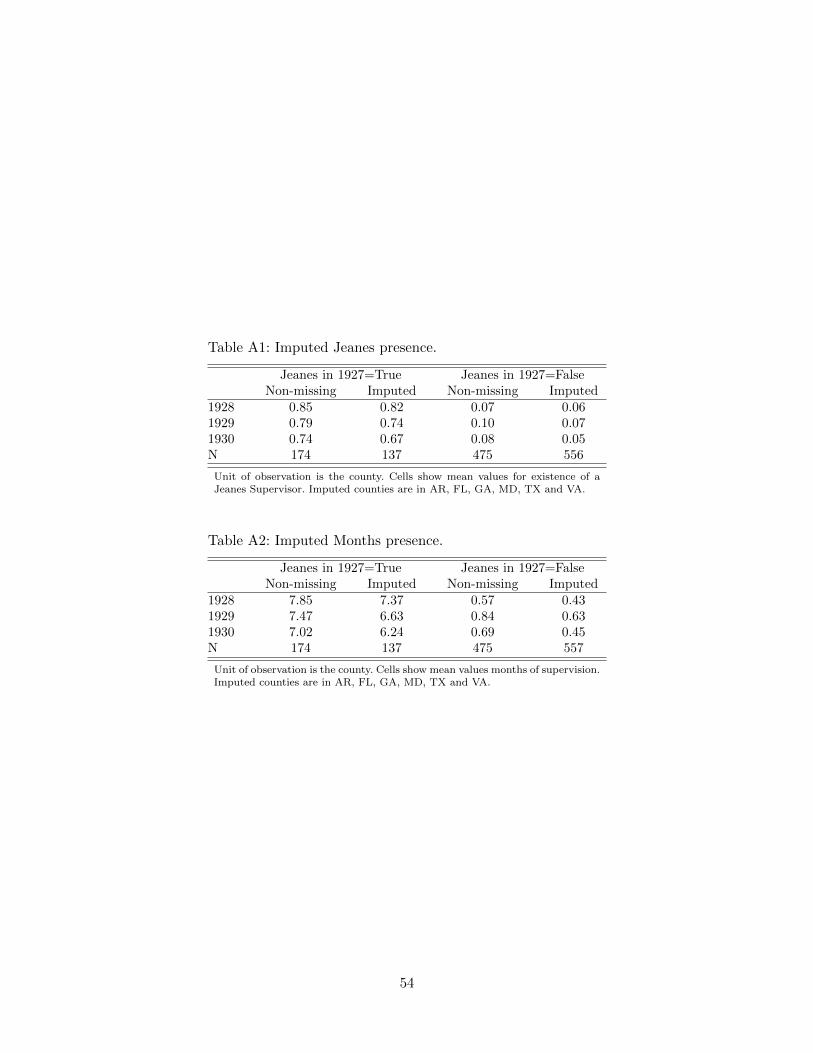
Table A1: Imputed Jeanes presence.
Jeanes in 1927=True Jeanes in 1927=FalseNon-missing Imputed Non-missing Imputed
1928 0.85 0.82 0.07 0.061929 0.79 0.74 0.10 0.071930 0.74 0.67 0.08 0.05N 174 137 475 556
Unit of observation is the county. Cells show mean values for existence of aJeanes Supervisor. Imputed counties are in AR, FL, GA, MD, TX and VA.
Table A2: Imputed Months presence.
Jeanes in 1927=True Jeanes in 1927=FalseNon-missing Imputed Non-missing Imputed
1928 7.85 7.37 0.57 0.431929 7.47 6.63 0.84 0.631930 7.02 6.24 0.69 0.45N 174 137 475 557
Unit of observation is the county. Cells show mean values months of supervision.Imputed counties are in AR, FL, GA, MD, TX and VA.
54