Embed Size (px)
Citation preview

The Next Wave of Spectrum
Reallocation:
The Value of Additional Mid-Band Spectrum
Reallocations
PREPARED FOR
CTIA
PREPARED BY
Coleman Bazelon
November 14, 2017

This report was prepared for CTIA. All results and any errors are the responsibility of the author
and do not represent the opinion of The Brattle Group or its clients.
Acknowledgement: I acknowledge the valuable contributions of many individuals to this report,
and to the underlying analysis, including Valerie Tate.
Copyright © 2017 The Brattle Group, Inc.

i | brattle.com
Table of Contents
Executive Summary .............................................................................................................................. ii
I. Introduction ................................................................................................................................. 1
II. Assessment of Relocation and Accommodation Costs .............................................................. 1
A. 1,300 MHz–1,390 MHz ...................................................................................................... 2
B. 1,780 MHz–1,830 MHz ...................................................................................................... 4
III. Assessment of Spectrum Value ................................................................................................... 6
A. Baseline Spectrum Valuation Model ................................................................................. 6
1. Upper Bound: AWS 3 Auction ................................................................................. 7
2. Lower Bound: Incentive Auction ............................................................................ 7
3. New Demand: 5G and the Internet of Things ......................................................... 9
4. Conclusion: The New Spectrum Value Baseline ................................................... 14
B. Valuation of 1,300 MHz–1,350 MHz Paired with 1,780 MHz–1,830 MHz .................. 16
C. Realizing Value ................................................................................................................ 17
Appendix A: Additional Details by Band .......................................................................................... 19
A. 1,300 MHz–1,350 MHz .................................................................................................... 19
B. 1,780 MHz–1,850 MHz .................................................................................................... 20
Appendix B: Effect of Impairments on Spectrum Value .................................................................. 22
A. Relative Price Analysis .................................................................................................... 23
B. Statistical Analysis ............................................................................................................ 25
Appendix C: Cost Estimates for Relocation of the 1,780 MHz–1,830 MHz Band and 1,300
MHz–1,350 MHz Band .............................................................................................................. 30
A. 1,780 MHz–1,830 MHz Band .......................................................................................... 30
B. 1,300 MHz–1,350 MHz Band .......................................................................................... 34

ii | brattle.com
Executive Summary
Skyrocketing global demand for mobile wireless service, coupled with the coming of 5G
networks and growth of the Internet of Things (IoT), underscores the continuing need and
demand for licensed radio spectrum, including the need for a robust pipeline of spectrum below
3 GHz for exclusive, licensed services. Even after the AWS-3 auction significantly exceeded
expectations, raising more than $40 billion, and an Incentive Auction that raised almost $20
billion, mid-band spectrum will continue to be an integral and valuable component of wireless
networks. Consequently, I anticipate, based on two decades of experience predicting spectrum
auction outcomes, that demand will stay strong for spectrum, including the mid-band
frequencies needed to support mobile broadband networks. Given the significant transition
times often required, now is the time to start the reallocations that will meet future spectrum
demand beyond those auctions.
The spectrum bands identified herein are complementary to the AWS-3 spectrum in many
ways. The 1,780 MHz–1,830 MHz band is directly adjacent to the AWS-3 band (at 1,755 MHz–
1,780 MHz), making it a logical extension for mobile broadband services. Additionally, the 1,300
MHz–1,350 MHz band is a lower frequency than the 2,155 MHz–2,180 MHz portion of the
AWS-3 band, providing additional propagation benefits and offering the ability to provide more
robust services to consumers with fewer base stations. Moreover, these spectrum bands are
populated by federal incumbents that are similar (if not precisely the same) to those in the AWS-
3 band, allowing the previous accrual of knowledge concerning sharing and relocations to be
leveraged as part of the accommodation of these incumbent federal users.
To that end, the analysis below provides an overview of the gross and net auction receipts
expected from reallocating specific bands at 1,300 MHz–1,350 MHz and 1,780 MHz–1,830 MHz
that are currently used by federal users. Specifically, after accounting for a moderation in
spectrum value compared to recent highs, pairing 1,300 MHz–1,350 MHz with 1,780 MHz–1,830
MHz to provide a 50 MHz + 50 MHz paired band would be expected to raise $62.6 billion in
auction receipts. Making those frequencies available would cost up to an estimated $7.93 billion
to relocate existing users, providing them with at least equivalent and in many cases improved
wireless infrastructure. Consequently, this band could be expected to raise $54.7 billion in net
receipts.

iii | brattle.com
The Federal Communications Commission (FCC) has a very good track record, having raised over
$100 billion from spectrum auctions to date. Furthermore, demand for wireless broadband
capacity will continue to grow at a robust pace, and increasing industry revenues will support
acquisitions of additional spectrum. The direct carrier revenues for the wireless industry are
approaching $200 billion per year, generating significant cash flows over the coming years to
support further spectrum acquisitions of the levels estimated here.
1 | brattle.com
I. Introduction
Licensed radio spectrum is the keystone of the fabulously successful wireless industry in the
United States. Before accounting for the recent Incentive Auction, the 645.5 MHz of already
licensed spectrum currently available for mobile broadband (worth almost $500 billion) supports
an industry with almost $200 billion in direct revenues each year and an overall $400 billion
annual economic footprint.1 To sustain this economic juggernaut and meet the fantastic growth
in demand for wireless broadband capacity, additional frequencies will be needed.
Virtually all desirable spectrum bands have incumbent users. Identifying bands to reallocate
therefore requires assessing the costs of either relocating or accommodating incumbent users and
comparing those costs to the value created by using the available frequencies for mobile
broadband networks.2 In what follows, Section II assesses the costs of relocating and/or
accommodating incumbent users in a set of spectrum bands potentially available for reallocation
to mobile broadband.3 Subsequently, Section III assesses the value of each band upon
reallocation. The mid-band spectrum bands considered here share important similarities to the
AWS allocations and have the potential to generate similar interest from the wireless industry.4
II. Assessment of Relocation and Accommodation Costs
I focus on the 1,300 MHz–1,350 MHz and 1,780 MHz–1,830 MHz bands in particular as they
represent crucially needed mid-band spectrum that are already being considered for reallocation
by Congress and have been identified as candidate bands for reallocation by the NTIA. Proposed
legislation introduced in August 2017 – the Advancing Innovation and Reinvigorating
1 Coleman Bazelon and Giulia McHenry, “Mobile Broadband Spectrum: A Vital Resource for the U.S.
Economy,” Prepared for CTIA, 2015.
2 For a more detailed discussion of the appropriate framework for assessing when to relocate
incumbents versus sharing with them, see Coleman Bazelon and Giulia McHenry, “Spectrum Sharing:
Taxonomy and Economics,” The Brattle Group, 2014.
3 Detailed analysis of these bands, and several additional bands, is provided in Section II and Appendix
A.
4 The definition of mid-band spectrum has evolved. At one time the limits of mid-band spectrum were
considered to be about 3 GHz, but now ‘mid-band’ typically refers to the frequencies from 1 GHz up
to 6 GHz.

2 | brattle.com
Widespread Access to Viable Electromagnetic Spectrum (“AIRWAVES”) Act – identifies these
bands for relocation from federal users.5 Furthermore, both bands would be eligible for auction
under the previously-enacted Spectrum Pipeline Act of 2015 and under the MOBILE NOW Act,
passed in the Senate in August 2017. The Spectrum Pipeline Act of 2015 required the
identification of 30 MHz of spectrum for reallocation from federal use to be auctioned in 2024;
the MOBILE NOW Act requires the FCC and NTIA to make at least 255 MHz below 6 GHz
available for mobile and fixed wireless broadband.6 Finally, the NTIA identified both bands as
candidates for reallocation in October 2010.7
A. 1,300 MHZ–1,390 MHZ
This band is part of the larger 1,300 MHz–1,390 MHz allocation. The 1,300 MHz–1,350 MHz
band is used by federal agencies to operate various types of “long-range radar systems that
perform missions critical to safe and reliable air traffic control (ATC) in the national airspace,
border surveillance, early warning missile detection, and drug interdiction.”8
The Federal Aviation Administration (FAA) and Department of Defense (DoD) operate
long-range aeronautical radionavigation radar systems that use a continually rotating
antenna mounted on a tower to monitor aircraft and other targets. Specifically, Air
Route Surveillance Radar (ARSR) systems measure targets’ range, bearing, and velocity.9
The Tethered Aerostat Radar system, consisting of balloon-mounted radars, also operates
in this band and is used for monitoring the southern borders and Caribbean airspace for
drug interdiction.10
5 S.1682 – AIRWAVES Act, 2017. See https://www.congress.gov/bill/115th-congress/senate-
bill/1682/text.
6 The Spectrum Pipeline Act also requires the FCC and NTIA to submit two additional reports in 2022
and 2024, each identifying an additional 50 MHz for reallocation. H.R.1314 - Bipartisan Budget Act of
2015, Title X. See https://www.congress.gov/bill/114th-congress/house-bill/1314. S.19 - MOBILE
NOW Act. See https://www.congress.gov/bill/115th-congress/senate-bill/19.
7 NTIA, “Plan and Timetable to Make Available 500 Megahertz of Spectrum for Wireless Broadband,”
2010. See https://www.ntia.doc.gov/files/ntia/publications/tenyearplan_11152010.pdf.
8 NTIA, “Spectrum Use Report: 1300–1350 MHz,” 2015. See
https://www.ntia.doc.gov/files/ntia/publications/compendium/1300.00-1350.00_01DEC15.pdf.
9 Id.
10 Id.
3 | brattle.com
The military also operates tactical radar systems in this band. These tactical radars “are
designed to be more easily tuned than air traffic control radars, since they may have to
operate in a battlefield environment with many other systems and they need to be able to
change frequencies to reduce their exposure to hostile forces.”11
Finally, the FAA and DoD hold frequency assignments in this band for research and
development purposes in addition to their operational radars. This includes “examining
new waveforms and testing new signal processing techniques.”12
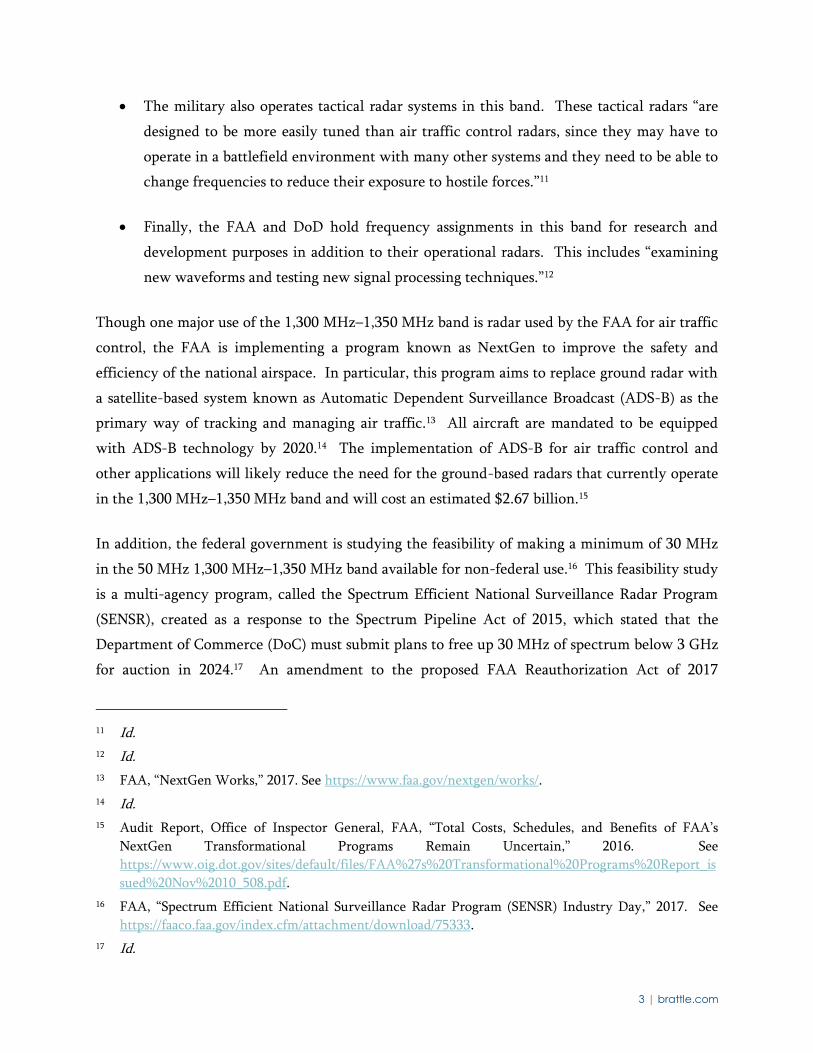
Though one major use of the 1,300 MHz–1,350 MHz band is radar used by the FAA for air traffic
control, the FAA is implementing a program known as NextGen to improve the safety and
efficiency of the national airspace. In particular, this program aims to replace ground radar with
a satellite-based system known as Automatic Dependent Surveillance Broadcast (ADS-B) as the
primary way of tracking and managing air traffic.13 All aircraft are mandated to be equipped
with ADS-B technology by 2020.14 The implementation of ADS-B for air traffic control and
other applications will likely reduce the need for the ground-based radars that currently operate
in the 1,300 MHz–1,350 MHz band and will cost an estimated $2.67 billion.15
In addition, the federal government is studying the feasibility of making a minimum of 30 MHz
in the 50 MHz 1,300 MHz–1,350 MHz band available for non-federal use.16 This feasibility study
is a multi-agency program, called the Spectrum Efficient National Surveillance Radar Program
(SENSR), created as a response to the Spectrum Pipeline Act of 2015, which stated that the
Department of Commerce (DoC) must submit plans to free up 30 MHz of spectrum below 3 GHz
for auction in 2024.17 An amendment to the proposed FAA Reauthorization Act of 2017
11 Id.
12 Id.
13 FAA, “NextGen Works,” 2017. See https://www.faa.gov/nextgen/works/.
14 Id.
15 Audit Report, Office of Inspector General, FAA, “Total Costs, Schedules, and Benefits of FAA’s
NextGen Transformational Programs Remain Uncertain,” 2016. See
https://www.oig.dot.gov/sites/default/files/FAA%27s%20Transformational%20Programs%20Report_is
sued%20Nov%2010_508.pdf.
16 FAA, “Spectrum Efficient National Surveillance Radar Program (SENSR) Industry Day,” 2017. See
https://faaco.faa.gov/index.cfm/attachment/download/75333.
17 Id.

4 | brattle.com
recommends that the SENSR program assess reallocating the entire 1,300 MHz–1,350 MHz band
for non-federal use.18 The SENSR program aims to study the possibility of consolidating existing
radar systems in the 1,300 MHz–1,350 MHz band.19 The 2,700 MHz–3,100 MHz band is one
possibility for relocation of surveillance systems currently operating in the 1,300 MHz–1,350
MHz band.20
If these efforts are demonstrated to be feasible, at least 30 MHz, but as much as 50 MHz, of
spectrum could be freed up for mobile broadband services. Although the ADS-B technology is
expected to cost $2.67 billion to develop and implement, there are no firm costs currently
associated with vacating the remainder of the Federal uses in the 1,300 MHz–1,350 MHz band
for non-federal use.21 In the current analysis, I rely on estimates of clearing costs provided by
CTIA and described in detail in Appendix C. According to those estimates, clearing the band of
these remaining uses will cost between $1 and $1.5 billion, resulting in a total cost to clear the
band of between $3.67 and $4.17 billion.22
B. 1,780 MHz–1,830 MHz
More than 20 federal agencies as of March 2012 were utilizing more than 3,100 individual
frequency assignments in the 1,755 MHz–1,850 MHz band.23 Primary uses of the band included
fixed point-to-point microwave, military tactical radio relay, air combat training systems,
18 As of this writing, Senate Committee on Commerce, Science, and Transportation has approved the
FAA Reauthorization Act subject to Senate confirmation. U.S. Senate Committee on Commerce,
Science, & Transportation, “Committee Approves FAA Reauthorization Through 2021,” 2017, Gardner
2. See https://www.commerce.senate.gov/public/index.cfm/pressreleases?ID=8D616600-D134-4131-
B7A7-CD1FC50ADA1C.
In addition, legislation proposed in the Senate has suggested clearing the entire 1,300 MHz–1,390
MHz band. S.1682 – AIRWAVES Act, 2017. See https://www.congress.gov/bill/115th-
congress/senate-bill/1682/text.
19 FAA, “Fact Sheet – Spectrum Efficient National Surveillance Radar (SENSR),” 2017. See
https://www.faa.gov/news/fact_sheets/news_story.cfm?newsId=21734.
20 NTIA, “Quantitative Assessments of Spectrum Usage,” 2016. See
https://www.ntia.doc.gov/files/ntia/publications/ntia_quant_assessment_report-no_appendices.pdf.
21 See supra, at footnote 15.
22 See Appendix C.
23 DoC, “An Assessment of the Viability of Accommodating Wireless Broadband in the 1755–1850 MHz
Band,” 2012. See
https://www.ntia.doc.gov/files/ntia/publications/ntia_1755_1850_mhz_report_march2012.pdf.

5 | brattle.com
precision guided munitions, tracking telemetry and commanding, aeronautical mobile telemetry,
video surveillance, unmanned aerial systems, and other DoD systems including electronic
warfare, software defined radio, and tactical targeting networking technology.24 In 2014, the
1,755 MHz–1,780 MHz band was auctioned for commercial use as part of the AWS-3 auction,25
providing important experience working with these agencies on reallocating and sharing such
spectrum-based systems. After the auction, it is likely that some systems operating over the
entirety of the 1,755 MHz–1,850 MHz band are being re-tuned to operate solely in the 1,780
MHz–1,850 MHz portion of the band. For example, the relocation of some systems from the
1,710 MHz–1,755 MHz band to accommodate the AWS-1 allocation was apparently less
expensive than originally estimated because it was possible to re-tune many federal systems to
operate in the 1,755 MHz–1,850 MHz band and still meet federal mission requirements.26
According to estimates described in Appendix C, the costs associated with clearing the 1,780
MHz–1,830 MHz band are estimated to be between $2.26 and $3.76 billion.27 These include
remaining costs from the 1,755 MHz–1,780 MHz band transition, including costs to move fixed
point-to-point microwave systems and the military tactical radio relay from the band.28 In
addition, some services currently operating in this band can be moved to the 1,830 MHz–1,850
MHz portion of the band or re-tuned to operate in other bands.29
Assuming that the incumbent satellite systems remain, the 1,780 MHz–1,850 MHz band will
require coordination zones for these systems to protect their operations from potential
interference caused by new commercial wireless broadband operations. According to the
24 NTIA, “Spectrum Use Report: 1755–1850 MHz,” 2014. See
https://www.ntia.doc.gov/files/ntia/publications/compendium/1755.00-1850.00_07NOV14.pdf.
25 FCC, “Factsheet for Auction 97: Advanced Wireless Services (AWS-3),” 2014. See
http://wireless.fcc.gov/auctions/default.htm?job=auction_factsheet&id=97.
26 United States Government Accountability Office, “Spectrum Management: Federal Relocation Costs
and Auction Revenues,” 2013. See http://www.gao.gov/assets/660/654794.pdf.
27 See Appendix C.
28 Id. The total costs associated with clearing the 1,755 MHz-1,780 MHz band were estimated to be $4.58
billion. Letter to Tom Wheeler, FCC, from Lawrence E. Strickling, NTIA, “Notice of Estimated
Relocation or Sharing Costs and Timelines for the 1695-1710 MHz and 1755-1780 MHz Bands,” 2014,
Attachment B2. See
https://www.ntia.doc.gov/files/ntia/publications/notification_to_fcc_re_est_costs_for_1695_and_1755
_bands_05132014.pdf.
29 Id.
6 | brattle.com
Commerce Spectrum Management Advisory Committee (CSMAC), “using existing national
coordination procedures . . . satellite control systems and Electronic Warfare operation can co-
exist with [Long-Term Evolution (LTE)] operations in the [1,755 MHz–1,850 MHz band].”30
Therefore, the sharing parameters developed to protect the satellite systems from operations in
the 1,755 MHz–1,780 MHz segment should be able to be applied to mobile broadband operations
in the 1,780 MHz–1,830 MHz segment. Thus, absent additional information on the undeveloped
coordination zones for the upper portion of the band, the coordination zones from the lower
portion of the band act as a reasonable proxy.31
III. Assessment of Spectrum Value
In this section, I apply an approach to spectrum valuation that I have developed and refined over
the past two decades as a spectrum valuation expert. This approach is outlined in the peer-
reviewed article, “Spectrum Value.”32 I have applied variations of this basic approach to
spectrum valuation as an Analyst at the Congressional Budget Office, in numerous policy
analyses, and as an advisor to bidders in spectrum auctions.33
A. BASELINE SPECTRUM VALUATION MODEL
The value of a swath of spectrum is derived from the profits that can be made by deploying it.
The AWS-3 and Incentive auctions provide recent market-based estimates of the bounds of
spectrum value. But additional developments that will play out in the coming years, including
5G and the IoT, will further impact spectrum values. In this section, I consider recent auction
experience and future industry developments to estimate the baseline value of mid-band
spectrum that will be used to value specific bands at auction.
30 CSMAC, “Report on 1755-1850 MHz Satellite Control and Electronic Warfare,” 2013.
31 For a detailed discussion of the coordination zones developed for the lower portion of the band, see:
FCC and NTIA, “Coordination Procedures in the 1695-1710 MHz and 1755-1780 MHz Bands,” 2014.
32 Coleman Bazelon and Giulia McHenry, “Spectrum Value,” Telecommunications Policy, 2013.
33 I have a long track record of estimating spectrum receipts. For example, I accurately predicted the
revenues from the 700 MHz auction three years prior to the auction. See Coleman Bazelon, “Analysis
of an Accelerated Digital Television Transition,” 2005. I have also significantly underestimated
auction revenues, as was the case with my estimate of the value of AWS-3 spectrum of $12 billion,
when the auction generated bids of almost $43 billion for the paired licenses. Coleman Bazelon, “The
Economic Basis of Spectrum Value: Pairing AWS-3 with the 1755 MHz Band is More Valuable than
Pairing it with Frequencies from the 1690 MHz Band,” 2011. See infra, at footnote 36.

7 | brattle.com
1. Upper Bound: AWS 3 Auction
The AWS-3 auction ended in early 2015 and received gross bids of $44.9 billion for 65 MHz of
spectrum.34 Approximately $2.4 billion of that total was for unpaired up-link frequencies at
1,695 MHz–1,710 MHz.35 Putting those frequencies aside and focusing on the paired licenses,
the total revenue was $42.5 billion or $2.71/MHz-pop.36 Consequently, I start with an estimate
of the upper bound of mid-band spectrum value of $2.71/MHz-pop.
2. Lower Bound: Incentive Auction
The recent Incentive Auction sold up to 70 MHz of low-band 600 MHz spectrum for mobile
wireless networks. The total amount bid was $19.8 billion or $0.93/MHz-pop.37 This price point
provides a lower bound estimate of value for at least three reasons.
First, this is low-band spectrum. As described in more detail below, 5G network architecture
makes use of a mix of low-, mid-, and high-band frequencies. The low-band frequencies provide
34 For details on the AWS-3 auction, see the FCC’s “Factsheet for Auction 97” at
http://wireless.fcc.gov/auctions/default.htm?job=auction_factsheet&id=97. Total net bids in the
auction were $41.3 billion. The gross amount included $3.6 billion in bidding credits—$3.3 billion of
which was for DISH related entities. Those entities were denied their bidding credits and in response
chose to turn in licenses of an equivalent value. Consequently, the total value of the band will be
$41.3 billion plus the amount the FCC raises when those returned licenses are re-auctioned. Herein, I
assume those licenses will receive bids in the same amounts they received in the original auction,
implying a total value of $44.9 billion.
35 Total bid values for the AWS-3 A1 and B1 blocks are calculated using the following FCC auction data:
http://auctionresults.fcc.gov//Auction_97/Results/full/341//97_341_all_files.zip.
36 Based on 2010 U.S. population of approximately 313 million within the Partial Economic Areas
(PEAs) defined by the FCC. $2.71/MHz-pop = $42.46 billion / [(65 MHz–15 MHz) x 313 million pops];
FCC, “Incentive Auction: Forward Auction – Markets,” 2017. See
https://auctiondata.fcc.gov/public/projects/1000/reports/forward-markets.
37 For details on the Incentive Auction, see the FCC’s “Auction 1000” page at
https://www.fcc.gov/wireless/auction-1000. Between four and seven licenses with 10 MHz were
licensed in each of the 416 PEAs, resulting in a total of 21.2 billion MHz-pops auctioned. $0.93/MHz-
pop = $19.8 billion / 21.2 billion MHz-pops. FCC, “Incentive Auction: Assignment Phase – Results by
License,” 2017. See https://auctiondata.fcc.gov/public/projects/1000/reports/assignment-
results_by_license. FCC, “Incentive Auction: Forward Auction – Markets,” 2017. See
https://auctiondata.fcc.gov/public/projects/1000/reports/forward-markets. FCC, “Incentive Auction:
Forward Auction – Band Plans,” 2017. See
https://auctiondata.fcc.gov/public/projects/1000/reports/forward-band_plans. FCC, “Incentive
Auction: Forward Auction – Announcements,” 2017. See
https://auctiondata.fcc.gov/public/projects/1000/reports/forward-announcements.

8 | brattle.com
a coverage layer, which are crucial for providing access to the network but are not the primary
spectrum that will be used for meeting significant capacity needs. These frequencies would be
most valuable to entrants and existing players that need to enhance their coverage layers.
Consequently, demand for these frequencies should be lower than demand for mid-band
spectrum.
Second, specific issues with this auction made it more difficult for the auction to realize the full
value of the frequencies being sold. Among other factors, the iterative nature of the auction’s
process, which endogenously discovered the market-clearing amount of spectrum, meant that
significant time lapsed from when the up-front deposits were due from bidders on July 1, 2016 to
when final bidding ended on February 10, 2017.38 This unusually long auction process created a
dynamic where existing bidders could exit or reduce their demand in response to changing
circumstances—such as the resolution of the FirstNet frequencies that would be commercially
accessible—but no new bidders could join the bidding. This one-way ratchet of demand risks
artificially depressing demand in the auction.
Third, recent transactions of similar spectrum in the 700 MHz band suggest that prices leading
up to the auction were higher, albeit trending downward. See Table 1
38 FCC, “Upfront Payment Instructions for the Forward Auction (Auction 1002) of the Broadcast
Television Spectrum Incentive Auction,” June 8, 2016. See
https://apps.fcc.gov/edocs_public/attachmatch/DA-16-625A1.pdf. FCC, “Incentive Auction: Forward
Auction – Announcements,” February 10, 2017. See
https://auctiondata.fcc.gov/public/projects/1000/reports/forward-announcements.

9 | brattle.com
Table 1: T-Mobile 700 MHz A-Block Spectrum Purchases
Sources and Notes:
[1] - [3]: Includes 700 MHz A-Block spectrum transactions involving T-Mobile and with financial information available. FCC ULS License Databases. See http://wireless.fcc.gov/uls/index.htm?job=transaction&type=weekly.
[4][A]: Colin Gibbs, "T-Mobile's $420M price tag for Chicago's 700 MHz may not point to 600 MHz auction value: analysts," Fierce Wireless, 2016. See http://www.fiercewireless.com/wireless/t-mobile-s-420m-price-tag-for-chicago-s-700-mhz-may-not-point-to-600-mhz-auction-values.
[4][B]: T-Mobile reports having spent approx. $1.3 billion for licenses in the first half of 2016, with some deals potentially made in 2015, for licenses covering approx. 68 million people. It is unclear which transactions are included in this sum, so all T-Mobile transactions from November 2015 to April 2016 are included. Mike Dano, "T-Mobile's 700 MHz buildout in 2016 revealed: Over $1B spent in Utah, Southeast and elsewhere," Fierce Wireless, 2016. See http://www.fiercewireless.com/wireless/t-mobile-s-700-mhz-buildout-2016-revealed-over-1b-spent-utah-southeast-and-elsewhere.
[4][C]: It is possible that the purchase price covers additional transactions, as T-Mobile reported spending $50.5 million on licenses covering 8.7 million pops. The transactions with Actel and I-700 appear to only cover 7.6 million pops. Phil Goldstein, "T-Mobile scores more 700 MHz A-Block spectrum from CenturyLink unit," Fierce Wireless, 2014. See http://www.fiercewireless.com/wireless/t-mobile-scores-more-700-mhz-a-block-spectrum-from-centurylink-unit.
[4][D]: Phil Goldstein, "T-Mobile buys Verizon's 700 MHz A Block spectrum for $2.4B," Fierce Wireless, 2014. See http://www.fiercewireless.com/wireless/t-mobile-buys-verizon-s-700-mhz-a-block-spectrum-for-2-4b.
[5]: [4] / [3].
[6]: Composite relative value index for all licenses in each transaction. Calculated as the total price per MHz-pop for all BEAs covered in each transaction from the FCC's Auction 97 (AWS-3) divided by the national average price per MHz-pop from the same auction. The price per MHz-pop is calculated as the weighted average price across the gross winning bids for the H-, I-, and J-blocks.
[7]: [5] / [6].
3. New Demand: 5G and the Internet of Things
The most recent technological development that will impact spectrum value is the creation and
deployment of 5G networks. The current mobile network, fourth-generation (4G) LTE, provides
“more capacity for faster and better mobile broadband experiences.”39 A 4G wireless network
39 Qualcomm PowerPoint Presentation, “The Evolution of Mobile Technologies,” 2014. See
https://www.qualcomm.com/media/documents/files/the-evolution-of-mobile-technologies-1g-to-2g-
to-3g-to-4g-lte.pdf.
Sold By Year of Sale MHz-pops
Purchase
Price
($ mm) $/MHz-pop
Relative
Value Index
Implied
National
Average
$/MHz-pop
[1] [2] [3] [4] [5] [6] [7]
[A] AT&T / Leap Licenseco Inc. 2016 129,097,416 $420 $3.25 1.98 $1.64
[B] Multiple Transactions, Nov
2015-Apr 2016
2015-2016 834,446,352 $1,300 $1.56 0.63 $2.48
[C] Actel and I-700 2014 90,107,976 $51 $0.56 0.23 $2.48
[D] Verizon / Cellco Partnership 2014 1,790,166,204 $3,315 $1.85 1.36 $1.36

10 | brattle.com
using LTE technology will soon be able to transmit at speeds as high as 1.2 gigabits per second
(Gbps).40 The next 5G wireless networks, however, are expected to support speeds that can reach
20 Gbps downlink and 10 Gbps uplink per base station in ideal conditions, while still well
outpacing 4G networks in more typical settings.41 In addition to faster data speeds, a 5G network
is envisaged to have several other key capabilities, including: (i) ultra-low latency (as low as one
millisecond); (ii) increased capacity; and (iii) increased connection density (as high as one million
devices per square kilometer).42
The development of new 5G technology is also predicted to speed the growth of two budding
data-intensive applications: the IoT and mission critical control. The IoT refers to the linking
and communication between physical objects, such as roadways and buildings, using wired and
wireless networks.43 By 2020, there could be over 26 billion connected devices, with some
estimates ranging as high as 100 billion - “anything that can be connected, will be connected.”44
Mission critical communications are envisioned to allow for the real-time control and
40 Aaron Pressman, “Qualcomm Is Trying To Speed Up Current Mobile Networks Ahead of 5G,”
Fortune, 2017. See http://fortune.com/2017/02/21/qualcomm-speeds-4g-lte-modem/.
41 User experienced data rates are often not as high as the peak data rate in a given network. The
International Telecommunications Union (ITU) envisions 5G to have peak down-link data rates of 20
Gbps and user experienced rates as high as 100 Mbps. ITU, “IMT Vision – Framework and Overall
Objectives of the Future Development of IMT for 2020 and Beyond,” 2015. See
https://www.itu.int/dms_pubrec/itu-r/rec/m/R-REC-M.2083-0-201509-I!!PDF-E.pdf (“ITU, IMT
Vision”); and ITU, “Draft new Report ITU-R M.[IMT-2020.TECH PERF REQ] - Minimum
requirements related to technical performance for IMT-2020 radio interface(s),” 2017. See
https://www.itu.int/md/R15-SG05-C-0040/en (“ITU, Draft IMT-2020 Minimum Requirements”).
42 The other key capabilities listed by the ITU include: increased spectrum efficiency, increased
mobility, and increased network energy efficiency. See ITU, IMT Vision; and ITU, Draft IMT-2020
Minimum Requirements.
43 Michael Chui, Markus Löffler, and Roger Roberts, “The Internet of Things,” McKinsey Quarterly,
2010. See http://www.mckinsey.com/industries/high-tech/our-insights/the-internet-of-things. The
ITU refers to these two usage scenarios as “ultra-reliable and low latency communication” and
“massive machine type communications.” See ITU, IMT Vision; and ITU, Draft IMT-2020 Minimum
Requirements.
44 Jacob Morgan, “A Simple Explanation of ‘The Internet of Things,’” Forbes, 2014. See
http://www.forbes.com/sites/jacobmorgan/2014/05/13/simple-explanation-internet-things-that-
anyone-can-understand/#1c732b186828.
11 | brattle.com
automation of dynamic processes, such as autonomous vehicles and robotics.45 Some estimates
suggest that by 2025, there could be as many as 3 million autonomous vehicles alone.46
Future wireless networks must satisfy both a rise in demand for mobile data and a rise in demand
for faster mobile data speeds; satisfying both of these needs will require more spectrum and
different types of spectrum. That is, the architecture of a robust 5G network will require
spectrum in a variety of bands: “low-band” spectrum below 1 GHz for wide-area and long-range
communications; “mid-band” spectrum between 1 GHz and 6 GHz for applications that would
benefit from a combination of coverage and capacity support in mobile broadband networks and
mission critical communications; and “high-band” spectrum for short range communications
requiring fast data rates and low latency.47 A 5G network will be based on a dense heterogeneous
network structure that includes the dense deployment of small cells in connection with the
growing number of macro cells to increase network efficiency and to make connectivity more
uniform across users.48 All three pieces of this “spectrum trifecta” will be crucial for the
successful deployment of a 5G network, as stated by Ericsson:
It is important to understand that high frequencies, especially those above 10GHz,
can only serve as a complement to lower frequency bands, and will mainly
45 Qualcomm PowerPoint Presentation, “Building a unified 5G platform: For the next decade and
beyond,” 2015; and Osman Yilmaz, “5G Radio Access for Ultra-Reliable Low-Latency
Communications,” Ericsson Research Blog, 2015. See https://www.ericsson.com/research-blog/5g/5g-
radio-access-for-ultra-reliable-and-low-latency-communications/.
46 ABI Research, “5G to be Unifying Connectivity Technology for Future Cars; To Enable V2X
Communication,” 2016. See https://www.abiresearch.com/press/5g-be-unifying-connectivity-
technology-future-cars/.
47 Letter to Marlene H. Dortch, FCC from Reed Hundt, “Use of Spectrum Bands Above 24 GHz for
Mobile Radio Services, GN Docket No. 14-177; IB Docket Nos. 15-256, 97-95; WT Docket No. 10-112;
RM-11664,” 2016. See
https://ecfsapi.fcc.gov/file/1070164539932/Hundt%20Letter%20on%205G%20(7-1-2016).pdf. Tom
Wheeler, “The Future of Wireless: A Vision for U.S. Leadership in a 5G World,” prepared remarks at
the National Press Club, Washington, D.C., 2016. See
http://transition.fcc.gov/Daily_Releases/Daily_Business/2016/db0620/DOC-339920A1.pdf. GSMA
Public Policy Position, “5G Spectrum,” 2016. See http://www.gsma.com/spectrum/wp-
content/uploads/2015/04/5G-Spectrum-Policy-Position-FINAL-2016-update-.pdf.
48 Boyd Bangerter, Shilpa Talwar, Reza Arefi, and Ken Stewart, “Networks and Devices for the 5G Era,”
IEEE Communications Magazine, February 2014 (“Bangerter, Talwar, et al., “Networks and Devices
for the 5G Era”). GSMA Public Policy Position, “5G Spectrum,” 2016. See
http://www.gsma.com/spectrum/wp-content/uploads/2015/04/5G-Spectrum-Policy-Position-FINAL-
2016-update-.pdf.

12 | brattle.com
provide additional system capacity and very wide transmission bandwidths for
extreme data rates in dense deployments.49
Until last year, all spectrum currently allocated to mobile wireless networks was concentrated in
the low-and mid-bands below 6 GHz.50 Until recently, spectrum above about 3 GHz was not
seen as viable to deploy in mobile networks. This was primarily because the propagation
characteristics of high frequencies would require cell sites that would be too limited in coverage
to be economical. However, developments in 5G technology are making it possible to
economically deploy high-band spectrum, specifically spectrum above 24 GHz, for mobile
wireless.51 In its Spectrum Frontiers proceeding, the FCC opened almost 11 GHz of licensed and
unlicensed spectrum in the 28 GHz, 37 GHz, 39 GHz, and 64-71 GHz bands for wireless
broadband.52
High-band spectrum is expected to be deployed for 5G first in dense areas and spaces like
stadiums and public transportation stops where the wireless data demands are greatest.53 Such
dense areas make it economical to deploy high-band spectrum since there will still be many users
49 Ericsson White Paper, “5G Radio Access,” 2016. See
http://www.ericsson.com/res/docs/whitepapers/wp-5g.pdf. The term “spectrum trifecta” was coined
by FCC Chairman Tom Wheeler in his June 20th, 2016 remarks at the National Press Club. Tom
Wheeler, “The Future of Wireless: A Vision for U.S. Leadership in a 5G World,” prepared remarks at
the National Press Club, Washington, D.C., 2016. See
http://transition.fcc.gov/Daily_Releases/Daily_Business/2016/db0620/DOC-339920A1.pdf.
50 Bangerter, Talwar, et al., “Networks and Devices for the 5G Era”; and FCC, “Fact Sheet: Spectrum
Frontiers Proposal to Identify, Open Up Vast Amounts of New High-Band Spectrum for Next
Generation (5G) Wireless Broadband,” 2016. See https://apps.fcc.gov/edocs_public/attachmatch/DOC-
339990A1.pdf.
51 See, for example, Thomas K. Sawanobori and Paul V. Anuszkiewicz, “High Band Spectrum, The Key
to Unlocking the Next Generation of Wireless,” CTIA, 2016. See https://www.ctia.org/docs/default-
source/default-document-library/5g-high-band-white-paper.pdf.
52 FCC, “Fact Sheet: Spectrum Frontiers Proposal to Identify, Open Up Vast Amounts of New High-Band
Spectrum for Next Generation (5G) Wireless Broadband,” 2016. See
https://apps.fcc.gov/edocs_public/attachmatch/DOC-339990A1.pdf.
53 See, for example, Thomas K. Sawanobori and Paul V. Anuszkiewicz, “High Band Spectrum, The Key
to Unlocking the Next Generation of Wireless,” CTIA, 2016. See https://www.ctia.org/docs/default-
source/default-document-library/5g-high-band-white-paper.pdf.

13 | brattle.com
in the smaller coverage areas necessary for higher frequencies.54 However, not all 5G and IoT
deployments will be concentrated in dense urban areas. Mobile operators like Verizon are
conducting 5G trials in cities with a range of population densities.55 Many of the anticipated
hallmarks of the IoT, such as connected devices, integrated road networks, and driverless cars,
will be deployed in less dense urban and suburban areas in addition to urban cores.56 Thus,
although the ultimate economic boundaries of where the highest frequencies will be deployed
for 5G are still uncertain, less dense urban and suburban areas are likely to be included in 5G
deployments as they prove commercially successful.57 The question of where 5G is deployed may
ultimately be one of timing, with urban areas seeing earlier deployments and applications for
suburban and rural areas evolving later.
These new 5G and IoT deployments will have profound implications for spectrum value. On the
one hand, being able to integrate massive amounts of high-band spectrum into commercial
mobile networks will flood the market with spectrum capacity, at least in denser, urban areas,
and for applications that can utilize the higher frequency spectrum. On the other hand, these
new networks will enable new uses of wireless networks and increase consumer expectations
about throughput and reliability. The net effect of these two implications is uncertain, and
overall spectrum values, especially for mid-band capacity spectrum, could go up or down.
54 See, for example, Thomas K. Sawanobori and Paul V. Anuszkiewicz, “High Band Spectrum, The Key
to Unlocking the Next Generation of Wireless,” CTIA, 2016. See https://www.ctia.org/docs/default-
source/default-document-library/5g-high-band-white-paper.pdf.
55 See, for example, Diana Goovaerts, “Verizon Announces 5G Customer Trials in 11 Cities with 5G
Forum Partners,” Wireless Week, 2017. See https://www.wirelessweek.com/news/2017/02/verizon-
announces-5g-customer-trials-11-cities-5g-forum-partners.
56 For example, it has been argued that the shift toward driverless cars may even encourage urban sprawl
as it becomes easier to live far from city centers. Noah Smith, “Like the Suburbs? You’ll Love
Driverless Cars,” Bloomberg View, 2015. See https://www.bloomberg.com/view/articles/2015-11-
04/like-the-suburbs-you-ll-love-driverless-cars-.
57 For example, an analysis by Plum Consulting finds that C-band spectrum would be deployed in all
non-rural areas of the UK, and although C-band is considered mid-band in the 5G rubric, I take the
analysis here as indicative of where new, higher frequencies will generally be economical to deploy.
Plum Consulting classifies these non-rural areas as any area with a population density of at least 202
people per square kilometer. Tony Lavender, Paul Hansell, Iain Inglis, and Sarongrat Wongsaroj, "Use
of C-Band (3400/3600-4200 MHz) for mobile broadband in Hungary, Italy, Sweden and the UK," Plum
Consulting, 2015. See http://www.plumconsulting.co.uk/pdfs/Plum_Jun2015_Use_of_C-
Band_for_mobile_broadband_in_Hungary_Italy_Sweden_and_UK.pdf. GSMA Public Policy Position,
“5G Spectrum,” 2016. See http://www.gsma.com/spectrum/wp-content/uploads/2015/04/5G-
Spectrum-Policy-Position-FINAL-2016-update-.pdf.

14 | brattle.com
But within the overall net impact on spectrum values, there are clear implications from increased
user expectations for throughput, mobility, and latency for different types of spectrum. The
value of mid-band spectrum used for capacity outside of the urban areas served by 5G
deployments should increase because demand for network capacity—reset to a user experience
based on a higher level of throughput in the urban areas—will be greater in those non-urban
areas. Consequently, the flood of high-band frequencies that may enter service will not
substitute for the mid-band frequencies analyzed here.
4. Conclusion: The New Spectrum Value Baseline
Expectations about overall spectrum values are somewhere between $0.93/MHz-pop seen in the
Incentive Auction and $2.71/MHz-pop seen in the AWS-3 auction. There are several reasons to
believe spectrum values for mid-band spectrum are at the higher end of this range. First of all,
the high end of the range was set by a mid-band spectrum auction. Also, as noted above, the
lower end of the range likely understates the real value of low-band spectrum. Furthermore,
developments with 5G and the IoT suggest a tilting of demand toward mid-band spectrum
relative to low-band spectrum. Taking this all together, and using a bit of judgment based on
more than two decades of estimating spectrum values, I will use $2.00/MHz-pop to value the
mid-band spectrum analyzed here. Given the larger overall base of spectrum that will be used in
mobile markets in 5G deployments, the increases in the quantity of spectrum available for mobile
broadband is relatively small, so I make no adjustments to price for any quantity effects of new
spectrum and use the $2.00/MHz-pop estimate of mid-band spectrum value throughout the
analysis.
As noted above, there is some degree of uncertainty about the future development of spectrum
prices. My estimate of $2.00/MHz-pop represents my expectation about spectrum values after
weighing factors that could lead to higher or lower values. That is, $2.00/MHz-pop is my
expected value for the frequencies considered here. But there is some uncertainty around that
expectation. If prices are higher than expected, as was the case with the AWS-3 auction,58 then
realized auction receipts would contain a windfall—a happy occurrence from a budgetary
standpoint. But prices could be lower than expected, leading to less revenue than originally
planned. To illustrate the downside risk, I also present a downside scenario. This would be
realized if the impact of 5G developments were less dramatic in increasing both relative and
58 For instance, see supra, at footnote 33.

15 | brattle.com
absolute levels of demand for mid-band spectrum, leading to lower prices. In this case, the value
of mid-band spectrum would be closer to the low end of the range discussed above, and I use
$1.00/MHz-pop to illustrate this downside scenario.
Other typical considerations when comparing the relative value of different spectrum bands
includes the size of the allocation, whether it is paired, and potential international
harmonization. None of the allocations considered are unusually small or large; the evolution of
Time Division Duplex (TDD) (including in 5G standards59) suggests changing dynamics of TDD
versus Frequency Division Duplex (FDD); and one of the two bands analyzed is harmonized,
suggesting additional benefits in equipment development from international uses of the band.60
Consequently, in the case of the bands evaluated here, I make no further adjustment for these
issues to the baseline.
Finally, impairments in a band may cause a diminution in band value. For the bands considered
below, the exact areas of impairment are not yet known. However, analysis of the AWS-3
auction suggests a somewhat surprising result: the levels of impairment in the AWS-3 band do
not appear to have caused any reduction in prices paid. As detailed in Appendix B, I analyze the
relative prices of licenses in the AWS-3 auction compared to the relative prices of similar licenses
in the AWS-1 auction and find no evidence that impairments impacted relative prices. Given
the differences in impairments and that there is no evidence of a difference in relative prices, I
conclude that the level of impairments seen in the AWS-3 auction did not impact prices. In a
complimentary analysis, I utilize econometric techniques to test whether or not the presence or
level of impairment has a statistically significant negative impact on the prediction of prices in
the AWS-3 auction. Similarly, I find no evidence that impairments impact the realized value of
licenses in the auction. Therefore, to the extent that the impairments in the bands examined
below are not significantly worse than expected, I do not expect impairments to negatively
impact auction prices for these bands. Should impairments of bands be significantly worse, some
adjustment to the estimated value may be warranted.
59 Qualcomm, “Making 5G NR a reality,” 2016. See
https://www.qualcomm.com/media/documents/files/whitepaper-making-5g-nr-a-reality.pdf.
60 The 1,780 MHz-1,830 MHz band is harmonized. FCC, “FCC Online Table Of Frequency Allocations,”
2017. See https://transition.fcc.gov/oet/spectrum/table/fcctable.pdf.

16 | brattle.com
B. VALUATION OF 1,300 MHZ–1,350 MHZ PAIRED WITH 1,780 MHZ–1,830 MHZ
This section will value the pairing of the 1,300 MHz–1,350 MHz and the 1,780 MHz–1,830 MHz
bands. I apply the estimated price of mid-band spectrum of $2.00/MHz-pop to the quantity of
spectrum available and subtract the costs of making the spectrum available. I also present a
downside scenario based on a value of $1.00/MHz-pop.
This pairing, which uses mid-band spectrum that is adjacent to the AWS allocation with lower
down-link frequencies at 1,300 MHz–1,350 MHz, would have more favorable propagation
characteristics for coverage than the AWS allocations. Somewhat offsetting this advantage, this
new allocation does not have a current ecosystem developed. The Spectrum Pipeline Act of 2015
directed federal agencies to examine clearing at least 30 MHz of spectrum for mobile use; to that
end, four agencies – FAA, DoD, Department of Homeland Security (DHS), and National Oceanic
and Atmospheric Association (NOAA) – are studying the feasibility of clearing a minimum of 30
MHz of the 1,300 MHz-1,350 MHz band.61 Consequently, any amount between 30 MHz and 50
MHz of that band may be made available, but because Congress is recommending that the SENSR
program examine clearing all 50 MHz in the 1,300 MHz–1,350 MHz band, I will focus on the
case where 50 MHz is made available.62 In doing so, I will assume that the frequencies from the
1,300 MHz–1,350 MHz band are evenly paired with frequencies from the 1,780 MHz–1,830 MHz
band, creating a total allocation of 100 MHz. It is worth noting that even though I am assuming
these frequencies are “paired,” they could be sold as TDD bands—doing so would not likely
change the analysis significantly.
With 313 million people covered, this allocation represents 31.3 billion MHz-pops.63
Consequently, the value before accounting for impairments or incumbent reallocation costs is
$62.6 billion.64
61 FAA, “Spectrum Efficient National Surveillance Radar Program (SENSR) Industry Day,” January 5,
2017. See https://faaco.faa.gov/index.cfm/attachment/download/75333; and H.R.1314 - Bipartisan
Budget Act of 2015, Title X. See https://www.congress.gov/bill/114th-congress/house-bill/1314.
62 See supra, at 18.
63 31.3 billion MHz-pops = 100 MHz x 313 million people. For total US population, see FCC, “Incentive
Auction: Forward Auction – Markets,” 2017. See
https://auctiondata.fcc.gov/public/projects/1000/reports/forward-markets.
64 $62.60 billion = $2.00/MHz-pop x 100 MHz x 313 million people.
17 | brattle.com
I make no further adjustment for impairments. I do not have any evidence that the coordination
zones will be significantly worse than for AWS-3, so I make no further adjustments for them. If
coordination zones are significantly larger than for AWS-3, then some further adjustment would
be warranted.
As noted in Section II, the costs of clearing the 1,300 MHz–1,350 MHz band and 1,780 MHz–
1,830 MHz band would be between $3.67 and $4.17 billion and between $2.26 and $3.76 billion,
respectively—amounting to a total expected cost of between $5.93 and $7.93 billion. On net,
this band would therefore be expected to raise between $54.7 and $56.7 billion for 100 MHz.65
For a downside scenario, the auction receipts would be estimated to be $31.3 billion, with net
receipts between $23.4 and $25.4 billion for 100 MHz.66
C. REALIZING VALUE
Whether or not any given auction will realize the value of the spectrum licenses being sold
depends on a number of specifics that cannot be known ahead of time. The auction rules matter,
including set-asides or reserved spectrum (which will likely decrease revenues) and bidding
credits (which may raise revenues). Macroeconomic and industry conditions at the time of the
auction can also impact auction outcomes. And of course auction participation, and the budgets
that participants bring, is also important. Consequently, it would be inappropriate to try to
forecast such auction-specific details years in the future.
Nevertheless, at a high level, there is cause for optimism for future FCC auctions realizing value.
The FCC has a very good track record with auctions, having raised over $100 billion to date.67
Furthermore, their sophistication with auction design and implementation grows with time—
and was taken to a new level with the Incentive Auction. The macroeconomic and industry
expectations in coming years also support high revenues. Demand for wireless broadband
capacity, especially for the relatively scarce mid-band frequencies, will continue to grow at a
robust pace and increasing industry revenues will support acquisitions of additional spectrum.
The direct carrier revenues for the cellular industry are approaching $200 billion per year,
65 $54.67 billion = $62.60 billion – $7.93 billion. $56.67 billion = $62.60 billion – $5.93 billion.
66 $31.30 billion = $1.00/MHz-pop x 100 MHz x 313 million people. $23.37 billion = $31.30 billion –
$7.93 billion. $25.37 billion = $31.30 billion – $5.93 billion.
67 FCC, “Auctions Summary,” 2015. See
http://wireless.fcc.gov/auctions/default.htm?job=auctions_all#completed.

18 | brattle.com
generating significant cash flows over the coming years to support further spectrum acquisitions
of the levels estimated here.68
68 CTIA, “Annual Year-End 2016 Top-Line Survey Results,” 2017. See
https://www.ctia.org/docs/default-source/default-document-library/annual-year-end-2016-top-line-
survey-results-final.pdf?sfvrsn=2.
19 | brattle.com
Appendix A: Additional Details by Band
In what follows, for each type of operation or system (e.g., long range radar systems or polar-
orbiting weather satellites) within a particular band of spectrum, I provide additional detail on
what is known about the incumbent users and the possible restrictions or coordination zones for
each such user.69 Specifically, in cases where incumbent users are expected to remain upon
reallocation of a particular band of spectrum, I describe the coordination zones that are likely to
result.
A. 1,300 MHZ–1,350 MHZ
Long Range Radar Systems
Spectrum contours for all radar systems operating in the 1,300 MHz–1,390 MHz band have been
computed by the NTIA for a generic ground-based receiver (see Figure 1).70 These contours
represent the locations where the signal level of the radar system will cause the receiver to
exceed an interference threshold of 1 dB—they do not, however, represent the physical coverage
area of the radar.71 Therefore, if any incumbent radar systems were to remain in the band upon
reallocation, these contours would serve as a reasonable proxy for the terrestrial coordination
zones associated with each radar system.
69 The only exception is in the 1,780 MHz – 1,850 MHz band, where I lump all such operations together
due to the vast quantity and variety of incumbent systems in the band.
70 NTIA, “Spectrum Use Report: 1300-1350 MHz,” 2014; NTIA, “Spectrum Use Report: 1350-1390
MHz,” 2014.
71 Id. Actual receiver tolerance may be higher or lower, depending on the specific wireless broadband
system deployed.

20 | brattle.com
Figure 1. Spectrum Contours for Radars Operating in the 1,300 MHz–1,390 MHz Band Segment
Source: NTIA, 2014.
B. 1,780 MHZ–1,850 MHZ
All Users
The CSMAC conducted several studies to evaluate sharing compatibility between commercial
LTE systems and federal systems operating in the 1,755 MHz–1,850 MHz band, in addition to
considering effective transition and/or relocation strategies. In summary the studies found:
Video surveillance systems would need to be relocated to facilitate sharing.72
Satellite control systems and electronic warfare operations could co-exist with LTE
operations, as i) LTE devices were shown to produce only “negligible interference to all
satellite programs except possibly a few experimental spacecraft,” ii) several technologies
were identified to mitigate harmful interference from LTE base stations, and iii)
electronic warfare operations could continue on a non-interference basis using existing
national coordination procedures.73
72 CSMAC, “Working Group 2: 1755–1850 MHz Law Enforcement Surveillance, Explosive Ordinance
Disposal, and other short distance links,” 2013. These systems would likely first be consolidated into
the 1,839-1,850 MHz band and may ultimate be moved to other bands, such as the 2,025-2,1100 MHz
band, the 2,200-2,290 MHz band, or the 2,360-2,390 MHz band. See Appendix C.
73 CSMAC, “Report on 1755–1850 MHz Satellite Control and Electronic Warfare,” 2013.

21 | brattle.com
Fixed point-to-point microwave operations would need to be relocated to facilitate
sharing, but tactical radio relay and joint tactical radio systems could not share spectrum
with commercial LTE systems without requiring separation distances of hundreds of
kilometers.74
Certain federal airborne systems may need to be relocated to facilitate sharing—however
the identification and consideration of such alternate spectrum was not directly
addressed.75 Further, sharing of frequencies between commercial LTE and airborne
systems (e.g., air combat training systems, small unmanned aircraft systems, precision-
guided munitions, and aeronautical mobile telemetry) would not be feasible without
requiring separation distances of hundreds of kilometers.76
Thus, it is reasonable to assume that the entirety of the band will be cleared other than the
incumbent federal satellite systems—which will entail the establishment of coordination zones.
Prior to the AWS-3 auction, coordination zones were established for the incumbent federal
satellite systems in the 1,755 MHz–1,780 MHz portion of the band.77 Given the conclusions of
the CSMAC, and pending further study, these coordination zones appear to be reasonable proxies
for the coordination zones that are likely to be established in the upper portion of the band upon
reallocation.
74 CSMAC, “1755–1850 MHz Point-to-Point Microwave Tactical Radio Relay (TRR) Joint Tactical Radio
System / Software Defined Radio (JTRS/SDR),” 2013. Fixed point-to-point microwave operates will be
relocated to the 4,400-4,490 MHz or 7,125-8,500 MHz bands, and tactical radio relay will be relocated
to the 2,025-2,110 MHz or 2,200-2,290 MHz bands. DoC, “An Assessment of the Viability of
Accommodating Wireless Broadband in the 1755–1850 MHz Band,” 2012. See
https://www.ntia.doc.gov/files/ntia/publications/ntia_1755_1850_mhz_report_march2012.pdf.
75 CSMAC, “1755–1850 MHz Airborne Operations,” 2013.
76 Id.
77 FCC and NTIA, “Coordination Procedures in the 1695–1710 MHz and 1755–1780 MHz Bands,” 2014.

22 | brattle.com
Appendix B: Effect of Impairments on Spectrum Value
The AWS-3 auction provides a unique opportunity to empirically investigate the impact of
impairments on the value of spectrum. In the AWS-3 band, certain licenses are shared between
license winners and the incumbent federal operations that currently operate in these areas.78
Sharing between auction winners and the federal operations occurs via a coordination process
that takes place over a specified “transition timeline.”79 Licenses are potentially impaired by the
DoD in two ways: via interference from AWS-3 up-link transmissions that may create noise for
DoD receivers and from DoD transmitters to AWS-3 receivers.
Because the level of impairment generated by interference from AWS-3 transmitters to DoD
systems is used to define federally regulated protection zones where successful coordination is
required among users during the transition time period, I focus my attention on this
measurement of impairment in my analysis.80 Information on potential interference, and
transition time (i.e., the time it takes a DoD operation to migrate to another frequency or
medium), is available on a census tract level provided by the NTIA.81 Transition times vary by
operation, ranging from zero to 120 months.82
Virtually all of the licenses offered in the AWS-3 band are impaired for at least a period of time.
Approximately 309 million people in 172 license areas (out of 176 total licenses offered for each
block) are estimated to be potentially impaired to some degree.83 However, the population
impaired over the longer term is significantly less. The total population potentially impaired for
78 NTIA, “DoD Workbook Information File In Support of AWS-3 Transition Planning for 1755-1780
MHz Band,” 2014. See
http://www.ntia.doc.gov/files/ntia/publications/dod_workbook_info_file_update_exp_093014-
clean.pdf.
79 Id.
80 Id.
81 NTIA, “DoD Workbook Tab 1,” 2014. See http://www.ntia.doc.gov/other-publication/2014/transition-
plans-and-transition-data-1755-1780-mhz-band.
82 The reported maximum transition time (“Max TT”) in the NTIA data ranges from 0 to 120 months.
Analysis based on NTIA, “DoD Workbook Tab 1,” 2014. See http://www.ntia.doc.gov/other-
publication/2014/transition-plans-and-transition-data-1755-1780-mhz-band.
83 Id.

23 | brattle.com
at least 10 years ranges from approximately 8.5 million to 16.7 million, depending on license
block.84
It is possible to build a picture of an Economic Area (EA) license by examining its component
census tracts’ populations and transition times. As a result, it is possible to estimate the
population that is “impaired” for a given license over given transition times.
I examined the patterns of prices in the AWS-3 auction and can find no evidence of impairments
having any impact on license values. I performed two distinct analyses: First, I assessed the
patterns of relative prices within the auction and compared them to the patterns of relative
prices in previous auctions of similar spectrum licenses; Second, I used econometric techniques to
test whether or not the presence or level of impairment resulted in a meaningful decline in
license prices in the AWS-3 auction.
A. RELATIVE PRICE ANALYSIS
Each FCC license covers defined geographies and a specified bandwidth. As a consequence,
differences in value of different licenses depends on factors such as the number of people
covered, the demographics and distribution of the population, as well as the bandwidth of the
license. Because many of the drivers of the value of a specific license do not change from auction
to auction, the relative prices of spectrum licenses follow regular patterns across auctions. For
example, historically a license covering New York City would sell for a relatively predictable
amount more than a license covering Atlanta, GA, which in turn will go for a predictable
amount more than a license covering Des Moines, IA.85 This regularity of relative prices persists
even after license prices are adjusted for the amount of population in the license area. Here I
exploit this regularity in relative prices to look for evidence of impairments on license prices.
I compared licenses in like bands across the AWS-1 and AWS-3 auctions. Specifically, I
compared the AWS-3 J Block to the AWS-1 B Block (both licensed as 20 MHz Economic Areas)
and the AWS-3 H & I Blocks to the AWS-1 C Block (all three licensed as 10 MHz Economic
Areas). I then calculated the $/MHz-pop value for each license and divide that by the specific
84 Id.
85 As note earlier, this historical relationship between relative spectrum prices will change with the
advent of 5G. At the time of the AWS-3 auction 5G was not well developed, so I can rely on the
historical relationships for the analysis in this Appendix.
24 | brattle.com
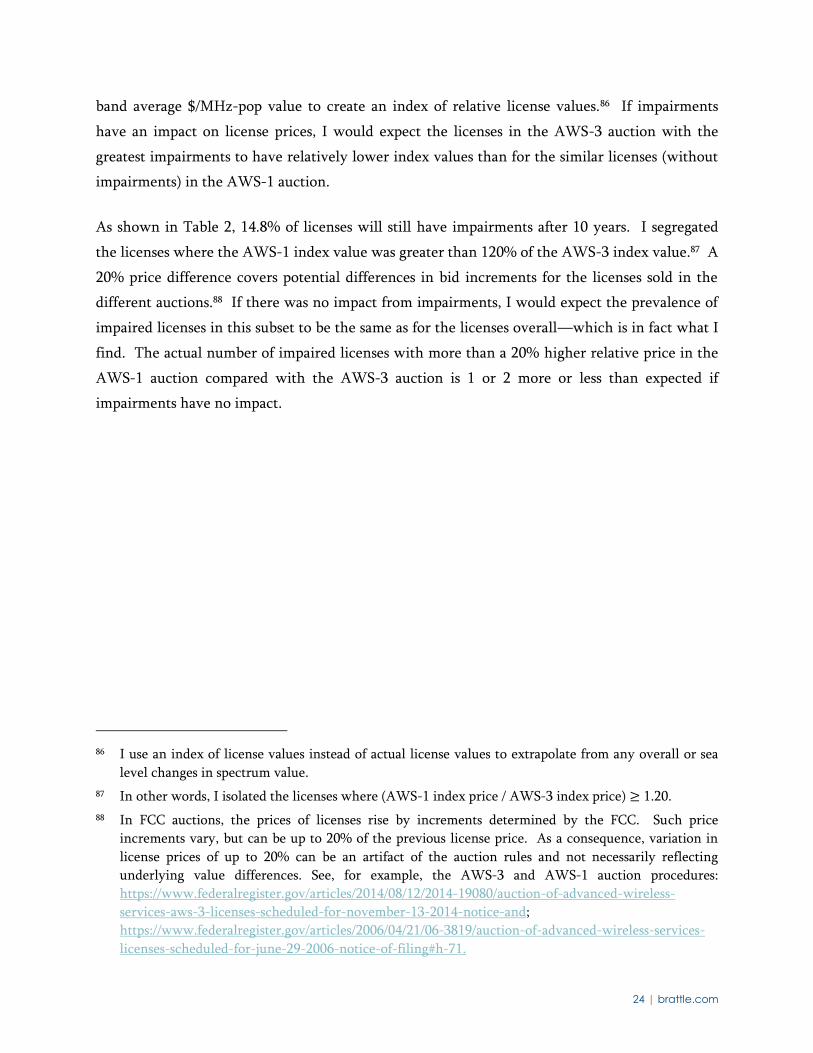
band average $/MHz-pop value to create an index of relative license values.86 If impairments
have an impact on license prices, I would expect the licenses in the AWS-3 auction with the
greatest impairments to have relatively lower index values than for the similar licenses (without
impairments) in the AWS-1 auction.
As shown in Table 2, 14.8% of licenses will still have impairments after 10 years. I segregated
the licenses where the AWS-1 index value was greater than 120% of the AWS-3 index value.87 A
20% price difference covers potential differences in bid increments for the licenses sold in the
different auctions.88 If there was no impact from impairments, I would expect the prevalence of
impaired licenses in this subset to be the same as for the licenses overall—which is in fact what I
find. The actual number of impaired licenses with more than a 20% higher relative price in the
AWS-1 auction compared with the AWS-3 auction is 1 or 2 more or less than expected if
impairments have no impact.
86 I use an index of license values instead of actual license values to extrapolate from any overall or sea
level changes in spectrum value.
87 In other words, I isolated the licenses where (AWS-1 index price / AWS-3 index price) ≥ 1.20.
88 In FCC auctions, the prices of licenses rise by increments determined by the FCC. Such price
increments vary, but can be up to 20% of the previous license price. As a consequence, variation in
license prices of up to 20% can be an artifact of the auction rules and not necessarily reflecting
underlying value differences. See, for example, the AWS-3 and AWS-1 auction procedures:
https://www.federalregister.gov/articles/2014/08/12/2014-19080/auction-of-advanced-wireless-
services-aws-3-licenses-scheduled-for-november-13-2014-notice-and;
https://www.federalregister.gov/articles/2006/04/21/06-3819/auction-of-advanced-wireless-services-
licenses-scheduled-for-june-29-2006-notice-of-filing#h-71.

25 | brattle.com
Table 2. Impairment Analysis: Indexed Value Differences
B. STATISTICAL ANALYSIS
A second approach to finding evidence of impairments on spectrum licenses uses statistical
techniques. The approach here is to predict specific license prices in the AWS-3 auction using
standard explanatory variables and then to test if the inclusion of information on impairment
levels result in a meaningful decline in the prediction of license price. If the impairment of a
license does not reduce the price of that license, all else equal, then I must conclude that such
impairments were not a significant consideration in bidders’ behavior in the auction. In practice,
this is exactly what I find.
There have been a number of studies that use econometric techniques to predict spectrum license
prices.89 Based on a review of those studies, I specified the following linear regression model of
spectrum license prices:
89 J. Pierre de Vries and Cheng-Yu Chan, “Edge License Discounts in Cellular Auctions,” Presented at
Telecommunications Policy Research Conference, 2010; Peter Cramton and Jesse A. Schwartz,
“Collusive Bidding in the FCC Spectrum Auctions,” Contributions in Economic Analysis & Policy,
2002; and Scott Wallsten, “Is There Really a Spectrum Crisis? Quantifying the Factors Affecting
Spectrum License Value,” Technology Policy Institute, 2013.
AWS-3 AWS-3 AWS-3
I Block H Block J Block
[1] Total Licenses in AWS-3 Auction 176 176 176
Count Impaired - Total 26 26 26
[2] % of Total Licenses Impaired After 10 Years 14.8% 14.8% 14.8%
[3] Total Licenses where AWS-1 License Index Value
> 120% of AWS-3 License Index Value 61 67 59
[4] Expected Impaired 9 10 9
[5] Count Impaired in Sample 8 11 11
[6] Difference 1 -1 -2
Sources & Notes:
[1]: Total licenses for each BEA block in auction.
[2]: Based on impairment analysis and data provided by NTIA.
[4]: [2] x [3], rounded to nearest whole number
[5]: Based on impairment analysis and data provided by NTIA.
[6]: [4] - [5].
[3]: Based on comparison of AWS-3 J Block with AWS-1 B Block, and
AWS-3 I and H Blocks with AWS-1 C Block.

26 | brattle.com
𝑃𝑟𝑖𝑐𝑒 = 𝛼 + 𝛽1 ∗ 𝑇𝑜𝑡𝑎𝑙𝑃𝑜𝑝𝑠 + 𝛽2 ∗ 𝑇𝑜𝑡𝑎𝑙𝑃𝑜𝑝𝑠2 + 𝛽3 ∗ 𝑃𝑒𝑟𝐶𝑎𝑝𝐼𝑛𝑐𝑜𝑚𝑒
+𝛽4 ∗ 𝐴𝑊𝑆1𝐵𝑙𝑜𝑐𝑘 + 𝛽5 ∗ 𝐼𝑚𝑝𝑎𝑖𝑟𝑚𝑒𝑛𝑡 + 𝜖
where
𝑃𝑟𝑖𝑐𝑒 = AWS-3 Spectrum License Price, measured in $/(𝑀𝐻𝑧 𝑃𝑜𝑝)
𝛼, 𝛽1, 𝛽2, 𝛽3, 𝛽4, 𝛽5 = Parameters to be estimated
𝑇𝑜𝑡𝑎𝑙𝑃𝑜𝑝𝑠 = Total Population in Licensed Area
𝑇𝑜𝑡𝑎𝑙𝑃𝑜𝑝𝑠2 = (Total Population in Licensed Area)2
𝑃𝑒𝑟𝐶𝑎𝑝𝐼𝑛𝑐𝑜𝑚𝑒 = Average per Capita Income in Licensed Area
AWS1Block = Price of AWS-1 B Block when estimating AWS-3 J Block,
measured in $/(𝑀𝐻𝑧 𝑃𝑜𝑝); Price of AWS-1 C Block when
estimating AWS-3 H and I Blocks, measured in $/(𝑀𝐻𝑧 𝑃𝑜𝑝).
𝐼𝑚𝑝𝑎𝑖𝑟𝑚𝑒𝑛𝑡 = Percent of Licensed Area Population Impaired for more than 5 or
10 years
𝜖 = Residual or Error Term
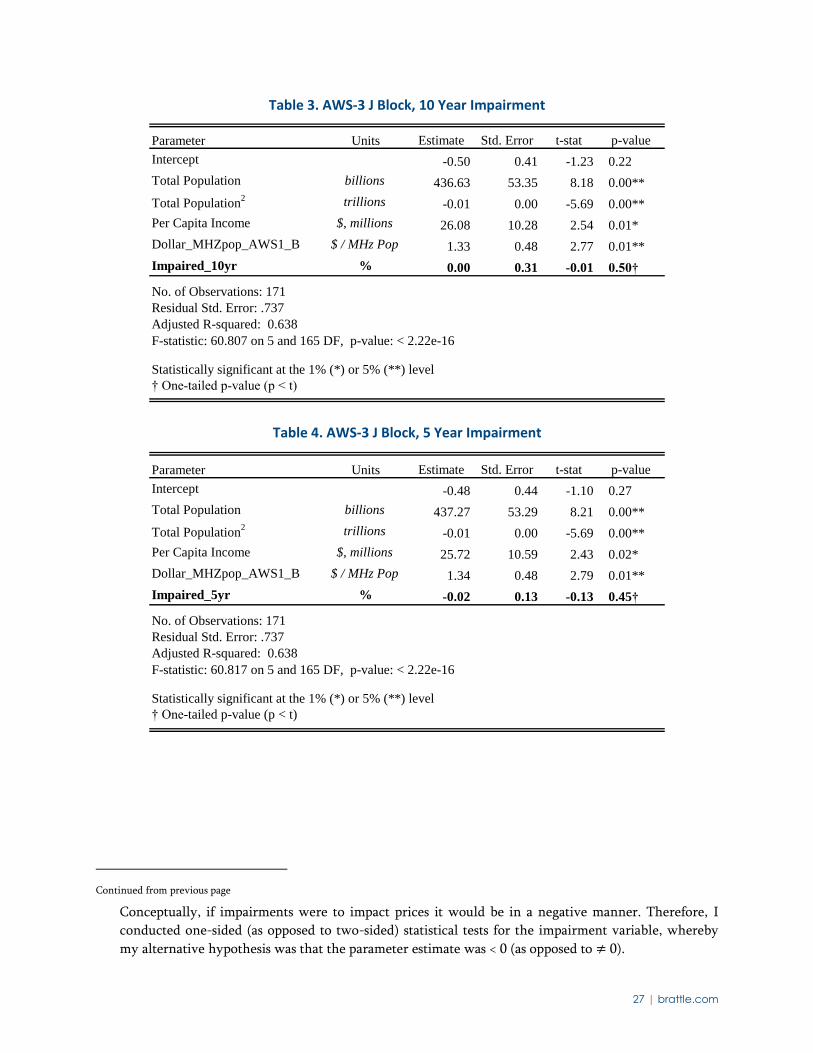
This model was tested for the AWS-3 H, I, and J Blocks and for the percentage of population
impaired after 5 and 10 years, respectively.90 Regression results for each of the six model
specifications are reported below. In each specification, the coefficient estimating the impact of
the level of impairment on license prices was statistically indistinguishable from zero (see bolded
rows in the following tables).91 Consequently, I find no evidence of license impairments
impacting the value of AWS-3 spectrum.
90 I ran the model using the impairment variable that captures the level of interference from AWS-3
transmitters to DoD receivers. However, model results remain the same when I use the other
impairment variable that captures the level of interference from DoD transmitters to AWS-3
receivers.
91 I also ran alternative specifications analyzing whether the presence of impairments above specified
thresholds (as opposed to the percentage of license area impaired) would generate observable impacts
on license prices. Each of these models returned insignificant parameter estimates, further
strengthening my finding that impairments have no statistical impact on license prices.
Continued on next page
27 | brattle.com
Table 3. AWS-3 J Block, 10 Year Impairment
Table 4. AWS-3 J Block, 5 Year Impairment
Continued from previous page
Conceptually, if impairments were to impact prices it would be in a negative manner. Therefore, I
conducted one-sided (as opposed to two-sided) statistical tests for the impairment variable, whereby
my alternative hypothesis was that the parameter estimate was < 0 (as opposed to ≠ 0).
Parameter Units Estimate Std. Error t-stat p-value
Intercept -0.50 0.41 -1.23 0.22
Total Population billions 436.63 53.35 8.18 0.00**
Total Population2 trillions -0.01 0.00 -5.69 0.00**
Per Capita Income $, millions 26.08 10.28 2.54 0.01*
Dollar_MHZpop_AWS1_B $ / MHz Pop 1.33 0.48 2.77 0.01**
Impaired_10yr % 0.00 0.31 -0.01 0.50†
No. of Observations: 171
Residual Std. Error: .737
Adjusted R-squared: 0.638
F-statistic: 60.807 on 5 and 165 DF, p-value: < 2.22e-16
Statistically significant at the 1% (*) or 5% (**) level
† One-tailed p-value (p < t)
Parameter Units Estimate Std. Error t-stat p-value
Intercept -0.48 0.44 -1.10 0.27
Total Population billions 437.27 53.29 8.21 0.00**
Total Population2 trillions -0.01 0.00 -5.69 0.00**
Per Capita Income $, millions 25.72 10.59 2.43 0.02*
Dollar_MHZpop_AWS1_B $ / MHz Pop 1.34 0.48 2.79 0.01**
Impaired_5yr % -0.02 0.13 -0.13 0.45†
No. of Observations: 171
Residual Std. Error: .737
Adjusted R-squared: 0.638
F-statistic: 60.817 on 5 and 165 DF, p-value: < 2.22e-16
Statistically significant at the 1% (*) or 5% (**) level
† One-tailed p-value (p < t)

28 | brattle.com
Table 5. AWS-3 H Block, 10 Year Impairment
Table 6. AWS-3 H Block, 5 Year Impairment
Parameter Units Estimate Std. Error t-stat p-value
Intercept -0.47 0.41 -1.14 0.25
Total Population billions 431.68 52.33 8.25 0.00**
Total Population2 trillions -0.01 0.00 -6.05 0.00**
Per Capita Income $, millions 24.16 10.42 2.32 0.02*
Dollar_MHZpop_AWS1_C $ / MHz Pop 0.96 0.38 2.51 0.01*
Impaired_10yr % 0.02 0.31 0.08 0.53†
No. of Observations: 171
Residual Std. Error: .741
Adjusted R-squared: 0.606
F-statistic: 53.241 on 5 and 165 DF, p-value: < 2.22e-16
Statistically significant at the 1% (*) or 5% (**) level
† One-tailed p-value (p < t)
Parameter Units Estimate Std. Error t-stat p-value
Intercept -0.79 0.44 -1.81 0.07
Total Population billions 432.13 51.58 8.38 0.00**
Total Population2 trillions -0.01 0.00 -6.12 0.00**
Per Capita Income $, millions 27.24 10.35 2.63 0.01**
Dollar_MHZpop_AWS1_C $ / MHz Pop 0.84 0.38 2.23 0.03*
Impaired_5yr % 0.29 0.15 1.94 0.97†
No. of Observations: 171
Residual Std. Error: .733
Adjusted R-squared: 0.615
F-statistic: 55.206 on 5 and 165 DF, p-value: < 2.22e-16
Statistically significant at the 1% (*) or 5% (**) level
† One-tailed p-value (p < t)

29 | brattle.com
Table 7. AWS-3 I Block, 10 Year Impairment
Table 8. AWS-3 I Block, 5 Year Impairment
Parameter Units Estimate Std. Error t-stat p-value
Intercept -0.25 0.36 -0.68 0.50
Total Population billions 414.12 45.96 9.01 0.00**
Total Population2 trillions -0.01 0.00 -6.67 0.00**
Per Capita Income $, millions 17.43 9.15 1.91 0.06
Dollar_MHZpop_AWS1_C $ / MHz Pop 1.24 0.33 3.71 0.00**
Impaired_10yr % 0.30 0.27 1.10 0.86†
No. of Observations: 171
Residual Std. Error: .651
Adjusted R-squared: 0.665
F-statistic: 68.510 on 5 and 165 DF, p-value: < 2.22e-16
Statistically significant at the 1% (*) or 5% (**) level
† One-tailed p-value (p < t)
Parameter Units Estimate Std. Error t-stat p-value
Intercept -0.17 0.37 -0.47 0.64
Total Population billions 410.40 46.10 8.90 0.00**
Total Population2 trillions -0.01 0.00 -6.60 0.00**
Per Capita Income $, millions 16.13 9.13 1.77 0.08
Dollar_MHZpop_AWS1_C $ / MHz Pop 1.28 0.33 3.83 0.00**
Impaired_5yr % -0.01 0.12 -0.10 0.46†
No. of Observations: 171
Residual Std. Error: .653
Adjusted R-squared: 0.663
F-statistic: 67.780 on 5 and 165 DF, p-value: < 2.22e-16
Statistically significant at the 1% (*) or 5% (**) level
† One-tailed p-value (p < t)

30 | brattle.com
Appendix C: Cost Estimates for Relocation of the 1,780 MHz–1,830
MHz Band and 1,300 MHz–1,350 MHz Band92
This appendix seeks to provide detailed estimates for relocation costs associated with the Federal
government use of the 1,780 MHz–1,830 MHz and 1,300 MHz–1,350 MHz spectrum bands. As
these estimates will require further refinement based upon actual relocation requirements for the
Federal agencies, the values provided are ranges rather than specific costs. Specifically:
Anticipated relocation clearing costs for the 1,780 MHz–1,830 MHz band of $2.26 to
$3.76 billion; and
Anticipated relocation clearing costs for the 1,300 MHz–1,350 MHz band of $3.67 to
$4.17 billion.
The estimated cost ranges provided above are based on conservative assumptions due to the lack
of information about the number of Federal systems remaining in the 1,780 MHz–1,850 MHz
band, the amount of operations that can be shifted to the 1,830 MHz–1,850 MHz band, the
number of Federal incumbent users who are only in the 1,830 MHz–1,850 MHz band (and that
will not require relocation), and due to a lack of certainty on costs associated with
accommodating the Defense Department’s incumbent use of the 1,300 MHz–1,350 MHz band.
Providing an approximation of Federal relocation costs within a conservative range should allow
future detailed estimates to be reduced as more precision is provided on incumbent usage and
relocation requirements.
A. 1,780 MHZ–1,830 MHZ BAND
Cost estimates for the 1,780 MHz–1,830 MHz band have been derived based on information
gathered by NTIA in the 2011 timeframe. At that time, Federal agencies estimated it would
require $18 billion to allow full relocation from the entire 1,755 MHz–1,850 MHz band. NTIA
and the Federal agencies subsequently created more refined estimates for relocation of the lower
25 MHz of that band, from 1,755 MHz–1,780 MHz, which was then auctioned as part of the
92 CTIA has provided the analysis and estimates in this Appendix. I have reviewed the analysis, and it
seems reasonable, but I am unable to independently verify the accuracy of these estimates.
Consequently, I use them as provided.

31 | brattle.com
AWS-3 auction. The resulting process for relocating Federal systems out of the lower 25 MHz
officially began in October of 2015 and is now well underway.93 Therefore, the portion of the
initial $18 billion estimate that was dedicated to the 1,755 MHz–1,780 MHz band, as adjusted for
the intervening developments, can be removed for purposes of making the current estimate.94
There are a variety of Federal incumbent operations within the 1,780 MHz–1,830 MHz band.
The table below identifies each of these operations and, for each such operation, quantifies; the
number of corresponding assignments prior to the AWS-3 auction; the number of those
assignments relocated pursuant to the AWS-3 auction; the initial 2012 cost estimates for
relocation of Federal systems out of the entire 95 MHz band, and updated cost estimates for
relocation out of the lower 25 MHz (1,755 MHz–1,780 MHz); and, finally, the estimated
relocation costs for the 1,780 MHz–1,830 MHz band:
93 NTIA, “AWS-3 Transition.” See https://www.ntia.doc.gov/category/aws-3-transition.
94 The cost estimate for the 1,755 MHz–1,780 MHz band was approximately $4.5 billion which is
covered by revenues from the Commission’s AWS-3 auction. NTIA, “Initial Estimated Costs and
Timelines for the 1755-1780 MHz Band,” 2014. See
https://www.ntia.doc.gov/files/ntia/publications/initial_estimated_costs_and_timelines_1755-
1780_mhz_band_05-12-2014.pdf. Letter to Tom Wheeler, FCC, from Lawrence E. Strickling, NTIA,
“Notice of Estimated Relocation or Sharing Costs and Timelines for the 1695-1710 MHz and 1,755
MHz-1,780 MHz Bands,” 2014, Attachments B1 and B2. See
https://www.ntia.doc.gov/files/ntia/publications/notification_to_fcc_re_est_costs_for_1695_and_1755
_bands_05132014.pdf.
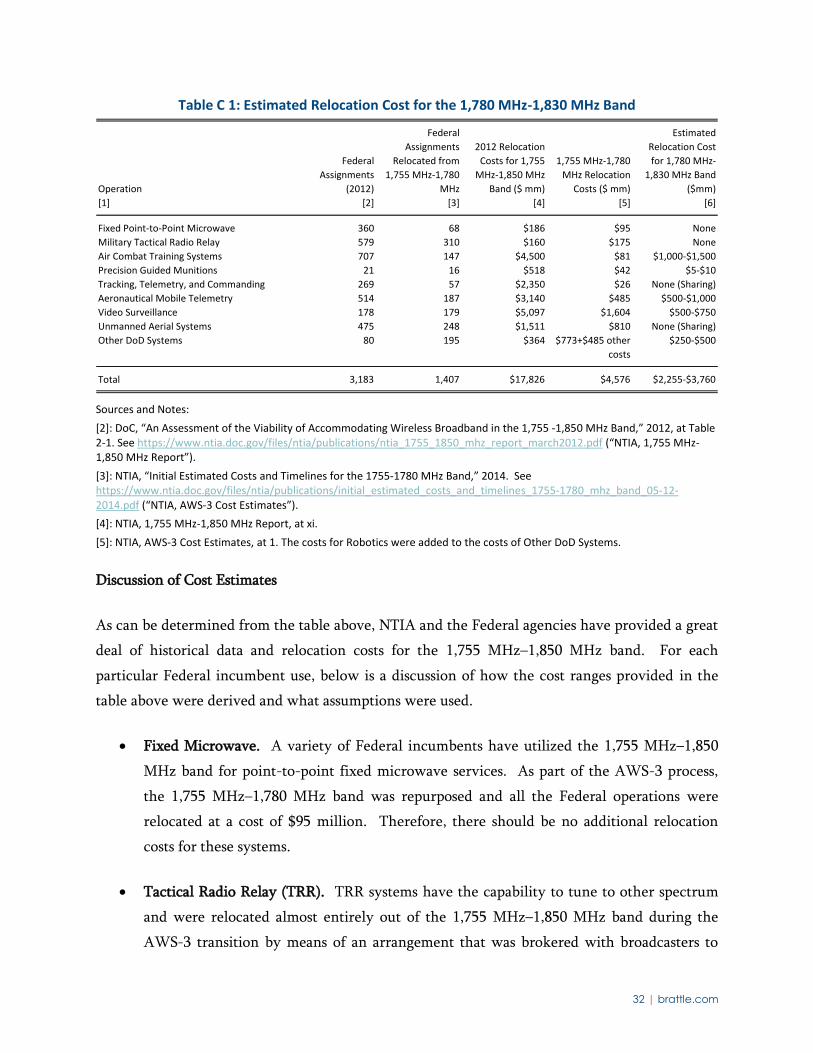
32 | brattle.com
Table C 1: Estimated Relocation Cost for the 1,780 MHz-1,830 MHz Band
Sources and Notes:
[2]: DoC, “An Assessment of the Viability of Accommodating Wireless Broadband in the 1,755 -1,850 MHz Band,” 2012, at Table 2-1. See https://www.ntia.doc.gov/files/ntia/publications/ntia_1755_1850_mhz_report_march2012.pdf (“NTIA, 1,755 MHz-1,850 MHz Report”).
[3]: NTIA, “Initial Estimated Costs and Timelines for the 1755-1780 MHz Band,” 2014. See https://www.ntia.doc.gov/files/ntia/publications/initial_estimated_costs_and_timelines_1755-1780_mhz_band_05-12-2014.pdf (“NTIA, AWS-3 Cost Estimates”).
[4]: NTIA, 1,755 MHz-1,850 MHz Report, at xi.
[5]: NTIA, AWS-3 Cost Estimates, at 1. The costs for Robotics were added to the costs of Other DoD Systems.
Discussion of Cost Estimates
As can be determined from the table above, NTIA and the Federal agencies have provided a great
deal of historical data and relocation costs for the 1,755 MHz–1,850 MHz band. For each
particular Federal incumbent use, below is a discussion of how the cost ranges provided in the
table above were derived and what assumptions were used.
Fixed Microwave. A variety of Federal incumbents have utilized the 1,755 MHz–1,850
MHz band for point-to-point fixed microwave services. As part of the AWS-3 process,
the 1,755 MHz–1,780 MHz band was repurposed and all the Federal operations were
relocated at a cost of $95 million. Therefore, there should be no additional relocation
costs for these systems.
Tactical Radio Relay (TRR). TRR systems have the capability to tune to other spectrum
and were relocated almost entirely out of the 1,755 MHz–1,850 MHz band during the
AWS-3 transition by means of an arrangement that was brokered with broadcasters to
Operation
Federal
Assignments
(2012)
Federal
Assignments
Relocated from
1,755 MHz-1,780
MHz
2012 Relocation
Costs for 1,755
MHz-1,850 MHz
Band ($ mm)
1,755 MHz-1,780
MHz Relocation
Costs ($ mm)
Estimated
Relocation Cost
for 1,780 MHz-
1,830 MHz Band
($mm)
[1] [2] [3] [4] [5] [6]
Fixed Point-to-Point Microwave 360 68 $186 $95 None
Military Tactical Radio Relay 579 310 $160 $175 None
Air Combat Training Systems 707 147 $4,500 $81 $1,000-$1,500
Precision Guided Munitions 21 16 $518 $42 $5-$10
Tracking, Telemetry, and Commanding 269 57 $2,350 $26 None (Sharing)
Aeronautical Mobile Telemetry 514 187 $3,140 $485 $500-$1,000
Video Surveillance 178 179 $5,097 $1,604 $500-$750
Unmanned Aerial Systems 475 248 $1,511 $810 None (Sharing)
Other DoD Systems 80 195 $364 $773+$485 other
costs
$250-$500
Total 3,183 1,407 $17,826 $4,576 $2,255-$3,760

33 | brattle.com
share the 2025-2210 MHz band. The costs expended for the AWS-3 transition exceeded
the costs associated with the 2012 estimates for relocating all Federal assignments out of
the entirety of the 1,755 MHz–1,850 MHz band. As such, the expectation is that there
should not be additional costs to complete the relocation process for these systems as they
simply have the capability to tune to new channels.
Air Combat Training Systems (ACTS). Unlike other systems, Air Combat Training
Systems were not extensively relocated during the AWS-3 process. Only about 20% of
systems were moved/relocated at a cost of approximately $80 million. Since the 2012
estimate for complete relocation was approximately $4.5 billion, significant additional
relocation costs are likely for this Federal usage. Based on expectation that ACTS will
need to be redesigned to operate in the 4,400 MHz–4940 MHz or other aeronautical
bands, an approximate cost for relocation would be from $1 to $1.5 billion.
Precision Guided Munitions (PGM). These systems, similar to TRR, were almost
completely relocated during the AWS-3 transition. This fact is borne out by the fact that
nearly 80% of Federal assignments were relocated at a cost of about $42 million. The
expectation is that there may be a few remaining operations to be relocated to the 1,435
MHz–1,525 MHz band at a cost of $5 to $10 million.
Tracking, Telemetry, and Commanding (TT&C). TT&C is used to manage and control
Federal satellite systems. During the AWS-3 process, the commercial industry and
Federal incumbents worked to create a detailed methodology to protect existing TT&C
facilities while still permitting the use of the 1,755 MHz–1,780 MHz band for commercial
wireless services without a need for relocation of satellite systems. For the 1,780 MHz–
1,830 MHz band, this same sharing framework should negate the need for any additional
Federal relocation.
Aeronautical Mobile Telemetry (AMT). Approximately a third of the Federal
assignments for AMT were relocated during the AWS-3 transition at a cost of
approximately $484 million. The majority of the remaining AMT systems will need to
retune to the 4,400 MHz–4,940 MHz band (or other aeronautical bands) at an estimated
cost range from $500 million to $1 billion (or one to two times the cost of the initial
relocation).
34 | brattle.com
Video Surveillance. While video surveillance systems had the highest cost of any system
in the 2012 cost estimates, based on technical feasibility issues, it is expected that many of
these systems will remain in the 1,830 MHz–1,850 MHz band rather than face relocation
to another band. As a number of these systems were replaced/updated due to the AWS-3
transition (as well as the AWS-1 transition, for the 1,710 MHz–1,755 MHz band), the
expectation is that a large portion of this equipment already has the capability to retune
to just the 1,830 MHz–1,850 MHz band. However, some systems will require relocation
(would expect to use the 2,200 MHz–2,290 MHz band) and/or costs to retune to the 1,830
MHz–1,850 MHz band. Based on the AWS-3 transition costs, would expect these costs in
the range of $500 to $750 million (or roughly one-half to one-third of the previous costs).
Unmanned Aerial Systems (UAS). The majority of these systems were transitioned
during the AWS-3 process to the 2,025 MHz–2,110 MHz band. Those that remain have
the ability to retune to the 1,830 MHz–1,850 MHz band as well as continuing to utilize
the 2,025 MHz–2,110 MHz band. Therefore, there should be no estimated relocation
costs for this equipment.
Other Systems (and Transition Costs). During past transitions (AWS-1 and AWS-3),
there have been additional systems or transition costs that have arisen. There is therefore
an estimate of $250 to $500 million to accommodate such unexpected systems or
additional transition costs.
B. 1,300 MHZ–1,350 MHZ BAND
To allow for the use of this spectrum by commercial systems, existing high-powered radar
systems must relocated.95 The primary entities utilizing radar systems in the 1,300 MHz–1,350
MHz band are the FAA, and the Departments of Defense, Homeland Security, and Commerce.
There is an ongoing feasibility study for a Spectrum Efficient National Surveillance Radar
(SENSR) that could be part of a potential reallocation opportunity for the band.96 Should this
95 The U.S. Department of Commerce has found that the 1,300 MHz-1,350 MHz offered no opportunities
for frequency/geographic/time sharing. DoC, “Quantitative Assessments of Spectrum Usage,” 2016, at
7. See https://www.ntia.doc.gov/files/ntia/publications/ntia_quant_assessment_report-
no_appendices.pdf.
96 Id. at 7-8. FAA, “SENSR Team Gets Green Light for Spectrum Analysis,” 2017. See
https://www.faa.gov/news/updates/?newsId=88187.

35 | brattle.com
effort be successful, much of the radar operations in the 1,300 MHz–1,350 MHz could be
relocated into other comparable spectrum, freeing up this 50 MHz for commercial operations.
Office of the Inspector General of the Department of Transportation has conducted a recent
study on the FAA’s Next Generation Air Transportation System and has determined that it would
require approximately $2.67 billion to develop and implement the new radar system known as
the Automatic Dependent Surveillance – Broadcast (ADS-B) system.97 The ADS-B system would
obviate the need for current ground-based radar system of Air Traffic Control (using the 1,300
MHz–1,350 MHz band) with a satellite-based system for Air-Traffic Management (using other
spectrum). However, in addition to radar for normal tracking, DoD will have an ongoing
mission requirement to track non-cooperative targets that will require enhancements to the
ADS-B system as well as relocation of systems in the 1,300 MHz–1,350 MHz band that provide
other non-radar uses. There is no publicly available discussion of the costs to enhance ADS-B
nor for the costs to relocate other DoD use of the 1,300 MHz–1,350 MHz band. However,
consultation with DoD personnel indicates that an estimated cost range of $1 to $1.5 billion
would be an acceptable approximation of potential relocation and transition costs.
97 Office of Inspector General, FAA, Audit Report, “Total Costs, Schedules, and Benefits of FAA’s
NextGen Transformational Programs Remain Uncertain,” at 5. See
https://www.oig.dot.gov/sites/default/files/FAA%27s%20Transformational%20Programs%20Report_is
sued%20Nov%2010_508.pdf.


![Enforcement and Spectrum Sharing: Case Studies …...The NTIA issued reports [7] [8] to evaluate different Federal and non-Federal spectrum bands for the near-term viability of accommodating](https://img.pdfslide.net/doc/110x75/5ea55f236c375f24e45cfbd1/enforcement-and-spectrum-sharing-case-studies-the-ntia-issued-reports-7-8.jpg)