Embed Size (px)
Citation preview

The Noncustodial Parent Employment Program:
Employment & Payment Outcomes
CATHERINE E. BORN, PH.D. PRINCIPAL INVESTIGATOR
PAMELA CAUDILL OVWIGHO, PH.D. SENIOR RESEARCHER
CORRENE SAUNDERS, M.P.P. RESEARCH DIRECTOR
April 2011
Acknowledgments
The authors would like to thank Michael Funk, Jamie Haskel, and Somlak Suvanasorn for their assistance in the collection and processing of data for this report. We would also like to thank Kathryn Patterson for her assistance with report graphics and formatting. This report was prepared by the Family Welfare Research and Training Group, School of Social Work, University of Maryland, 525 West Redwood Street, Baltimore, Maryland 21201 with sup-port from its long time research partner, the Maryland Department of Human Resources. For additional information about the report or the study, please contact Dr. Catherine Born at the School of Social Work (410.706.5134, [email protected]). Please visit our website, www.familywelfare.umaryland.edu for additional copies of this and our other reports.
Table of Contents
List of Tables
List of Figures
Executive Summary ....................................................................................................................... i
Introduction ................................................................................................................................... 1
Background ................................................................................................................................... 2
Profiles of Noncustodial Parents ............................................................................................... 2
Noncustodial Employment Programs ........................................................................................ 2
Maryland’s Noncustodial Parent Employment Program and the Present Study ....................... 3
Methods ........................................................................................................................................ 6
Sample ...................................................................................................................................... 6
Data ........................................................................................................................................... 6
CSES ..................................................................................................................................... 6
MABS ..................................................................................................................................... 6
Analysis ..................................................................................................................................... 7
Findings: Baseline Demographic and Case Characteristics ......................................................... 8
NPEP Referrals across Jurisdictions ......................................................................................... 8
NPEP Participant Characteristics ............................................................................................ 10
Child Support Case Characteristics ........................................................................................ 13
NPEP Participants’ Child Support Involvement ....................................................................... 15
Findings: Employment and Child Support Payments .................................................................. 17
Employment Outcomes ........................................................................................................... 17
Current Support Payments ...................................................................................................... 19
Payment Compliance .............................................................................................................. 20
Distributions to Arrears ............................................................................................................ 21
Findings: What Predicts NPEP Success? ................................................................................... 24
Increasing Employment ........................................................................................................... 24
Increasing Earnings ................................................................................................................. 27
Child Support Outcomes ......................................................................................................... 29
Conclusions ................................................................................................................................ 33
References .................................................................................................................................. 36
Appendix A: Payment Compliance among NPEP Participants ................................................... 38

List of Tables
Table 1. Distribution of NPEP Referrals across Jurisdictions. ...................................................... 9
Table 2. Characteristics of Noncustodial Parents Participating in NPEP. ................................... 12
Table 3. Characteristics of NPEP Participants' Child Support Cases. ........................................ 14
Table 4. NPEP Noncustodial Parent Child Support Involvement ................................................ 16
Table 5. Employment History & Outcomes for NPEP Participants. ............................................ 18
Table 6. Payments Distributed to Current Support Before & After NPEP Referral. .................... 20
Table 7. Payments Distributed to Arrears Before & After NPEP Referral ................................... 23
Table 8. Changes in Earnings by Referral Type. ........................................................................ 28
List of Figures
Figure 1. Percentage Point Difference between Shares of NPEP Participants & Shares of Child Support Caseload ....................................................................................................................... 10
Figure 2. Percent of Current Support Paid by NPEP Referred NCPs. ........................................ 21
Figure 3. Post-Referral Employment based on Pre-Referral Employment Status ...................... 25
Figure 4. Increased Employment by Pre-Referral Employment Status....................................... 26
Figure 5. Change in Distributions to Current Support by Change in Employment. ..................... 27
Figure 6. Change in Distributions to Current Support by Change in Earnings ............................ 28
Figure 7. Changes Over Time in Child Support Payments. ........................................................ 30
Figure 8. Average Percent of Support Paid by Pre-Referral Payment Status ............................ 31
Figure 9. Payment Outcomes by Referral Type .......................................................................... 31

i
Executive Summary
It is now generally accepted that inability, rather than unwillingness, is the reason for non-payment of child support for many non-custodial parents, particularly those whose incomes are low or whose recent employ-ment is sporadic or non-existent. In re-sponse, many states have begun to develop programs to help noncustodial parents im-prove their employment and earnings and thus their ability to meet their financial obli-gations to their children. Maryland has been at the forefront of these initiatives, and, building on successes achieved by several long-running local programs, the Child Sup-port Enforcement Administration (CSEA) of the Maryland Department of Human Re-sources (DHR) has established a statewide Noncustodial Parent Employment Program (NPEP). Because of the positive outcomes of the older, local programs, it was assumed that the statewide NPEP would also yield posi-tive results. As is customary, however, this assumption was put to the empirical test, as evidenced by an outcomes evaluation we conducted for CSEA-DHR – the results of which are reported in this document. More specifically, this report describes the em-ployment, earnings, and child support out-comes achieved by the 3,900 Maryland child support obligors with 5,959 child sup-port cases who were referred to NPEP be-tween January 1, 2007 and December 31, 2008. The sample was evenly split between those who were court-ordered to participate (49.8%, n=1,941) and those who voluntarily enrolled (50.2%, n=1,959). We measure outcomes over the first two years post-NPEP referral and report how those outcomes compare to participants’ employment and child support payment pat-terns in the year before NPEP. Using ad-ministrative data for the entire universe of noncustodial parents referred to NPEP be-tween January 2007 and December 2008, we address two straightforward, but mis-sion-critical research questions:
1. Did NPEP participants’ employment
and earnings increase, and
2. Did NPEP participants’ child support outcomes improve?
What are the most important findings from this research? First, foremost, and most generally, it is our view that early NPEP re-sults, while mixed in some regards, unequi-vocally indicate that the initiative is a useful one for program participants, for the child support agencies, and for children who are, after all, the ultimate beneficiaries if child support outcomes do improve. The early results documented in this report suggest that the program does have value, it should be continued, and, resources permitting, it should be expanded. The NPEP initiative is still relatively new, it addresses the long-suspected, but rarely addressed problem of noncustodial parents’ inability to pay child support; it has demon-strated positive outcomes, even in a period of great economic upheaval and high and persistent unemployment, especially among men. Moreover, the “story” behind the early NPEP empirical results reported in this study is heartening and one that we all should celebrate, encourage, and promote. Half of all NPEP participants, for example, volunteered for the program. Most court-ordered participants, as well as those who volunteered, had increased current support and arrears payments. We suspect, too, that most NPEP participants may now be more likely than the typical noncustodial parent to view the child support program as one that “helps” them meet their financial obligations to their children, rather than one that merely “hounds” them for payment. For all these reasons, we encourage readers to read the entire report, if possible. For those who are unable to do so, however, we offer the following points. In general, NPEP serves noncustodial
parents who are younger and have lower income than Maryland obligors in general. Most have recent work
ii
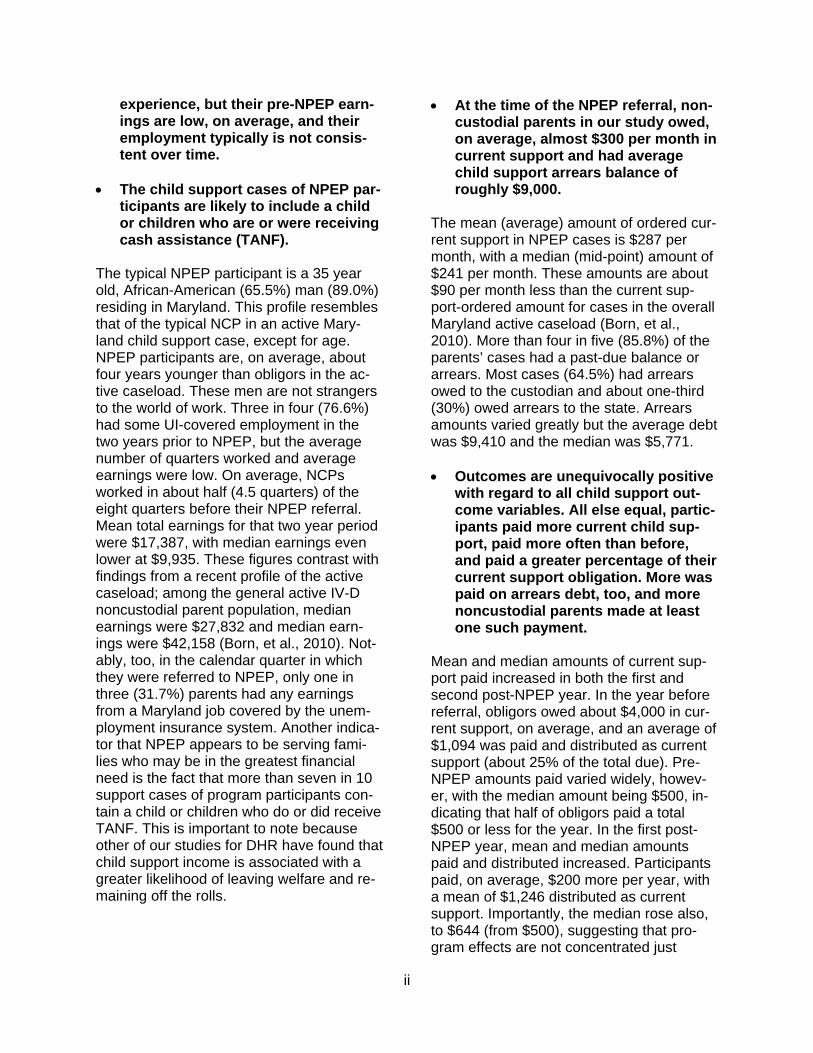
experience, but their pre-NPEP earn-ings are low, on average, and their employment typically is not consis-tent over time.
The child support cases of NPEP par-ticipants are likely to include a child or children who are or were receiving cash assistance (TANF).
The typical NPEP participant is a 35 year old, African-American (65.5%) man (89.0%) residing in Maryland. This profile resembles that of the typical NCP in an active Mary-land child support case, except for age. NPEP participants are, on average, about four years younger than obligors in the ac-tive caseload. These men are not strangers to the world of work. Three in four (76.6%) had some UI-covered employment in the two years prior to NPEP, but the average number of quarters worked and average earnings were low. On average, NCPs worked in about half (4.5 quarters) of the eight quarters before their NPEP referral. Mean total earnings for that two year period were $17,387, with median earnings even lower at $9,935. These figures contrast with findings from a recent profile of the active caseload; among the general active IV-D noncustodial parent population, median earnings were $27,832 and median earn-ings were $42,158 (Born, et al., 2010). Not-ably, too, in the calendar quarter in which they were referred to NPEP, only one in three (31.7%) parents had any earnings from a Maryland job covered by the unem-ployment insurance system. Another indica-tor that NPEP appears to be serving fami-lies who may be in the greatest financial need is the fact that more than seven in 10 support cases of program participants con-tain a child or children who do or did receive TANF. This is important to note because other of our studies for DHR have found that child support income is associated with a greater likelihood of leaving welfare and re-maining off the rolls.
At the time of the NPEP referral, non-custodial parents in our study owed, on average, almost $300 per month in current support and had average child support arrears balance of roughly $9,000.
The mean (average) amount of ordered cur-rent support in NPEP cases is $287 per month, with a median (mid-point) amount of $241 per month. These amounts are about $90 per month less than the current sup-port-ordered amount for cases in the overall Maryland active caseload (Born, et al., 2010). More than four in five (85.8%) of the parents’ cases had a past-due balance or arrears. Most cases (64.5%) had arrears owed to the custodian and about one-third (30%) owed arrears to the state. Arrears amounts varied greatly but the average debt was $9,410 and the median was $5,771. Outcomes are unequivocally positive
with regard to all child support out-come variables. All else equal, partic-ipants paid more current child sup-port, paid more often than before, and paid a greater percentage of their current support obligation. More was paid on arrears debt, too, and more noncustodial parents made at least one such payment.
Mean and median amounts of current sup-port paid increased in both the first and second post-NPEP year. In the year before referral, obligors owed about $4,000 in cur-rent support, on average, and an average of $1,094 was paid and distributed as current support (about 25% of the total due). Pre-NPEP amounts paid varied widely, howev-er, with the median amount being $500, in-dicating that half of obligors paid a total $500 or less for the year. In the first post-NPEP year, mean and median amounts paid and distributed increased. Participants paid, on average, $200 more per year, with a mean of $1,246 distributed as current support. Importantly, the median rose also, to $644 (from $500), suggesting that pro-gram effects are not concentrated just
iii
among a few participants making large payments. The upward trend continued in the second post-NPEP year. Current sup-port payments averaged $1,462, about $200 more than the previous year and al-most $400 more than in the pre-NPEP pe-riod. Positive results were also found with regard to the number of months in which current support was due and paid and in the per-centage of support due that was paid (i.e. payment compliance). In all three time pe-riods, current support was typically due in 11 to 12 months of the year. Before NPEP, payments were made in an average of 3.7 of those months, or about one-third of the time. The mean number of months in which current support was paid increased to 4.5 months in the first post-referral year and 5 months in the second. Payment compliance improved, too. Overall, average payment compliance steadily increased: participants paid about one-quarter (25.4%) of total cur-rent support due before NPEP, but 30.0% in the first follow-up year and 36.3% in the second. Improvement was also noted in regard to arrears payments. Three-fifths of those with arrears made an arrears payment in the pre-NPEP year, the average amount being $552. In the first follow-up year, more than seven in 10 (72.0%) made at least one ar-rears payment and the average amount paid and distributed was some $240 great-er, at $792. Given the characteristics of NPEP participants, their pre-program em-ployment and earnings patterns, and the overlap of our study time frame with the na-tion’s so-called Great Recession, these are impressive and fairly dramatic increases. Although the percent paying on arrears and average payment amounts drop slightly in the second post-NPEP year, the figures are still higher than they were in the year before NPEP. As a group, NPEP participants did pay more in current support and in arrears after the program than they had historically but, inte-
restingly, effects differ depending on the parent’s child support payment status in the pre-NPEP year and on whether they are court-ordered into the program or volun-teered to take part. Consistent with other studies, NCPs with the lowest historical payment rates show the most improvement in the post-referral period. Those who paid no support at all in the pre-NPEP year paid, on average, 17.8 percentage points more of their support in the first follow-up year. In contrast, the pre- and post-referral payment rates among those who had historically paid something were essentially flat (33.7% vs. 33.4%). We also find that court-ordered obligors paid only about one-fifth (20.4%) of their current support obligations in the pre-NPEP year, but paid an average of 28.4% the next year, a full eight percentage point increase. Payment compliance increased only 1.4 percentage points among volunteers, but it should be noted that their initial payment rates were also considerably higher. We are unable to determine from this study if the forward strides made by court-ordered par-ticipants are due to the fear of possible in-carceration, the availability of the employ-ment program, or some combination of both. In any case, their achievements are impressive.
Post-NPEP employment and earnings
outcomes are mixed but deemed to be positive because of the overlap between our study follow-up period and the nation’s Great Recession and its associated high unemployment and job loss rates.
Employment gains are greatest among those who had no recent work prior to NPEP and especially among unemployed NCPs who were volunta-ry participants. Notably, court-ordered participants were the only group to achieve net increases in UI-covered earnings.

iv
No doubt reflective of the extraordinarily dif-ficult macroeconomic situation at the time, the percent of NCPs employed in a Mary-land UI-covered job decreased from the pre-NPEP year (61.8%) to the first (56.1%) and second (51.6%) post-referral years. Among those who were working, however, we see slight gains in the number of quarters em-ployed and substantial increases in earn-ings. The average number of quarters worked was 2.8 in the second follow-up year, compared to 2.7 in the prior year and 2.6 in the pre-NPEP year. Average total earnings were just under $9,000 in the year before referral, $9,138 in the first follow-up year, and $11,438 in the second. Mean and median quarterly earnings also steadily in-creased in the follow-up periods. Overall, about three in ten (28.8%) NPEP participants worked more quarters in the year after referral than they had in the year before, and there is no difference in this measure between mandatory (29.1%) and voluntary (28.6%) participants. However, increased employment was more common among those who had no recent work histo-ry; almost two-fifths (37.5%) worked at least one quarter in the first post-NPEP year. Within this no-work/now-work group, volun-tary participants are significantly more likely to be employed than their court-ordered peers; two in five (41.8%) previously unem-ployed, voluntary participants had UI-earnings in the post-referral year, compared to only one-third (34.1%) of similarly si-tuated mandatory participants. Also positive is the fact that more than one in three (35.6%) NPEP participants had greater UI-covered earnings in the year af-ter referral than in the year before. Among those with any increase, average annual earnings rose by $7,420. However, when we consider all earnings changes, including those whose earnings remained the same or declined, we find an overall net average decrease of $397. In terms of referral type, there are no differences in the percent with increased earnings or in the average amount earned among those with increased
earnings. The only statistically significant difference is that court-ordered participants overall saw an average earnings increase of $205, while earnings decreased by an aver-age of $995 among voluntary participants. In the most general terms, we conclude that study results paint a flattering picture of NPEP programs, their staffs, participants and outcomes so far and bode well for out-comes in the future. They also indicate that the program is beneficial to the noncustodial parents who take part, to child support agencies’ program performance statistics, and to participants’ children. Results also lend empirical support to the notion that, rather than being unwilling to do so, certain low-income noncustodial parents are simply unable to pay their court-ordered child sup-port. That inability to pay, rather than unwil-lingness, is the root cause of some unpaid child support is evidenced by a few study findings in particular. One is that employ-ment outcomes were most positive for those who had not worked at all in the recent past and especially among fathers who volun-teered to take part in NPEP. Likewise, child support payment outcomes improved the most for fathers who had not paid any sup-port at all in the pre-NPEP year. And, last but not least, the study finds that child sup-port payment outcomes improve when fa-thers’ employment and earnings improve. While overall results are positive, of course, one can only speculate how much more so they might have been – especially with re-gard to employment and earnings – had our country not been in the midst of the greatest economic downturn since the 1930s during much, if not most, of our follow-up period. In addition to the above, we offer a few items for possible consideration in future iterations of Maryland’s statewide NPEP. If or when resource availability per-
mits some type of program expan-sion, financial education services or referrals might be worth considering and could have long-lasting positive effects.

v
Study findings reveal that, at least in its ear-ly operation, Maryland’s statewide NPEP primarily serves noncustodial parents who are at the lower end of the income and earnings spectrum. For this population, job-finding, skill development, and other em-ployment services are clearly needed. Beyond strictly employment-specific servic-es, however, many NPEP participants might well benefit from services that increase their financial knowledge and literacy. Other data indicate that low-income individuals can benefit from becoming more knowledgeable about money matters and that such services can also help them avoid pitfalls such as predatory lending practices (Roulet, 2009). Financial literacy services for the NPEP tar-get groups might also focus on information about the availability of and mechanisms to access other benefits or programs, such as the federal and state Earned Income Tax Credit programs and the Food Supplement Program (FSP). Non-custodial parents taking part in NPEP, of course, are not the only Americans whose financial acumen may be less than optimal, as numerous recent popular press accounts have shown. In response to the recent economic crisis, numerous financial education programs and seminars have be-gun to be offered by non-profit organiza-tions, public universities (e.g. the University of Maryland, School of Social Work) and other entities. Thus, it would probably not be necessary for child support agencies to pro-vide these services directly, which resource constraints probably make infeasible at least for the foreseeable future. In the con-text of NPEP and the children who ultimate-ly benefit from its success, financial literacy services, broadly defined, would seem to be a natural program enhancement, allowing participants and their children to obtain maximum benefit from the parent’s im-proved employment and earnings situation.
Last, but not least, now that the statewide NPEP has been in exis-tence for a few years and has dem-onstrated promising results, it might be prudent to try to identify any local program features or “best practices” that could be replicated or refined for use in other Maryland jurisdictions.
Maryland is small in size, but quite diverse. For this reason, local NPEPs, along with most other DHR programs, operate within a broad, state-mandated framework, but with considerable local flexibility in the specifics of program design and operation. In other programs, such as cash assistance, we have found that local flexibility can result in innovative approaches which may be, but often are not, known to other jurisdictions. The same situation may prevail with regard to NPEP. While the analyses presented in this report focus on the state as a whole, the reality is that local NPEP programs vary. Some serve only court-ordered clients while others serve volunteers as well as those who are mandated to take part. Some local programs have specialized NPEP staff while others operate under a generalist model. Given the advantages that have accrued to other programs and their clientele from tak-ing time to do a best practices review and assessment, it seems to us that a logical next step for NPEP is to take advantage of the natural variability among localities and undertake a similar project. Other than time spent, it seems likely that this could only lead to even better outcomes than the im-pressive, initial ones that Maryland’s state-wide NPEP has already achieved.

1
Introduction
As the nation’s largest child welfare pro-gram, the public child support enforcement program currently serves more than 17 mil-lion children. Through its efforts, children who do not reside with one or both of their parents may have paternity legally estab-lished, a court order for financial support put in place, and, through enforcement of the order, receive regular financial support from their absent parent or parents. For all youngsters, but especially for those in low-income households, child support can be a crucial income support. For poor families, child support often comprises as much as one-quarter of total family income, and for families attempting to leave welfare, the re-ceipt of child support significantly increases their chances of making a successful exit. The amount of support collected on behalf of children by the public child support pro-gram is impressive. In federal fiscal year 2009, about $26 billion in support was col-lected on behalf of 17 million children – al-most one in four children nationwide – and in Maryland some $397.5 million was col-lected for 155,267 cases (U.S. Government Accountability Office, 2011). Unfortunately, it is also true that an enormous and ever-growing amount of past-due support is un-paid and uncollected, about $1.5 billion in Maryland and a staggering $107.6 billion nationwide. There are many reasons for child support arrears, but among many noncustodial par-ents, low income is now well-documented as being a significant contributor to the problem. To address this particular issue, states are developing programs specifically designed to help noncustodial parents im-prove their employment and earnings and thus increase their ability to meet their sup-port obligations. Not surprisingly, Maryland has been at the forefront of these efforts. Our evaluation of a small pilot program in Baltimore City, for example, found that pro-gram participants worked more, earned more, paid more current child support and
paid more often than they had in the past (Ovwigho, Saunders & Born, 2007). Building on the lessons learned from the pilot pro-gram and several other programs initiated by local child support agencies, Maryland’s Child Support Enforcement Administration (CSEA) began implementing a statewide Noncustodial Parent Employment Program (NPEP) in 2006. The stated purpose of NPEP is to “provide employment services to noncustodial parents who are unable to meet their child support obligations” (Mary-land Department of Human Resources, February 24, 2006). Consistent with the state’s long-standing interest in empirically assessing program outcomes, this report takes a look at the employment, earnings, and child support outcomes achieved by the first wave of non-custodial parents who were referred to NPEP. To provide a context within which to interpret study findings, we also consider how post-NPEP outcomes compare to par-ents’ employment and child support pay-ment patterns before NPEP. Our intent, as always, is to provide child support program managers and policy-makers with reliable empirical data on outcomes achieved, les-sons learned, and food for future thought with regard to this important program initia-tive.

2
Background
Child support decision-makers working to improve collections and stem the rising tide of arrears need reliable empirical data about both the characteristics of their caseloads and the effectiveness of various program strategies and interventions. Although still somewhat limited, a developing body of re-search nationally and in Maryland has ex-amined the characteristics and circums-tances of noncustodial parents (NCPs) in the last decade. Also in this period, evalua-tion data from several pilot projects de-signed to help noncustodial parents improve their employment situations and child sup-port payment compliance have been pub-lished. In this chapter, we review this litera-ture to set the stage for our outcomes eval-uation of Maryland’s non-custodial employ-ment program (NPEP). Profiles of Noncustodial Parents Much of the more recent child support re-search focuses specifically on obligors’ abili-ty to pay support. These studies have re-vealed that many NCPs are not “deadbeat dads” who deliberately evade paying child support despite their ability to do so, but ra-ther are really “dead broke” (Young, 2002). For example, a point-in-time, national anal-ysis of state Unemployment Insurance (UI) data revealed that three out of ten child support debtors had UI-reported earnings of less than $10,000 per year (Office of Child Support Enforcement, 2004). Similarly, in studies of Maryland’s child support caseload which also used UI data, we found that only half to three-fifths of obligors were em-ployed in a UI-covered job at any point dur-ing the year, and they earned an average of only $24,442 from that employment. Indeed, half earned less than $18,718 (Born, Saunders, & Kolupanowich, 2010; Ovwigho, Head, & Born, 2008). Other studies have demonstrated that many NCPs also face significant employment bar-riers, such as low education, a history of incarceration, and economic hardship
(Pearson & Hardaway, 2000; Sorensen & Oliver, 2002; Thoennes, 2002). In Maryland, research shows that a significant minority of child support obligors is incarcerated or has a history of incarceration. Moreover, the size of this population varies dramatically by jurisdiction, with as high as one-fourth of Baltimore City NCPs having a history of in-carceration (Ovwigho, Saunders, & Born, 2005). Qualitative studies focused primarily on young fathers suggest that low-income fa-thers do want to be involved with their child-ren, but economic and personal factors of-ten impede their efforts (Edin & Kevalas, 2005). Also, low-income parents often view child support enforcement as unfair and pu-nitive, preferring informal support arrange-ments over complying with the formal efforts of the child support program (Edin & Lein, 1997; Edin & Kevalas, 2005). This may con-tribute to the unwillingness of some low-income noncustodial fathers to comply with their formal child support obligations (Waller & Plotnick, 1999). Noncustodial Employment Programs In some ways, noncustodial parent em-ployment programs represent just one of myriad efforts to improve the relationship between child support agencies and non-custodial parents in general. Some have argued that the historical emphasis of child support enforcement on collections has produced an adversarial relationship that actually hurt the program’s efforts. Thus, in addition to increasing enforcement efforts, child support agencies have recently begun implementing new strategies to improve parents’ understanding of the child support program in an effort to ensure that orders are fair and appropriate to parents’ circums-tances and to help parents who may be having difficulty meeting their support obli-gations. For example, Doar (2009) de-scribes how New York includes its employ-ment program concurrent with efforts to help new obligors understand the child support process and strategies to improve access to
3
order modifications for NCPs with particular barriers, in an effort to create a friendlier child support program. In just the past dec-ade, Maryland, our study state, has experi-mented with arrears forgiveness and early intervention programs, in addition to those geared towards noncustodial parent em-ployment (Ovwigho, Saunders, & Born, 2007, 2009). Two federal programs initially helped to spark interest in providing employment ser-vices to NCPs. First, in the late 1990s some states used their Welfare to Work (WtW) grants to provide employment services to low-income noncustodial parents. Not all of these programs, however, involved the child support agency, and even when they did, the agency’s role may have been limited to just providing referrals to the program. One process evaluation suggested, however, that participant recruitment can be challeng-ing because many NCPs have a distrust of government agencies in general and the child support program in particular. Martin-son, Trutko, & Strong (2000) also recom-mend, based on the WtW experience, that programs working with low-income NCPs include a component to educate them about and help them navigate the child support system. This recommendation stems from the fact that many NCPs do not understand how the child support system works. Among the WtW programs, outcomes data are only available for Washington’s Support Has a Rewarding Effect (SHARE) program which operated from 1998 to 2001 (Perez-Johnson, Kauff, & Hershey, 2003). In SHARE, child support caseworkers would identify obligors who were at least 60 days delinquent in paying support and who had at least one child receiving TANF. These NCPs were summoned to court and, when they appeared, given the choice to resume paying support, receive employment servic-es through SHARE, or go to jail. SHARE staff also worked with NCPs to reduce their child support burden and to modify their support orders, if their economic circums-tances warranted it. The major implementa-
tion challenge was in getting NCPs to ap-pear in court so that they could be given the choice to participate in SHARE. Those who did participate worked more, earned more, and paid more support after being referred to the program than they had historically. A second federal initiative, Responsible Fa-therhood, also prompted several states to pilot test the provision of employment ser-vices to NCPs. Findings from the Responsi-ble Fatherhood initiatives were quite posi-tive with statistically significant increases in employment rates, earnings, and child sup-port payment compliance (Pearson, Thoennes, Davis, Venohr, Price, & Griffith, 2003). However, it is important to note that child support effects occurred almost exclu-sively among NCPs who did not pay support at all before program enrollment. In addition, child support payments increased in tandem with earnings increases. Apart from these federal initiatives, other states and localities besides Maryland have implemented strategies to provide employ-ment services to child support obligors. Few of these, however, have published out-comes data. The most comprehensive study to date focused on the Texas NCP Choices program (Schroeder & Chiarello, 2008). Findings are quite positive, with Choices participants paying more child support, pay-ing more regularly, and remaining more steadily employed than those in a matched sample. For instance, Choices participants paid support 50% more often and paid an average of $54 per month more than their counterparts. Notably, these effects were both short-term and long-term, up to three years after program entry. Maryland’s Noncustodial Parent Employment Program and the Present Study Maryland began its statewide Noncustodial Parent Employment Program (NPEP) in 2006 as a joint effort of the Child Support Enforcement and Family Investment Admin-

4
istrations of the Maryland Department of Human Resources. Although this was the first formal statewide initiative, several of Maryland’s 24 jurisdictions had already been operating such programs. Most nota-bly, when the statewide initiative began, the Absent Parent Employment Program (APEP) in Harford County, a well-recognized and well-celebrated initiative, was celebrating its 20th anniversary. APEP started in 1986 as a partnership be-tween the Circuit Court of Harford County and the Department of Economic & Em-ployment Development. Participation in this program is court-ordered for NCPs who are having difficulty paying their support (Mary-land Department of Labor, Licensing, & Regulation, 2007). They receive intensive case management and assistance with conducting a job search. In addition, they must meet certain program goals (e.g. a minimum number of job applications submit-ted per week). In 2007, the program had a reported 80% success rate, placing 53 of 66 participants in employment. A similar pro-gram model was implemented in Baltimore County in 2004. Although not always obvious to the casual observer, the design, implementation, and successful operation of local programs such as these require a considerable amount of resource investment and solid working rela-tionships between multiple agencies and organizations. Because localities vary wide-ly on many germane dimensions, it is not surprising that there was also variability in the timing of when Maryland’s local child support agencies began operating their ini-tial NPEP and in the program features that were included. For example, while some local programs were already operating be-fore 2006, others began making referrals in the spring of 2007. Moreover, at the time of the present study, some local NPEPs had only court-ordered participants, others’ clients were primarily voluntary ones, and still others had a combination of both. In some jurisdictions, specialized staff pro-vided NPEP services while, in others, a ge-
neralist model was adopted whereby all child support staff provided NPEP services. Local variations notwithstanding, the NPEPs operating in Maryland’s 24 jurisdictions share a common goal and some common and important features. The goal of each jurisdiction’s NPEP is to provide employ-ment services to NCPs who are unable to meet their child support obligations by pro-viding them with the same services availa-ble to custodial parents through the Welfare to Work (WtW) program (Maryland Depart-ment of Human Resources, February 24, 2006). Each program includes an assess-ment of the NCP’s needs, referrals to barrier alleviation services, and employment-related services to enable NCPs to become a reliable source of income for their child-ren. Each program is supposed to adhere to the following participation criteria: NCP is unable to pay support due to
unemployment; NCP is able to work; NCP has no assets; NCP is currently under an order to pay
support and is in arrears, or NCP is un-employed at the time a court order is es-tablished.
The present study takes an empirical look at the early outcomes achieved by these ambi-tious and laudable programs. Specifically, utilizing administrative data for the entire universe of noncustodial parents referred to NPEP in Maryland between January 2007 and December 2008, we address two straightforward but very important research questions: 1. Did the employment and earnings of
NPEP participants increase, and 2. Did NPEP participants’ child support
payment compliance improve?
5
Study findings should provide relevant and potentially actionable information to state and local child support officials, advocates, and other interested parties about the initial outcomes of this first-ever statewide NPEP initiative. Results may also offer some in-sights into the characteristics of non-custodial parents who may be most likely to experience positive outcomes. In addition, study findings should provide decision-makers with information that may be useful in any future refinements, enhancements, or expansions to this important program.
6
Methods
Sample The sample for this study consists of 3,900 individuals referred to Maryland’s Noncus-todial Parent Employment Program (NPEP) between January 1, 2007 and December 31, 20081. If an individual was referred to NPEP multiple times in the study period, we consider only his or her first referral in the study period. Two in five (40.2%, n=1,568) referrals occurred in 2007 and 59.8% (n=2,332) were in 2008. The sample was evenly split between those who were court-ordered to participate (49.8%, n=1,940) and those who voluntarily enrolled (50.2%, n=1,959). At the time of their referral to NPEP, all par-ticipants were noncustodial parents on at least one Maryland child support case and met the following criteria: 1. NCP is unable to pay support due to
unemployment; 2. NCP is able to work; 3. NCP has no assets; and 4. NCP is currently under an order to pay
support and is in arrears, or NCP is un-employed at the time a court order is es-tablished.
Together, these 3,900 individuals have 5,959 child support cases that were active in the referral month. Data Two administrative data sources were used for this report. Each is described in the fol-lowing paragraphs.
1 We exclude 28 people who were referred to NPEP in the study period but who, according to CSES, were not NCPs on an active Maryland child support case in that month because we would not have descriptive information on these NCPs in CSES even though they were eligible for NPEP services. We also exclude 19 people who died during the study period.
CSES
The Child Support Enforcement System (CSES) contains child support data for the state. Maryland counties converted to this system beginning in August 1993, with Bal-timore City completing the statewide con-version in March 1998. The system includes identifying information and demographic data on children, noncustodial parents, and custodial parents/custodians receiving ser-vices from the IV-D agency. Data on child support cases and court orders including paternity status and payment receipt are also available.
MABS In order to investigate the employment pat-terns of our sample, quarterly employment and earnings data were obtained from the Maryland Automated Benefits System (MABS). MABS includes data from all em-ployers covered by the state’s Unemploy-ment Insurance (UI) law (approximately 93% of Maryland jobs). Independent con-tractors, sales people on commission only, some farm workers, federal government employees (civilian and military), some stu-dent interns, most religious organization employees and self-employed persons who do not employ any paid individuals are not covered. “Off the books” or “under the table” jobs are not included, nor are jobs located in other states. MABS is unquestionably the best source for employment data in a study such as this, but with important caveats. First, Maryland is a small state which borders four states (Delaware, Pennsylvania, Virginia, and West Virginia) and the District of Columbia. Cross-border employment by Maryland res-idents is very common because 16 of 24 subdivisions border at least one other state or the District. In some Maryland counties, in fact, more than one in three employed residents works outside the state. Census 2000 data show that 44% of all employed Prince George’s County residents worked

7
outside the state, as did 41% of Cecil Coun-ty residents and 31% of Montgomery Coun-ty residents.2 Also, there are more than 125,000 federal employees in the State3 and a majority of Maryland residents live within easy commuting distance of Wash-ington, D.C., where federal jobs are even more numerous. Our lack of access to fed-eral employment data is thus an important study limitation because it has a depressing effect on all reported employment findings. Another important caveat is that UI earnings are reported on an aggregated quarterly basis. Thus, we cannot determine, for any given quarter, how much of that quarter (e.g. how many weeks in a month or how many hours per week) the individual was employed. It is also impossible to compute or infer hourly wage or a weekly or monthly salary from these data. It is important to bear these data limitations in mind when examining employment and earnings pat-terns among our sample members. Analysis Our analyses focus primarily on frequen-cies, means and medians to describe the characteristics of NPEP participants, their child support cases, and the employment and payment outcomes they achieve. When appropriate, paired t-tests are used to eva-luate whether differences in pre- and post-NPEP employment and child support pay-ments are statistically significant. In addi-tion, chi-square statistics and analysis of variance test what factors predict child sup-port and employment outcomes.
2 U.S. Census Bureau; Census 2000; Summary File 3: Sample Data Table QT-P25; generated by the authors using American FactFinder; http://www.factfinder.census.gov (June 20, 2007). 3 U.S. Department of Labor, Bureau of Labor and Statistics; Current Employment Statistics Survey: State and Area Employment, Hours, and Earnings; generated by the authors using customized tables available from http://www.bls.gov/data/home.htm (June 20, 2007).

8
Findings: Baseline Demographic and Case
Characteristics
In this chapter, we describe the demograph-ic characteristics of NPEP participants and their child support situations at the time they entered the program. The baseline data provide a point of comparison for the em-ployment and child support outcomes dis-cussed in the following chapter. NPEP Referrals across Jurisdictions We begin our description of the people par-ticipating in the NPEP program and their child support cases with consideration of the jurisdiction which made the NPEP referral. Table 1, following, displays the number and percentage of NPEP referrals from each of Maryland’s 24 local jurisdictions.4 Not sur-prisingly, the four jurisdictions with the larg-est number of NPEP referrals are also the ones with the largest child support case-loads. Specifically, Table 1 indicates that Baltimore City accounts for one in five (19.9%) NPEP referrals while the counties of Baltimore (10.1%), Montgomery (8.7%), and Prince George’s (12.6%), each account for roughly one-tenth of the statewide total. Together these four jurisdictions account for just over one-half (51.3%) of all NPEP refer-rals during the study period. Of the remain-ing 20 jurisdictions, 15 accounted for 3% or fewer of all referrals while five accounted for between 4% and 7% of the total. These lat-ter five counties and their share of total re-ferrals are: Allegany (7.1%); Harford (4.3%); St. Mary’s (4.5%); Washington (4.3%); and Wicomico (6.8%).
4 In the vast majority (96.5%) of cases, the juris-diction making the referral is also the one provid-ing the NPEP services. In 3.5% of cases, an NCP is referred by one jurisdiction to another jurisdiction for services.
To those familiar with the distribution of Maryland’s active child support caseload across the 24 jurisdictions, it is evident from Table 1 that the shares of NPEP referrals differ from shares of the child support ca-seload for many subdivisions. Figure 1, fol-lowing Table 1, provides a more direct measure of this discrepancy. Specifically, Figure 1 shows the percentage point differ-ence between each locality’s share of all NPEP referrals and its share of the July 2009 active child support caseload. Data on the active caseload in both Figure 1 and Table 1 are drawn from Born, Saunders, & Kolupanowich (2010). Three large jurisdictions (Anne Arundel County, Prince George’s County, and Balti-more City) have notably fewer NPEP refer-rals than would be expected based on their caseload shares. Baltimore City demon-strates the largest gap, with a share of NPEP referrals 15.1 percentage points low-er than its active caseload share. Smaller discrepancies are found in Anne Arundel and Prince George’s counties with gaps of 2.5 and 6.2 percentage points, respectively. Fifteen localities have a larger share of NPEP referrals than expected, although most of these differences are small. Notable exceptions are Allegany, St. Mary’s, and Wicomico Counties with differences of 5.7, 2.6, and 4.5 percentage points, respectively. The observed discrepancies between juris-dictions’ referral and caseload shares are not cause for concern, necessarily. Rather, these discrepancies may reflect variations in the size of the eligible pool of non-custodial parents and/or variations in available re-sources. That is, these discrepancies are not necessarily a reflection of program quality or success, but merely a descriptive measure to provide context for the rest of the findings.

9
Table 1. Distribution of NPEP Referrals across Jurisdictions.
Percent (Count) of
NPEP Referrals
Percent in July 2009 Active Maryland
Caseload
Difference in Percentage Points
Allegany 7.1% (278) 1.4% +5.7
Anne Arundel 2.9% (115) 5.4% -2.5
Baltimore 10.1% (394) 8.8% +1.3
Calvert 1.3% (52) 1.3% 0
Caroline 1.6% (61) 0.7% +0.9
Carroll 1.2% (46) 1.1% +0.1
Cecil 3.0% (116) 1.4% +1.6
Charles 2.5% (99) 2.1% +0.4
Dorchester 1.5% (58) 0.8% +0.7
Frederick 2.1% (80) 2.0% +0.1
Garrett 0.2% (8) 0.4% -0.2
Harford 4.3% (167) 2.6% +1.7
Howard 1.6% (62) 1.8% -0.2
Kent 1.2% (47) 0.3% +0.9
Montgomery 8.7% (338) 7.1% +1.6
Prince George’s 12.6% (490) 18.8% -6.2
Queen Anne’s 0.2% (8) 0.5% -0.3
St Mary’s 4.5% (174) 1.9% +2.6
Somerset 0.4% (16) 0.6% -0.2
Talbot 1.7% (67) 0.4% +1.3
Washington 4.3% (166) 2.5% +1.8
Wicomico 6.8% (266) 2.3% +4.5
Worcester 0.4% (15) 0.7% -0.3
Baltimore City 19.9% (777) 35.0% -15.1
Total 100.0% (3,900) 100.0%

10
Figure 1. Percentage Point Difference between Shares of NPEP Participants & Shares of Child Support Caseload
NPEP Participant Characteristics Table 2, following this discussion, provides basic demographic and employment infor-mation on the NCPs who were referred to NPEP between January 2007 and Decem-ber 2008. The typical NCP is a 35-year-old African-American (65.5%) man (89.0%) who resides in Maryland (92.0%). Table 2 also shows that the demographic profile of the typical NCP in an active Maryland child support case is quite similar, except for age. NPEP participants are, on average, about four years younger (mean age 35.7) than their counterparts in the active caseload (mean age 39.8). Also, the percentage of NCPs under the age of 26 is twice as high in the NPEP caseload (15.0%) as in the ac-tive caseload (7.2%; Born, et al., 2010). It is also worth noting that less than one in ten (8.0%) NPEP participants live outside of
Maryland, compared to one in four NCPs in the active caseload (Born, et al., 2010). This finding makes intuitive makes sense, given that the purpose of the NPEP program is to provide locally-based employment-related services to participating parents. The last section of Table 2 displays informa-tion on NPEP participants’ historical em-ployment in UI-covered jobs. Virtually all (98.4%) participants have worked for a Mar-yland UI-covered employer at some point in time and three-quarters (76.6%) worked in such a job at some point in the two years before being referred to NPEP. However, Table 2 shows that average number of quarters worked and earnings were quite low. On average, parents worked in slightly more than half (4.5 quarters) of the eight quarters before their NPEP referral and their average total earnings in those two years were $17,387. Median earnings for that time
5.7-2.5
1.30
0.90.1
1.60.40.7
0.1-0.2
1.7-0.2
0.91.6
-6.2-0.3
2.6-0.2
1.31.8
4.5-0.3
-15.1
-20 -15 -10 -5 0 5 10
AlleganyAnne Arundel
BaltimoreCalvert
CarolineCarroll
CecilCharles
DorchesterFrederick
GarrettHarfordHoward
KentMontgomery
Prince George'sQueen Anne's
St. Mary'sSomerset
TalbotWashington
WicomicoWorcester
Baltimore City

11
period were even lower ($9,935), indicating that half of those referred had earned more than this amount, and half had earned less. In the quarter in which they were referred to NPEP, less than one-third (31.7%) of obli-gors had any Maryland UI-covered earn-ings. (NPEP participants are supposed to be unemployed at the time of referral but this finding does not mean they were not because UI data are reported on an aggre-gated, quarterly basis). It is immediately evident from Table 2 that the employment histories of NPEP partici-pants do differ markedly from the employ-ment histories of non-custodial parents in the overall active child support caseload. NPEP participants are more likely to have worked in a Maryland UI-covered job at some point in the two years before referral (76.6% vs. 55.5%) and to have worked in more quarters during that period, on aver-age (4.5 vs. 3.09 quarters). However, they have markedly lower mean and median
earnings in total and on a quarterly basis. As indicated, findings from our recent profile of the overall active child support caseload show that NCPs had median total two-year earnings of $27,832 and mean earnings of $42,158 for that same period (Born, et al., 2010). NPEP participants, in contrast, had two-year median earnings of $9,935 and mean earnings of $17,387 for the period. Perhaps most telling of the financial difficul-ties that NPEP participants may have been facing in meeting their child support obliga-tions at the time of referral are the earnings data for the three month period during which the referral was made. In that quarter, we see that about one in three (31.7%) did have some earnings from a UI-covered Maryland job. Average total earnings for that period were only $1,936, however, and as the median earnings figure reveals, fully half of those who worked earned less than $1,053 for the entire three month period.

12
Table 2. Characteristics of Noncustodial Parents Participating in NPEP.
NPEP NCP Sample (n = 3,900)
NCPs from July 2009 Active Caseload
(n = 7,337)5
Gender
Male 89.0% (3,454) 90.8% (6,620)
Female 11.0% (429) 9.2% (671)
Age
17 – 20 years 2.1% (83) 1.0% (70)
21 – 25 years 12.9% (502) 6.2% (452)
26 – 30 years 19.3% (753) 12.4% (899)
31 – 35 years 18.0% (703) 16.2% (1,177)
36 and older 47.6% (1,856) 64.2% (4,651)
Mean [Median] 35.7 [35.4] 39.8 [39.6]
Standard deviation 8.8 9.6
Range 17 to 65 17.1 – 109.2
Race
African American 65.5% (2,293) 68.7% (4,289)
Caucasian 28.4% (1,106) 27.3% (1,707)
Other 2.7% (104) 4.0% (249)
Resides outside of Maryland6 8.0% (295) 25.1% (1,842)
UI-Covered Maryland Employment
Ever employed 98.4% (3,836)
Employed in the 2 years before referral / July 20097 76.6% (2,988) 55.5% (4,057)
Mean Quarters Worked 4.5 3.09
Mean [Median] Total Earnings $17,387 [$9,935] $42,158 [$27,832]
Mean [Median] Quarterly Earnings $3,239 [$2,351] $6,249 [$4,835]
Employed in the quarter of referral / July 20098 31.7% (1,235) 33.7% (2,463)
Mean [Median] Earnings $1,936 [$1,053] $7,980 [$6,832] Note: Due to some instances of missing data, NCP Sample column totals may not sum to 3,900. Valid percentages are reported.
5 The July 2009 active child support cases are drawn from Born, Saunders, & Kolupanowich (2010). 6 The percentage of NPEP participants residing outside of Maryland is taken from current data. The original data from the referral month indicated an unusually high percentage (41.0%) of NCPs with bad or missing addresses in the administrative data. The vast majority of these were corrected during the NCPs involvement with NPEP. 7 Employment in the 2 years before referral applies only to the NPEP participants; employment in the 2 years before July 2009 applies to the active caseload on July 2009. 8 Employment in the quarter of referral applies only to the NPEP participants; employment in the quarter of July 2009 applies to the active caseload on July 2009.
13
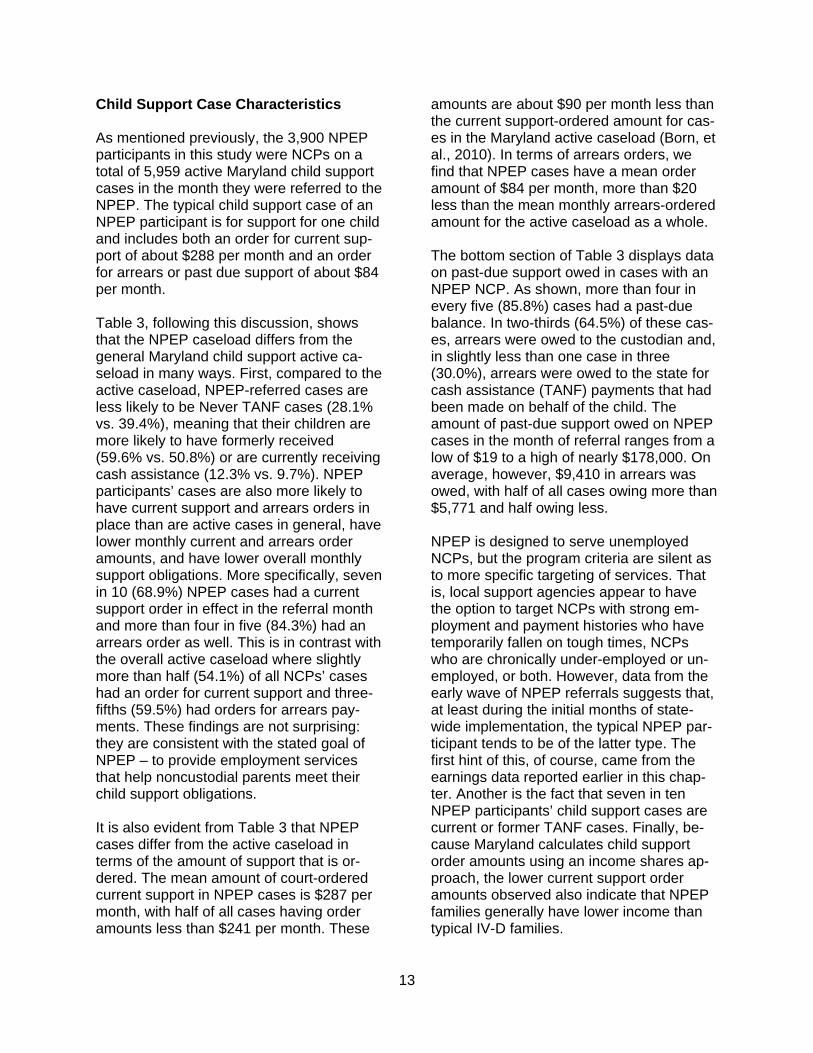
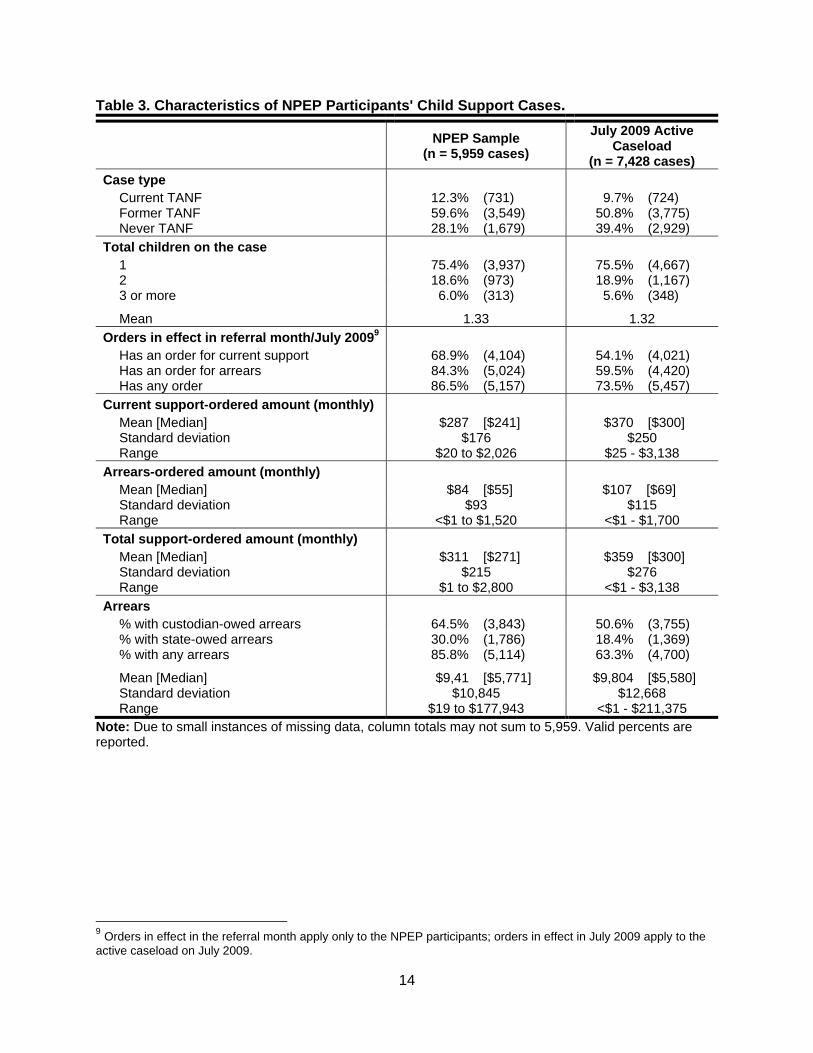
Child Support Case Characteristics As mentioned previously, the 3,900 NPEP participants in this study were NCPs on a total of 5,959 active Maryland child support cases in the month they were referred to the NPEP. The typical child support case of an NPEP participant is for support for one child and includes both an order for current sup-port of about $288 per month and an order for arrears or past due support of about $84 per month. Table 3, following this discussion, shows that the NPEP caseload differs from the general Maryland child support active ca-seload in many ways. First, compared to the active caseload, NPEP-referred cases are less likely to be Never TANF cases (28.1% vs. 39.4%), meaning that their children are more likely to have formerly received (59.6% vs. 50.8%) or are currently receiving cash assistance (12.3% vs. 9.7%). NPEP participants’ cases are also more likely to have current support and arrears orders in place than are active cases in general, have lower monthly current and arrears order amounts, and have lower overall monthly support obligations. More specifically, seven in 10 (68.9%) NPEP cases had a current support order in effect in the referral month and more than four in five (84.3%) had an arrears order as well. This is in contrast with the overall active caseload where slightly more than half (54.1%) of all NCPs’ cases had an order for current support and three-fifths (59.5%) had orders for arrears pay-ments. These findings are not surprising: they are consistent with the stated goal of NPEP – to provide employment services that help noncustodial parents meet their child support obligations. It is also evident from Table 3 that NPEP cases differ from the active caseload in terms of the amount of support that is or-dered. The mean amount of court-ordered current support in NPEP cases is $287 per month, with half of all cases having order amounts less than $241 per month. These
amounts are about $90 per month less than the current support-ordered amount for cas-es in the Maryland active caseload (Born, et al., 2010). In terms of arrears orders, we find that NPEP cases have a mean order amount of $84 per month, more than $20 less than the mean monthly arrears-ordered amount for the active caseload as a whole. The bottom section of Table 3 displays data on past-due support owed in cases with an NPEP NCP. As shown, more than four in every five (85.8%) cases had a past-due balance. In two-thirds (64.5%) of these cas-es, arrears were owed to the custodian and, in slightly less than one case in three (30.0%), arrears were owed to the state for cash assistance (TANF) payments that had been made on behalf of the child. The amount of past-due support owed on NPEP cases in the month of referral ranges from a low of $19 to a high of nearly $178,000. On average, however, $9,410 in arrears was owed, with half of all cases owing more than $5,771 and half owing less. NPEP is designed to serve unemployed NCPs, but the program criteria are silent as to more specific targeting of services. That is, local support agencies appear to have the option to target NCPs with strong em-ployment and payment histories who have temporarily fallen on tough times, NCPs who are chronically under-employed or un-employed, or both. However, data from the early wave of NPEP referrals suggests that, at least during the initial months of state-wide implementation, the typical NPEP par-ticipant tends to be of the latter type. The first hint of this, of course, came from the earnings data reported earlier in this chap-ter. Another is the fact that seven in ten NPEP participants’ child support cases are current or former TANF cases. Finally, be-cause Maryland calculates child support order amounts using an income shares ap-proach, the lower current support order amounts observed also indicate that NPEP families generally have lower income than typical IV-D families.
14
Table 3. Characteristics of NPEP Participants' Child Support Cases.
NPEP Sample
(n = 5,959 cases)
July 2009 Active Caseload
(n = 7,428 cases)
Case type
Current TANF 12.3% (731) 9.7% (724) Former TANF 59.6% (3,549) 50.8% (3,775) Never TANF 28.1% (1,679) 39.4% (2,929)
Total children on the case
1 75.4% (3,937) 75.5% (4,667) 2 18.6% (973) 18.9% (1,167) 3 or more 6.0% (313) 5.6% (348)
Mean 1.33 1.32
Orders in effect in referral month/July 20099
Has an order for current support 68.9% (4,104) 54.1% (4,021) Has an order for arrears 84.3% (5,024) 59.5% (4,420) Has any order 86.5% (5,157) 73.5% (5,457)
Current support-ordered amount (monthly)
Mean [Median] $287 [$241] $370 [$300] Standard deviation $176 $250 Range $20 to $2,026 $25 - $3,138
Arrears-ordered amount (monthly)
Mean [Median] $84 [$55] $107 [$69] Standard deviation $93 $115 Range <$1 to $1,520 <$1 - $1,700
Total support-ordered amount (monthly)
Mean [Median] $311 [$271] $359 [$300] Standard deviation $215 $276 Range $1 to $2,800 <$1 - $3,138
Arrears
% with custodian-owed arrears 64.5% (3,843) 50.6% (3,755) % with state-owed arrears 30.0% (1,786) 18.4% (1,369) % with any arrears 85.8% (5,114) 63.3% (4,700)
Mean [Median] $9,41 [$5,771] $9,804 [$5,580] Standard deviation $10,845 $12,668 Range $19 to $177,943 <$1 - $211,375
Note: Due to small instances of missing data, column totals may not sum to 5,959. Valid percents are reported.
9 Orders in effect in the referral month apply only to the NPEP participants; orders in effect in July 2009 apply to the active caseload on July 2009.

15
NPEP Participants’ Child Support In-volvement The preceding report section looked at the characteristics of child support cases in which the noncustodial parent was referred to NPEP. We now shift our focus from the case as the unit of analysis to describe find-ings at the NCP level. This is an important, but sometimes overlooked, perspective. It is important because an NCP can have more than one case and thus more than one sup-port obligation. To truly appreciate the full financial obligations of NPEP participants to their children, this section describes partici-pants’ child support situations across all their cases. Table 4, following, shows that almost one quarter (23.4%) of NPEP participants is an NCP on two child support cases. Another 11.8% are NCPs on three or more cases. Altogether, roughly one in every three (35.2%) participants has multiple child sup-port cases. It should be noted, too, that one in 20 (5.2%) NPEP participants also have at least one child support case on which they are the custodian (i.e. the person who is owed support). Considering all of their cases, Table 4 shows that four in five (81.7%) participants had at least one order for current support in effect in the month they were referred to NPEP and nine in ten (90.2%) have a court order to pay past-due support or arrears debt. In total, almost all (92.7%) participants owed at least some court-ordered support in the referral month.
Given that one in three (35.2%) NPEP non-custodial parents are obligors on two or more cases, it makes sense that the per-obligor support-ordered amounts in Table 4 are higher than the per-case amounts shown in Table 3. Considering all their cas-es, NPEP participants were under order to pay an average of $371 per month in cur-rent support and $121 per month in arrears. In the referral month, considering all cases and all orders, they owed an average of $444 in monthly support. The range here was quite wide, however, from a low of $10 to a high of $3,837. The median or mid-point amount owed each month, across all orders, was $375. The bottom section of Table 4 displays in-formation on the amount of past-due sup-port that was owed at the time of NPEP re-ferral and how many parents were in ar-rears. As shown, almost all (91.5%) NCPs owed some arrears, three-quarters (75.1%) owing arrears to custodian(s) and roughly one-third (35.1%) owing arrears to the state. On average, an NCP entering NPEP had a total arrears balance of $13,513. The me-dian amount owed was $7,988, indicating that half owed more than this amount and half owed less. In sum, considering NPEP participants’ en-tire child support situations, we find that they resemble NCPs in the active child sup-port caseload in terms of the number of cases, but they are more likely to have cur-rent support orders and arrears orders. They are also more likely to owe arrears and both the mean and median amounts of arrears they owe are higher.

16
Table 4. NPEP Noncustodial Parent Child Support Involvement
NPEP NCP Sample (n = 3,900)
July 2009 NCP Active Caseload (n = 7,337)
Number of cases as NCP
1 64.8% (2,528) 67.2% (4,931) 2 23.4% (911) 21.5% (1,580) 3 or more 11.8% (461) 11.3% (826)
Mean 1.5 1.5 Median 1.0 1.0 Range 1.0 – 11.0 1.0 – 11.0
Number of cases as CP
1 4.1% (158) 3.1% (229) 2 0.8% (32) 0.6% (45) 3 or more 0.3% (12) 0.2% (13)
Mean 0.1 0.1 Median 0.0 0.0 Range 0.0 – 6.0 0.0 – 4.0
Current Support Orders
% with an order 81.7% (3,185) 61.5% (4,515)
Mean $371 $435 Median $309 $353 Range $20 - $2,963 $25 - $6,857
Arrears Orders
% with an order 90.2% (3,519) 65.1% (4,774)
Mean $121 $147 Median $82 $100 Range <$1 - $1,520 <$1 - $1,714
Total Orders
% with an order 92.7% (3,617) 79.0% (5,797)
Mean $444 $460 Median $375 $379 Range $10 - $3,837 <$1 - $8,571
Arrears
% with custodian-owed arrears 75.1% (2,930) 58.2% (4,269) % with state-owed arrears 35.1% (1,371) 25.2% (1,852) % with any arrears 91.5% (3,570) 68.5% (5,028)
Mean $13,513 $14,579 Median $7,988 $8,109 Range $19 to $270,406 <$1 to $673,546
Note: Cases are counted if they are active or suspended on the last day of the critical month. Mean order amounts exclude those without orders.

17
Findings: Employment and Child Support Payments
The preceding chapter describes the base-line employment, earnings, and child sup-port situations of non-custodial parents at the time of their initial referral to the state-wide NPEP. The important question, of course, is whether or not their situations changed for the better after NPEP participa-tion. In short, we want to know whether and to what extent either or both program goals were met for this first wave of non-custodial parents. Specifically, using outcome data up to and through December 2009, this chapter provides answers to our two main research questions: 1. Did the employment and earnings of
NPEP participants improve, and 2. Did the NPEP participants’ child support
payment compliance improve? Employment Outcomes Our outcome measurement period includes the worst part of the recent, unprecedented economic recession which, as has been well-documented, was particularly brutal on men’s employment. Thus it is not surprising that, when we compare participants’ em-ployment in the first one or two years after the NPEP referral to their previous employ-ment, we find mixed results. This point is illustrated in Table 5, which shows that the percent of NCPs employed in a Maryland UI-covered job actually decreased some-what from roughly three-fifths (61.8%) in the pre-referral year to 56.1% in the first post-referral year and 51.6% in the second. One possible explanation for this trend, as noted, is the state of the economy and, most particularly, the rising male unem-ployment rate in the follow-up period. That is, referrals tracked in this study were made between the first quarter of 2007 (January through March) and the last quarter of 2008 (October through December). Thus, for each non-custodial parent in our sample,
the “pre-referral” year represents a 12 month period between January 2006 and September 2008; in each case, the 12 months are those that immediately pre-ceded the referral month. Similarly, the fol-low-up period is bounded by April 2007 at one end and December 2009 at the other. Although Maryland fared better than many other states during the recent downturn, it was not unaffected. No doubt our employ-ment findings are depressed at least in part because of the larger economic and em-ployment conditions prevailing at the time. It is also possible that post-referral employ-ment rates were somewhat lower because local support agencies were encouraged to use some NPEP funds for employment training and skill development. To the extent that NCPs participated in these activities, their actual employment might have been delayed with the goal that their short-term absence from the workforce would generate more stable, lucrative, and long-term em-ployment. The picture is somewhat different for partic-ipants who were employed, as Table 5 indi-cates. For these NCPs, there were incre-mental gains in the number of quarters worked and substantial increases in earn-ings over time. Among those for whom a full two years of follow-up data were available, to illustrate, participants had UI-covered earnings in 2.8 quarters in the second post-referral year, on average. This compares to an average of 2.7 quarters worked in the first post-referral year and 2.6 in the pre-referral year. Earnings increases were sub-stantial. Again, among those for whom two years of post-referral employment data are available, we see that average total annual earnings were $8,957 in the pre-referral year, increased to $9,138 in the first follow-up year and increased by more than $2,000 (to $11,438) in the second post-referral year. Notably, for these same participants average total quarterly earnings also rose by almost $500, from $2,998 before referral to $3,428 in the second year after referral.

18
In sum, although we find that employment rates did decline somewhat following NPEP referral, the data also show that, among those who were working, earnings in-creased considerably. Although it is imposs-ible to determine cause and effect in a cor-relational study, the severe recession is un-doubtedly a contributing factor. Data from our profiles of the overall child support ca-seload support this view, because the ob-served employment patterns among NPEP participants are not unique. For example, two-thirds of obligors in Maryland’s 2005 child support caseload had a recent work history, compared to only three-fifths of their counterparts in the 2009 caseload. Similar trends are evident also among adults leav-ing the TANF program, with those who ex-ited most recently working at lower rates than those who exited in earlier periods (Born, Ovwigho, Kolupanowich, & Patter-son, 2009). Moreover, these trends are not unique to Maryland. A recent report from the
U.S. Government Accountability Office makes this point quite clearly, noting that:
In [federal] fiscal year 2009 the child support enforcement program expe-rienced several departures from past trends….the amount of collections inter-cepted from unemployment insurance benefits nearly tripled, while collections automatically withheld from wages – the major source of collections – decreased for the first time (U.S. Government Ac-countability Office, 2011).
With the preceding information about NPEP participants’ employment and earnings as backdrop, the next sections of this chapter look at pre- and post-referral findings with regard to child support. Specifically, we ex-amine current support payments in the pre- and post-referral periods, as well as pay-ment compliance (i.e. the percent of support due that is paid) and arrears.
Table 5. Employment History & Outcomes for NPEP Participants.
Year before Referral
(n=3,900)
1st Year after Referral
(n=3,900)
2nd Year after Referral
(n=1,568)
Percent Employed 61.8% (2,411) 56.1% (2,189) 51.6% (809)
Mean # Quarters Employed 2.58 2.67 2.83
Mean Quarterly Earnings $2,998 $2,931 $3,428
Median Quarterly Earnings $2,109 $2,256 $2,616
Mean Total Earnings $8,957 $9,138 $11,438
Median Total Earnings $5,091 $5,793 $7,612 Note: Earnings figures are standardized to 2009 dollars. Earnings figures include only those working dur-ing that time period. Also, as noted previously, these are aggregate quarterly earnings. We do not know how many weeks or hours an individual worked, so hourly wage cannot be computed from these data. Two-year follow-up data are only available for 2007 referrals, n=1,568. Valid percents are reported.

19
Current Support Payments Most fundamentally, Maryland’s Noncus-todial Parent Employment Program (NPEP) strives to increase noncustodial parents’ ability to pay their child support obligations by helping them to improve their employ-ment situations and earnings capacities. In the previous section, we considered how NPEP participants’ employment in Maryland UI-covered jobs changed from the pre-referral period to the first and second post-referral years. Here we turn to the very im-portant and relevant question of how, if at all, several key child support outcomes changed during the same before and after periods. We begin by looking at current support amounts due and paid. As shown in Table 6, the total average amount of current support due was fairly constant in all three years; it was $3,991 in the pre-referral year and $4,042 and $3,897 in the first and second post-referral years, respectively. The median amounts were al-so quite similar across the three years ($3,380, $3,391, and $3,276), suggesting that the means or averages are not skewed by any extremely high or extremely low val-ues. Two key questions, of course, are how much of this current support was actually paid and did the amount increase over time. Table 6 shows that, in the pre-referral year, an average of $1,094 was paid and distri-buted as current support. The median or mid-point amount ($500) was considerably lower, however, indicating that the amounts paid did vary greatly and that about half of NPEP participants paid more than $500, but half paid less. Consistent with the goals and hopes of NPEP, we see that both the mean and median amounts of current support paid did increase in the first post-referral year
and rose again in the second post-referral year. In the first follow-up year, Table 6 shows that program participants paid, on average, $200 more per year, with a mean of $1,246 that was distributed as current support. The median also rose to $644 (from $500). This suggests that program effects are not concentrated among just a few participants (i.e. that the increase from the prior year is not solely due to very large increases for just a small number of partici-pants). Among those for whom two full years of follow-up data are available, trends remain positive in the second post-referral year. NPEP participants paid an average of $1,462 in that period, about $200 more than the previous year and just about $400 more than they paid before being referred to NPEP. Similar trends are evident when we consider the number of months in which current sup-port was due and paid. Across all three time periods, NCPs typically had current support due in 11 to 12 months of the year. Before their NPEP referrals, they were paying in an average of 3.7 of those months, or about one-third of the time. Notably, Table 6 shows that the mean number of months in which current support was paid increased to 4.5 months in the first post-referral year and 5 months in the second year after NPEP referral. For policy-makers and program managers, these findings suggest that NPEP does show considerable promise in improving both the amount and the frequen-cy of current support collections. Given the well-documented positive role of child sup-port income to poor families and those try-ing to leave or remain independent of wel-fare, the incremental, positive increases in both the amount paid and the number of support payments made are both hearten-ing and important.

20
Table 6. Payments Distributed to Current Support Before & After NPEP Referral.
Year Before Referral
(n=3,900)
1st Year after Referral
(n=3,900)
2nd Year after Referral
(n=2,065)
Payment Amounts
Amount Due Mean [Median] $3,991 [$3,380] $4,042 [$3,391] $3,897 [$3,276] Standard deviation $2,790 $2,769 $2,589 Range $30 - $39,372 $50 - $35,555 $54-$22,614
Amount Distributed Mean [Median] $1,094 [$500] $1,246 [$644] $1,462 [$730] Standard deviation $1,592 $1,714 $1,904 Range $0-$19,803 $0-$17,860 $0-$14,309
Payment Months
Months Due Mean [Median] 11.0 [12.0] 11.1 [12.0] 11.1 [12.0] Standard deviation 2.8 2.4 2.4 Range 1 – 12 1 – 12 1 – 12
Months Distributed Mean [Median] 3.7 [3.0] 4.5 [4.0] 5.0 [4.0] Standard deviation 3.5 3.8 4.5 Range 0 – 12 0 – 12 0 – 12
Note: Two-year follow-up data are only available on these variables for referrals made between January 2007 and March 2008, n=2,065. Individuals with $0 due in support are excluded from the mean calcula-tions. Valid percents are reported. Payment Compliance Another important dimension to consider is payment compliance, or how much of the current support that is due is actually paid. Results for this outcome are also encourag-ing. Overall and on average, payment com-pliance was better in the first follow-up year than in the year before NPEP referral and better in the second follow-up year than in both of the preceding years. From Table 6 we can determine that, on average, non-custodial parents were meeting only one-quarter (25.4%, $1,094/$3,991)) of their cur-rent support obligation in the year before their referral to NPEP. The mean percen-tage of current support paid and distributed to current support increased to 30.0%, ($1,246/$4,042) in the first follow up year and 37.5% ($1,462/$3,897) in the second.
Clearly, there were incremental but impres-sive gains in the amount, frequency, and percentage of current support payments made in the first few years after NCPs were referred to NPEP. In Figure 2, following, we take a slightly different look at support pay-ments, examining, in essence, how many participants paid none, some, most, or all of their current support obligations in the pre- and post-NPEP referral periods. Again, trends are positive. As illustrated in Figure 2, there is a notable upward shift over time in the percentage of NCPs paying most of their current support obligations.10 For in-stance, in the year before NPEP entry, only 6.7% of obligors paid at least 76% of the current support they owed. In the first follow up year, more than one-tenth (11.1%) met at least 76% of their obligation. In the second post-referral year, more than one out of every five (21.0%) NPEP participants
10 Detailed data for this figure are presented in Appendix A.

21
paid at least this much of their current sup-port. This is more than three times the pro-portion in the pre-NPEP year (21.0% vs. 6.7%). These positive findings notwithstanding, the data presented in Figure 2 also suggest that, like any other intervention program, NPEP may not have had consistently posi-tive effects for every single person referred for services. In the year before referral, to illustrate, roughly one in every four (24.9%) noncustodial parents paid nothing toward
their current support obligations. This pro-portion decreased to less than one-fifth (18.1%) in the first follow up year, but re-turned to 24.2% in the second post-referral year. Later in this report, we take a closer look at the certain factors that seem asso-ciated with the most positive NPEP out-comes. We remind readers that, although it cannot be quantified in this study, the effect of the Great Recession on these “no pay-ment” statistics should not be overlooked or discounted.
Figure 2. Percent of Current Support Paid by NPEP Referred NCPs.
Distributions to Arrears The state NPEP referral criteria indicate that candidates appropriate for referral are those who have a support order in effect and are in arrears. Thus, it is not surprising to find that almost all NCPs referred to the state-wide NPEP during the study period (Janu-ary, 2007 – December 2008) did have ar-rears balances. We saw in Table 4, earlier, that nine in 10 parents (91.5%) had a past due balance, with the average amount of
arrears being $13,513 and the median amount $7,988. Three-fourths (75.1%) of participants owed arrears to the child’s cus-todian and a little more than one out of every three (35.1%), owed arrears to the state as reimbursement for cash assistance (TANF) outlays on behalf of the child. The statistics are similar if we use the 5,959 child support cases represented by the 3,900 non-custodial parents as the unit of analysis: 85.8% of cases were in arrears; 64.5% had custodian-owed arrears; and
24.9%18.1%
24.2%
17.0%18.8%
13.2%
18.5%17.4% 13.4%
21.4%
20.4%
15.0%
11.5%14.1%
13.2%
6.7% 11.1%21.0%
0%
10%
20%
30%
40%
50%
60%
70%
80%
90%
100%
Year Before 1st Year After 2nd Year After
% o
f N
CP
s
76% or more
51 - 75%
26 - 50%
11 - 25%
1 - 10%
0%
22
30.0% had state-owed arrears. Expectedly, however, mean ($9,410) and median ar-rears ($5,771) amounts owed per case were lower. Earlier in this chapter (see Table 6) we re-ported that participants’ number and amount of current support payments did increase after referral to NPEP. Similarly positive post-referral outcomes are found when we consider payments made which are then distributed to pay on arrears. These findings are presented in Table 7, following this dis-cussion. In the baseline, pre-NPEP year, Table 7 shows that about half (53.1%) of all NPEP participants had made at least one direct payment that was distributed to arrears. Another one in five (21.7%) had an arrears payment and distribution that resulted from some type of administrative offset or income interception (e.g. tax refund, lottery win-nings). Overall, considering both direct and intercepted payments, three-fifths (59.9%) of all non-custodial parents had at least one payment and distribution toward arrears in the year before their referral to NPEP. Improvement was notable on all three va-riables in the first follow-up year. Especially noteworthy, in our view, is the increase in direct payments and distributions. Direct pays were made by two-thirds (65.2%) of all program participants in the first follow-up year, a 12 percentage point increase over the year before. Payments and distributions from intercepts and offsets also increased, albeit less dramatically (from 21.7% to 28.4%). Considering both direct and inter-cepted payment sources, at least one ar-rears payment and distribution occurred in fully 72.0% of cases in the first NPEP year. The average amount of arrears collected and distributed also increased in the first post-referral year, from $552 to $792, some of which ($154) was the result of increases in the average amount of direct payments, rather than the size of offsets or intercepts ($96). On average, this is a quite sizable
increase of $240 over the mean arrears dis-tributions of $552 in the pre-NPEP year. Moreover, Table 7 also shows that a small number of participants appear to have been able to eliminate support arrears entirely; 91.5% of non-custodial parents owed ar-rears before NPEP referral, but in the first follow-up year the comparable figure was 89.4%. This is a tiny drop, certainly, but it is movement in the right direction and is en-couraging given that, by definition, all NPEP participants were unemployed or in arrears or both at the time of referral. Results are mixed in the second follow-up year which, it bears repeating, overlaps our nation’s deep recession and the early and generally jobless recovery months. On a positive note, for NCPs for whom two years of follow-up data are available, Table 7 does show another and larger decrease in the percentage owing any arrears at all, to 82.8%. However, the percentage making direct payments and the percent with any payments at all towards arrears declined from first follow up year levels. Direct pay-ments were received from 57.7% of NCPs, compared to 65.2% in the first year and, overall, about two-thirds (65.0%) had any arrears payment and distribution, compared to about seven in 10 (72.0%) in the first fol-low-up year. There was a slight uptick, however, in the percentage of participants where a payment and distribution was made due to an interception or offset (from 28.4% to 30.0%). This is a small increase, but it is consistent with national data showing that, in federal fiscal year 2009, “collections in-tercepted from unemployment insurance benefits nearly tripled, while collections au-tomatically withheld from wages – the major source of collections – declined for the first time” (U.S. Government Accountability Of-fice, 2011). Consistent with national trends, Table 7 also shows the average amount of arrears col-lected in the second follow up year de-creased for direct payments (to $472 from $481) and increased slightly for intercepts

23
and offsets (to $343 from $311). Overall, the average total arrears payment/distribution increased in the second year (to $815 from $792). However, more in line with the other year two and national statistics, the median or midpoint amount decreased (from $306 to $248), suggesting that the mean is skewed upward by a few high-paying partic-ipants. Overall, considering the characteristics of NPEP participants and the state of the larg-er economy during much of the follow-up period, these early findings about Mary-land’s statewide NPEP and child support
arrears are more encouraging than discou-raging. In particular, the increased percen-tages of obligors making any payments to-wards arrears regardless of payment me-thod and the increase in the amount of ar-rears paid in the first year after NPEP refer-ral are fairly dramatic. In addition, despite the slight drops in these measures, the per-centage paying on arrears and the amount that they pay remain higher in the second follow up year than they were in the year before NPEP. In the next chapter, we ex-plore more fully these outcomes and what factors predict NPEP success.
Table 7. Payments Distributed to Arrears Before & After NPEP Referral
Year before (n = 3,750)
1st Year after (n = 3,750)
2nd Year after (n = 1,644)
Percent Owing Arrears 91.5% 89.4% 82.8%
Distributions to Arrears from Direct Payments
% with distributions of those with arrears balances 53.1% 65.2% 57.7%
Mean $326 $481 $472 Median $27 $133 $75 Standard deviation $721 $976 $973 Range $0 to $16,759 $0 to $19,709 $0 to $25,329
Distributions to Arrears from Inter-cepts/Offsets
% with distributions of those with arrears balances 21.7% 28.4% 30.0%
Mean $226 $311 $343 Median $0 $0 $0 Standard deviation $744 $825 $1,036 Range $0 to $19,427 $0 to $15,740 $0 to $25,329
Total Distributions to Arrears
% with distributions of those with arrears balances 59.9% 72.0% 65.0%
Mean $552 $792 $815 Median $112 $306 $248 Standard deviation $1,055 $1,296 $1,461 Range $0 to $19,427 $0 to $20,958 $0 to $25,436
Note: Valid percentages are reported. Two-year follow-up data on these variables are available for 1,644 referrals.

24
Findings: What Predicts NPEP Success?
The previous chapter provided basic, de-scriptive assessments of NCPs’ employ-ment, earnings, and child support payment outcomes after NPEP participation. In gen-eral, these data show that after NPEP refer-ral, obligors were somewhat less likely to have UI-covered earnings, no doubt at least partially reflecting the difficult economic and employment situation at that time. Among those who worked, however, earnings were higher. Moreover, child support payments improved both in terms of the percent of current support paid and in arrears pay-ments. Taken together, these data suggest that NPEP is a promising approach. Even in these unprecedented times, NPEP has shown progress in meeting its fundamental goals of helping NCPs improve their em-ployment situations and meet their child support obligations. An important follow up question is, what factors appear to predict successful outcomes for NPEP partici-pants? We address that question in this chapter. Increasing Employment Generally speaking, aggregate data on an entire population, such as the descriptive data presented in the previous chapter, mask considerable individual variability. In addition, a change in outcomes – either positive or negative – for an entire group does not necessarily translate to the change experienced by the individuals within the group. For example, although employment rates declined for NPEP participants as a whole from the year before to the first and second years after NPEP referral, it is also
true that some NCPs improved their em-ployment situations. Figure 3, following this discussion, illu-strates the post-referral employment status of NPEP participants, based on their pre-referral employment status. About one out of four (23.9%) NCPs did not work in either the year before or the year after their NPEP referral. An additional one-fifth (20.0%) had UI-covered earnings in the pre-referral pe-riod, but not in the follow-up year. Notably, the largest group worked in a Maryland UI-covered job in both the year before and the year after referral. In total, two in five (41.8%) were in this group. One in six obligors (14.3%) had not worked in the previous year, but gained employment in the follow up year. Two important factors that may influence NPEP employment outcomes are: 1. Whether the participant was court-
ordered to do so or volunteered to par-ticipate in NPEP; and
2. Whether the NCP had a recent work his-tory.
Among our NPEP parents, court-ordered participants were significantly less likely to have worked for a UI-covered employer in the year prior to referral than were those who volunteered for the program. More specifically, more than two-fifths (43.2%) of court-ordered NCPs had no UI-earnings during this period compared to on-ly one-third (33.2%) of voluntary partici-pants.

25
Figure 3. Post-Referral Employment based on Pre-Referral Employment Status
Because these two factors are highly re-lated, we take them both into account when considering how successful NPEP was in increasing the number of quarters NCPs worked after referral. Findings presented in Figure 4, following, show that, in general, NPEP increased employment (i.e. the num-ber of quarters worked) the most among participants who had not worked at all in the previous year. This effect was most notable, perhaps not surprisingly, among those who volunteered for the program. This measure is not without limitations, however. We do not know how many weeks or hours an indi-vidual worked in a particular quarter; there-fore, a NCP could work for one day or week in a quarter and be included in the percent of NCPs working in that quarter. Overall, about three in ten (28.8%) NPEP participants worked more quarters in the year after referral than they had in the year before, and the percentage with increased employment is almost identical regardless of whether the individual was court-referred
(29.1%) or volunteered (28.6%). Among those with any employment in the pre-referral year, approximately one in four (23.5%) participants overall worked more quarters in the first follow-up year, and the increase was greater among court-ordered participants than volunteers (25.2% vs. 22.0%, respectively). The most dramatic, positive change in post-referral employment (i.e. quarters worked) is found among NPEP participants who had no UI-covered employment in the year be-fore referral. For this group as a whole, al-most two in five (37.5%) worked in at least one quarter in the first post-referral year. Among this group, we find that voluntary participants are significantly more likely to be employed than their court-ordered peers. Two in five (41.8%) voluntary NPEP obli-gors with no employment in the prior year had UI-earnings in the post-referral year, compared to about one in three (34.1%) court-ordered participants.
Worked before, but not after, 20.0%
Did not work before or after, 23.9%
Did not work before, worked
after, 14.3%
Worked before & after, 41.8%

26
Figure 4. Increased Employment by Pre-Referral Employment Status.
These data do indicate early successes, despite a difficult macroeconomic environ-ment, in one important program focus area: helping NPEP participants to increase their employment. Another key question is whether increased employment results in increased payments to current support obligations. We look at this question and results are presented in Figure 5, below. It details changes in current support distributions from the pre- to post-NPEP year by the change in employment over the same time period.
As shown, for participants who experienced a decrease in employment, half (49.6%) al-so had decreased distributions to current support. However, one-third (33.3%) had increased distributions, perhaps associated with unemployment benefit intercepts. Not surprisingly, among NCPs who worked more quarters after NPEP referral, two in three (65.8%) increased their distributions to current support. Furthermore, for those who experienced no change in the number of quarters worked, two in five (42.4%) still in-creased their distributions to current sup-port.
25.2%
34.1%
29.1%
22.0%
41.8%
28.6%
23.5%
37.5%
28.8%
0%
10%
20%
30%
40%
50%
Worked in the year before Did not work in the year before***
Total
% w
orki
ng m
ore
quar
ters
in th
e fo
llow
up
year
Court-ordered Voluntary Total

27
Figure 5. Change in Distributions to Current Support by Change in Employment.
Increasing Earnings The pathway from increased employment to increased child support payments seems a clear one, but a related and important varia-ble is that of earnings. Common sense might suggest that increased employment but stagnant earnings may not lead to greater child support payments, whereas increased earnings may be more likely to do so. In short, the number of quarters an NCP works provides only a partial picture of his or her employment situation. Increasing earnings is not a formal, stated goal of NPEP; however, it is possible that in addi-tion to helping obligors obtain and maintain employment, NPEP services may also have enabled them to earn more from that em-ployment. We look at this possibility in this section of the chapter. Table 8 presents our first earnings findings and shows that they are mixed, no doubt again reflecting the mixed economic situa-tion that existed during calendar years 2007
through 2009, the time period covered by our study. On the positive side, Table 8 shows that more than one-third (35.6%) of NPEP participants had greater UI-covered earnings in the year after referral than in the year before. And, among those with any in-crease, average annual earnings rose sub-stantially (by $7,420). However, when we consider all earnings changes, including those whose earnings remained the same or declined, we find an overall net average decrease of $397 in earnings between the pre- and post-referral years. There is no difference, by referral type, in the percent of participants with increased earnings and no difference in the average amount of the increase among those whose earnings did go up. The only statistically significant difference is that court-ordered participants overall had earnings increase by an average of $205, while earnings de-creased by an average of $995 among vo-luntary participants.
49.6%
30.6%
20.9%17.1%
27.0%
13.3%
33.3%
42.4%
65.8%
0%
10%
20%
30%
40%
50%
60%
70%
80%
90%
100%
Decreased employment No change Increased employment
Ch
ang
e in
Dis
trib
uti
on
s to
Cu
rren
t S
up
po
rt
Number of Quarters Worked from Year before Referral to Year After
Decrease in distributions No change Increase in distributions
Note: n=3,900

28
Table 8. Changes in Earnings by Referral Type.
Court-ordered Voluntary Total
Percent with increase in earnings 35.3% 36.0% 35.6%
Mean difference in annual earnings $205 ($995) ($397)
Mean positive increase in annual earnings $7,138 $7,659 $7,420
For the child support program, of course, a key outcome of interest is whether earnings increases translate into increased current support payments and distributions. In Fig-ure 6, following, we detail current support distribution changes from the pre- to post-NPEP years by the observed changes, if any, in earnings. Findings are quite similar to those reported earlier with regard to em-ployment. For example, as was the case with NCPs that experienced a decrease in employment, half (50.2%) of NCPs that had a decrease in earnings also decreased their
distributions to current support. Similarly, too, one out of three (34.0%) increased their distributions. Among those whose earnings increased, two-thirds (66.9%) increased their distributions to current support. The picture was somewhat different for partici-pants whose earnings were stagnant; about the same percentage either maintained the same distribution level (36.6%) or increased it, while roughly one in four (27.8%) had de-creased distributions.
Figure 6. Change in Distributions to Current Support by Change in Earnings
50.2%
27.8%
20.2%15.8%
36.6%
12.8%
34.0% 35.6%
66.9%
0%
10%
20%
30%
40%
50%
60%
70%
80%
90%
100%
Decrease in earnings No change Increase in earnings
Ch
ang
e in
Dis
trib
uti
on
s to
Cu
rren
t S
up
po
rt
Change in Earnings from Year before Referral to Year After
Decrease in distributions No change Increase in distributions
Note: n=3,897

29
Child Support Outcomes This final section looks at the ultimate ques-tion which arises from NPEP: do child sup-port payments increase? This is, after all, the fundamental raison d’être of NPEP and similar programs. Previously, we have do-cumented generally positive child support outcome trends: increased child support payments distributed to both current support and arrears, and an increased percentage of current support paid over time. These generally positive, descriptive findings are even more impressive in light of the very mixed employment results and the very un-settling macroeconomic environment during the study period. In this section, we explore the observed support payment outcomes in more detail, in an effort to more fully under-stand them in the context of the employ-ment data. First, we test if the payment differences evi-dent in the descriptive data are reliable and whether they stem from changes in individ-ual participant behavior over time. To do this, we statistically compare how much NPEP participants paid in current support, how much they paid in arrears, and the per-cent of their current support due that was paid over three time periods: the year be-fore and the first and second years after NPEP referral. These data are presented in Figure 7 for participants for whom two full years of follow- up data are available.
Using paired t-tests, we find statistically sig-nificant increases across all three outcome measures. In terms of mean amounts of current support paid, we see that in the first post-NPEP year, participants paid an aver-age of $1,073 in current support, almost $200 more than the average of $896 in the pre-NPEP year. In the second year after entering NPEP, the mean amount of current support paid increased again to $1,133. Similarly, the percent of current support paid by NPEP participants also increased signifi-cantly over time. In the pre-NPEP year, the typical non-custodial parent in our study paid, on average, only one-quarter (24.7%) of his or her current support obligation. As shown in Figure 7, this increased to 31.2% in the first NPEP year and to 36.7% in the second post-program year. This represents a most impressive 12.0 percentage point increase over the baseline year. The statistical test also revealed that the mean amounts of arrears paid in the first ($790) and second follow-up years ($815) were significantly greater than the average amount paid in the year before NPEP ($507). Perhaps reflecting the economic downturn which characterized the latter part of our study period, we see that the largest increase ($285) occurred between the pre- and first post-NPEP years. Between the first and second follow-up years, however, the difference was much less ($15). The differ-ence between the first and second post-NPEP year was not statistically significant.

30
Figure 7. Changes Over Time in Child Support Payments.
Note: N = 2,065. Differences in current support paid and percent of current support paid are statistically significant across the three time periods at the p < .01 level. Differences in distributions to arrears are sta-tistically significant between the year before and the 1st year after NPEP referral. For policy-makers and program managers, the results of these analyses confirm that the positive NPEP child support payment outcomes reported in this study are real, they are reliable, and they are not due to chance. On a statewide level, NPEP partici-pants paid more in current support and in arrears after the program than they had be-fore. This, in turn, confirms the wisdom of efforts to help noncustodial parents to be able to financially support their children. At least to some degree, this also indicates that many low-income and unemployed NCPs do want to provide for their children and make good use of programs like NPEP which help them achieve that goal. Thus far in this section, we have confirmed that the child support payment outcomes of NPEP participants are significantly better than their historical payment compliance. To assist local agencies to be able to target scarce NPEP resources on NCPs whose
chances of success are greatest, we also looked at whether NPEP success varies by NCP characteristics. We found no statisti-cally significant differences in child support outcomes by NCP age, gender, or race. Outcomes do differ, however, by the partici-pant’s payment status in the year before NPEP referral and by whether they are court-ordered into the program or not. Consistent with other studies, we find that NCPs who have the lowest historical pay-ment rates evidence the most improvement in the post-referral period. As shown in Fig-ure 8, NCPs who had not paid child support at all in the year before NPEP paid, on av-erage, almost one-fifth (17.8%) of their sup-port obligation in the first year after referral. In contrast, the percent of support paid by those who had a history of making pay-ments remained essentially the same (33.7% vs. 33.4%, respectively).
$896.39
$1,073.06 $1,133.55
$506.65
$790.44 $815.04
24.7%
31.2%
36.7%
0%
5%
10%
15%
20%
25%
30%
35%
40%
$0
$200
$400
$600
$800
$1,000
$1,200
Year before Year after 2nd year after
Mea
n p
erce
nt
Mea
n A
mo
un
t
Current support paid (mean)
Distributions to Arrears (mean)
Percent of current support paid (mean)

31
Figure 8. Average Percent of Support Paid by Pre-Referral Payment Status
Note: N = 3,900. * p < .05 ** p < .01 ***p < .001 The other statistically significant predictor of changes in child support payment com-pliance is whether the NCP was court-ordered or volunteered to participate. As shown in Figure 9, court-ordered obligors paid only about one-fifth (20.4%) of their current support obligations in the year be-fore NPEP. In the first year after, they paid an average of 28.4%, eight full percentage points higher than the previous year. Volun-
tary participants only increased their pay-ment compliance by 1.4 percentage points. It should be noted, however, that voluntary participants had higher payment rates in the pre-NPEP year. Thus, we do not know if the differences in Figure 9 are a result of a higher percentage of initial non-payers among the court-ordered group or an effect of having participants be court ordered into the program.
Figure 9. Payment Outcomes by Referral Type
0.0%
33.7%
17.8%
33.4%
0%5%
10%15%20%25%30%35%40%45%50%
Paid no support*** Paid some support
% o
f cu
rren
t su
ppor
t pa
id
Year before Year after
20.4%
30.3%28.4%31.7%
0%
10%
20%
30%
40%
50%
Court-ordered Voluntary
Year before Year after

32
For policy-makers and program managers, these data are good news. They indicate that, even in the less than optimal economic conditions that prevailed during a significant part of our study time frame, Maryland’s statewide NPEP was effective in obtaining child support payments from a group for whom traditional enforcement measures had not been effective. Indeed, given that all noncustodial parents referred to NPEP were
unemployed, in arrears, or both, some pun-dits would no doubt have opined that these were ‘hopeless cases’ in which little positive change could be expected. However, our study findings, particularly those which show the greatest improvement among those who historically had not paid any child support, are consistent with the more en-lightened view that, in fact, many of those who do not pay are simply unable to do so.
33
Conclusions
Although several local programs had long existed to assist or require noncustodial parents to increase their employment in or-der to increase their compliance with child support orders, Maryland’s statewide Non-custodial Parent Employment Program (NPEP) is still a relatively new initiative. Based on the successful track record of the long-standing local programs, it was as-sumed that a statewide program would also achieve positive results. However, as is cus-tomary, this assumption was put to the em-pirical test and this study looks at actual re-sults achieved by 3,900 noncustodial par-ents (and their 5,959 child support cases) who were referred to the new program be-tween January 1, 2007 and December 31, 2008. Specifically, we look at participants’ baseline employment, earnings and child support payments during the year before NPEP referral and in the first and second years after. In general, NPEP participants tend to be younger, on average, than obligors in the overall active child support caseload, are more likely to have orders for current sup-port and for arrears, to have lower court-ordered obligation amounts, and to have a child who is or was receiving cash assis-tance. During the baseline period, most had had some employment in a Maryland job covered by the Unemployment Insurance program, but their earnings from that work were, on average, quite low. Results during the follow-up period are mixed: not so great with regard to overall employment and earnings increases, but strongly, consistently, and significantly posi-tive with regard to child support outcomes. Given the economic upheaval and the very elevated unemployment rates for younger men that characterized much of the study’s time period in particular, study results speak well of NPEP so far, bode well for outcomes in the future, and indicate that the program should certainly be continued. In our view, study results lend strong empirical support
to the notion that, rather than being unwil-ling to do so, some noncustodial parents are simply unable to pay their child support ob-ligations. Notably, too, our results suggest that noncustodial parent employment pro-grams can have perhaps their most signifi-cant, positive effects for participants that conventional wisdom might opine would be less likely to succeed: those who are court-ordered to participate and those with no re-cent employment history. That inability to pay, rather than unwilling-ness, is the root cause of some unpaid child support is evidenced by several study find-ings in particular. One is that employment outcomes were most positive among NCPs who had not worked at all in the year before referral and especially among those who volunteered to participate in the program. Likewise, while the child support outcomes of these early NPEP participants are une-quivocally positive – participants paid more of their child support obligations after refer-ral than they had before – support payment outcomes improved the most for obligors who had not paid support at all in the pre-vious year. And, not surprisingly, child sup-port payment outcomes also improved when employment and earnings improved as well. These findings indicate that NPEP is meet-ing its goal of increasing the extent to which NCPs meet their child support obligations, despite the fact that employment and earn-ings outcomes were mixed. Although it is beyond the scope of this study to tease out the impact, it is a near certainty that the so-called Great Recession had a dampening effect on our employment outcomes. Even so, it is important to remember that em-ployment rates did increase among those who had not worked at all in the previous year, especially if they volunteered for the program. Then, too, NPEP participants could have taken part in job training and skill development activities; while these could increase their longer-term employ-ment and earnings capacities, they could also depress the short-term employment outcomes examined in this study.

34
In addition to the above, we offer a few ad-ditional comments for consideration in future iterations of Maryland’s statewide NPEP, bearing in mind the unprecedented and, hopefully, not-to-be-repeated recession which overlapped our study time frame. Court-ordered participants expe-
rienced the best child support out-comes.
At the time of this study, jurisdictions varied as to whether their NPEP participants were court-ordered, voluntary, or a combination. The findings from this study indicate that child support payment compliance improved the most for court-ordered NCPs. Thus, should resource constraints require policy-makers and program managers to somehow limit program eligibility criteria, study find-ings suggest that the greatest gains in terms of child support payments will likely be achieved for mandatory (court-ordered) ra-ther than voluntary clients. While certainly an important, programmatic bottom-line measure, we caution that this should be carefully weighed against other equally im-portant considerations. For example, volun-tary obligors who had not worked in the pre-vious year experienced the greatest em-ployment increases. Then, too, the mere fact that these noncustodial parents volun-teered to take part in a program sponsored by child support suggests that they do want to work and to pay their child support with-out having to be coerced or court-ordered to do so. This is precisely the behavior that we want to promote and encourage among non-custodial parents, so it would seem counterproductive to bar them from taking part, of their own volition, in NPEP. Intangi-bly, but importantly, it also seems likely that, all else equal, volunteers, through their par-ticipation, would have a less antagonistic view of the child support system in general. Rather than a program which many non-custodial parents have perceived as one that merely ‘hounds’ them for payments, successful NPEP individuals would seem more likely to view child support as a pro-
gram that, instead, ‘helps’ them to meet their financial obligations to their children. If or when resource availability per-
mits some type of program expan-sion, financial education services or referrals might be worth considering and could have long-lasting, positive effects.
Study findings reveal that, at least in its ear-ly operation, Maryland’s statewide NPEP primarily serves noncustodial parents who are at the lower end of the income and earnings spectrum. For this population, job-finding, skill development, and other em-ployment services are clearly needed. Beyond strictly employment-specific servic-es, however, many NPEP participants might well benefit from services that increase their financial knowledge and literacy. Other data indicate that low-income individuals can benefit from becoming more knowledgeable about money matters and that such services can also help them avoid pitfalls such as predatory lending practices (Roulet, 2009). Financial literacy services for the NPEP tar-get groups might also focus on information about the availability of and mechanisms to access other benefits or programs, such as the federal and state Earned Income Tax Credit programs and the Food Supplement Program (FSP). Noncustodial parents taking part in NPEP, of course, are not the only Americans whose financial acumen may be less than optimal, as numerous recent popular press accounts have shown. In response to the recent economic crisis, numerous financial education programs and seminars have be-gun to be offered by nonprofit organizations, public universities (e.g. the University of Maryland, School of Social Work) and other entities. Thus, it would probably not be ne-cessary for child support agencies to pro-vide these services directly, which resource constraints probably make infeasible at least for the foreseeable future. In the con-text of NPEP and the children who ultimate-ly benefit from its success, financial literacy
35
services, broadly defined, would seem to be a natural program enhancement, allowing participants and their children to obtain maximum benefit from the parent’s im-proved employment and earnings situation. Now that the statewide NPEP has
been in existence for a few years and has demonstrated promising results, it might be prudent for state and local child support officials to try and iden-tify any local program features or “best practices” that could be repli-cated or refined for use in other Maryland jurisdictions.
Maryland is small in size but very diverse. For this reason, local NPEPs, along with most other DHR programs, operate within a broad, state-mandated framework, but with considerable local flexibility in the specifics of program design and operation. In other programs, such as cash assistance, we
have found that local flexibility can result in innovative approaches which may be, but often are not, known to other jurisdictions. The same situation may prevail with regard to NPEP. While the analyses presented in this report focus on the state as a whole, the reality is that local programs vary. Some serve only court-ordered clients while others serve volunteers as well as those who are mandated to take part. Some local pro-grams have specialized NPEP staff while others operate under a generalist model. Given the advantages that have accrued to other programs and their clientele from tak-ing time to do a best practices review and assessment, it seems to us that a logical next step for NPEP is to take advantage of the natural variability among localities and undertake a similar project. Other than time spent, it seems likely that this could only lead to even better outcomes than the im-pressive initial ones that Maryland’s state-wide NPEP has already achieved.

36
References
Born, C.E., Ovwigho, P.C., Kolupanowich, N., & Patterson, K. (2009). Life after welfare: Annual update. Baltimore: University of Maryland School of Social Work. Available online: http://www.familywelfare.umaryland.edu/reports/life14.pdf
Born, C.E., Saunders, C., & Kolupanowich, N. (2010). People and payments: A profile of Mary-
land’s child support caseload July 2009. Baltimore: University of Maryland School of So-cial Work.
Doar, R. (2009, June). How a friendlier child support program can help dads and kids. Policy
and Practice, 20. Edin, K., & Kevalas, M. (2005). Promises I can keep: Why poor women put motherhood before
marriage. Los Angeles: University of California Press. Edin, K., & Lein, L. (1997). Making ends meet: How women survive welfare and low wage work.
New York: Russell Sage Foundation. Martinson, K., Trutko, J., & Strong, D. (2000). Serving noncustodial parents: A descriptive study
of Welfare-to-Work programs. Washington, DC: The Urban Institute. Available online: http://www.mathematica-mpr.com/publications/PDFs/serving.pdf
Maryland Department of Human Resources. (February 24, 2006). CSA, CSEA, and FIA Action
Transmittal: Noncustodial Parent Employment Program, Control #06-28. Available on-line: http://www.law.umaryland.edu/marshall/dhr/0628.pdf
Maryland Department of Labor, Licensing, & Regulation. (2007). The Absent Parent Employ-
ment Program 2007: Strengthening child support enforcement in Harford County, MD. Bel Air, MD: Author.
Office of Child Support Enforcement (2004). The story behind the numbers: Who owes the child
support debt? Washington, DC: Author. Available online: http://www.acf.hhs.gov/programs/cse/pol/IM/2004/im-04-04a.doc.
Office of Child Support Enforcement (2004). FY 2009 Preliminary Report. Washington, DC: Au-
thor. Available online: http://www.acf.hhs.gov/programs/cse/pubs/2010/reports/preliminary_report_fy2009/
Ovwigho, P.C., Head, V., & Born, C.E. (2008). People & payments: A baseline profile of Mary-
land’s child support caseload. Baltimore: University of Maryland School of Social Work. Available online: http://www.familywelfare.umaryland.edu/reports/ca.pdf
Ovwigho, P.C., Saunders, C., & Born, C.E. (2005). The intersection of incarceration & child
support: A snapshot of Maryland’s caseload. Baltimore: University of Maryland School of Social Work. Available online: http://www.familywelfare.umaryland.edu/reports/incarceration.pdf
37
Ovwigho, P.C., Saunders, C., & Born, C.E. (2007). Arrears forgiveness: A strategy for child support’s $100 billion problem? Journal of Policy Practice, 6, 23-44.
Ovwigho, P.C., Saunders, C., & Born, C.E. (2009). Early intervention & child support outcomes:
Lessons learned. Baltimore: University of Maryland School of Social Work. Available on-line: http://www.familywelfare.umaryland.edu/reports/earlyintervention.pdf
Pearson, J., & Hardaway, C. (2000). Designing programs for incarcerated and paroled obligors.
Washington, DC: Welfare Information Network. Retrieved January 31, 2005 from http://www.welfareinfo.org/expandedcasestudy.htm.
Pearson, J., Thoennes, N., Davis, L., Venohr, J.C., Price, D.A., & Griffith, T. (2003). OCSE Re-
sponsible Fatherhood Programs: Client characteristics and program outcomes. Denver: Center for Policy Research. Available online: http://fatherhood.hhs.gov/Stability/RespFaPgmsClientChar.pdf
Perez-Johnson, I., Kauff, J., & Hershey, A. (2003). Giving noncustodial parents options: Em-
ployment and child support outcomes of the SHARE program. Princeton, NJ: Mathema-tica Policy Research, Inc. Available online: http://aspe.hhs.gov/hsp/wtw-grants-eval98/share03/report.pdf
Roulet, M. (2009). Financial literacy and low-income noncustodial parents. Madison, WI: Center
for Family Policy & Practice. http://www.cffpp.org/publications/pdfs/policy_finance.pdf
Schroeder, D., & Chiarello, S. (2008). Texas Noncustodial Parent Choices: Program Impact
Analysis. Austin, TX: The University of Texas at Austin, LBJ School of Public Affairs. Available online: http://www.utexas.edu/research/cshr/pubs/pdf/ncp_choices_final_prelim.pdf
Sorensen, E. & Oliver, H. (2002). Policy reforms are needed to increase child support from poor
fathers. Washington, DC: Urban Institute. Thoennes, N. (2002). Child support profile: Massachusetts incarcerated and paroled parents.
Fathers in the criminal justice system: A collaboration between child support enforce-ment and criminal justice agencies in Massachusetts. Denver: Center for Policy Re-search.
U.S. Government Accountability Office. (2011). Departures from long-term trends in sources of
collections and caseloads reflect recent economic conditions. Washington, D.C.: U.S. Government Accountability Office.
Waller, M. R., Plotnick, R. (1999). Effective child support policy for low-income families: Evi-
dence from street level research. Journal of Policy Analysis and Management, 20(1), 89-110.
Young, C. (2002, February 11). New look at ‘deadbeat dads.’ Boston Globe. Retrieved Septem-
ber 2006 from http://reason.com/cy/cy021302.html.

38
Appendix A: Payment Compliance among NPEP Participants
Year before 1st Year after 2nd Year after
Percent Distributed
0% 24.9% (810) 18.1% (567) 24.2% (358)
1 - 10% 17.0% (554) 18.8% (589) 13.2% (196)
11 - 25% 18.5% (603) 17.4% (543) 13.4% (198)
26 - 50% 21.4% (697) 20.4% (639) 15.0% (223)
51 - 75% 11.5% (374) 14.1% (441) 13.2% (196)
76% or more 6.7% (218) 11.1% (347) 21.0% (311)
Mean*** 25.4% 30.0% 36.3%
Median 17.0% 20.0% 24.0%
Standard deviation 26.8% 29.7% 36.1%
Range 0 to 100% 0 to 100% 0 to 100% Note: Valid percentages are reported *p<.05 **p<.01 ***p<.001