Embed Size (px)
Citation preview
The Norwegian oilfi eld services analysis 2014
The Norwegian oilfi eld services analysis 2014
Contents
Summary . . . . . . . . . . . . . . . . . . . . . . . . . . . . . . . . . . . . . . . . . . . . . . 3
Introduction . . . . . . . . . . . . . . . . . . . . . . . . . . . . . . . . . . . . . . . . . . . . 5
2012 vs. 2013. . . . . . . . . . . . . . . . . . . . . . . . . . . . . . . . . . . . . . . . . . 7
A large industry with great signifi cance . . . . . . . . . . . . . . . . . . . . . . 8
Development in value creation . . . . . . . . . . . . . . . . . . . . . . . . . . . . . 9
Development per segment Reservoir/seismic . . . . . . . . . . . . . . . . . . . . . . . . . . . . . . . . . 11
Exploration and production drilling . . . . . . . . . . . . . . . . . . . 13
Engineering, fabrication and installation. . . . . . . . . . . . . . . 17
Operations . . . . . . . . . . . . . . . . . . . . . . . . . . . . . . . . . . . . . . 22
Decommissioning . . . . . . . . . . . . . . . . . . . . . . . . . . . . . . . . . 25
Geographical distribution . . . . . . . . . . . . . . . . . . . . . . . . . . . . . . . . 27
Activity going forward . . . . . . . . . . . . . . . . . . . . . . . . . . . . . . . . . . . 28
Projection for 2014 and 2015 . . . . . . . . . . . . . . . . . . . . . . . . . . . . 30
Methodology . . . . . . . . . . . . . . . . . . . . . . . . . . . . . . . . . . . . . . . . . . 32
Abbreviations. . . . . . . . . . . . . . . . . . . . . . . . . . . . . . . . . . . . . . . . . . 33
Appendix: EBITDA per subsegment and size. . . . . . . . . . . . . . . . . . 34
About EY . . . . . . . . . . . . . . . . . . . . . . . . . . . . . . . . . . . . . . . . . . . . . 35
Thought leadership . . . . . . . . . . . . . . . . . . . . . . . . . . . . . . . . . . . . . 36
Contacts . . . . . . . . . . . . . . . . . . . . . . . . . . . . . . . . . . . . . . . . . . . . . . 38
3The Norwegian oilfi eld services analysis 2014
The oilfi eld services (OFS) industry is one of the largest industries of mainland-Norway, with around 122,000 employees and NOK453b in total revenues from almost 1,100 companies. The industry has grown signifi cantly in recent years due to an exploration and production (E&P) spending boom on the Norwegian continental shelf (NCS), where investments grew by 67% from 2010 to 2013, as well as increased global spending on offshore oil and gas E&P equipment, where Norwegian OFS companies are key suppliers. Total Norwegian OFS revenues increased by 28% in this period, and the number of employees rose by 21%.
The EY Norwegian oilfi eld services analysis 2014 shows an all-time high activity level for the industry in 2013. The activity has been driven by the development of several new fi elds, large projects on major mature fi elds like Troll and Ekofi sk, a high exploration well count and robust exports.
Spending by E&P fi rms appears to have reached a peak in 2014, both globally and on the NCS. Analysts now forecast cuts in global E&P capital expenditure by 20%-25% from 2014 to 2015, while recent forecasts from Statistics Norway and the Norwegian Petroleum Directorate (NPD) point toward a 15% decline in NCS investments in 2015. The decline is caused both by the increased costs in the industry over the past few years, which have reduced the profi tability of new developments,and the fall in oil price since mid-2014.
The deteriorating outlook for the OFS industry can be seen in the share price development of listed fi rms. In the second half of 2014, share prices of energy equipment and service fi rms on the Oslo Stock Exchange fell by more than 40%, compared to the Norwegian stock market as a whole, which fell by less than 10%.
Toward the end of 2013, we observed a shift in the E&P companies’ emphasis from volume growth to profi tability. According to some E&P majors, cost increases during the boom had put pressure on the profi tability of new fi eld developments even with oil prices at US$100 per barrel. When the oil price abruptly fell toward US$50 per barrel at the end of2014, this only added to the pressure to cut costs.
The exports of Norwegian OFS fi rms have traditionally been directed toward global offshore developments. In recentyears, US land unconventional oil production has experienced strong growth in investment and activity level. US shale oil production has grown from an estimated 1.5 million barrels of oil per day (mbopd) in 2012, to close to 3.5 mbopd by 2014 according to the Energy Information Administration (EIA).
Unconventional oil offers an alternative source of supply to high-cost offshore developments such as the Arctic, deep and ultra-deep offshore investment projects, and may thus provide an additional restraint to the growth outlook of Norwegian OFS fi rms.
Based on current forecasts for E&P spending and guidance from listed OFS fi rms, we expect revenues in the industry to fall in 2015 following a small increase in 2014. Firms with robust order books and exporters benefi ting from a weakening Norwegian krone, may to some extent be sheltered from the worst impact in 2015. However, the outlook for 2016 is uncertain also for these fi rms if oil prices remain at the current levels.
Consequently, 2014 has resulted in the Norwegian OFS companies restructuring their personnel and equipment capacities and collaborating across the OFS segments and with their customers to form new and more integrated service offerings and technologies in the relentless effort to increase the cost effi ciency of tomorrow’s energy production. We expect that consolidation and restructuring are themes that will continue to dominate the agenda in 2015.
Summary

5The Norwegian oilfi eld services analysis 2014
Introduction
EY has been conducting the oilfi eld services (OFS) analysis every year since 2006, and the report has been developed and expanded each year in line with the growth of the industry it seeks to cover. In addition, EY has issued a report that covers the UK-based OFS industry, and these reports are now being expanded to cover other oil and gas regions.
In the 2014 report, we have added approximately 300 companies to the analysis and included more thorough analysis on the subsegments, so we believe this year’s edition is the most comprehensive analysis on the Norwegian oil services sector to date.
We hope that you fi nd the report useful and we welcome any feedback you may have.
MethodologyA company is defi ned as a Norwegian OFS company if:• At least 50% of its turnover is generated in the oil and
gas sector• It is a Norwegian-registered legal entity
Value chain segments• Reservoir/seismic• Exploration and production (E&P) drilling• Engineering, fabrication and installation• Operations • Decommissioning
Company size defi nition• Large companies: above NOK1b in revenues• Medium size companies: between NOK100m and NOK1b in revenues• Small companies: below NOK100m in revenues
The stand-alone fi nancial statements of each legal entity have been used to capture the fi nancial and non-fi nancial information included in our analysis of the sector. Large corporations have therefore not been analyzed as a group, but as the sum of their stand-alone legal entities that form the group. We have taken this approach in order to show a more detailed demographic view with regard to location and activities across the value chain. Intercompany transactions are therefore not eliminated when aggregating fi nancial fi gures. Each company has been linked to one geographic region only, based on the company’s business address.
Companies have also been linked to a single segment of the OFS value chain, based on each company’s main activity within the sector. Most companies will have activities in several geographic regions as well as across the value chain; however, this is not accounted for in this analysis.
Welcome to the 2014 version of EY’s annual review of the Norwegian oilfi eld services industry. In this report, we quantify the size and development of this diverse industry and analyze the dynamics across the oilfi eld services value chain.
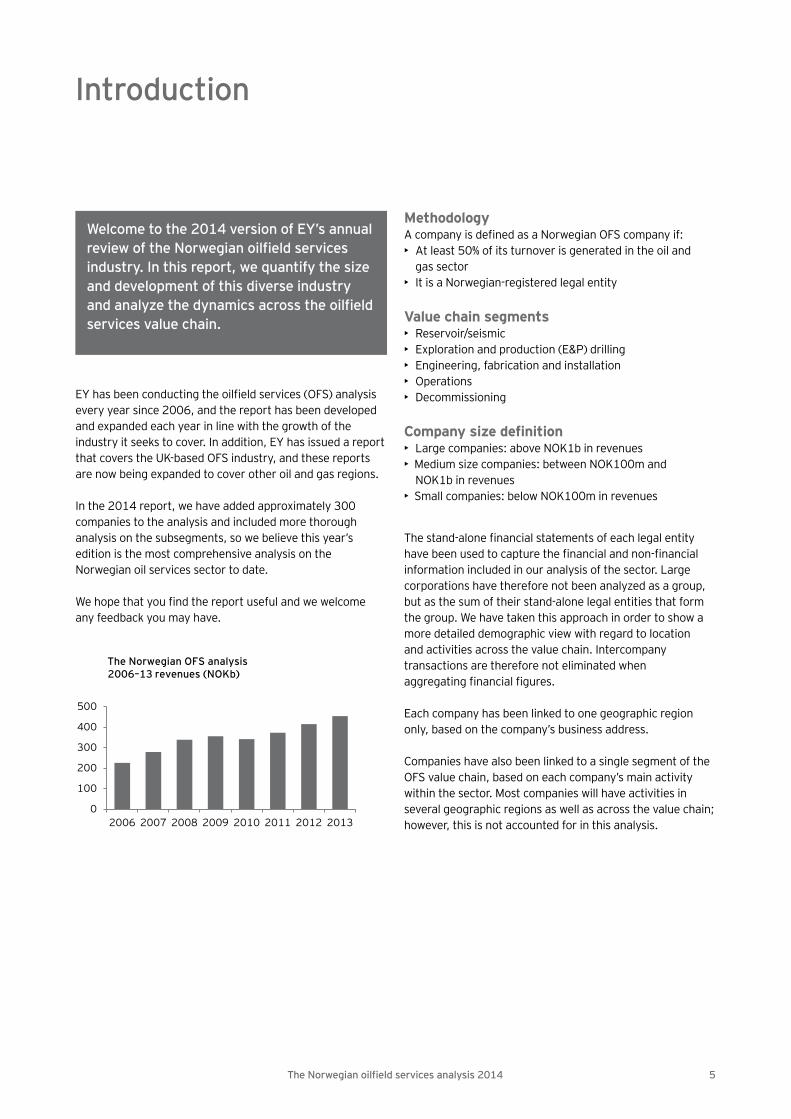
0
100
200
300
400
500
2006 2007 2008 2009 2010 2011 2012 2013
The Norwegian OFS analysis 2006–13 revenues (NOKb)

7The Norwegian oilfi eld services analysis 2014
Revenues in 2013 have grown while profi t margins have remained stable
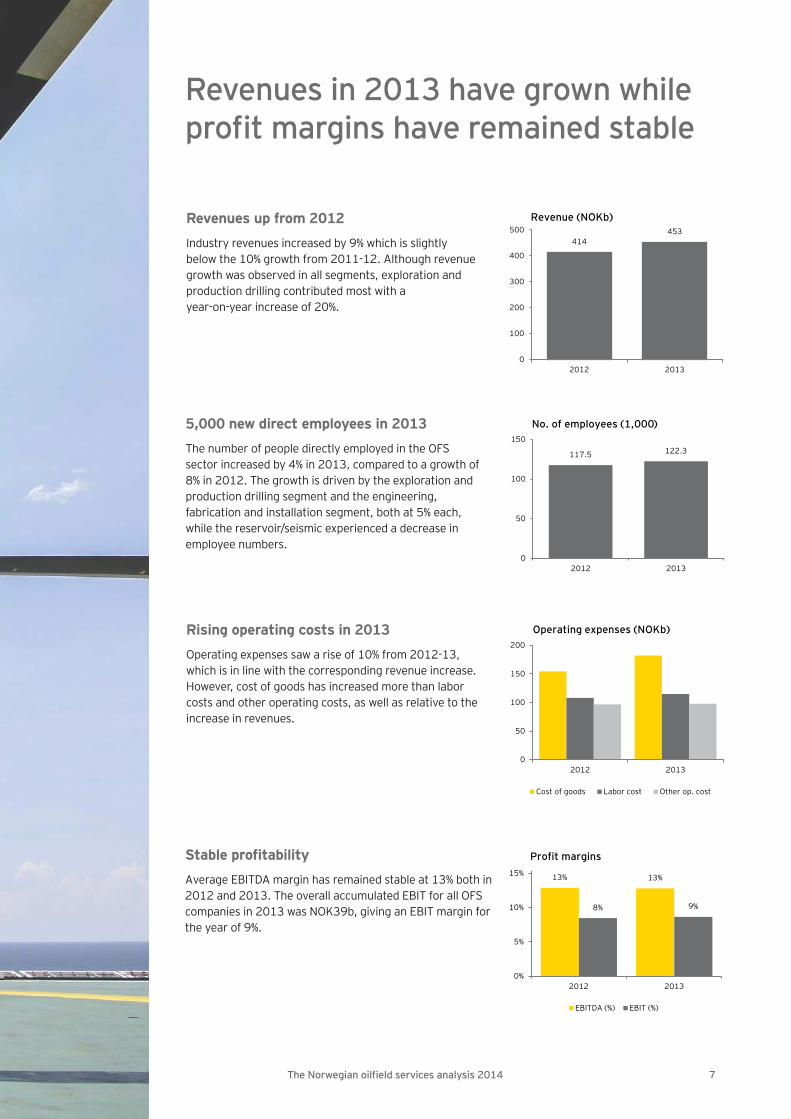
Revenues up from 2012Industry revenues increased by 9% which is slightly below the 10% growth from 2011-12. Although revenue growth was observed in all segments, exploration and production drilling contributed most with a year-on-year increase of 20%.
414453
0
100
200
300
400
500
2012 2013
Revenue (NOKb)
5,000 new direct employees in 2013The number of people directly employed in the OFS sector increased by 4% in 2013, compared to a growth of 8% in 2012. The growth is driven by the exploration and production drilling segment and the engineering, fabrication and installation segment, both at 5% each, while the reservoir/seismic experienced a decrease in employee numbers.
117.5 122.3
0
50
100
150
2012 2013
No. of employees (1,000)
Rising operating costs in 2013Operating expenses saw a rise of 10% from 2012-13, which is in line with the corresponding revenue increase. However, cost of goods has increased more than labor costs and other operating costs, as well as relative to the increase in revenues.
0
50
100
150
200
2012 2013
Operating expenses (NOKb)
Cost of goods Labor cost Other op. cost
Stable profi tabilityAverage EBITDA margin has remained stable at 13% both in 2012 and 2013. The overall accumulated EBIT for all OFS companies in 2013 was NOK39b, giving an EBIT margin for the year of 9%.
13% 13%
8% 9%
0%
5%
10%
15%
2012 2013
Profit margins
EBITDA (%) EBIT (%)
8 The Norwegian oilfi eld services analysis 2014
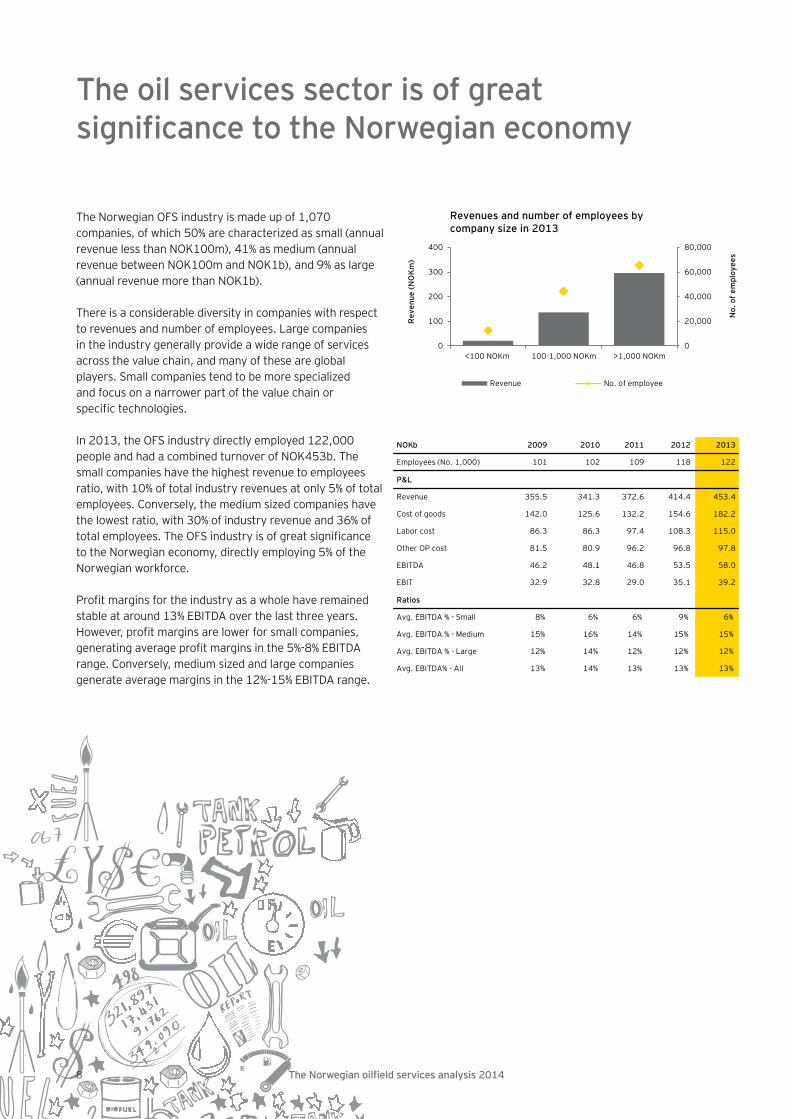
The Norwegian OFS industry is made up of 1,070 companies, of which 50% are characterized as small (annual revenue less than NOK100m), 41% as medium (annual revenue between NOK100m and NOK1b), and 9% as large (annual revenue more than NOK1b).
There is a considerable diversity in companies with respect to revenues and number of employees. Large companiesin the industry generally provide a wide range of services across the value chain, and many of these are global players. Small companies tend to be more specialized and focus on a narrower part of the value chain or specifi c technologies.
In 2013, the OFS industry directly employed 122,000 people and had a combined turnover of NOK453b. The small companies have the highest revenue to employees ratio, with 10% of total industry revenues at only 5% of total employees. Conversely, the medium sized companies have the lowest ratio, with 30% of industry revenue and 36% of total employees. The OFS industry is of great signifi canceto the Norwegian economy, directly employing 5% of theNorwegian workforce.
Profi t margins for the industry as a whole have remained stable at around 13% EBITDA over the last three years. However, profi t margins are lower for small companies, generating average profi t margins in the 5%-8% EBITDA range. Conversely, medium sized and large companies generate average margins in the 12%-15% EBITDA range.
The oil services sector is of great signifi cance to the Norwegian economy
0
20,000
40,000
60,000
80,000
0
100
200
300
400
<100 NOKm 100-1,000 NOKm >1,000 NOKm
No.
of e
mpl
oyee
s
Rev
enue
(NO
Km
)
Revenues and number of employees by company size in 2013
Revenue No. of employee
NOK b 2009 2010 2011 2012 2013
Employees (No. 1,000) 101 102 109 118 122
P&L
Revenue 355.5 341.3 372.6 414.4 453.4
Cost of goods 142.0 125.6 132.2 154.6 182.2
Labor cost 86.3 86.3 97.4 108.3 115.0
Other OP cost 81.5 80.9 96.2 96.8 97.8
EBITDA 46.2 48.1 46.8 53.5 58.0
EBIT 32.9 32.8 29.0 35.1 39.2
Ratios
Avg. EBITDA % - Small 8% 6% 6% 9% 6%
Avg. EBITDA % - Medium 15% 16% 14% 15% 15%
Avg. EBITDA % - Large 12% 14% 12% 12% 12%
Avg. EBITDA% - All 13% 14% 13% 13% 13%
8

9The Norwegian oilfi eld services analysis 2014
Stable EBITDA development and continued value creation in the OFS industry
EBITDAAggregated EBITDA has increased by 26% from 2009 to 2013. After a short dip in 2011, EBITDA resumed growth in 2012. EBITDA margins have been relatively stable the last three years, albeit lower than the levels in 2010.
0%
2%
4%
6%
8%
10%
12%
14%
16%
0
20
40
60
2009 2010 2011 2012 2013
EBITDA (NOKb) and EBITDA margin
EBITDA driversBy decomposing the drivers behind EBITDA, we fi nd that revenue and labor cost correlate well over the interval, with a growth of 27% and 33%, respectively.
Cost of goods, which the industry reduced after the fi nancial crisis, has been reversed, and negatively impact the industry EBITDA for 2013. This has mainly been driven by larger companies across the segments, and is a consequence of group structures and associated intercompany pricing arrangements.
-20%
-10%
0%
10%
20%
30%
40%
2009 2010 2011 2012 2013
EBITDA drivers
Revenue index Cost of goods index
Labor cost index Other costs (excl D&A) index
Value creationValue creation (EBITDA + labor costs) has grown steadily from 2009-13, totaling 31% over the period, and with a 7% increase year-on-year for 2013.
The growth in value creation per employee has only been 8%, of which 3% was from 2012-13. This has mainly been driven by companies in the reservoir/seismic segment.
1.30
1.32
1.34
1.36
1.38
1.40
1.42
1.44
0
50
100
150
200
2009 2010 2011 2012 2013
Val
ue c
reat
ion
per
empl
oyee
(N
OKm
)
Val
ue c
reat
ion
(NO
Kb)
Value creation in total and per employee
Value creation Value creation/employee
Labor costsTotal labor cost has grown by 33% during the period. This is explained by an increase in the labor force and in the cost of labor. The labor force grew by 21% during the period, reaching 122,000 in 2013. Labor cost per employee grew at a slower pace of 10% during the period, on average 2% per year, which corresponds with the average infl ation rate over the period.
Hence, the increase in total labor cost should be interpreted as a result of increased activity in the sector and not as an increase in the relative cost of labor.
0.80
0.82
0.84
0.86
0.88
0.90
0.92
0.94
0.96
0
50
100
150
2009 2010 2011 2012 2013
Labo
rco
st /
em
ploy
ee (N
OKm
)
# em
ploy
ees
(tho
usan
ds)
# of employees and labor costs
# employees Labor cost/employee

10 The Norwegian oilfi eld services analysis 2014
11The Norwegian oilfi eld services analysis 2014
Weakening demand for seismic services
Reservoir/seismic
Exploration and production drilling
Engineering, fabrication and
installationOperations Decom-
missioning
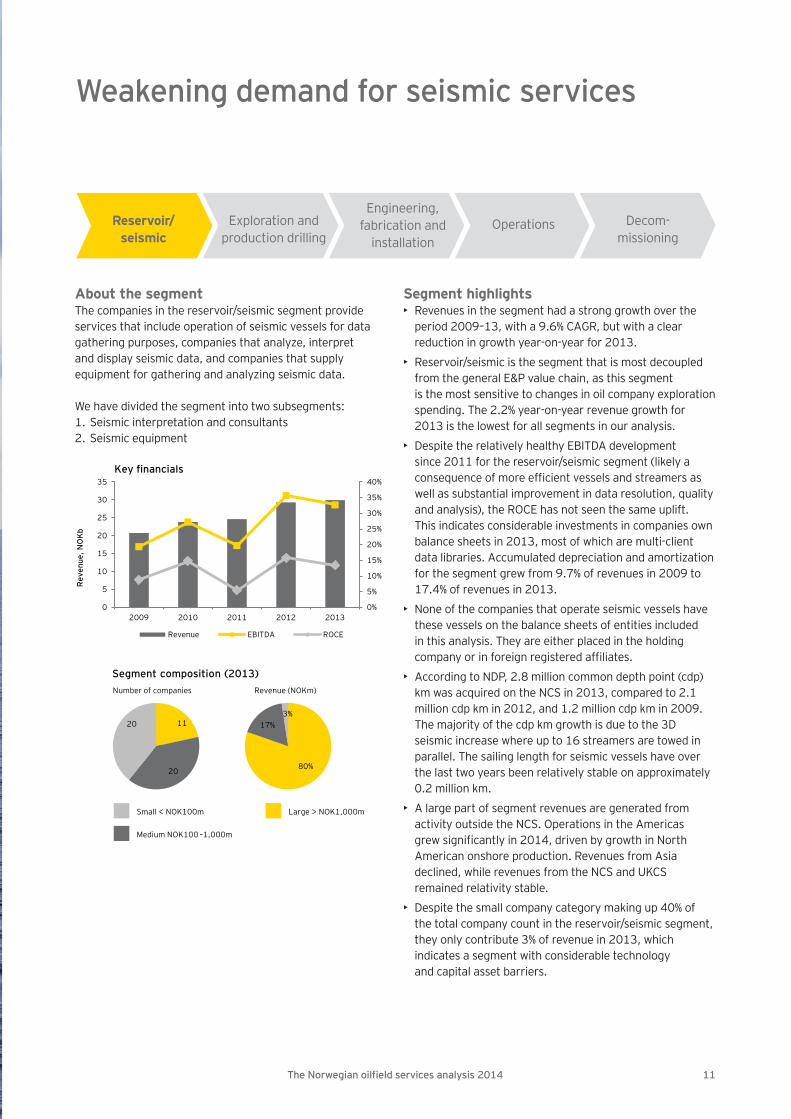
About the segmentThe companies in the reservoir/seismic segment provideservices that include operation of seismic vessels for datagathering purposes, companies that analyze, interpretand display seismic data, and companies that supplyequipment for gathering and analyzing seismic data.
We have divided the segment into two subsegments:1. Seismic interpretation and consultants2. Seismic equipment
Segment highlights• Revenues in the segment had a strong growth over the
period 2009–13, with a 9.6% CAGR, but with a clear reduction in growth year-on-year for 2013.
• Reservoir/seismic is the segment that is most decoupled from the general E&P value chain, as this segment
is the most sensitive to changes in oil company exploration spending. The 2.2% year-on-year revenue growth for 2013 is the lowest for all segments in our analysis.
• Despite the relatively healthy EBITDA development since 2011 for the reservoir/seismic segment (likely a consequence of more effi cient vessels and streamers as well as substantial improvement in data resolution, quality and analysis), the ROCE has not seen the same uplift. This indicates considerable investments in companies own balance sheets in 2013, most of which are multi-client data libraries. Accumulated depreciation and amortization for the segment grew from 9.7% of revenues in 2009 to 17.4% of revenues in 2013.
• None of the companies that operate seismic vessels have these vessels on the balance sheets of entities included in this analysis. They are either placed in the holding company or in foreign registered affi liates.
• According to NDP, 2.8 million common depth point (cdp) km was acquired on the NCS in 2013, compared to 2.1 million cdp km in 2012, and 1.2 million cdp km in 2009. The majority of the cdp km growth is due to the 3D seismic increase where up to 16 streamers are towed in parallel. The sailing length for seismic vessels have over the last two years been relatively stable on approximately 0.2 million km.
• A large part of segment revenues are generated from activity outside the NCS. Operations in the Americas grew signifi cantly in 2014, driven by growth in North American onshore production. Revenues from Asia declined, while revenues from the NCS and UKCS remained relativity stable.
• Despite the small company category making up 40% of the total company count in the reservoir/seismic segment, they only contribute 3% of revenue in 2013, which indicates a segment with considerable technology and capital asset barriers.
0%
5%
10%
15%
20%
25%
30%
35%
40%
0
5
10
15
20
25
30
35
2009 2010 2011 2012 2013
Rev
enue
, NO
Kb
Revenue EBITDA ROCE
Key financials
Segment composition (2013)
pie pie
Number of companies Revenue (NOKm)
Small < NOK100m Large > NOK1,000m
Medium NOK100 –1,000m
80%
17%3%
11
20
20
12 The Norwegian oilfi eld services analysis 2014
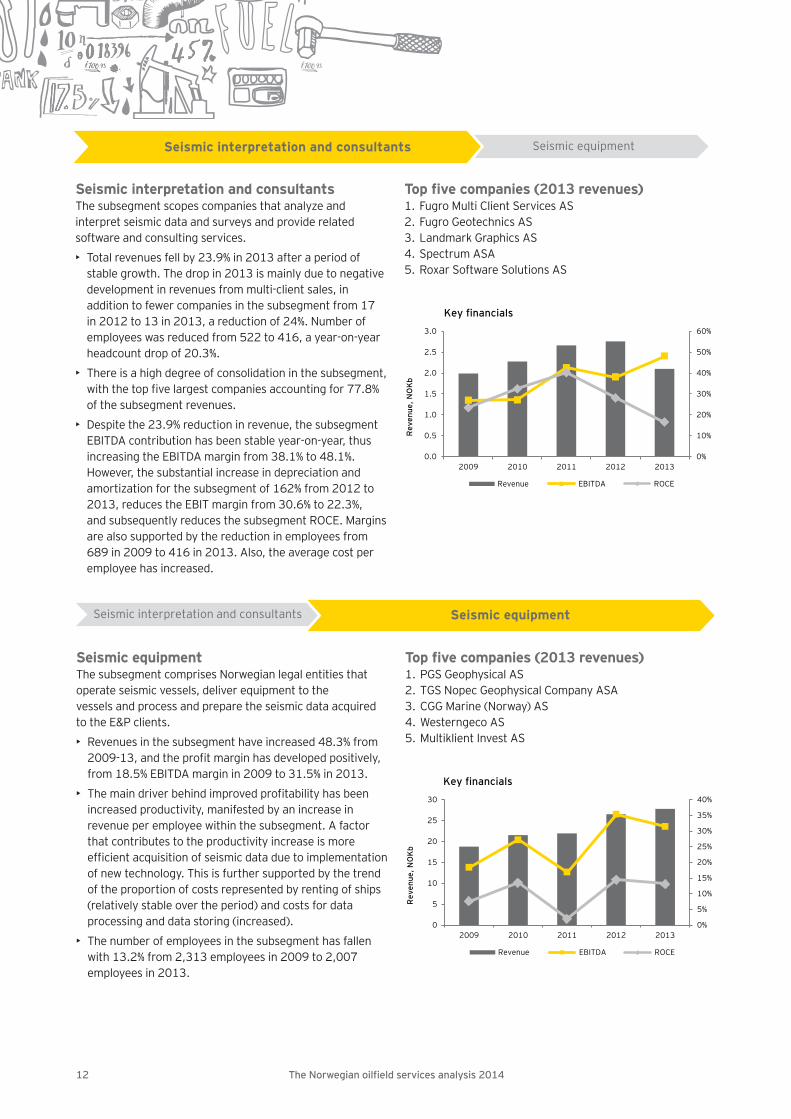
Seismic interpretation and consultantsThe subsegment scopes companies that analyze and interpret seismic data and surveys and provide related software and consulting services.
• Total revenues fell by 23.9% in 2013 after a period of stable growth. The drop in 2013 is mainly due to negative development in revenues from multi-client sales, in addition to fewer companies in the subsegment from 17 in 2012 to 13 in 2013, a reduction of 24%. Number of employees was reduced from 522 to 416, a year-on-year headcount drop of 20.3%.
• There is a high degree of consolidation in the subsegment, with the top fi ve largest companies accounting for 77.8% of the subsegment revenues.
• Despite the 23.9% reduction in revenue, the subsegment EBITDA contribution has been stable year-on-year, thus increasing the EBITDA margin from 38.1% to 48.1%. However, the substantial increase in depreciation and amortization for the subsegment of 162% from 2012 to 2013, reduces the EBIT margin from 30.6% to 22.3%, and subsequently reduces the subsegment ROCE. Margins are also supported by the reduction in employees from 689 in 2009 to 416 in 2013. Also, the average cost per employee has increased.
Top fi ve companies (2013 revenues)1. Fugro Multi Client Services AS2. Fugro Geotechnics AS3. Landmark Graphics AS4. Spectrum ASA5. Roxar Software Solutions AS
Key financials
0%
10%
20%
30%
40%
50%
60%
0.0
0.5
1.0
1.5
2.0
2.5
3.0
2009 2010 2011 2012 2013
Rev
enue
, NO
Kb
Revenue EBITDA ROCE
Seismic equipmentThe subsegment comprises Norwegian legal entities thatoperate seismic vessels, deliver equipment to thevessels and process and prepare the seismic data acquiredto the E&P clients.
• Revenues in the subsegment have increased 48.3% from 2009-13, and the profi t margin has developed positively, from 18.5% EBITDA margin in 2009 to 31.5% in 2013.
• The main driver behind improved profi tability has been increased productivity, manifested by an increase in revenue per employee within the subsegment. A factor that contributes to the productivity increase is more effi cient acquisition of seismic data due to implementation of new technology. This is further supported by the trend of the proportion of costs represented by renting of ships (relatively stable over the period) and costs for data processing and data storing (increased).
• The number of employees in the subsegment has fallen with 13.2% from 2,313 employees in 2009 to 2,007 employees in 2013.
Top fi ve companies (2013 revenues)1. PGS Geophysical AS2. TGS Nopec Geophysical Company ASA3. CGG Marine (Norway) AS4. Westerngeco AS5. Multiklient Invest AS
Key financials
0%
5%
10%
15%
20%
25%
30%
35%
40%
0
5
10
15
20
25
30
2009 2010 2011 2012 2013
Rev
enue
, NO
Kb
Revenue EBITDA ROCE
Seismic equipmentSeismic interpretation and consultants
Seismic interpretation and consultants Seismic equipment
13The Norwegian oilfi eld services analysis 2014
Strong historical growth at the expense of profi tability
Reservoir/seismic
Exploration and production drilling
Engineering, fabrication and
installationOperations Decom-
missioning
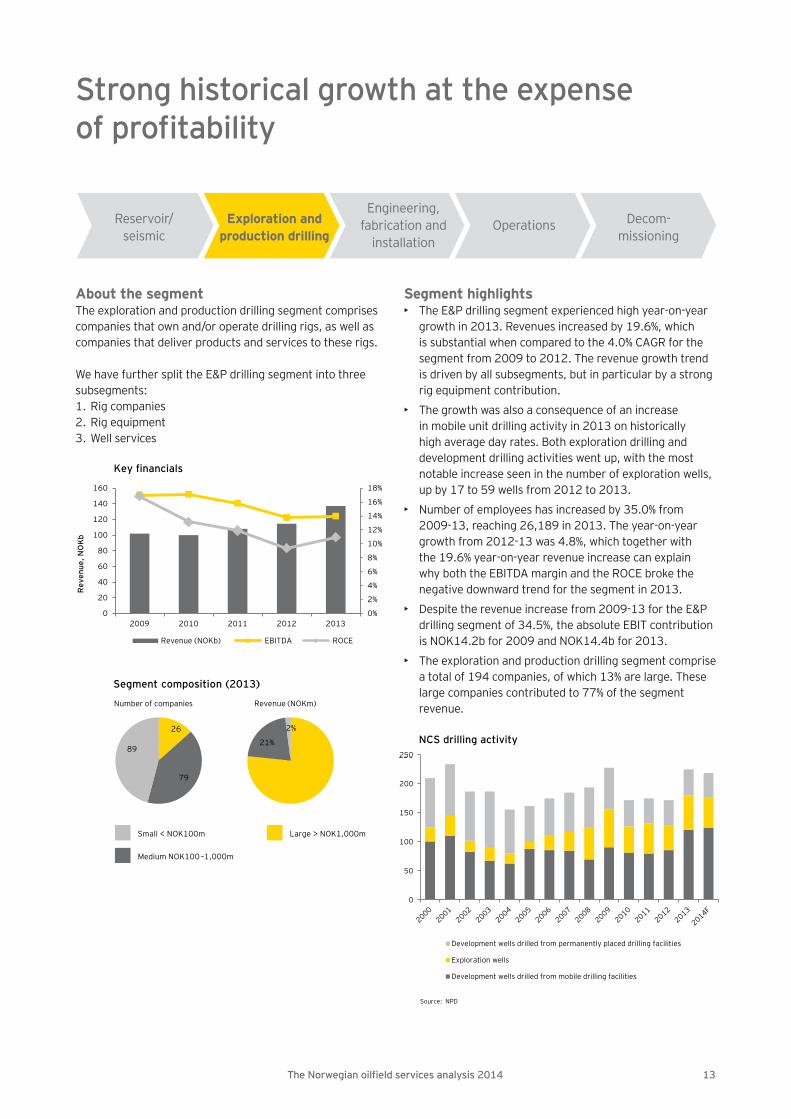
About the segmentThe exploration and production drilling segment comprises companies that own and/or operate drilling rigs, as well as companies that deliver products and services to these rigs.
We have further split the E&P drilling segment into three subsegments:1. Rig companies2. Rig equipment3. Well services
Segment highlights• The E&P drilling segment experienced high year-on-year
growth in 2013. Revenues increased by 19.6%, which is substantial when compared to the 4.0% CAGR for the segment from 2009 to 2012. The revenue growth trend is driven by all subsegments, but in particular by a strong rig equipment contribution.
• The growth was also a consequence of an increase in mobile unit drilling activity in 2013 on historically high average day rates. Both exploration drilling and development drilling activities went up, with the most notable increase seen in the number of exploration wells, up by 17 to 59 wells from 2012 to 2013.
• Number of employees has increased by 35.0% from 2009-13, reaching 26,189 in 2013. The year-on-year growth from 2012-13 was 4.8%, which together with the 19.6% year-on-year revenue increase can explain why both the EBITDA margin and the ROCE broke the negative downward trend for the segment in 2013.
• Despite the revenue increase from 2009-13 for the E&P drilling segment of 34.5%, the absolute EBIT contribution is NOK14.2b for 2009 and NOK14.4b for 2013.
• The exploration and production drilling segment comprise a total of 194 companies, of which 13% are large. These large companies contributed to 77% of the segment revenue.
Key financials
0%
2%
4%
6%
8%
10%
12%
14%
16%
18%
0
20
40
60
80
100
120
140
160
2009 2010 2011 2012 2013
Rev
enue
, NO
Kb
Revenue (NOKb) EBITDA ROCE
Segment composition (2013)
pie pie
Number of companies Revenue (NOKm)
21%
2%26
79
89
Small < NOK100m Large > NOK1,000m
Medium NOK100 –1,000m
0
50
100
150
200
250
Development wells drilled from permanently placed drilling facilities
Exploration wells
Development wells drilled from mobile drilling facilities
Source: NPD
250
NCS drilling activity

14 The Norwegian oilfi eld services analysis 2014
Rig companiesThe subsegment comprises companies that own and/or operate offshore drilling rigs. Few of the rig companies have rigs on their Norwegian balance sheets, which limits the relevance of ROCE analysis.
• Revenues grew by 18.2% from 2012-13, reaching NOK55b, compared to a CAGR of 4.8% for the years 2009-12.
• Both EBITDA margins and ROCE rebounded in 2013, after two years of negative trend. A strong market demand for offshore drilling equipment and services, especially for deepwater and harsh environment, is one key driver for this development.
• The drop in revenue in 2012 is primarily caused by changes in the legal set-up of one of the main NCS rig contractors and its fi nancial reporting of international revenues to its Norwegian subsidiaries. The remainder of the subsegment contributed with an increase in revenues by 7.0% from 2011-12. Thus, revenue growth in the subsegment has been more stable in the period 2011-13.
• The number of active rigs on the NCS has grown from 29 rigs in 2010 to 37 in 2014 (average in year). Based on current contracts, the NCS active rig count is expected to reach 43 in 2015. Prior to the NCS operators cost reduction program and the recent oil price decline, the forecast for active rigs on the NCS indicated 48 rigs in 2015.
• The subsegment has experienced an increase in number of employees from 7,000 in 2009 to 8,800 in 2013, a 26% growth over the period. During 2014, an estimated 5,000 OFS job cuts have been announced, of which approximately 600 are in the rig companies subsegment. This indicates an expected reduction in activity level for 2014.
• Because rig costs make up a considerable part of the overall offshore fi eld development budgets for operators, technology improvement has been a major part of suppliers’ and operators’ R&D focus. These efforts
combine increased drilling penetration rate and up-time and reduced trip-out requirements. Moreover, handling equipment has been developed to allow for parallel work processes, which is particularly benefi cial for deep- and ultra-deep operations. Current tailor-made NCS mid-water rigs under construction have ambitions of increasing the well construction effi ciency by 20%.
• Despite this, rate of penetration (ROP) on the NCS has not improved over the last decade. ROP increased in the years 1998-2003, from around 80 to 120 meters per day (mpd). From 2005 however, ROP has developed negatively, down from around 80 to 70 mpd. Diffi cult drilling conditions, older rigs, the NCS’ unique
Key financials
0%2%4%6%8%10%12%14%16%18%20%
0
10
20
30
40
50
60
2009 2010 2011 2012 2013
Rev
enue
, NO
Kb
Revenue EBITDA ROCE
Rig equipment Well servicesRig companies
2/4 personnel schedule and less focus on effi ciency are among the reasons pointed out by well service companies.
Top fi ve companies (2013 revenues)1. North Atlantic Norway Ltd2. Seadrill Offshore AS3. COSL Offshore Management AS4. Transocean Offshore (North Sea) Ltd NUF5. Dolphin Drilling AS
NCS active rigs and number of employees
29 3033
38 3739
43213
-7 -7
0
2,000
4,000
6,000
8,000
10,000
12,000
-10
0
10
20
30
40
50
2010 2011 2012 2013 2014 2015 2016
Num
ber
ofem
ploy
ees
Ave
rage
num
ber
of r
igs
Downside; contract ending Upside; currently suspendedPotential new rigs in year Current/firmEmployees, reg Employees, actual
Rig companies have seen stable revenue growth and in 2013 profi t margins rebounded after three consecutive declining years. The cost focus from operators has led to contract terminations and temporary suspension of rigs on the NCS, as well as general day rate pressure internationally, which indicates that the 2013 profi tability level will be short-lived.
15The Norwegian oilfi eld services analysis 2014
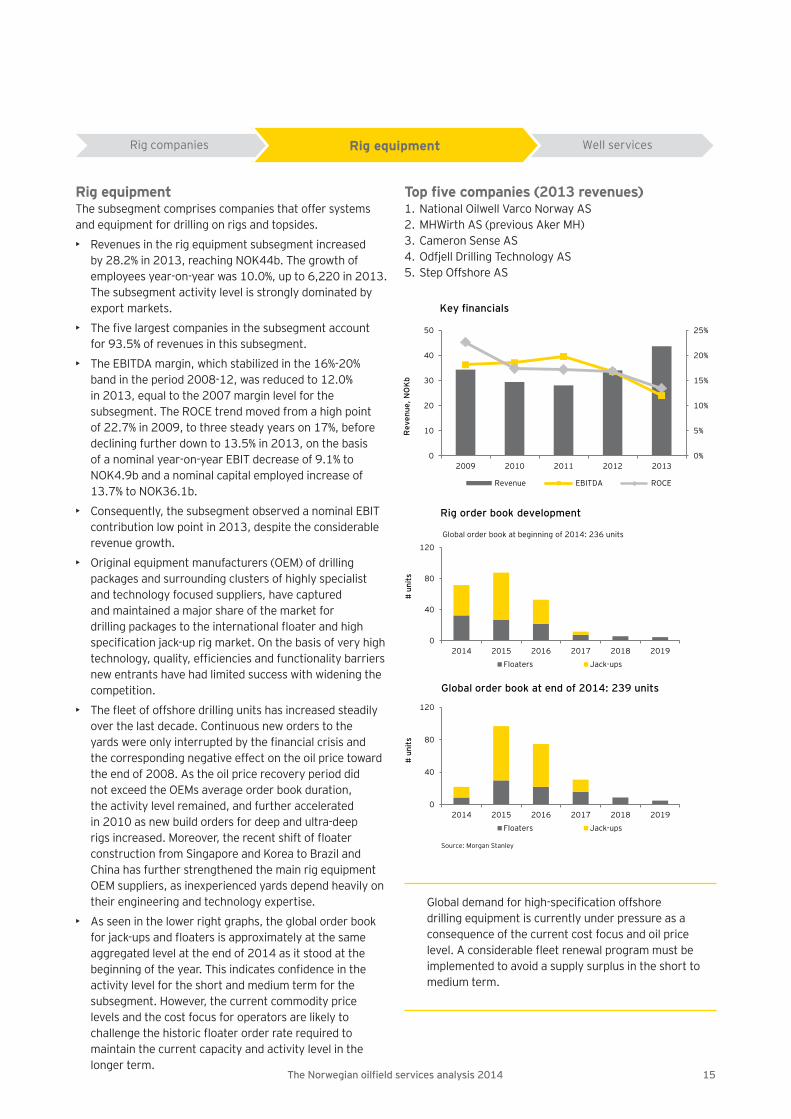
Rig equipmentThe subsegment comprises companies that offer systems and equipment for drilling on rigs and topsides.
• Revenues in the rig equipment subsegment increased by 28.2% in 2013, reaching NOK44b. The growth of employees year-on-year was 10.0%, up to 6,220 in 2013. The subsegment activity level is strongly dominated by export markets.
• The fi ve largest companies in the subsegment account for 93.5% of revenues in this subsegment.
• The EBITDA margin, which stabilized in the 16%-20% band in the period 2008-12, was reduced to 12.0% in 2013, equal to the 2007 margin level for the subsegment. The ROCE trend moved from a high point of 22.7% in 2009, to three steady years on 17%, before declining further down to 13.5% in 2013, on the basis of a nominal year-on-year EBIT decrease of 9.1% to NOK4.9b and a nominal capital employed increase of 13.7% to NOK36.1b.
• Consequently, the subsegment observed a nominal EBIT contribution low point in 2013, despite the considerable revenue growth.
• Original equipment manufacturers (OEM) of drilling packages and surrounding clusters of highly specialist and technology focused suppliers, have captured and maintained a major share of the market for drilling packages to the international fl oater and high specifi cation jack-up rig market. On the basis of very high technology, quality, effi ciencies and functionality barriers new entrants have had limited success with widening the competition.
• The fl eet of offshore drilling units has increased steadily over the last decade. Continuous new orders to the yards were only interrupted by the fi nancial crisis and the corresponding negative effect on the oil price toward the end of 2008. As the oil price recovery period did not exceed the OEMs average order book duration, the activity level remained, and further accelerated in 2010 as new build orders for deep and ultra-deep rigs increased. Moreover, the recent shift of fl oater construction from Singapore and Korea to Brazil and China has further strengthened the main rig equipment OEM suppliers, as inexperienced yards depend heavily on their engineering and technology expertise.
• As seen in the lower right graphs, the global order book for jack-ups and fl oaters is approximately at the same aggregated level at the end of 2014 as it stood at the beginning of the year. This indicates confi dence in the activity level for the short and medium term for the subsegment. However, the current commodity price levels and the cost focus for operators are likely to challenge the historic fl oater order rate required to
maintain the current capacity and activity level in the longer term.
Key financials
0%
5%
10%
15%
20%
25%
0
10
20
30
40
50
2009 2010 2011 2012 2013
Rev
enue
, NO
Kb
Revenue EBITDA ROCE
Rig companies Well servicesRig equipment
Top fi ve companies (2013 revenues)1. National Oilwell Varco Norway AS2. MHWirth AS (previous Aker MH) 3. Cameron Sense AS4. Odfjell Drilling Technology AS5. Step Offshore AS
0
40
80
120
2014 2015 2016 2017 2018 2019
# un
its
Global order book at beginning of 2014: 236 units
Floaters Jack-ups
Rig order book development
0
40
80
120
2014 2015 2016 2017 2018 2019
# un
its
Global order book at end of 2014: 239 units
Floaters Jack-ups
Source: Morgan Stanley
Global demand for high-specifi cation offshore drilling equipment is currently under pressure as a consequence of the current cost focus and oil price level. A considerable fl eet renewal program must be implemented to avoid a supply surplus in the short to medium term.
16 The Norwegian oilfi eld services analysis 2014
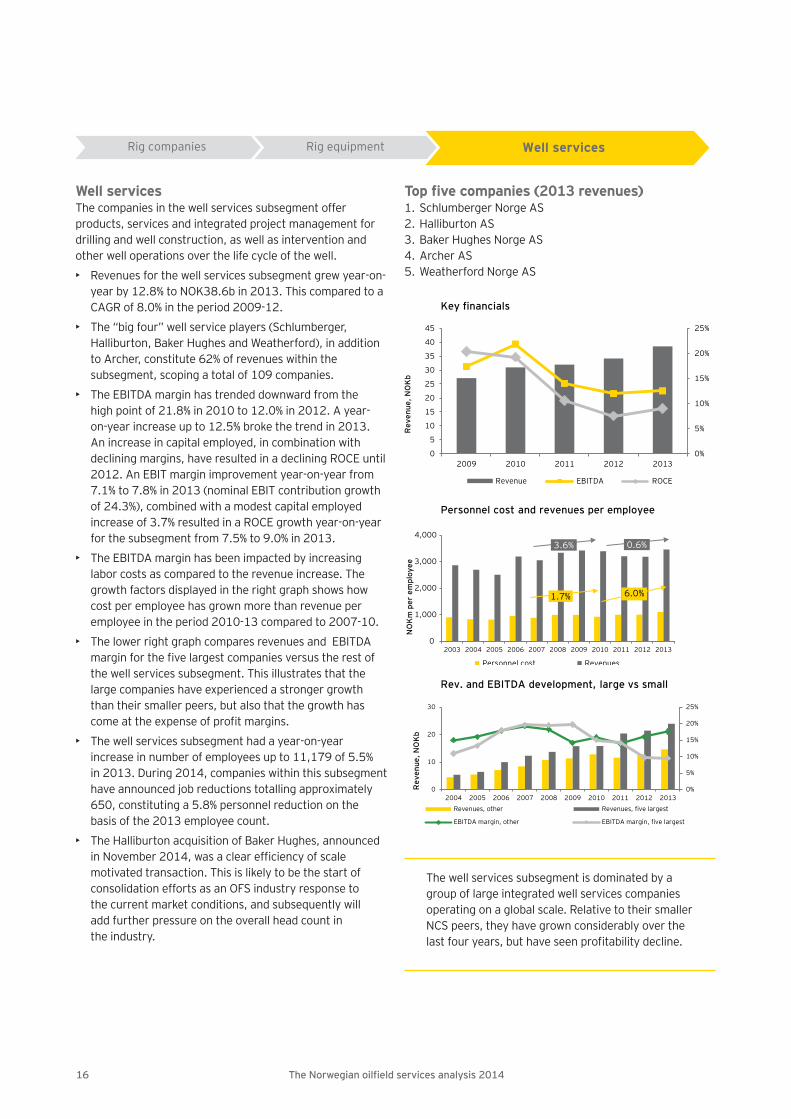
Well servicesThe companies in the well services subsegment offer products, services and integrated project management for drilling and well construction, as well as intervention and other well operations over the life cycle of the well.
• Revenues for the well services subsegment grew year-on- year by 12.8% to NOK38.6b in 2013. This compared to a CAGR of 8.0% in the period 2009-12.
• The “big four” well service players (Schlumberger, Halliburton, Baker Hughes and Weatherford), in addition to Archer, constitute 62% of revenues within the subsegment, scoping a total of 109 companies.
• The EBITDA margin has trended downward from the high point of 21.8% in 2010 to 12.0% in 2012. A year- on-year increase up to 12.5% broke the trend in 2013. An increase in capital employed, in combination with declining margins, have resulted in a declining ROCE until 2012. An EBIT margin improvement year-on-year from 7.1% to 7.8% in 2013 (nominal EBIT contribution growth of 24.3%), combined with a modest capital employed increase of 3.7% resulted in a ROCE growth year-on-year for the subsegment from 7.5% to 9.0% in 2013.
• The EBITDA margin has been impacted by increasing labor costs as compared to the revenue increase. The growth factors displayed in the right graph shows how cost per employee has grown more than revenue per employee in the period 2010-13 compared to 2007-10.
• The lower right graph compares revenues and EBITDA margin for the fi ve largest companies versus the rest of the well services subsegment. This illustrates that the large companies have experienced a stronger growth than their smaller peers, but also that the growth has come at the expense of profi t margins.
• The well services subsegment had a year-on-year increase in number of employees up to 11,179 of 5.5% in 2013. During 2014, companies within this subsegment have announced job reductions totalling approximately 650, constituting a 5.8% personnel reduction on the basis of the 2013 employee count.
• The Halliburton acquisition of Baker Hughes, announced in November 2014, was a clear effi ciency of scale motivated transaction. This is likely to be the start of consolidation efforts as an OFS industry response to the current market conditions, and subsequently will add further pressure on the overall head count in the industry.
Key financials
0%
5%
10%
15%
20%
25%
0
5
10
15
20
25
30
35
40
45
2009 2010 2011 2012 2013
Rev
enue
, NO
Kb
Revenue EBITDA ROCE
Rig companies Rig equipment Well services
Top fi ve companies (2013 revenues)1. Schlumberger Norge AS2. Halliburton AS3. Baker Hughes Norge AS4. Archer AS5. Weatherford Norge AS
0
1,000
2,000
3,000
4,000
2003 2004 2005 2006 2007 2008 2009 2010 2011 2012 2013
NO
Km
per
empl
oyee
Personnel cost Revenues
6.0%1.7%
0.6%3.6%
Personnel cost and revenues per employee
0%
5%
10%
15%
20%
25%
0
10
20
30
2004 2005 2006 2007 2008 2009 2010 2011 2012 2013
Rev
enue
, NO
Kb
Revenues, other Revenues, five largest
EBITDA margin, other EBITDA margin, five largest
Rev. and EBITDA development, large vs small
The well services subsegment is dominated by a group of large integrated well services companies operating on a global scale. Relative to their smaller NCS peers, they have grown considerably over the last four years, but have seen profi tability decline.
17The Norwegian oilfi eld services analysis 2014
High historical investment activity on the NCS has driven growth
Reservoir/seismic
Exploration and production drilling
Engineering, fabrication and
installationOperations Decom-
missioning
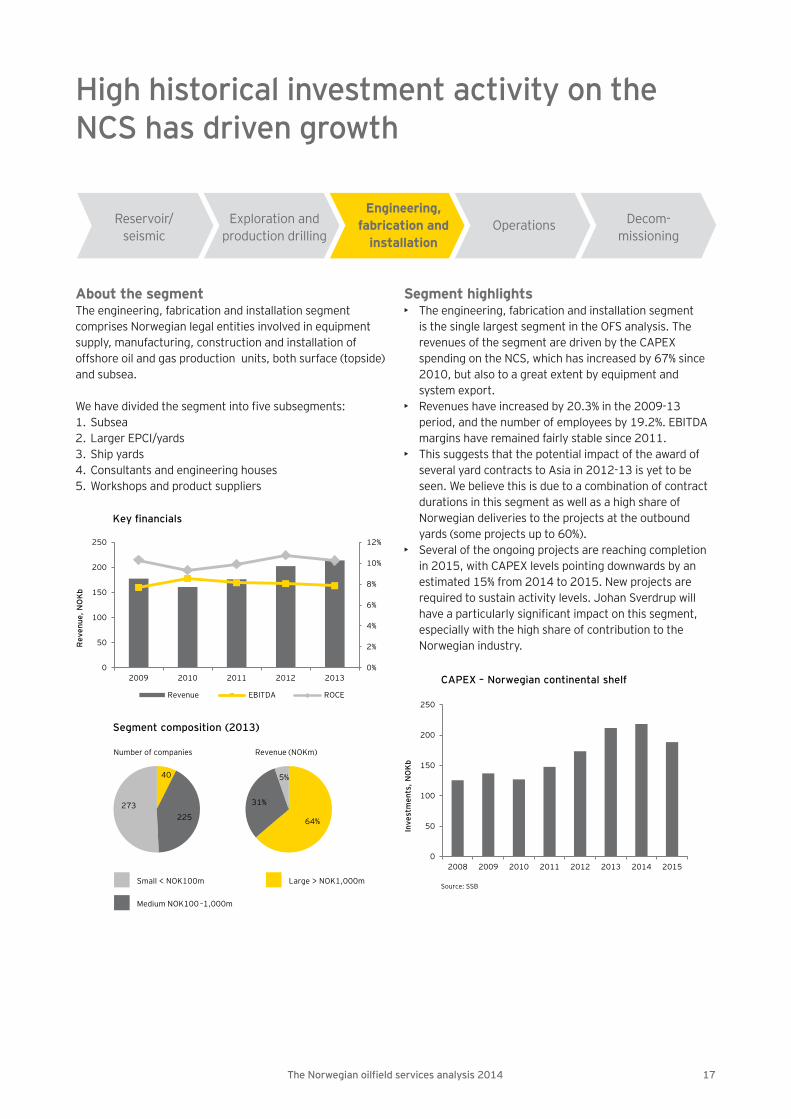
About the segmentThe engineering, fabrication and installation segment comprises Norwegian legal entities involved in equipment supply, manufacturing, construction and installation of offshore oil and gas production units, both surface (topside) and subsea.
We have divided the segment into fi ve subsegments:1. Subsea2. Larger EPCI/yards3. Ship yards4. Consultants and engineering houses5. Workshops and product suppliers
Segment highlights• The engineering, fabrication and installation segment
is the single largest segment in the OFS analysis. The revenues of the segment are driven by the CAPEX spending on the NCS, which has increased by 67% since 2010, but also to a great extent by equipment and system export.
• Revenues have increased by 20.3% in the 2009-13 period, and the number of employees by 19.2%. EBITDA margins have remained fairly stable since 2011.
• This suggests that the potential impact of the award of several yard contracts to Asia in 2012-13 is yet to be seen. We believe this is due to a combination of contract durations in this segment as well as a high share of Norwegian deliveries to the projects at the outbound yards (some projects up to 60%).
• Several of the ongoing projects are reaching completion in 2015, with CAPEX levels pointing downwards by an estimated 15% from 2014 to 2015. New projects are required to sustain activity levels. Johan Sverdrup will have a particularly signifi cant impact on this segment, especially with the high share of contribution to the Norwegian industry.
Key financials
0%
2%
4%
6%
8%
10%
12%
0
50
100
150
200
250
2009 2010 2011 2012 2013
Rev
enue
, NO
Kb
Revenue EBITDA ROCE
Segment composition (2013)
pie pie
Number of companies Revenue (NOKm)
64%
31%
5%40
225273
Small < NOK100m Large > NOK1,000m
Medium NOK100 –1,000m
CAPEX – Norwegian continental shelf
0
50
100
150
200
250
2008 2009 2010 2011 2012 2013 2014 2015
Inve
stm
ents
, NO
Kb
Source: SSB
18 The Norwegian oilfi eld services analysis 2014
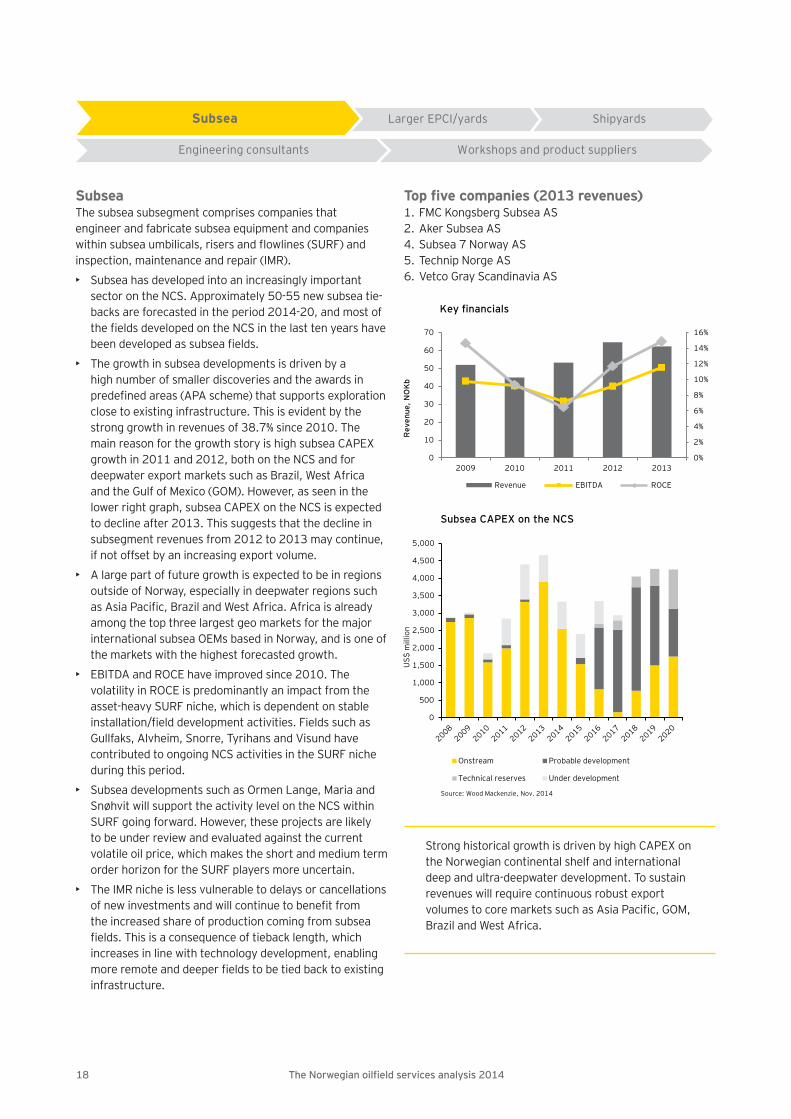
SubseaThe subsea subsegment comprises companies that engineer and fabricate subsea equipment and companies within subsea umbilicals, risers and fl owlines (SURF) and inspection, maintenance and repair (IMR).
• Subsea has developed into an increasingly important sector on the NCS. Approximately 50-55 new subsea tie-backs are forecasted in the period 2014-20, and most of the fi elds developed on the NCS in the last ten years have been developed as subsea fi elds.
• The growth in subsea developments is driven by a high number of smaller discoveries and the awards in predefi ned areas (APA scheme) that supports exploration close to existing infrastructure. This is evident by the strong growth in revenues of 38.7% since 2010. The main reason for the growth story is high subsea CAPEX growth in 2011 and 2012, both on the NCS and for deepwater export markets such as Brazil, West Africa and the Gulf of Mexico (GOM). However, as seen in the lower right graph, subsea CAPEX on the NCS is expected to decline after 2013. This suggests that the decline in subsegment revenues from 2012 to 2013 may continue, if not offset by an increasing export volume.
• A large part of future growth is expected to be in regions outside of Norway, especially in deepwater regions such as Asia Pacifi c, Brazil and West Africa. Africa is already among the top three largest geo markets for the major international subsea OEMs based in Norway, and is one of the markets with the highest forecasted growth.
• EBITDA and ROCE have improved since 2010. The volatility in ROCE is predominantly an impact from the asset-heavy SURF niche, which is dependent on stable installation/fi eld development activities. Fields such as Gullfaks, Alvheim, Snorre, Tyrihans and Visund have contributed to ongoing NCS activities in the SURF niche during this period.
• Subsea developments such as Ormen Lange, Maria and Snøhvit will support the activity level on the NCS within SURF going forward. However, these projects are likely to be under review and evaluated against the current volatile oil price, which makes the short and medium term order horizon for the SURF players more uncertain.
• The IMR niche is less vulnerable to delays or cancellations of new investments and will continue to benefi t from the increased share of production coming from subsea fi elds. This is a consequence of tieback length, which increases in line with technology development, enabling more remote and deeper fi elds to be tied back to existing infrastructure.
Top fi ve companies (2013 revenues)1. FMC Kongsberg Subsea AS2. Aker Subsea AS4. Subsea 7 Norway AS5. Technip Norge AS6. Vetco Gray Scandinavia AS
Key financials
0%
2%
4%
6%
8%
10%
12%
14%
16%
0
10
20
30
40
50
60
70
2009 2010 2011 2012 2013
Rev
enue
, NO
Kb
Revenue EBITDA ROCE
0
500
1,000
1,500
2,000
2,500
3,000
3,500
4,000
4,500
5,000
US$
mill
ion
Onstream Probable development
Technical reserves Under development
Subsea CAPEX on the NCS
Source: Wood Mackenzie, Nov. 2014
Larger EPCI/yards Shipyards
Engineering consultants Workshops and product suppliers
Subsea
Strong historical growth is driven by high CAPEX on the Norwegian continental shelf and international deep and ultra-deepwater development. To sustain revenues will require continuous robust export volumes to core markets such as Asia Pacifi c, GOM, Brazil and West Africa.
19The Norwegian oilfi eld services analysis 2014
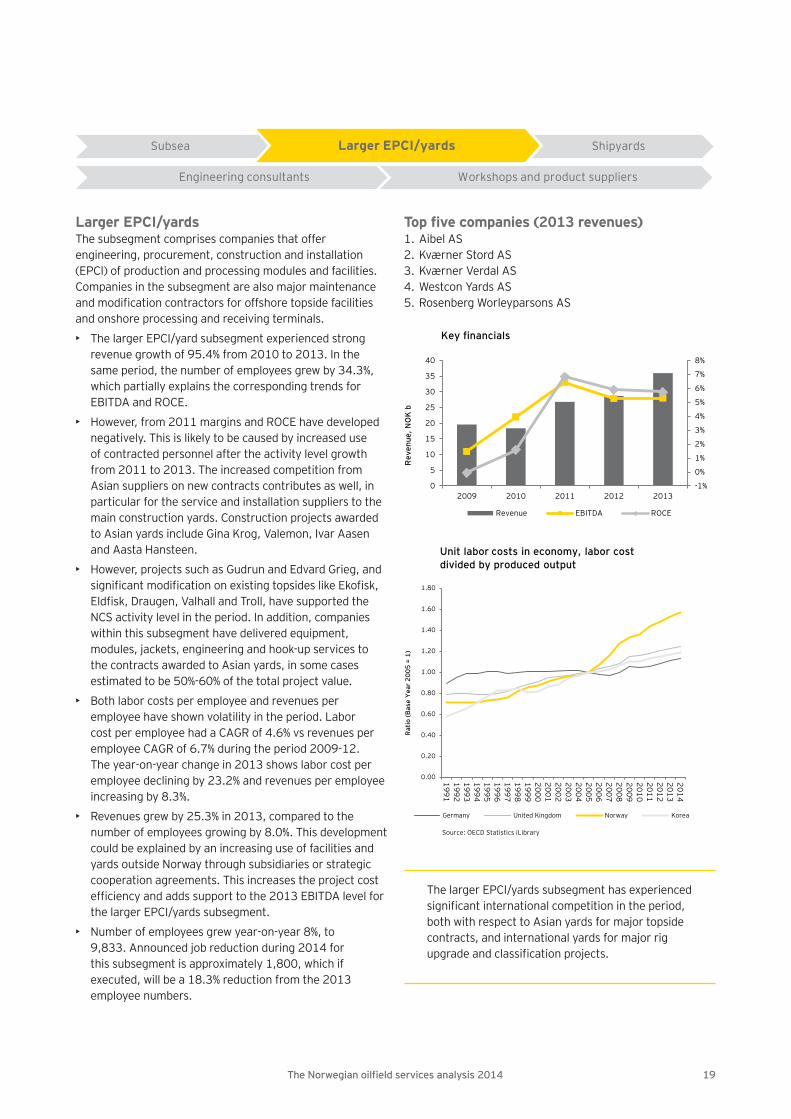
Larger EPCI/yardsThe subsegment comprises companies that offer engineering, procurement, construction and installation (EPCI) of production and processing modules and facilities. Companies in the subsegment are also major maintenance and modifi cation contractors for offshore topside facilities and onshore processing and receiving terminals.
• The larger EPCI/yard subsegment experienced strong revenue growth of 95.4% from 2010 to 2013. In the same period, the number of employees grew by 34.3%, which partially explains the corresponding trends for EBITDA and ROCE.
• However, from 2011 margins and ROCE have developed negatively. This is likely to be caused by increased use of contracted personnel after the activity level growth from 2011 to 2013. The increased competition from Asian suppliers on new contracts contributes as well, in particular for the service and installation suppliers to the main construction yards. Construction projects awarded to Asian yards include Gina Krog, Valemon, Ivar Aasen and Aasta Hansteen.
• However, projects such as Gudrun and Edvard Grieg, and signifi cant modifi cation on existing topsides like Ekofi sk, Eldfi sk, Draugen, Valhall and Troll, have supported the NCS activity level in the period. In addition, companies within this subsegment have delivered equipment, modules, jackets, engineering and hook-up services to the contracts awarded to Asian yards, in some cases estimated to be 50%-60% of the total project value.
• Both labor costs per employee and revenues per employee have shown volatility in the period. Labor cost per employee had a CAGR of 4.6% vs revenues per employee CAGR of 6.7% during the period 2009-12. The year-on-year change in 2013 shows labor cost per employee declining by 23.2% and revenues per employee increasing by 8.3%.
• Revenues grew by 25.3% in 2013, compared to the number of employees growing by 8.0%. This development could be explained by an increasing use of facilities and yards outside Norway through subsidiaries or strategic cooperation agreements. This increases the project cost effi ciency and adds support to the 2013 EBITDA level for the larger EPCI/yards subsegment.
• Number of employees grew year-on-year 8%, to 9,833. Announced job reduction during 2014 for this subsegment is approximately 1,800, which if executed, will be a 18.3% reduction from the 2013 employee numbers.
Top fi ve companies (2013 revenues)1. Aibel AS2. Kværner Stord AS3. Kværner Verdal AS4. Westcon Yards AS5. Rosenberg Worleyparsons AS
Key financials
-1%
0%
1%
2%
3%
4%
5%
6%
7%
8%
0
5
10
15
20
25
30
35
40
2009 2010 2011 2012 2013
Rev
enue
, NO
K b
Revenue EBITDA ROCE
Subsea Shipyards
Engineering consultants Workshops and product suppliers
Larger EPCI/yards
Unit labor costs in economy, labor cost divided by produced output
0.00
0.20
0.40
0.60
0.80
1.00
1.20
1.40
1.60
1.80
199119921993199419951996199719981999200020012002200320042005200620072008200920102011201220132014
Rat
io (B
ase
Yea
r 20
05 =
1)
Germany United Kingdom Norway Korea
Source: OECD Statistics iLibrary
The larger EPCI/yards subsegment has experienced signifi cant international competition in the period, both with respect to Asian yards for major topside contracts, and international yards for major rig upgrade and classifi cation projects.
20 The Norwegian oilfi eld services analysis 2014
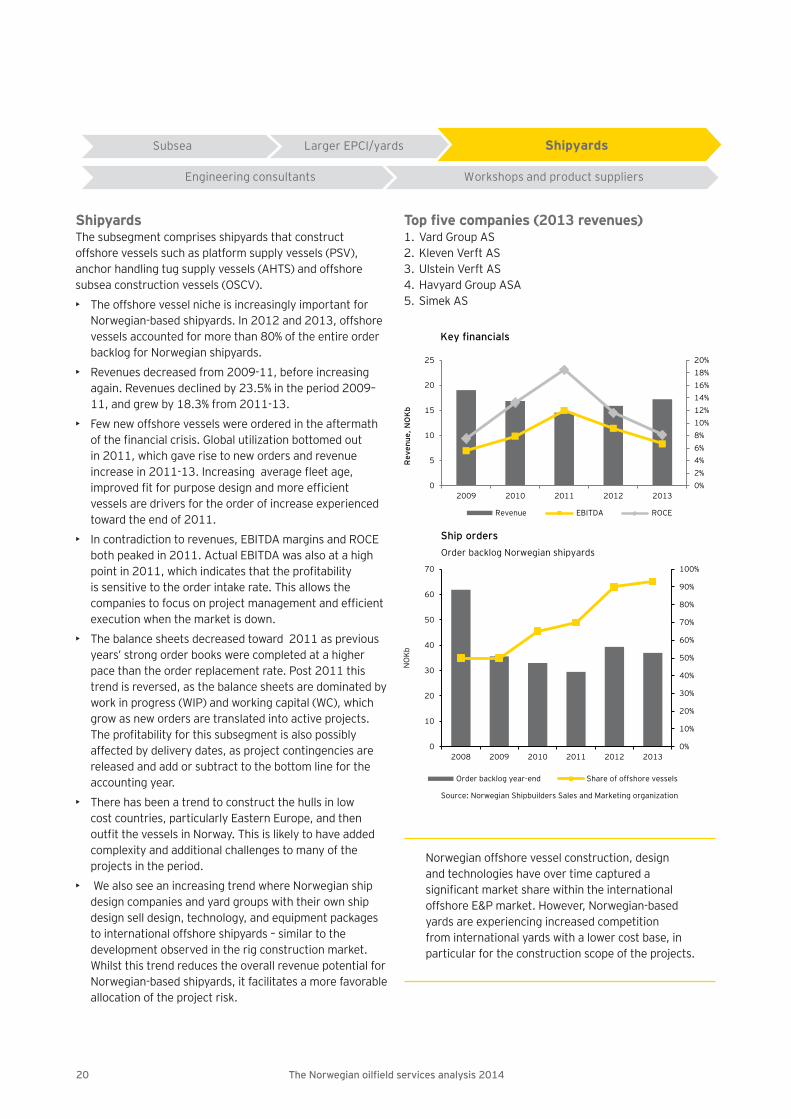
ShipyardsThe subsegment comprises shipyards that construct offshore vessels such as platform supply vessels (PSV), anchor handling tug supply vessels (AHTS) and offshore subsea construction vessels (OSCV).
• The offshore vessel niche is increasingly important for Norwegian-based shipyards. In 2012 and 2013, offshore vessels accounted for more than 80% of the entire order backlog for Norwegian shipyards.
• Revenues decreased from 2009-11, before increasing again. Revenues declined by 23.5% in the period 2009–11, and grew by 18.3% from 2011-13.
• Few new offshore vessels were ordered in the aftermath of the fi nancial crisis. Global utilization bottomed out in 2011, which gave rise to new orders and revenue increase in 2011-13. Increasing average fl eet age, improved fi t for purpose design and more effi cient vessels are drivers for the order of increase experienced toward the end of 2011.
• In contradiction to revenues, EBITDA margins and ROCE both peaked in 2011. Actual EBITDA was also at a high point in 2011, which indicates that the profi tability is sensitive to the order intake rate. This allows the companies to focus on project management and effi cient execution when the market is down.
• The balance sheets decreased toward 2011 as previous years’ strong order books were completed at a higher pace than the order replacement rate. Post 2011 this trend is reversed, as the balance sheets are dominated by work in progress (WIP) and working capital (WC), which grow as new orders are translated into active projects. The profi tability for this subsegment is also possibly affected by delivery dates, as project contingencies are released and add or subtract to the bottom line for the accounting year.
• There has been a trend to construct the hulls in low cost countries, particularly Eastern Europe, and then outfi t the vessels in Norway. This is likely to have added complexity and additional challenges to many of the projects in the period.
• We also see an increasing trend where Norwegian ship design companies and yard groups with their own ship design sell design, technology, and equipment packages to international offshore shipyards – similar to the development observed in the rig construction market. Whilst this trend reduces the overall revenue potential for Norwegian-based shipyards, it facilitates a more favorable allocation of the project risk.
Top fi ve companies (2013 revenues)1. Vard Group AS2. Kleven Verft AS3. Ulstein Verft AS4. Havyard Group ASA5. Simek AS
Key financials
0%2%4%6%8%10%12%14%16%18%20%
0
5
10
15
20
25
2009 2010 2011 2012 2013
Rev
enue
, NO
Kb
Revenue EBITDA ROCE
Ship orders
0%
10%
20%
30%
40%
50%
60%
70%
80%
90%
100%
0
10
20
30
40
50
60
70
2008 2009 2010 2011 2012 2013
NO
Kb
Order backlog Norwegian shipyards
Order backlog year-end Share of offshore vessels
Source: Norwegian Shipbuilders Sales and Marketing organization
Subsea Larger EPCI/yards
Engineering consultants Workshops and product suppliers
Shipyards
Norwegian offshore vessel construction, design and technologies have over time captured a signifi cant market share within the international offshore E&P market. However, Norwegian-based yards are experiencing increased competition from international yards with a lower cost base, in particular for the construction scope of the projects.
21The Norwegian oilfi eld services analysis 2014
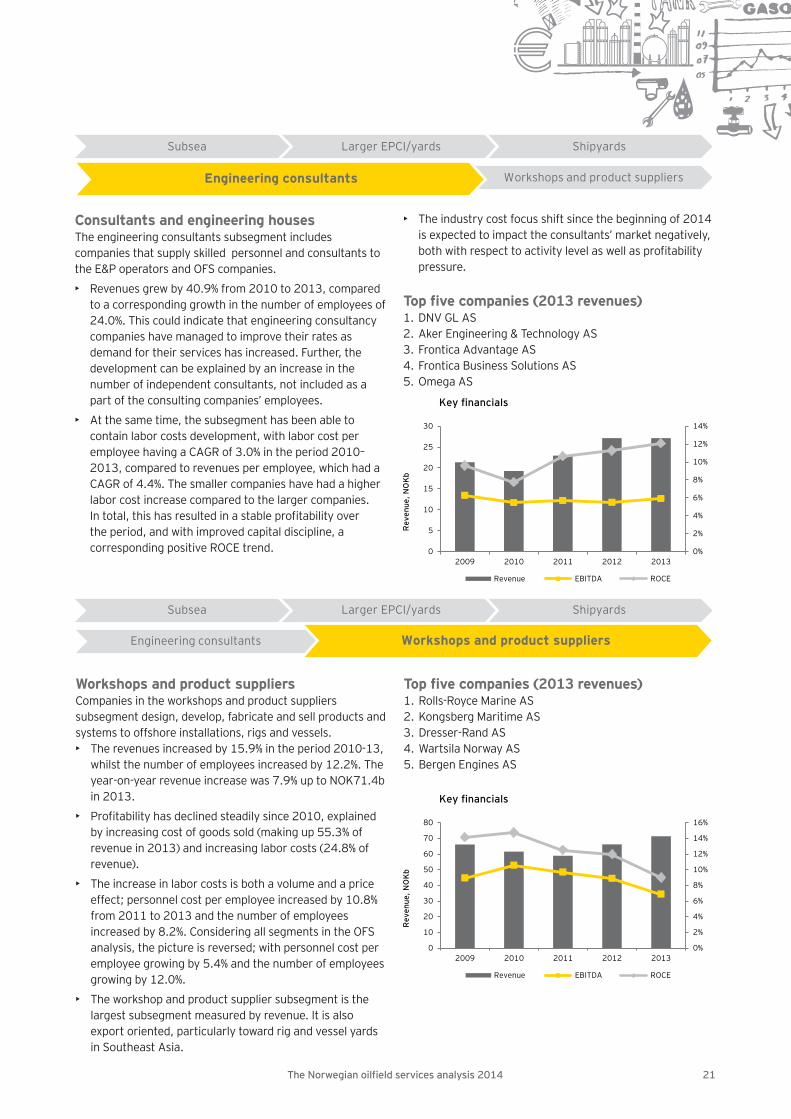
Consultants and engineering housesThe engineering consultants subsegment includes companies that supply skilled personnel and consultants to the E&P operators and OFS companies.
• Revenues grew by 40.9% from 2010 to 2013, compared to a corresponding growth in the number of employees of 24.0%. This could indicate that engineering consultancy companies have managed to improve their rates as demand for their services has increased. Further, the development can be explained by an increase in the number of independent consultants, not included as a part of the consulting companies’ employees.
• At the same time, the subsegment has been able to contain labor costs development, with labor cost per employee having a CAGR of 3.0% in the period 2010–2013, compared to revenues per employee, which had a CAGR of 4.4%. The smaller companies have had a higher labor cost increase compared to the larger companies. In total, this has resulted in a stable profi tability over the period, and with improved capital discipline, a corresponding positive ROCE trend.
• The industry cost focus shift since the beginning of 2014 is expected to impact the consultants’ market negatively, both with respect to activity level as well as profi tability pressure.
Top fi ve companies (2013 revenues)1. DNV GL AS2. Aker Engineering & Technology AS3. Frontica Advantage AS4. Frontica Business Solutions AS5. Omega AS
Subsea Larger EPCI/yards Shipyards
Workshops and product suppliersEngineering consultants
Key financials
0%
2%
4%
6%
8%
10%
12%
14%
0
5
10
15
20
25
30
2009 2010 2011 2012 2013
Rev
enue
, NO
Kb
Revenue EBITDA ROCE
Subsea Larger EPCI/yards Shipyards
Engineering consultants Workshops and product suppliers
Workshops and product suppliersCompanies in the workshops and product suppliers subsegment design, develop, fabricate and sell products and systems to offshore installations, rigs and vessels.• The revenues increased by 15.9% in the period 2010-13,
whilst the number of employees increased by 12.2%. The year-on-year revenue increase was 7.9% up to NOK71.4b in 2013.
• Profi tability has declined steadily since 2010, explained by increasing cost of goods sold (making up 55.3% of revenue in 2013) and increasing labor costs (24.8% of revenue).
• The increase in labor costs is both a volume and a price effect; personnel cost per employee increased by 10.8% from 2011 to 2013 and the number of employees increased by 8.2%. Considering all segments in the OFS analysis, the picture is reversed; with personnel cost per employee growing by 5.4% and the number of employees growing by 12.0%.
• The workshop and product supplier subsegment is the largest subsegment measured by revenue. It is also export oriented, particularly toward rig and vessel yards in Southeast Asia.
Top fi ve companies (2013 revenues)1. Rolls-Royce Marine AS2. Kongsberg Maritime AS3. Dresser-Rand AS4. Wartsila Norway AS5. Bergen Engines AS
Key financials
0%
2%
4%
6%
8%
10%
12%
14%
16%
0
10
20
30
40
50
60
70
80
2009 2010 2011 2012 2013
Rev
enue
, NO
Kb
Revenue EBITDA ROCE
22 The Norwegian oilfi eld services analysis 2014
Historically stable development, but challenges expected going forward
Reservoir/seismic
Exploration and production drilling
Engineering, fabrication and
installationOperations Decom-
missioning
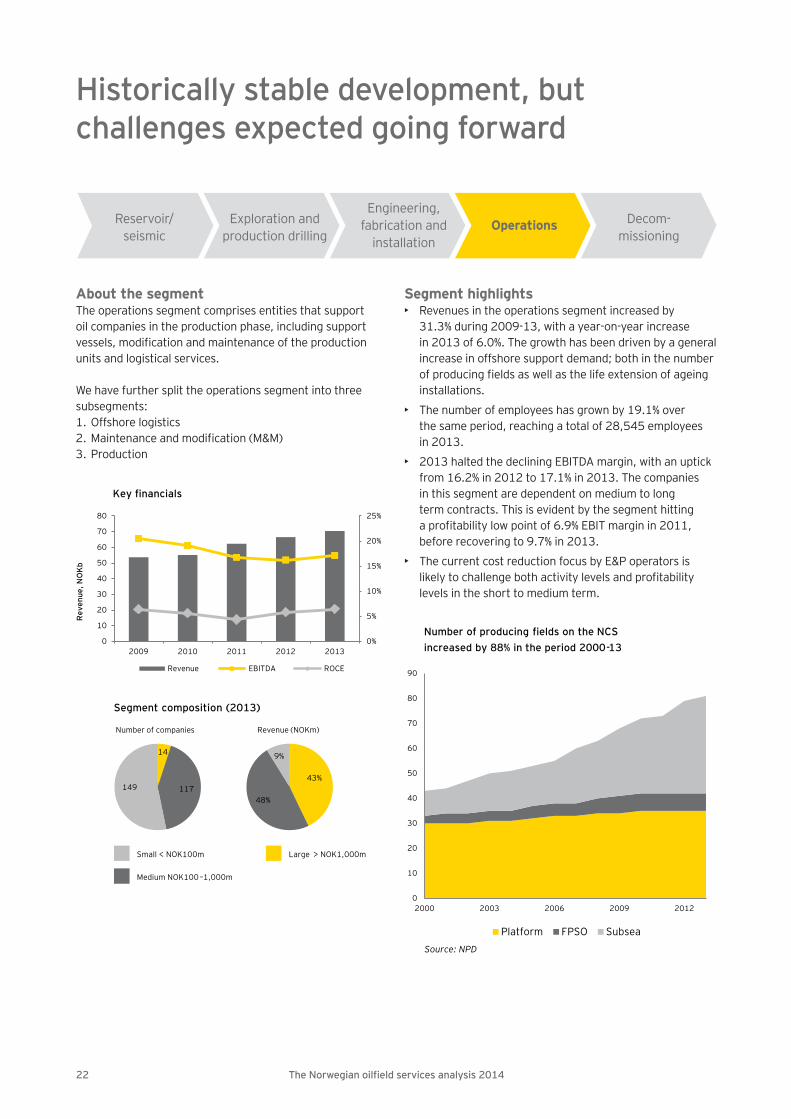
About the segmentThe operations segment comprises entities that supportoil companies in the production phase, including support vessels, modifi cation and maintenance of the production units and logistical services.
We have further split the operations segment into three subsegments:1. Offshore logistics2. Maintenance and modifi cation (M&M)3. Production
Segment highlights• Revenues in the operations segment increased by
31.3% during 2009-13, with a year-on-year increase in 2013 of 6.0%. The growth has been driven by a general increase in offshore support demand; both in the number of producing fi elds as well as the life extension of ageing installations.
• The number of employees has grown by 19.1% over the same period, reaching a total of 28,545 employees in 2013.
• 2013 halted the declining EBITDA margin, with an uptick from 16.2% in 2012 to 17.1% in 2013. The companies in this segment are dependent on medium to long term contracts. This is evident by the segment hitting a profi tability low point of 6.9% EBIT margin in 2011, before recovering to 9.7% in 2013.
• The current cost reduction focus by E&P operators is likely to challenge both activity levels and profi tability levels in the short to medium term.
Key financials
0%
5%
10%
15%
20%
25%
0
10
20
30
40
50
60
70
80
2009 2010 2011 2012 2013
Rev
enue
, NO
Kb
Revenue EBITDA ROCE
Segment composition (2013)
pie pie
Number of companies Revenue (NOKm)
43%
48%
9%14
117149
Small < NOK100m Large > NOK1,000m
Medium NOK100 –1,000m
Number of producing fields on the NCS increased by 88% in the period 2000-13
0
10
20
30
40
50
60
70
80
90
2000 2003 2006 2009 2012
Platform FPSO SubseaSource: NPD
23The Norwegian oilfi eld services analysis 2014
Maintenance and modification ProductionOffshore logistics
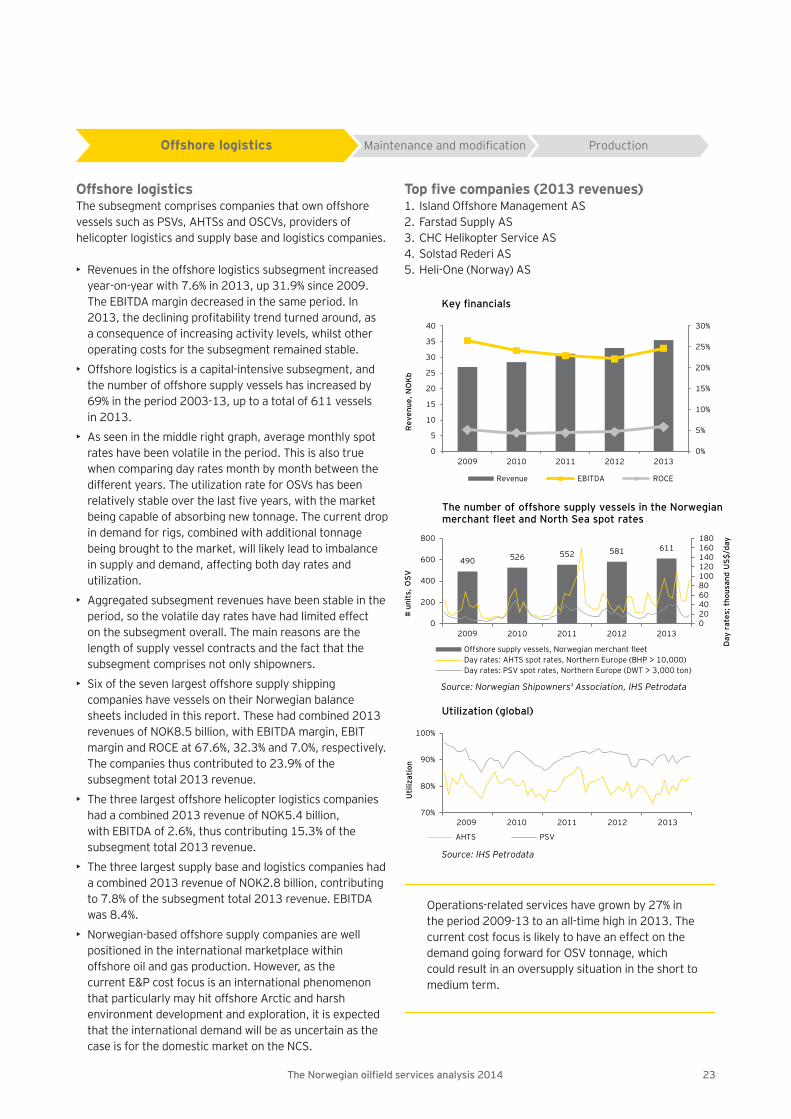
Offshore logisticsThe subsegment comprises companies that own offshorevessels such as PSVs, AHTSs and OSCVs, providers of helicopter logistics and supply base and logistics companies.
• Revenues in the offshore logistics subsegment increased year-on-year with 7.6% in 2013, up 31.9% since 2009. The EBITDA margin decreased in the same period. In 2013, the declining profi tability trend turned around, as a consequence of increasing activity levels, whilst other operating costs for the subsegment remained stable.
• Offshore logistics is a capital-intensive subsegment, and the number of offshore supply vessels has increased by 69% in the period 2003-13, up to a total of 611 vessels in 2013.
• As seen in the middle right graph, average monthly spot rates have been volatile in the period. This is also true when comparing day rates month by month between the different years. The utilization rate for OSVs has been relatively stable over the last fi ve years, with the market being capable of absorbing new tonnage. The current drop in demand for rigs, combined with additional tonnage being brought to the market, will likely lead to imbalance in supply and demand, affecting both day rates and utilization.
• Aggregated subsegment revenues have been stable in the period, so the volatile day rates have had limited effect on the subsegment overall. The main reasons are the length of supply vessel contracts and the fact that the subsegment comprises not only shipowners.
• Six of the seven largest offshore supply shipping companies have vessels on their Norwegian balance sheets included in this report. These had combined 2013 revenues of NOK8.5 billion, with EBITDA margin, EBIT margin and ROCE at 67.6%, 32.3% and 7.0%, respectively. The companies thus contributed to 23.9% of the subsegment total 2013 revenue.
• The three largest offshore helicopter logistics companies had a combined 2013 revenue of NOK5.4 billion, with EBITDA of 2.6%, thus contributing 15.3% of the subsegment total 2013 revenue.
• The three largest supply base and logistics companies had a combined 2013 revenue of NOK2.8 billion, contributing to 7.8% of the subsegment total 2013 revenue. EBITDA was 8.4%.
• Norwegian-based offshore supply companies are well positioned in the international marketplace within offshore oil and gas production. However, as the current E&P cost focus is an international phenomenon that particularly may hit offshore Arctic and harsh environment development and exploration, it is expected that the international demand will be as uncertain as the case is for the domestic market on the NCS.
Top fi ve companies (2013 revenues)1. Island Offshore Management AS2. Farstad Supply AS3. CHC Helikopter Service AS4. Solstad Rederi AS5. Heli-One (Norway) AS
Key financials
0%
5%
10%
15%
20%
25%
30%
0
5
10
15
20
25
30
35
40
2009 2010 2011 2012 2013
Rev
enue
, NO
Kb
Revenue EBITDA ROCE
The number of offshore supply vessels in the Norwegian merchant fleet and North Sea spot rates
490 526 552 581 611
20092010201120122013
020406080100120140160180
0
200
400
600
800
2009 2010 2011 2012 2013
Day
rat
es; t
hous
and
US$
/day
# un
its,
OSV
Offshore supply vessels, Norwegian merchant fleetDay rates: AHTS spot rates, Northern Europe (BHP > 10,000)Day rates: PSV spot rates, Northern Europe (DWT > 3,000 ton)
Source: Norwegian Shipowners' Association, IHS Petrodata
70%
80%
90%
100%
2009-01 2010-01 2011-01 2012-01 2013-01
Uti
lizat
ion
AHTS PSV
2009 2010 2011 2012 2013
Source: IHS Petrodata
Utilization (global)
Operations-related services have grown by 27% in the period 2009-13 to an all-time high in 2013. The current cost focus is likely to have an effect on the demand going forward for OSV tonnage, whichcould result in an oversupply situation in the short to medium term.
24 The Norwegian oilfi eld services analysis 2014
Offshore logistics ProductionMaintenance and modification
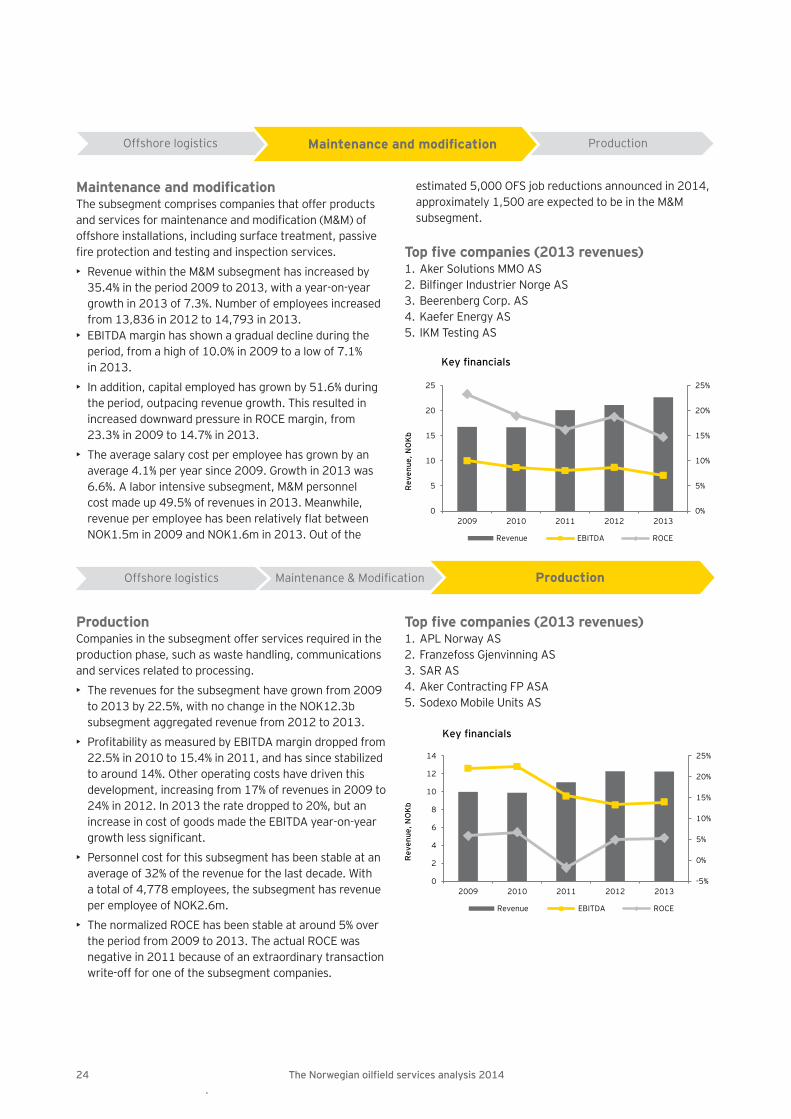
Maintenance and modifi cationThe subsegment comprises companies that offer products and services for maintenance and modifi cation (M&M) ofoffshore installations, including surface treatment, passive fi re protection and testing and inspection services.
• Revenue within the M&M subsegment has increased by 35.4% in the period 2009 to 2013, with a year-on-year growth in 2013 of 7.3%. Number of employees increased from 13,836 in 2012 to 14,793 in 2013.
• EBITDA margin has shown a gradual decline during the period, from a high of 10.0% in 2009 to a low of 7.1% in 2013.
• In addition, capital employed has grown by 51.6% during the period, outpacing revenue growth. This resulted in increased downward pressure in ROCE margin, from 23.3% in 2009 to 14.7% in 2013.
• The average salary cost per employee has grown by an average 4.1% per year since 2009. Growth in 2013 was 6.6%. A labor intensive subsegment, M&M personnel cost made up 49.5% of revenues in 2013. Meanwhile, revenue per employee has been relatively fl at between NOK1.5m in 2009 and NOK1.6m in 2013. Out of the
estimated 5,000 OFS job reductions announced in 2014, approximately 1,500 are expected to be in the M&M subsegment.
Top fi ve companies (2013 revenues)1. Aker Solutions MMO AS2. Bilfi nger Industrier Norge AS3. Beerenberg Corp. AS4. Kaefer Energy AS5. IKM Testing AS
Key financials
0%
5%
10%
15%
20%
25%
0
5
10
15
20
25
2009 2010 2011 2012 2013
Rev
enue
, NO
Kb
Revenue EBITDA ROCE
Offshore logistics Maintenance & Modification Production
ProductionCompanies in the subsegment offer services required in the production phase, such as waste handling, communications and services related to processing.
• The revenues for the subsegment have grown from 2009 to 2013 by 22.5%, with no change in the NOK12.3b subsegment aggregated revenue from 2012 to 2013.
• Profi tability as measured by EBITDA margin dropped from 22.5% in 2010 to 15.4% in 2011, and has since stabilized to around 14%. Other operating costs have driven this development, increasing from 17% of revenues in 2009 to 24% in 2012. In 2013 the rate dropped to 20%, but an increase in cost of goods made the EBITDA year-on-year growth less signifi cant.
• Personnel cost for this subsegment has been stable at an average of 32% of the revenue for the last decade. With a total of 4,778 employees, the subsegment has revenue per employee of NOK2.6m.
• The normalized ROCE has been stable at around 5% over the period from 2009 to 2013. The actual ROCE was negative in 2011 because of an extraordinary transaction write-off for one of the subsegment companies.
Top fi ve companies (2013 revenues)1. APL Norway AS2. Franzefoss Gjenvinning AS3. SAR AS4. Aker Contracting FP ASA5. Sodexo Mobile Units AS
Key financials
-5%
0%
5%
10%
15%
20%
25%
0
2
4
6
8
10
12
14
2009 2010 2011 2012 2013
Rev
enue
, NO
Kb
Revenue EBITDA ROCE
25The Norwegian oilfi eld services analysis 2014
Decommissioning market growth, but still in its infancy
Reservoir/seismic
Exploration and production drilling
Engineering, fabrication and
installationOperations Decom-
missioning
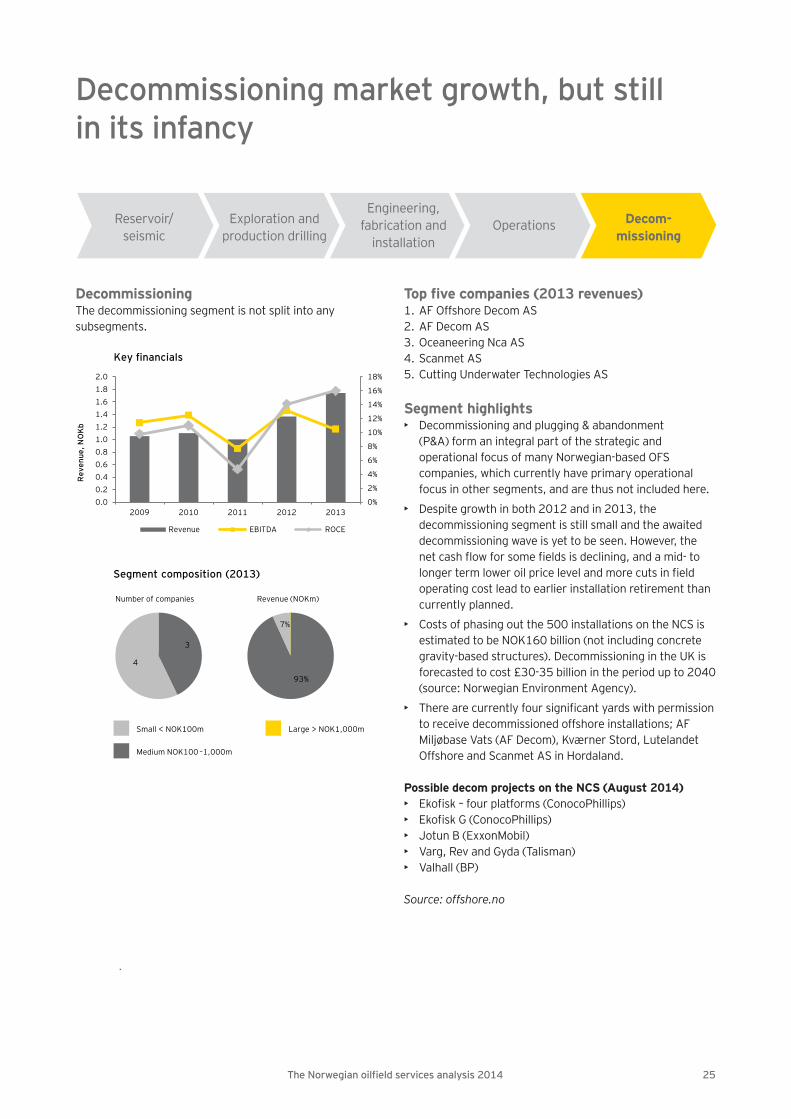
DecommissioningThe decommissioning segment is not split into any subsegments.
Top fi ve companies (2013 revenues)1. AF Offshore Decom AS2. AF Decom AS3. Oceaneering Nca AS4. Scanmet AS5. Cutting Underwater Technologies AS
Segment highlights• Decommissioning and plugging & abandonment
(P&A) form an integral part of the strategic and operational focus of many Norwegian-based OFS companies, which currently have primary operational focus in other segments, and are thus not included here.
• Despite growth in both 2012 and in 2013, the decommissioning segment is still small and the awaited decommissioning wave is yet to be seen. However, the net cash fl ow for some fi elds is declining, and a mid- to longer term lower oil price level and more cuts in fi eld operating cost lead to earlier installation retirement than currently planned.
• Costs of phasing out the 500 installations on the NCS is estimated to be NOK160 billion (not including concrete gravity-based structures). Decommissioning in the UK is forecasted to cost £30-35 billion in the period up to 2040 (source: Norwegian Environment Agency).
• There are currently four signifi cant yards with permission to receive decommissioned offshore installations; AF Miljøbase Vats (AF Decom), Kværner Stord, Lutelandet Offshore and Scanmet AS in Hordaland.
Possible decom projects on the NCS (August 2014)• Ekofi sk – four platforms (ConocoPhillips)• Ekofi sk G (ConocoPhillips)• Jotun B (ExxonMobil)• Varg, Rev and Gyda (Talisman)• Valhall (BP)
Source: offshore.no
Key financials
0%
2%
4%
6%
8%
10%
12%
14%
16%
18%
0.00.20.40.60.81.01.21.41.61.82.0
2009 2010 2011 2012 2013
Rev
enue
, NO
Kb
Revenue EBITDA ROCE
Segment composition (2013)
pie pie
Number of companies Revenue (NOKm)
93%
7%
3
4
Small < NOK100m Large > NOK1,000m
Medium NOK100 –1,000m

26 The Norwegian oilfi eld services analysis 2014
27The Norwegian oilfi eld services analysis 2014
Southern Norway remains the hub of Norwegian OFS activity
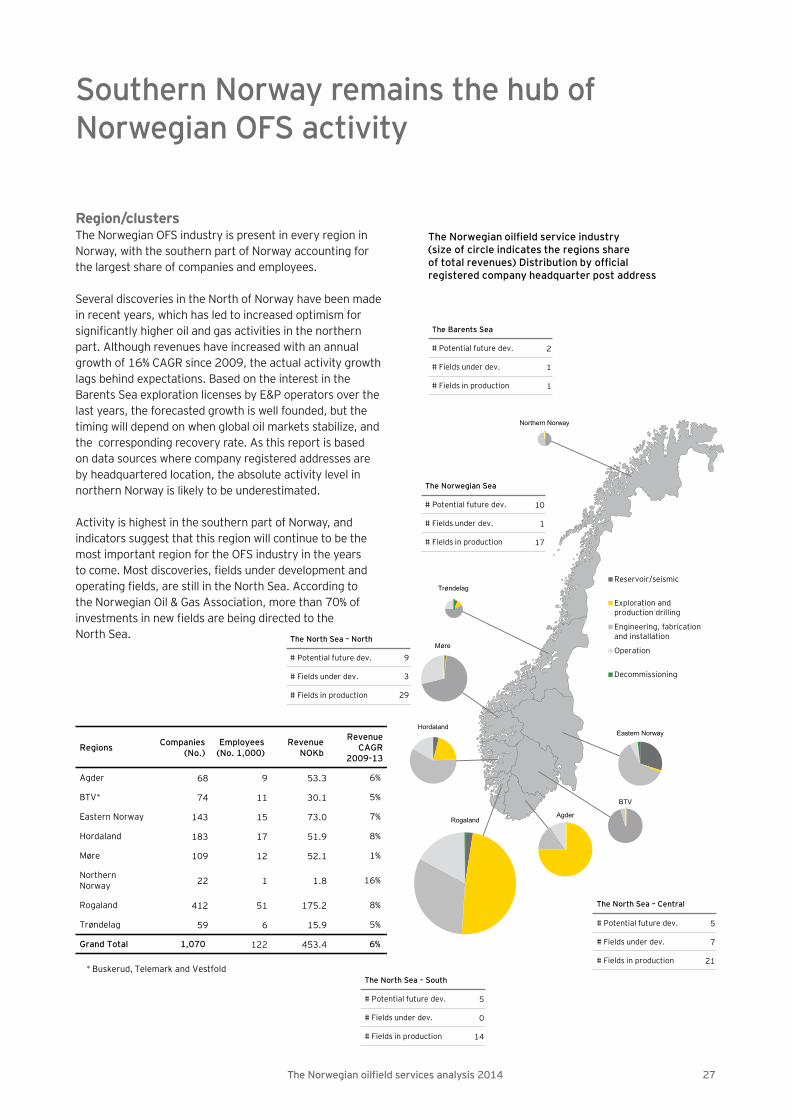
Region/clustersThe Norwegian OFS industry is present in every region in Norway, with the southern part of Norway accounting for the largest share of companies and employees.
Several discoveries in the North of Norway have been made in recent years, which has led to increased optimism for signifi cantly higher oil and gas activities in the northern part. Although revenues have increased with an annual growth of 16% CAGR since 2009, the actual activity growth lags behind expectations. Based on the interest in the Barents Sea exploration licenses by E&P operators over the last years, the forecasted growth is well founded, but the timing will depend on when global oil markets stabilize, and the corresponding recovery rate. As this report is based on data sources where company registered addresses are by headquartered location, the absolute activity level in northern Norway is likely to be underestimated.
Activity is highest in the southern part of Norway, and indicators suggest that this region will continue to be the most important region for the OFS industry in the years to come. Most discoveries, fi elds under development and operating fi elds, are still in the North Sea. According to the Norwegian Oil & Gas Association, more than 70% of investments in new fi elds are being directed to the North Sea.
Regions Companies (No.)
Employees (No. 1,000)
Revenue NOKb
Revenue CAGR
2009-13
Agder 68 9 53.3 6%
BTV* 74 11 30.1 5%
Eastern Norway 143 15 73.0 7%
Hordaland 183 17 51.9 8%
Møre 109 12 52.1 1%
Northern Norway 22 1 1.8 16%
Rogaland 412 51 175.2 8%
Trøndelag 59 6 15.9 5%
Grand Total 1,070 122 453.4 6%
* Buskerud, Telemark and Vestfold
Reservoir/seismic
Exploration andproduction drilling
Engineering, fabricationand installation
Operation
Decommissioning
The Norwegian oilfield service industry(size of circle indicates the regions share of total revenues) Distribution by official registered company headquarter post address
The Barents Sea
# Potential future dev. 2
# Fields under dev. 1
# Fields in production 1
The Norwegian Sea
# Potential future dev. 10
# Fields under dev. 1
# Fields in production 17
The North Sea – South
# Potential future dev. 5
# Fields under dev. 0
# Fields in production 14
The North Sea – North
# Potential future dev.
# Fields under dev.
# Fields in production
Northern Norway
Trøndelag
Møre
Hordaland
Rogaland
Eastern Norway
BTV
Agder
The North Sea – Central
# Potential future dev. 5
# Fields under dev. 7
# Fields in production 21
9
3
29
28 The Norwegian oilfi eld services analysis 2014
Activity going forward
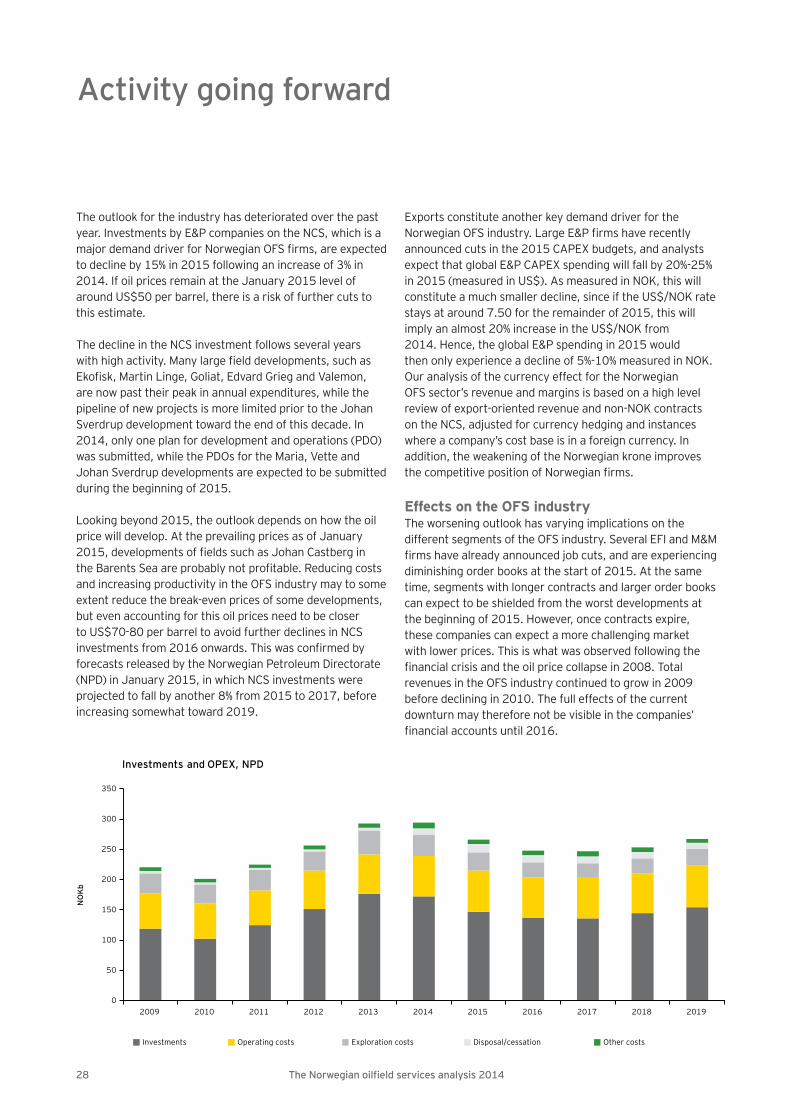
The outlook for the industry has deteriorated over the past year. Investments by E&P companies on the NCS, which is a major demand driver for Norwegian OFS fi rms, are expected to decline by 15% in 2015 following an increase of 3% in 2014. If oil prices remain at the January 2015 level of around US$50 per barrel, there is a risk of further cuts to this estimate.
The decline in the NCS investment follows several years with high activity. Many large fi eld developments, such as Ekofi sk, Martin Linge, Goliat, Edvard Grieg and Valemon, are now past their peak in annual expenditures, while the pipeline of new projects is more limited prior to the Johan Sverdrup development toward the end of this decade. In 2014, only one plan for development and operations (PDO) was submitted, while the PDOs for the Maria, Vette and Johan Sverdrup developments are expected to be submitted during the beginning of 2015.
Looking beyond 2015, the outlook depends on how the oil price will develop. At the prevailing prices as of January 2015, developments of fi elds such as Johan Castberg in the Barents Sea are probably not profi table. Reducing costs and increasing productivity in the OFS industry may to some extent reduce the break-even prices of some developments, but even accounting for this oil prices need to be closer to US$70-80 per barrel to avoid further declines in NCS investments from 2016 onwards. This was confi rmed by forecasts released by the Norwegian Petroleum Directorate (NPD) in January 2015, in which NCS investments were projected to fall by another 8% from 2015 to 2017, before increasing somewhat toward 2019.
Exports constitute another key demand driver for the Norwegian OFS industry. Large E&P fi rms have recently announced cuts in the 2015 CAPEX budgets, and analysts expect that global E&P CAPEX spending will fall by 20%-25% in 2015 (measured in US$). As measured in NOK, this will constitute a much smaller decline, since if the US$/NOK rate stays at around 7.50 for the remainder of 2015, this will imply an almost 20% increase in the US$/NOK from2014. Hence, the global E&P spending in 2015 wouldthen only experience a decline of 5%-10% measured in NOK. Our analysis of the currency effect for the NorwegianOFS sector’s revenue and margins is based on a high level review of export-oriented revenue and non-NOK contracts on the NCS, adjusted for currency hedging and instances where a company’s cost base is in a foreign currency. In addition, the weakening of the Norwegian krone improves the competitive position of Norwegian fi rms.
Effects on the OFS industryThe worsening outlook has varying implications on the different segments of the OFS industry. Several EFI and M&M fi rms have already announced job cuts, and are experiencing diminishing order books at the start of 2015. At the same time, segments with longer contracts and larger order books can expect to be shielded from the worst developments at the beginning of 2015. However, once contracts expire, these companies can expect a more challenging market with lower prices. This is what was observed following the fi nancial crisis and the oil price collapse in 2008. Total revenues in the OFS industry continued to grow in 2009 before declining in 2010. The full effects of the current downturn may therefore not be visible in the companies’ fi nancial accounts until 2016.
0
50
100
150
200
250
300
350
2009 2010 2011 2012 2013 2014 2015 2016 2017 2018 2019
NO
Kb
Investments Operating costs Exploration costs Disposal/cessation Other costs
Investments and OPEX, NPD

30 The Norwegian oilfi eld services analysis 2014
Sum of OFS segments• Based on available sources such as quarterly reporting
from listed OFS fi rms and expected relationships between macro variables and individual segments, we have made projections for the activity levels in the OFS industry in 2014 and 2015. These forecasts are uncertain, but our aim is to provide some guidance on key industry trends.
• Overall, we project a growth in total revenues of 4% in 2014 and a decline in 2015 of 7%. This is down from the 9% growth rate observed in 2012-13. 2014 thus appears to be a preliminary peak in total revenues.
Reservoir/seismic• Revenues in the segment have historically been
correlated with next year’s exploration expenses, which indicates that segment revenues declined in 2014 (based on expected 2015 exploration expenses). On the other hand, a large part of the segment revenues are generated from operations outside the North Sea, where operations in North America have been a high growth area.
• Aggregated, listed reservoir/seismic groups have delivered stable 2014 revenues, giving an indication of the overall segment performance.
• Combined, we expect a slight decline in aggregated segment revenues in 2014 and EBIT margins moving down from the high values seen in 2012-13, to a more normalized level slightly below 25%. The E&P spending cuts, as well as guidance from listed fi rms, indicate that revenues will decline in 2015.
E&P drilling• The number of E&P wells drilled on the NCS decreased from 225 in 2013 to 220 in 2014, as there were fi ve
fewer production wells being drilled in 2014 compared to 2013.
• Rig rates remained stable through 2014, mainly due to continued operations under contracts signed in previous years, as few new rigs were chartered during the year.
• The rig rates are generally considered to be under pressure. In recent months, several rigs have been sitting idle in quays along the coast. Rigs under construction will also add to supply over the coming years, whereas demand will at best remain mostly fl at. Still, three quarters of the currently active rigs on the NCS have contracts lasting throughout 2015. The contract prices are mainly denominated in US$, which means that 2015 revenues in this subsegment will obtain a boost from the weakening NOK. Still, there is a risk that the E&P companies will terminate contracts to cut drilling costs or renegotiate better terms, providing a downside risk to our 2015 revenue forecast.
• High global new-build activity for rigs has boosted revenues and backlog for rig equipment players.
The current strong rig order book supports revenue growth in the rig equipment subsegment for 2015. However, the outlook beyond 2015 seems less certain, as the rig new-build market is expected to experience order draught and current new-builds contracts and options could be canceled.
• We project a modest revenue growth for the segment in 2014, before revenues decline slightly in 2015. We expect margins to develop negatively in both years.
Engineering, fabrication and installation• We expect revenues in the segment to grow slightly
in 2014, before decreasing in 2015. The decline is strongest in NCS-exposed subsegments, such as yards, which could see revenues drop by as much as 30%. More export-oriented subsegments such as subsea will benefi t from the weakening currency that partly offsets falling global demand.
• Margins are expected to fall somewhat with lower activity. However, historical relationships suggest that EBITDA margins are not strongly correlated with activity levels, and we therefore do not forecast material decrease in profi tability.
Growth deteriorating and margin pressure in the OFS industry
31The Norwegian oilfi eld services analysis 2014
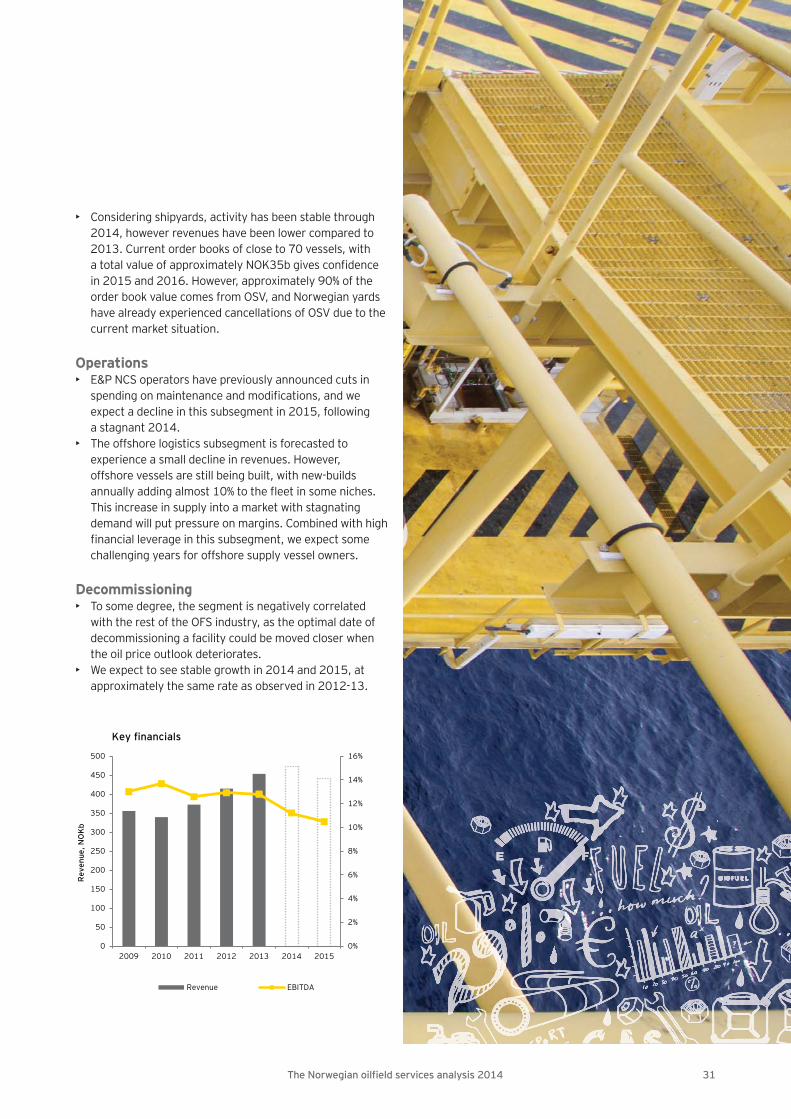
• Considering shipyards, activity has been stable through 2014, however revenues have been lower compared to
2013. Current order books of close to 70 vessels, with a total value of approximately NOK35b gives confi dence in 2015 and 2016. However, approximately 90% of the order book value comes from OSV, and Norwegian yards have already experienced cancellations of OSV due to the current market situation.
Operations• E&P NCS operators have previously announced cuts in
spending on maintenance and modifi cations, and we expect a decline in this subsegment in 2015, following a stagnant 2014.
• The offshore logistics subsegment is forecasted to experience a small decline in revenues. However, offshore vessels are still being built, with new-builds annually adding almost 10% to the fl eet in some niches. This increase in supply into a market with stagnating demand will put pressure on margins. Combined with high fi nancial leverage in this subsegment, we expect some challenging years for offshore supply vessel owners.
Decommissioning• To some degree, the segment is negatively correlated
with the rest of the OFS industry, as the optimal date of decommissioning a facility could be moved closer when the oil price outlook deteriorates.
• We expect to see stable growth in 2014 and 2015, at approximately the same rate as observed in 2012-13.
0%
2%
4%
6%
8%
10%
12%
14%
16%
0
50
100
150
200
250
300
350
400
450
500
2009 2010 2011 2012 2013 2014 2015
Rev
enue
, NO
Kb
Revenue EBITDA
Key financials

32 The Norwegian oilfi eld services analysis 2014
Accounting information is publicly available from the Brønnøysund Register Center. The companies’ business addresses as registered by the same register have been used to refl ect the entities’ geographic location. The number of companies included in the analysis will vary somewhat due to lack of available fi nancial information.
We have used the stand-alone fi nancial statements for each legal entity to obtain the information used in our analysis. As a result, large corporations have been analyzed as a series of individual companies and not as a consolidated group, in order to get a more detailed demographic view with regards to location and activities across the supply chain. Intercompany transactions are not eliminated when fi nancial fi gures are aggregated. In addition, the revenues of subsidiaries owned by a Norwegian holding company, but registered abroad, are not captured. A limited number of annual reports were not made available by the time this report was prepared, in which case 2013 fi gures have been modeled based on previous year.
A company is defi ned as a Norwegian OFS company if:• At least 50% of its turnover is generated in the
oil and gas sector.• It is a Norwegian registered company.
CategorizationEach company in the OFS portfolio has been reviewed individually, and an assessment has been made with regard to the company position in the value and supply chain.
The value chain has the following categories:• Reservoir/seismic• E&P drilling• Engineering, fabrication and installation • Operations • Decommissioning
Each of these categories is further broken down into subsegments to capture the huge diversity in the industry.
Companies have been categorized according to the value chain segment in which they generate the majority of their revenues.
LocationThe regions used in the analysis have been chosen to refl ect and illustrate the main clusters of OFS companies in Norway. The regions are:• Rogaland• Hordaland• Agder• Møre (Møre og Romsdal and Sogn og Fjordane)• BTV (Buskerud, Telemark and Vestfold)• Trøndelag (Sør- and Nord Trøndelag)• Northern Norway (Nordland, Troms and Finnmark)• Eastern Norway (Oslo, Akershus, Oppland, Østfold and
Hedmark)
Calculations• EBIT = pre-tax operating profi t• Capital employed = total assets – fi nancial long-term
investments – (trade creditors + tax payable + public duties payable)
• ROCE (Return on Capital Employed) = EBIT/capital employed
• Cash-conversion-cycle: CCC = DIO + DSO – DPO• DIO and DPO calculated by use of COGS, DSO by
use of sales
Methodology
2014ld seian oorweghe No vices analysis
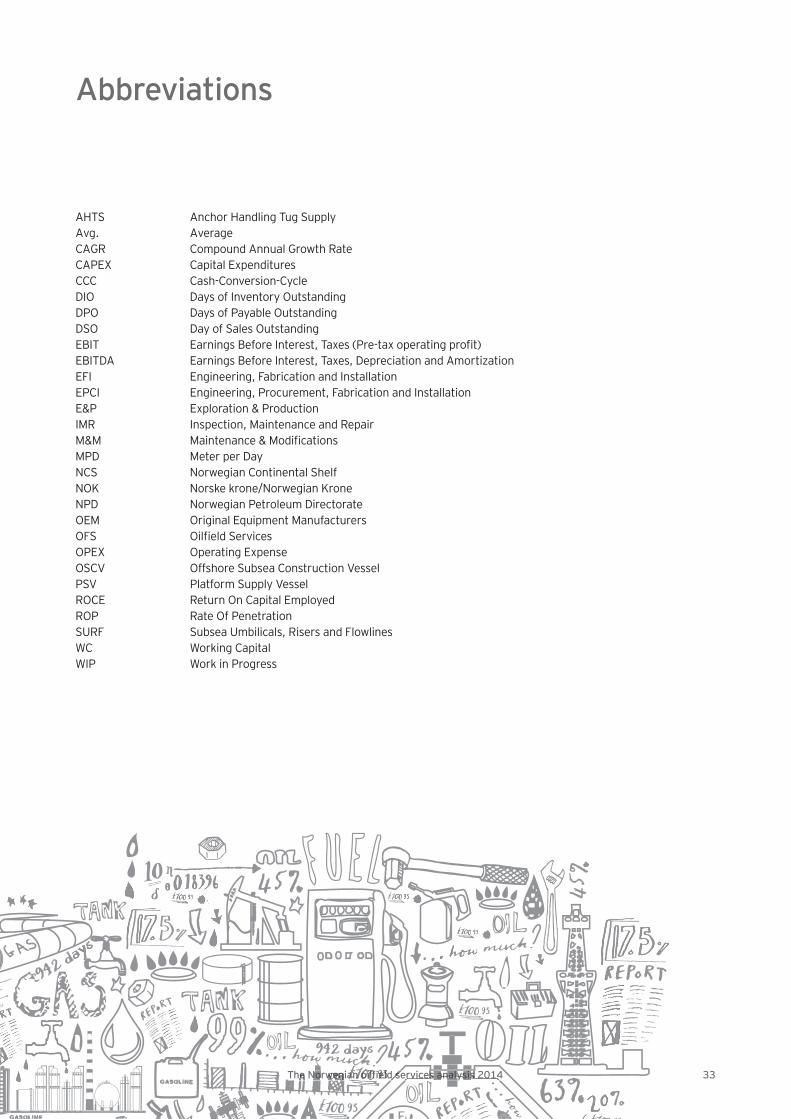
33The Norwegian oilfi eld services analysis 2014
Abbreviations
AHTS Anchor Handling Tug SupplyAvg. Average CAGR Compound Annual Growth RateCAPEX Capital ExpendituresCCC Cash-Conversion-CycleDIO Days of Inventory OutstandingDPO Days of Payable OutstandingDSO Day of Sales Outstanding EBIT Earnings Before Interest, Taxes (Pre-tax operating profi t) EBITDA Earnings Before Interest, Taxes, Depreciation and AmortizationEFI Engineering, Fabrication and InstallationEPCI Engineering, Procurement, Fabrication and InstallationE&P Exploration & ProductionIMR Inspection, Maintenance and RepairM&M Maintenance & Modifi cationsMPD Meter per DayNCS Norwegian Continental ShelfNOK Norske krone/Norwegian KroneNPD Norwegian Petroleum DirectorateOEM Original Equipment Manufacturers OFS Oilfi eld ServicesOPEX Operating ExpenseOSCV Offshore Subsea Construction VesselPSV Platform Supply VesselROCE Return On Capital EmployedROP Rate Of Penetration SURF Subsea Umbilicals, Risers and FlowlinesWC Working CapitalWIP Work in Progress
The Norweg nalynalys a sisd services analysis 2014
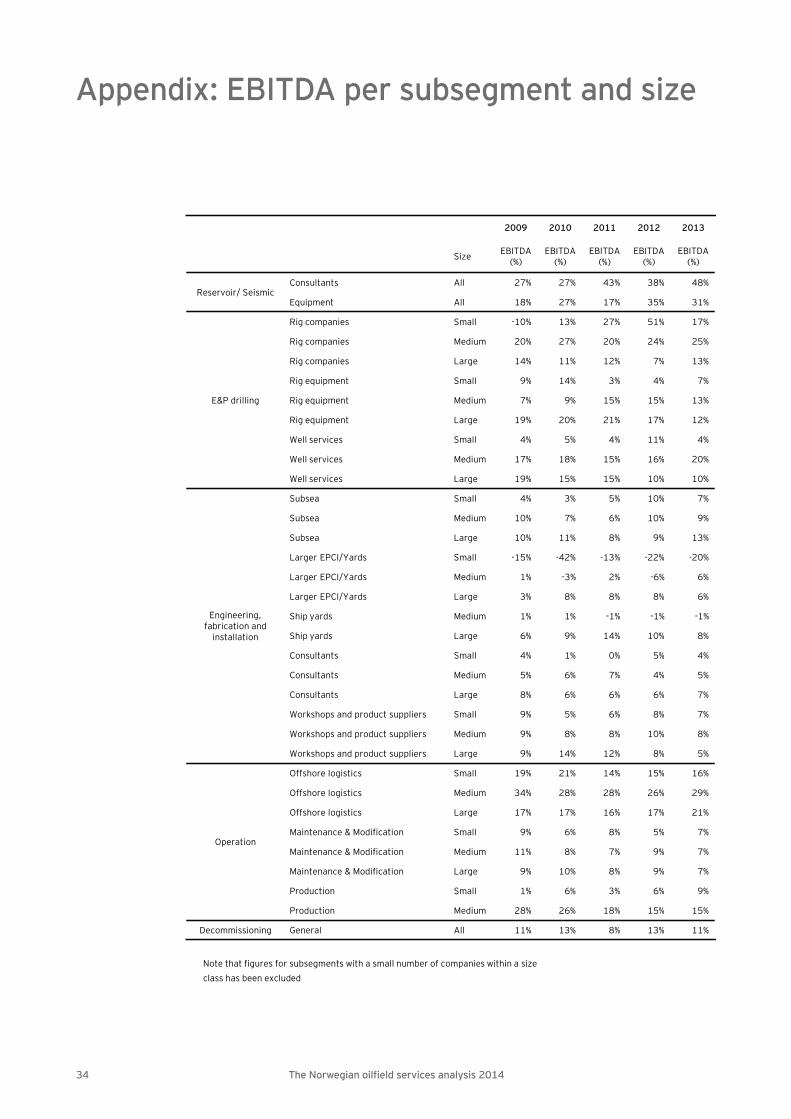
34 The Norwegian oilfi eld services analysis 2014
Appendix: EBITDA per subsegment and size
2009 2010 2011 2012 2013
Size EBITDA (%)
EBITDA (%)
EBITDA (%)
EBITDA (%)
EBITDA (%)
Reservoir/ SeismicConsultants All 27% 27% 43% 38% 48%
Equipment All 18% 27% 17% 35% 31%
E&P drilling
Rig companies Small -10% 13% 27% 51% 17%
Rig companies Medium 20% 27% 20% 24% 25%
Rig companies Large 14% 11% 12% 7% 13%
Rig equipment Small 9% 14% 3% 4% 7%
Rig equipment Medium 7% 9% 15% 15% 13%
Rig equipment Large 19% 20% 21% 17% 12%
Well services Small 4% 5% 4% 11% 4%
Well services Medium 17% 18% 15% 16% 20%
Well services Large 19% 15% 15% 10% 10%
Engineering, fabrication and
installation
Subsea Small 4% 3% 5% 10% 7%
Subsea Medium 10% 7% 6% 10% 9%
Subsea Large 10% 11% 8% 9% 13%
Larger EPCI/Yards Small -15% -42% -13% -22% -20%
Larger EPCI/Yards Medium 1% -3% 2% -6% 6%
Larger EPCI/Yards Large 3% 8% 8% 8% 6%
Ship yards Medium 1% 1% -1% -1% -1%
Ship yards Large 6% 9% 14% 10% 8%
Consultants Small 4% 1% 0% 5% 4%
Consultants Medium 5% 6% 7% 4% 5%
Consultants Large 8% 6% 6% 6% 7%
Workshops and product suppliers Small 9% 5% 6% 8% 7%
Workshops and product suppliers Medium 9% 8% 8% 10% 8%
Workshops and product suppliers Large 9% 14% 12% 8% 5%
Operation
Offshore logistics Small 19% 21% 14% 15% 16%
Offshore logistics Medium 34% 28% 28% 26% 29%
Offshore logistics Large 17% 17% 16% 17% 21%
Maintenance & Modification Small 9% 6% 8% 5% 7%
Maintenance & Modification Medium 11% 8% 7% 9% 7%
Maintenance & Modification Large 9% 10% 8% 9% 7%
Production Small 1% 6% 3% 6% 9%
Production Medium 28% 26% 18% 15% 15%
Decommissioning General All 11% 13% 8% 13% 11%
Note that figures for subsegments with a small number of companies within a size class has been excluded
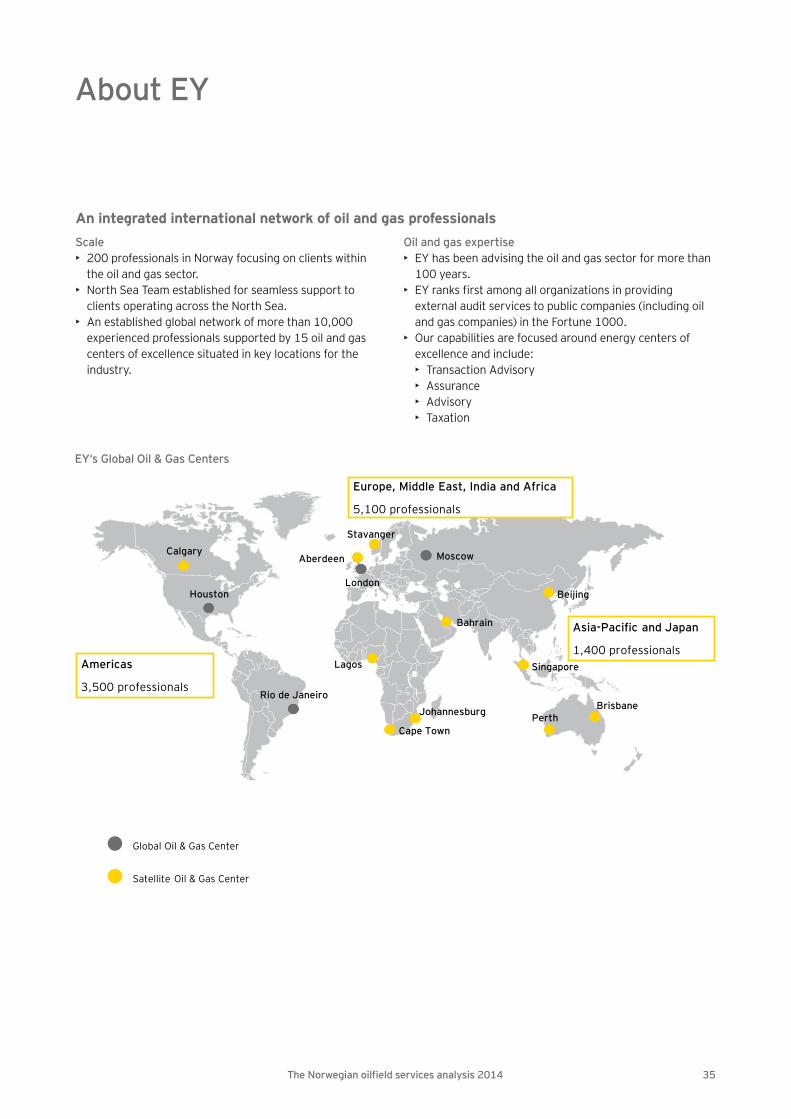
35The Norwegian oilfi eld services analysis 2014
Scale• 200 professionals in Norway focusing on clients within
the oil and gas sector.• North Sea Team established for seamless support to
clients operating across the North Sea.• An established global network of more than 10,000
experienced professionals supported by 15 oil and gas centers of excellence situated in key locations for the industry.
Oil and gas expertise• EY has been advising the oil and gas sector for more than
100 years.• EY ranks fi rst among all organizations in providing
external audit services to public companies (including oil and gas companies) in the Fortune 1000.
• Our capabilities are focused around energy centers of excellence and include:• Transaction Advisory• Assurance • Advisory• Taxation
Global Oil & Gas Center
Satellite Oil & Gas Center
Calgary
Houston
Rio de Janeiro
Cape TownPerth
Singapore
London
Stavanger
Aberdeen Moscow
Bahrain
Beijing
Americas
3,500 professionals
Europe, Middle East, India and Africa
5,100 professionals
Asia-Pacific and Japan
1,400 professionalsLagos
Johannesburg Brisbane
EY‘s Global Oil & Gas Centers
About EY
An integrated international network of oil and gas professionals
36 The Norwegian oilfi eld services analysis 2014
Fuelling the next generation: A study of the UK upstream oil and gas workforceAs part of the Oil & Gas Industrial Strategy, EY was commissioned by Oil & Gas UK, OPITO and BIS, to produce a report identifying the current workforce profi le and the employment disciplines that will be in greatest demand over the next two to fi ve years.
Spotlight on oil and gas megaprojects Spotlight on Megaprojects kicks off a series that explores capital projects in the oil and gas industry. We researched the performance of 365 oil and gas megaprojects and found that 64% are facing cost overruns and 73% are reporting schedule delays. Take a closer look at why this happens and what we can do to help.
Global oil and gas tax guide 2014The Global oil and gas tax guide summarizes the oil and gas corporate tax regimes in 74 countries and also provides a directory of EY Oil & Gas tax contacts. Our guide can help our clients implement local legislation, which varies greatly from general corporate tax regimes.
Navigating geopolitics in oil and gasGeopolitics is a central concern for the oil and gas sector and can be viewed as a source of both risk and opportunity. The trend toward more nationalistic and assertive political behavior indicates global instability is on the rise. So it is no coincidence that one of the top risks facing oil and gas companies, as identifi ed by EY in our most recent risk study, was geopolitics.
Thought leadership
EY’s Global Oil & Gas Center keeps you updated with monthly thought leadership publications, exploring the latest developments within the sector. Our deep industry knowledge can help you anticipate trends, manage regulatory changes, drive down costs and compete more effectively.
Global oil and gas reserves studyThe Global oil and gas reserves study is a compilation and analysis of certain oil and gas reserve disclosure information as reported by companies in their annual reports fi led with the United States (US) Securities and Exchange Commission (SEC) or in their publicly available annual reports.
Global oil and gas capital confi dence barometer EY’s Capital Confi dence Barometer is a regular survey of senior executives from oil and companies around the world conducted by the Economist Intelligence Unit (EIU). This snapshot of our fi ndings gauges corporate confi dence in the economic outlook and identifi es boardroom trends and practices in the way companies manage their capital agenda.
African oil and gas: drivingsustainable growthAfrica is on an upward growth curve, and Africa’s growth is both real and sustainable. Its growth is underpinned by a longer term process of social, political and economic reform that has occurred across much of the continent since the end of the Cold War and the Apartheid era; a period during which regulatory and legal systems strengthened, and many African economies opened up to international trade and investment. Competing in the global LNG marketThere’s no denying Canada’s potential in the global LNG market, but success for players won’t come easily. See which factors will determine their competitiveness.
37The Norwegian oilfi eld services analysis 2014
38 The Norwegian oilfi eld services analysis 2014
Transaction Advisory ServicesEspen NorheimPartnerMobile: +47 928 02 095Email: [email protected]
Transaction Advisory ServicesKjell StenersenPartnerMobile: +47 982 06 678 Email: [email protected]
AdvisoryJohn AvaldsnesPartnerMobile: +47 992 16 744 Email: [email protected]
AssuranceTor Inge SkjellevikPartnerMobile: +47 982 06 676Email: [email protected]
TaxHans Georg WillePartnerMobile: +47 908 45 931Email: [email protected]
Oil, Gas & Energy sectorFinn Kinserdal PartnerMobile: +47 907 98 779Email: fi [email protected]
Contacts
Stay up-to-date with EY oil & gas insights:
You can join our group on LinkedIn™ at:Ernst & Young Global Oil & Gas Center
Follow us on Twitter:@EY_OilGas
Get the app:EY Insights
Sign up for email alerts:ey.com/oilandgas
EY | Assurance | Tax | Transactions | Advisory
About EYEY is a global leader in assurance, tax, transaction and advisory services. The insights and quality services we deliver help build trust and confi dence in the capital markets and in economies the world over. We develop outstanding leaders who team to deliver on our promises to all of our stakeholders. In so doing, we play a critical role in building a better working world for our people, for our clients and for our communities.
EY refers to the global organization, and may refer to one or more, of the member fi rms of Ernst & Young Global Limited, each of which is a separate legal entity. Ernst & Young Global Limited, a UK company limited by guarantee, does not provide services to clients. For more information about our organization, please visit ey.com.
How EY’s Global Oil & Gas Center can help your businessThe oil and gas sector is constantly changing. Increasingly uncertain energy policies, geopolitical complexities, cost management and climate change all present signifi cant challenges. EY’s Global Oil & Gas Center supports a global network of more than 10,000 oil and gas professionals with extensive experience in providing assurance, tax, transaction and advisory services across the upstream, midstream, downstream and oilfi eld service subsectors. The Center works to anticipate market trends, execute the mobility of our global resources and articulate points of view on relevant key sector issues. With our deep sector focus, we can help your organization drive down costs and compete more effectively.
© 2015 EYGM LimitedAll rights reserved
EYG no. DW0475ED None
This material has been prepared for general informational purposes only and is not intended to be relied upon as accounting, tax, or other professional advice. Please refer to your advisors for specifi c advice.
ey.com
Photos: ThinkstockPage 1: Photographer: Digital Vision, Collection: Digital VisionPage 2: Photographer: StewartBurnett, Collection: iStock/ThinkstockPage 4: Photographer: bomboman, Collection: iStock/ThinkstockPage 6/7: Photographer: curraheeshutter, Collection: iStock/ThinkstockPage 10: Photographer: curraheeshutter, Collection: iStock/ThinkstockPage 26: Photographer: Yarygin, Collection: iStock/ThinkstockPage 29: Photographer: bomboman, Collection: iStock/ThinkstockPage 30/31: Photographer: curraheeshutter, Collection: iStock/ThinkstockPage 37: Photographer: claffra, Collection: iStock/ThinkstockPage 38/39: Photographer: curraheeshutter, Collection: iStock/Thinkstock


![West Contra Costa Unified School District · ELD 2A ELD 2B ELD 3A ELD 3B ELD 4 [P] Eng/Read(R180) English 1 [P] English 2 [P] ... English/Reading Ensemble [P] Environmental Science](https://img.pdfslide.net/doc/110x75/5ed3ab4e89ea24219c3ce538/west-contra-costa-unified-school-district-eld-2a-eld-2b-eld-3a-eld-3b-eld-4-p.jpg)