Embed Size (px)
Citation preview

llPROTECTED 関係者外秘
The number of cyclesFor OICA and Jan, 2021 TF1meeting,
December 14, 2020 1/6The number of cycles
Japan Automobile Manufacturers Association Japan Automobile Research Institute

llPROTECTED 関係者外秘
Table of contents
1. Back ground
2. Research result of “the number of cycles”
3. Proposal
4. Appendix
December 14, 2020 2/6The number of cycles

llPROTECTED 関係者外秘
1. Back ground
The number of cycle of GTR no.13 was based on estimation.The estimation was 2 full feelings per day for an entire service life of 15 years of
taxi usage.
But it is known that taxi has limited service life(ex. 5-7years).
December 14, 2020 The number of cycles 3
Definition of HDV58 agreement : over 3.5ton at GVMUS・CA : 10000lb(4.5ton) at GVM
Region Source Max svc. life Estimated extreme lifetime range Corresponding Number of Cycles
CA/US Scraped vehicles*1 N.A. 560,000 km 1,200 - 1,800
BC/Canada Emission testing*1 N.A. 800,000 - 1,000,000 km 1,650 - 3,100
NYC/US Taxis 5 years (72,000 km/week) 2,750 - 3,600
Toronto, Ottawa/Canada Taxis 7 years 1,400,000 – 1,900,000 km 2,900 - 6,000
Table1. Rational of the number of pressure cycles of GTR no.13 phase1
*1 incl. Taxis
It was agreed that 25yeas of service life is needed for HDV

llPROTECTED 関係者外秘
2. Research result of Number of cycles
Research vehicle ODD data of public agency in Germany, Japan and US.Calculate annual vehicle mileage from public ODD data.
Estimate extreme life time range by annual vehicle mileage.
Estimate corresponding number of cycles by using “320km” per fill.
December 14, 2020 The number of cycles 4
Region Source Annual vehicle mileage Service life Estimated extreme lifetime range Corresponding Number of Cycles*1
Japan MLITTBD 20 yrs 3,800,000 km 12,000
TBD 25 yrs 4,400,000 km 14,000
Germany VDATBD 20 yrs 2,300,000 km 7,200
TBD 25 yrs 2,900,000 km 9,000
US NHTSATBD 20 yrs 4,200,000 km 10,400
TBD 25 yrs 5,200,000 km 16,250
*1 fill/320km, *2cate gory 1-1, include taxis
Table2. Result for HDV
Region Source Annual vehicle mileage Service life Estimated extreme lifetime range Corresponding Number of Cycles*1
Japan MLIT TBD 25 yrs 1,900,000 km 5,900
Table3. Result for LDV

llPROTECTED 関係者外秘
“the number of cycles” at service life of 25 year is following.The result was differ from each region so it should be set by each Contracting
Party as previous GTR.
The result was completely differ from vehicle type so it shall be changed by vehicle type.
Japanese data shows below 6,000cycles for 25 years for LDV. So we set the number of cycles to 5,500/7,500/11,000 by considering with GTR phase1 value.
Data shows 9,000/14,000/17,000 cycles for Germany, Japanese and US for 25 years of HDV. So we set the number of cycles with corresponding to it.
Vehicle type The number of cycles
LDV 5,500/7,500/11,000
HDV 9,000/14,000/17,000
3. Proposal
December 14, 2020 The number of cycles 5
Table4. Vehicle type and proposal of “the number of cycles”

llPROTECTED 関係者外秘
5.1. Compressed hydrogen storage system
(omit)
All new compressed hydrogen storage systems produced for on-road vehicle service shall have a NWP of 70 MPa or less and a service life of 15 25
years or less, and be capable of satisfying the requirements of paragraph 5.1.
Vehicle type The number of cycles Test cycles
LDV 5,500/7,500/11,000 22,000
HDV 9,000/14,000/17,000 34,000
5.1.1.2. Baseline initial pressure cycle life
Three (3) new containers randomly selected from the design qualification batch are hydraulically pressure cycled at 20(±5)°C to 125 per cent
NWP without rupture for specified number of test cycles or until a leak occurs (para. 6.2.2.2. test procedure). Leakage shall not occur within a
number of Cycles, where the number of Cycles is set individually by each Contracting Party at 5,500, 7,500 or 11,000 cycles for a 15-year service
life.. Table xxx shows the number of cycles and test cycles for corresponding vehicle type.
Table xxx The number of cycles and Test cycles
3. Proposal (Continued)
• Example of draft is following.
December 14, 2020 The number of cycles 6

llPROTECTED 関係者外秘
APPENDIX
December 14, 2020 7The number of cycles

llPROTECTED 関係者外秘
0
5,000
10,000
15,000
20,000
25,000
30,000
0 5 10 15 20 25 30 35 40
# fills
Years in Service
Cumulative Fills vs Year
NGV2 750/yr NGV2 or Raw VMT Raw VMT Surv VMT UPS
Cumulative Fills with Varying VMT Assumptions
Comparison of Cumulative Refueling Instances Using Different VMT Assumptions
Most aggressive
Least aggressive
VMT assumptions 15 yr 20 yr 25 yr
NGV2 (750 fills/yr) 11,250 15,000 18,750
NGV2 or Raw VMT 11,068 13,744 16,168
UPS 7,800 10,400 13,000
Raw VMT (unadj. for surv.) 6,288 8,001 9,552
Survivability VMT 5,578 6,556 7,167
Note:• Assumes range of 250 miles/fill• VMT data from Class 8 trucks• “NGV2 750/yr” – Assumes constant 750 fill/year• “NGV2 or Raw VMT” – Uses 750 fill/yr (more aggressive) when > 250
mi/day (1 refuel/day). Adjusted down to Raw VMT when < 1 refuel/day (250 miles/day)
• “Raw VMT” – VMT decrease by year but not adjusted for survivability• “Surv VMT” – VMT adjusted for survivability factor• “UPS” – In-use experience for CNG HDV. 130K mi/year, 250 mi range.
15 yr data actual. 20 & 25 yr extrapolated.
GTR13: 22,000 cycles
Source: UPS via NHTSA, Surv VMT (NHTSA)December 14, 2020 8The number of cycles

llPROTECTED 関係者外秘
Impact of Survivability Factor on VMT
For Class 8 vehicles (33K+ lbs). Assumes NHTSA survivability factor and FCV VMT of 120,000 for 1st year
0
20,000
40,000
60,000
80,000
100,000
120,000
140,000
0 5 10 15 20 25 30 35 40
VMT/year
Years in Service
Raw VMT
Survivability VMT
+47%
+102%
+206%
Survivability factor impacts VMT estimates significantly
Source: NHTSA
December 14, 2020 9The number of cycles

Daimler
AG
llPROTECTED 関係者外秘
There is no increase in pressure cycles based on average mileage of heavy-duty vehicles over their service life expectancy of 20-25 years.
Average km / year1 total mileage after # cycles after
20 years 25 years 20 years 25 years2014 115,017 2,300,340 2,875,425 6,390 7,987 2015 111,656 2,233,120 2,791,400 6,203 7,754 2016 108,387 2,167,740 2,709,675 6,022 7,527 2017 105,758 2,115,160 2,643,950 5,875 7,344 2018 103,101 2,062,020 2,577,525 5,728 7,160
Assuming a steady average mileage for hdv (based on semi-
trailer truck numbers of the most recent 5 years). The average
working hours of a European truck driver per day is 92. The
maximum speed on German highways for trucks is 80 km/h.
Considering a conservative range of 500 km for a fully fuelled
hydrogen truck this would result in approx. 1.5 fuelling cycles a
day with a total range of 720 km. GTR 13 Phase 1 did not
consider partial fuelling. Therefore the number was rounded to
2. Based on this the number of fuelling cycles over the service
life of 20 and 25 years would be calculated as follows:
20 years * average annual mileage / 720 km * 2
25 years * average annual mileage / 720 km * 21 For simplification purposes the number for vehicles up to 3 years old were used and multiplied with the expected lifetime.
See also https://www.kba.de/DE/Statistik/Kraftverkehr/VerkehrKilometer/verkehr_in_kilometern_node.html2 https://ec.europa.eu/transport/modes/road/social_provisions/driving_time_en
-
1,000
2,000
3,000
4,000
5,000
6,000
7,000
8,000
9,000
2014 2015 2016 2017 2018
fuelling cycles after 20 or 25 years
20 years 25 years
10The number of cycles

Daimler
AG
llPROTECTED 関係者外秘
There is no increase in pressure cycles based on average mileage of heavy-duty vehicles over their service life expectancy of 20-25 years.
Using the average mileage over the life-time of hdv (based on
semi-trailer truck numbers over 20 years). The average working
hours of a European truck driver per day is 92. The maximum
speed on German highways for trucks is 80 km/h. Considering a
conservative range of 500 km for a fully fuelled hydrogen truck
this would result in approx. 1.5 fuelling cycles a day with a total
range of 720 km. GTR 13 Phase 1 did not consider partial
fuelling. Therefore the number was rounded to 2. Based on this
the number of fuelling cycles over the service life of 20 and 25
years would be calculated as follows:
20 years * average annual mileage / 720 km * 2
25 years * average annual mileage / 720 km * 21 See also https://www.kba.de/DE/Statistik/Kraftverkehr/VerkehrKilometer/verkehr_in_kilometern_node.html2 https://ec.europa.eu/transport/modes/road/social_provisions/driving_time_en
Average of annualkm over life-time
1 total mileage after # cycles after
20 years 25 years 20 years 25 years
2014 73,775 1,475,500 1,844,375 4,099 5,123 2015 77,817 1,556,340 1,945,425 4,323 5,404 2016 79,112 1,582,240 1,977,800 4,395 5,494 2017 78,438 1,568,760 1,960,950 4,358 5,447 2018 77,019 1,540,380 1,925,475 4,279 5,349
-
1,000
2,000
3,000
4,000
5,000
6,000
2014 2015 2016 2017 2018
fuelling cycles after 20 or 25 years
# cycles after 20 years # cycles after 25 years
11The number of cycles

Daimler
AG
llPROTECTED 関係者外秘
Overall
27,484 25,999 25,505 24,576 24,612
52,54455,560 54,691 55,447
51,392
115,017111,656
108,387105,758
103,101
0
20,000
40,000
60,000
80,000
100,000
120,000
140,000
2 0 1 4 2 0 1 5 2 0 1 6 2 0 1 7 2 0 1 8
AVERAGE MILEAGE PER YEAR IN KM VEHICLE 0-3 YEARS OLD
trucks 3.5 to7.5 tons trucks with more than 7.5 tons semi-trailer tractor
12The number of cycles

Daimler
AG
llPROTECTED 関係者外秘
Overall
25,841 26,12324,196 23,051 22,675
48,174 47,85944,351
41,713
46,337
105,249 106,245104,062
101,93899,179
0
20,000
40,000
60,000
80,000
100,000
120,000
2 0 1 4 2 0 1 5 2 0 1 6 2 0 1 7 2 0 1 8
AVERAGE MILEAGE PER YEAR IN KM VEHICLE 4-5 YEARS OLD
trucks 3.5 to7.5 tons trucks with more than 7.5 tons semi-trailer tractor
13The number of cycles

Daimler
AG
llPROTECTED 関係者外秘
Overall
23,361 22,760 22,644 22,517 21,126
47,256
42,00438,643 38,780
36,267
93,05391,468 91,262
92,93290,625
0
10,000
20,000
30,000
40,000
50,000
60,000
70,000
80,000
90,000
100,000
2 0 1 4 2 0 1 5 2 0 1 6 2 0 1 7 2 0 1 8
AVERAGE MILEAGE PER YEAR IN KM VEHICLE 6-7 YEARS OLD
trucks 3.5 to7.5 tons trucks with more than 7.5 tons semi-trailer tractor
14The number of cycles

Daimler
AG
llPROTECTED 関係者外秘
Overall
22,393 21,500 20,676 19,950 19,662
41,203 42,275
37,899
32,73630,357
72,858
79,908 78,90575,760 75,374
0
10,000
20,000
30,000
40,000
50,000
60,000
70,000
80,000
90,000
2 0 1 4 2 0 1 5 2 0 1 6 2 0 1 7 2 0 1 8
AVERAGE MILEAGE PER YEAR IN KM VEHICLE 8-9 YEARS OLD
trucks 3.5 to7.5 tons trucks with more than 7.5 tons semi-trailer tractor
15The number of cycles

Daimler
AG
llPROTECTED 関係者外秘
Overall
14,475 15,108 15,450 15,428 15,446
25,97727,576 28,503 28,489
27,213
45,160
53,272
57,764 58,189 57,415
0
10,000
20,000
30,000
40,000
50,000
60,000
70,000
2 0 1 4 2 0 1 5 2 0 1 6 2 0 1 7 2 0 1 8
AVERAGE MILEAGE PER YEAR IN KM VEHICLE 10-19 YEARS OLD
trucks 3.5 to7.5 tons trucks with more than 7.5 tons semi-trailer tractor
16The number of cycles
Daimler
AG
llPROTECTED 関係者外秘
Overall
7,422 7,297 7,255 7,152 7,093
11,901 11,742 11,403 11,131 10,996
21,516 21,75122,593 22,579
23,470
0
5,000
10,000
15,000
20,000
25,000
2 0 1 4 2 0 1 5 2 0 1 6 2 0 1 7 2 0 1 8
AVERAGE MILEAGE PER YEAR IN KM VEHICLE 20 YEARS OLD AND OVER
trucks 3.5 to7.5 tons trucks with more than 7.5 tons semi-trailer tractor
17The number of cycles

Daimler
AG
llPROTECTED 関係者外秘
Semi-trailer tractors
0
20,000
40,000
60,000
80,000
100,000
120,000
140,000
1 2 3 4 5 6 7 8 9 10 11 12 13 14 15 16 17 18 19 20
MIL
EA
GE
VEHICLE AGE
AVERAGE MILEAGE PER YEAR IN KM
2014 2015 2016 2017 2018
18The number of cycles

Daimler
AG
llPROTECTED 関係者外秘
Trucks 3.5 to 7.5 tons
0
5,000
10,000
15,000
20,000
25,000
30,000
1 2 3 4 5 6 7 8 9 10 11 12 13 14 15 16 17 18 19 20
MIL
EA
GE
VEHICLE AGE
AVERAGE MILEAGE PER YEAR IN KM
2014 2015 2016 2017 2018
19The number of cycles

Daimler
AG
llPROTECTED 関係者外秘
Trucks over 7 tons
0
10,000
20,000
30,000
40,000
50,000
60,000
1 2 3 4 5 6 7 8 9 10 11 12 13 14 15 16 17 18 19 20
MIL
EA
GE
VEHICLE AGE
AVERAGE MILEAGE PER YEAR IN KM2014 2015 2016 2017 2018
20The number of cycles
llPROTECTED 関係者外秘
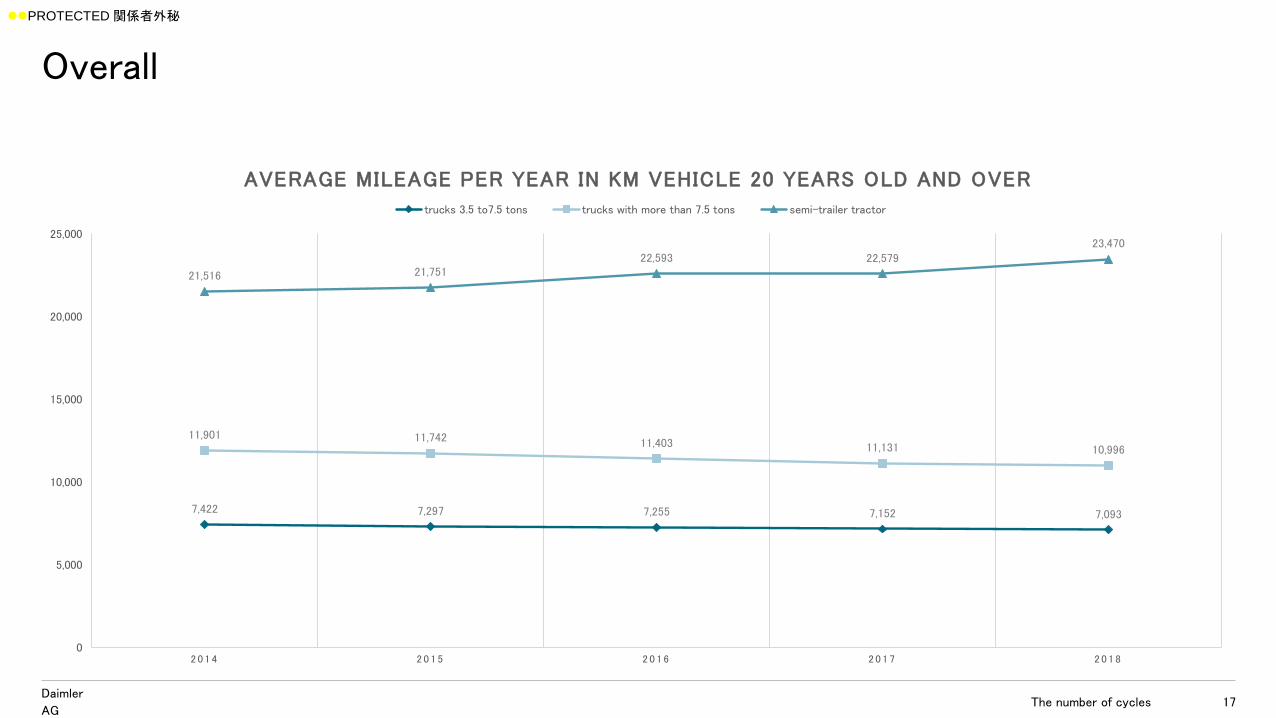
Japan Data : Commercial vehicles
Source: Legal inspection of July 2019 / 392x103 data (except motor cycles )• Personal use / 363x103 data• Commercial use / 28x103 data
Personal use
Survivla rate15%@15yrs<7%@20yrs<2%@25yrs<
Vehcle age (yrs)
Nu
mb
er
of
veh
icle
s
Survivla rate11%@15yrs<3%@20yrs<0.3%@25yrs<
Commercial use
Vehcle age (yrs)N
um
ber
of
veh
icle
s
Fluctuating because of 2yrs interval of the legal inspection for personal cars.
December 14, 2020 21The number of cycles

llPROTECTED 関係者外秘
Histograms of VMT (km/yr)
Vehicle age: 5yrs Vehicle age: 5yrs
VMT (km/yr) Root VMT (km/yr)
Nu
mb
er
of
data
Nu
mb
er
of
data
Commercial vehicles Commercial vehicles
The figure of “Root VMT” looks normal distribution.
December 14, 2020 22The number of cycles

llPROTECTED 関係者外秘
Preliminary
Annual mileage traveled (Commercial)
Veh age (yr)
Summary
Estimation of worst case VMT for vehicle life(1) Sum of (average of annual VMT+3s) (3s)(2) Apply (1) using square root values of
the annual mileages. (R3s)(3) Longest annual VMT x Yrs (AveMax)
x1000km
Ave+3s (3s)
R(Ave+3s) (R3s)
AveMax x Yr(AveMax)
15years 2,481 3,104 1,254
20years 3,058 3,819 1,672
25years 3,581 4,433 2,090
Fills / 320km 11,191 13,853 6,531
In view of statistical analysis, using “Root VMT” to calculate averages and standard deviations is reasonable. However estimated accumulated mileage for 25 years is much higher than reasonably assumed mileages for vehicle life.
December 14, 2020 23The number of cycles

llPROTECTED 関係者外秘
Japan Data for LDV
December 14, 2020 24The number of cycles

llPROTECTED 関係者外秘
Outliers
True or erroneous?
December 14, 2020 25The number of cycles

llPROTECTED 関係者外秘
December 14, 2020 26The number of cycles

llPROTECTED 関係者外秘
December 14, 2020 27The number of cycles

llPROTECTED 関係者外秘
1,924,000km@25yrs
December 14, 2020 28The number of cycles