Embed Size (px)
Citation preview
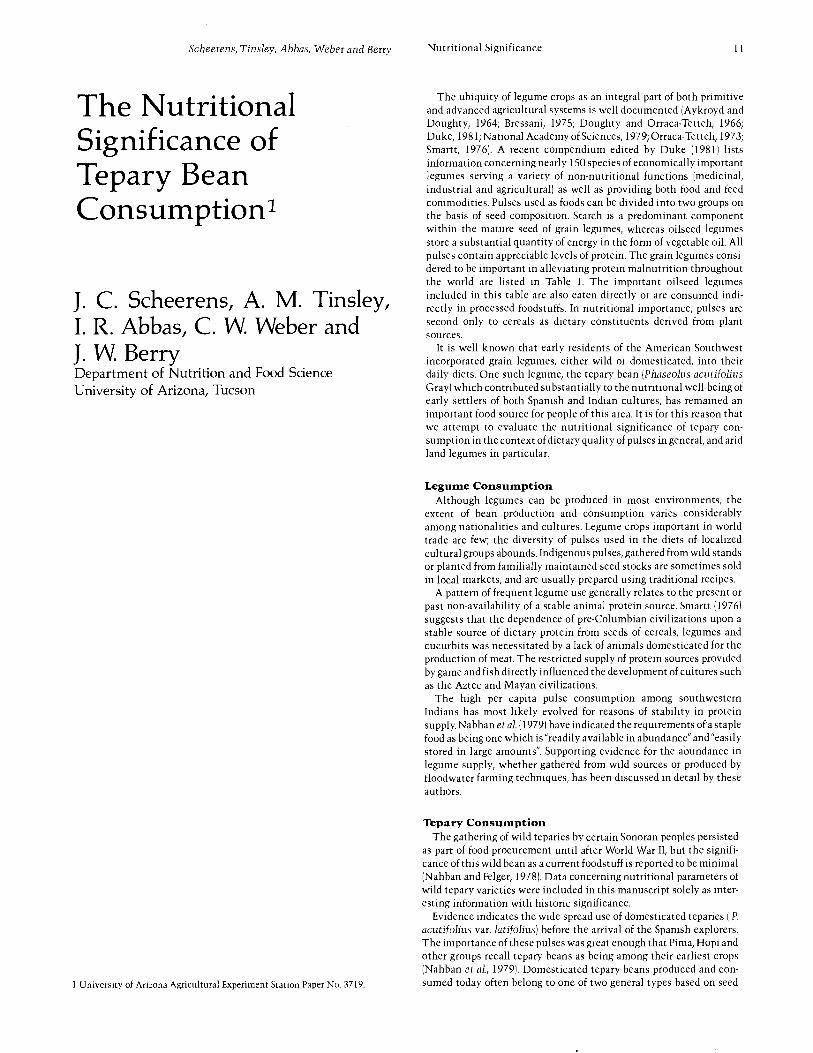
The Nutritional Significance of Tepary Bean Consumption
Item Type Article
Authors Sheerens, J. C.; Tinsley, A. M.; Abbas, I. R.; Weber, C. W.; Berry, J.W.
Publisher University of Arizona (Tucson, AZ)
Journal Desert Plants
Rights Copyright © Arizona Board of Regents. The University of Arizona.
Download date 02/05/2018 17:20:18
Link to Item http://hdl.handle.net/10150/552174
Scheerens, Tinsley, Abbas, Weber and Berry
The NutritionalSignificance ofTepary BeanConsumption'
J. C. Scheerens, A. M. Tinsley,I. R. Abbas, C. W. Weber andJ. W. BerryDepartment of Nutrition and Food ScienceUniversity of Arizona, Tucson
1 University of Arizona Agricultural Experiment Station Paper No. 3719.
Nutritional Significance 11
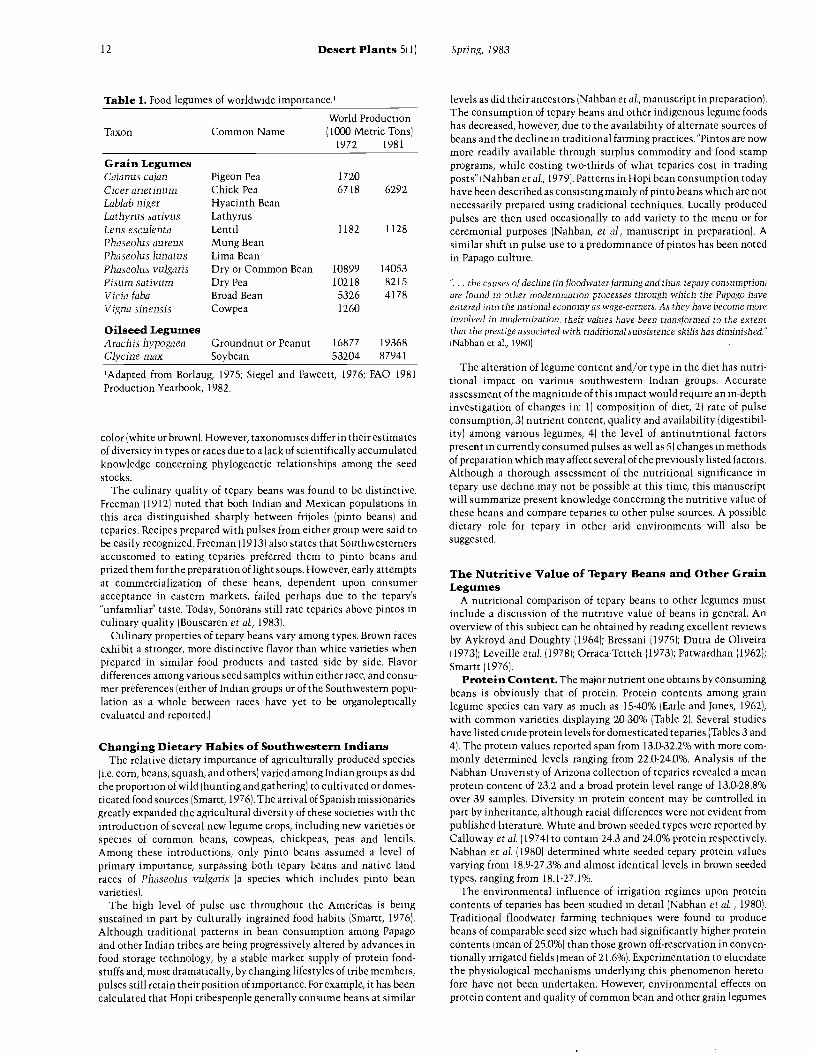
The ubiquity of legume crops as an integral part of both primitiveand advanced agricultural systems is well documented (Aykroyd andDoughty, 1964; Bressani, 1975; Doughty and Orraca -Tetteh, 1966;Duke, 1981; National Academy of Sciences, 1979; Orraca-Tetteh, 1973;Smartt, 19761. A recent compendium edited by Duke (19811 listsinformation concerning nearly 150 species of economically importantlegumes serving a variety of non -nutritional functions (medicinal,industrial and agricultural) as well as providing both food and feedcommodities. Pulses used as foods can be divided into two groups onthe basis of seed composition. Starch is a predominant componentwithin the mature seed of grain legumes, whereas oilseed legumesstore a substantial quantity of energy in the form of vegetable oil. Allpulses contain appreciable levels of protein. The grain legumes consi-dered to be important in alleviating protein malnutrition throughoutthe world are listed in Table 1. The important oilseed legumesincluded in this table are also eaten directly or are consumed indi-rectly in processed foodstuffs. In nutritional importance, pulses aresecond only to cereals as dietary constituents derived from plantsources.
It is well known that early residents of the American Southwestincorporated grain legumes, either wild or domesticated, into theirdaily diets. One such legume, the tepary bean (Phaseolus acutifoliusGray) which contributed substantially to the nutritional well -being ofearly settlers of both Spanish and Indian cultures, has remained animportant food source for people of this area. It is for this reason thatwe attempt to evaluate the nutritional significance of tepary con-sumption in the context of dietary quality of pulses in general, and aridland legumes in particular.
Legume ConsumptionAlthough legumes can be produced in most environments, the
extent of bean production and consumption varies considerablyamong nationalities and cultures. Legume crops important in worldtrade are few; the diversity of pulses used in the diets of localizedcultural groups abounds. Indigenous pulses, gathered from wild standsor planted from familially maintained seed stocks are sometimes soldin local markets, and are usually prepared using traditional recipes.
A pattern of frequent legume use generally relates to the present orpast non -availability of a stable animal protein source. Smartt (1976)suggests that the dependence of pre -Columbian civilizations upon astable source of dietary protein from seeds of cereals, legumes andcucurbits was necessitated by a lack of animals domesticated for theproduction of meat. The restricted supply of protein sources providedby game and fish directly influenced the development of cultures suchas the Aztec and Mayan civilizations.
The high per capita pulse consumption among southwesternIndians has most likely evolved for reasons of stability in proteinsupply. Nabhan et al. (197 91 have indicated the requirements of a staplefood as being one which is "readily available in abundance" and "easilystored in large amounts ". Supporting evidence for the abundance inlegume supply, whether gathered from wild sources or produced byfloodwater farming techniques, has been discussed in detail by theseauthors.
Tepary ConsumptionThe gathering of wild teparies by certain Sonoran peoples persisted
as part of food procurement until after World War II, but the signifi-cance of this wild bean as a current foodstuff is reported to be minimal( Nahban and Felger, 1978). Data concerning nutritional parameters ofwild tepary varieties were included in this manuscript solely as inter-esting information with historic significance.
Evidence indicates the wide -spread use of domesticated teparies ( P.
acutifolius var. latifolius) before the arrival of the Spanish explorers.The importance of these pulses was great enough that Pima, Hopi andother groups recall tepary beans as being among their earliest crops( Nahban et al., 19791. Domesticated tepary beans produced and con-sumed today often belong to one of two general types based on seed
12 Desert Plants 5(1)
Table 1. Food legumes of worldwide importance.'
Taxon Common NameWorld Production( 1000 Metric Tons)
1972 1981
Grain LegumesCajanus cajan Pigeon Pea 1720Cicer arietinum Chick Pea 6718 6292Lablab niger Hyacinth BeanLathyrus sativus LathyrusLens esculenta Lentil 1182 1128Phaseolus aureus Mung BeanPhaseolus lunatus Lima BeanPhaseolus vulgaris Dry or Common Bean 10899 14053Pisum sativum Dry Pea 10218 8215Vicia faba Broad Bean 5326 4178Vigna sinensis Cowpea 1260
Oilseed LegumesArachis hypogaea Groundnut or Peanut 16877 19368Glycine max Soybean 53204 87941
'Adapted from Borlaug, 1975; Siegel and Fawcett, 1976; FAO 1981Production Yearbook, 1982.
color (white or brown). However, taxonomists differ in their estimatesof diversity in types or races due to a lack of scientifically accumulatedknowledge concerning phylogenetic relationships among the seedstocks.
The culinary quality of tepary beans was found to be distinctive.Freeman (1912) noted that both Indian and Mexican populations inthis area distinguished sharply between frijoles (pinto beans) andteparies. Recipes prepared with pulses from either group were said tobe easily recognized. Freeman (1913) also states that Southwesternersaccustomed to eating teparies preferred them to pinto beans andprized them for the preparation of light soups. However, early attemptsat commercialization of these beans, dependent upon consumeracceptance in eastern markets, failed perhaps due to the tepary's"unfamiliar" taste. Today, Sonorans still rate teparies above pintos inculinary quality (Bouscaren et al., 1983).
Culinary properties of tepary beans vary among types. Brown racesexhibit a stronger, more distinctive flavor than white varieties whenprepared in similar food products and tasted side by side. Flavordifferences among various seed samples within either race, and consu-mer preferences (either of Indian groups or of the Southwestern popu-lation as a whole between races have yet to be organolepticallyevaluated and reported.)
Changing Dietary Habits of Southwestern IndiansThe relative dietary importance of agriculturally produced species
(i.e. corn, beans, squash, and others) varied among Indian groups as didthe proportion of wild (hunting and gathering) to cultivated or domes -ticated food sources (Smartt, 1976). The arrival of Spanish missionariesgreatly expanded the agricultural diversity of these societies with theintroduction of several new legume crops, including new varieties orspecies of common beans, cowpeas, chickpeas, peas and lentils.Among these introductions, only pinto beans assumed a level ofprimary importance, surpassing both tepary beans and native landraces of Phaseolus vulgaris (a species which includes pinto beanvarieties).
The high level of pulse use throughout the Americas is beingsustained in part by culturally ingrained food habits (Smartt, 1976).Although traditional patterns in bean consumption among Papagoand other Indian tribes are being progressively altered by advances infood storage technology, by a stable market supply of protein food-stuffs and, most dramatically, by changing lifestyles of tribe members,pulses still retain their position of importance. For example, it has beencalculated that Hopi tribespeople generally consume beans at similar
Spring, 1983
levels as did their ancestors ( Nahban et al., manuscript in preparation).The consumption of tepary beans and other indigenous legume foodshas decreased, however, due to the availability of alternate sources ofbeans and the decline in traditional farming practices. "Pintos are nowmore readily available through surplus commodity and food stampprograms, while costing two- thirds of what teparies cost in tradingposts" ( Nahban et al., 1979). Patterns in Hopi bean consumption todayhave been described as consisting mainly of pinto beans which are notnecessarily prepared using traditional techniques. Locally producedpulses are then used occasionally to add variety to the menu or forceremonial purposes ( Nahban, et al., manuscript in preparation). Asimilar shift in pulse use to a predominance of pintos has been notedin Papago culture.
"... the causes of decline (in floodwater farming and thus, tepary consumption)are found in other modernization processes through which the Papago haveentered into the national economy as wage- earners. As they have become moreinvolved in modernization, their values have been transformed to the extentthat the prestige associated with traditional subsistence skills has diminished."1Nabhan et al., 19801
The alteration of legume content and /or type in the diet has nutri-tional impact on various southwestern Indian groups. Accurateassessment of the magnitude of this impact would require an in -depthinvestigation of changes in: 1) composition of diet, 2) rate of pulseconsumption, 3) nutrient content, quality and availability (digestibil-ity) among various legumes, 4) the level of antinutritional factorspresent in currently consumed pulses as well as 5) changes in methodsof preparation which may affect several of the previously listed factors.Although a thorough assessment of the nutritional significance intepary use decline may not be possible at this time, this manuscriptwill summarize present knowledge concerning the nutritive value ofthese beans and compare teparies to other pulse sources. A possibledietary role for tepary in other arid environments will also besuggested.
The Nutritive Value of Tepary Beans and Other GrainLegumes
A nutritional comparison of tepary beans to other legumes mustinclude a discussion of the nutritive value of beans in general. Anoverview of this subject can be obtained by reading excellent reviewsby Aykroyd and Doughty (1964); Bressani (1975); Dutra de Oliveira(1973); Leveille etal. (1978); Orraca -Tetteh (1973); Patwardhan (1962);Smartt (1976).
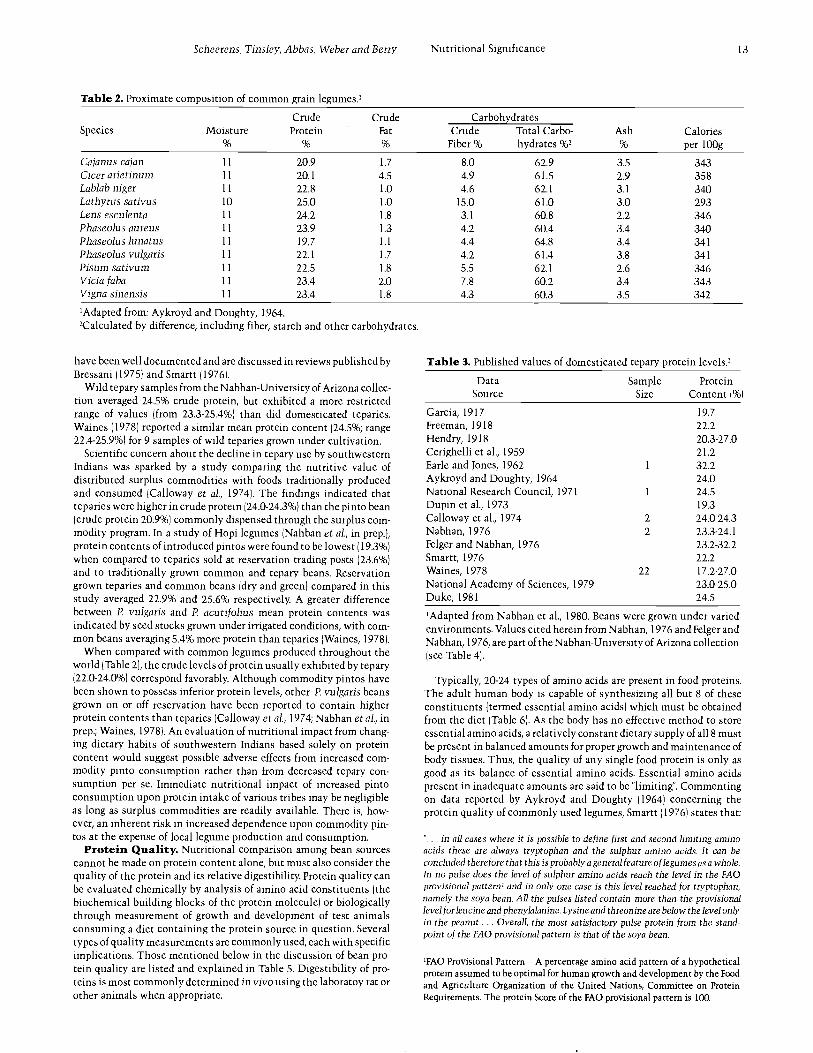
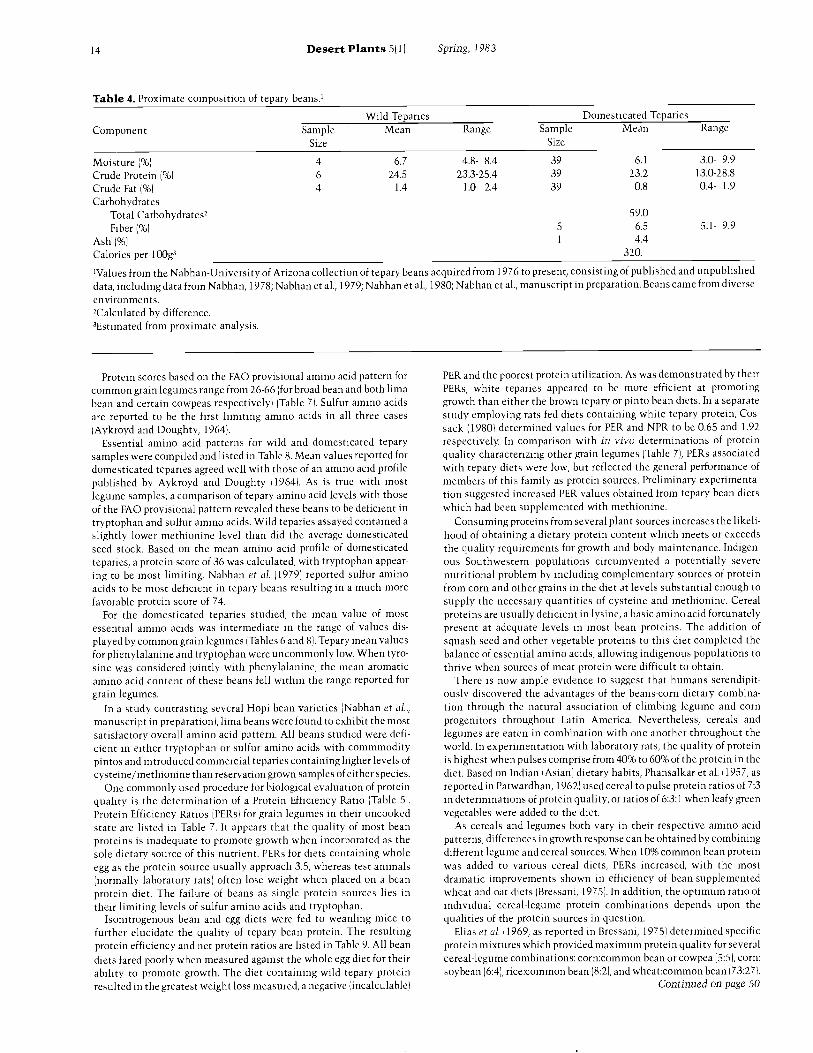
Protein Content. The major nutrient one obtains by consumingbeans is obviously that of protein. Protein contents among grainlegume species can vary as much as 15 -40% (Earle and Jones, 1962),with common varieties displaying 20 -30% (Table 2). Several studieshave listed crude protein levels for domesticated teparies (Tables 3 and4). The protein values reported span from 13.0 -32.2% with more com-monly determined levels ranging from 22.0 -24.0%. Analysis of theNabhan -Univeristy of Arizona collection of teparies revealed a meanprotein content of 23.2 and a broad protein level range of 13.0 -28.8%over 39 samples. Diversity in protein content may be controlled inpart by inheritance, although racial differences were not evident frompublished literature. White and brown seeded types were reported byCalloway et al. (1974) to contain 24.3 and 24.0% protein respectively.Nabhan et al. (1980) determined white seeded tepary protein valuesvarying from 18.9 -27.3% and almost identical levels in brown seededtypes, ranging from 18.1 -27.1%.
The environmental influence of irrigation regimes upon proteincontents of teparies has been studied in detail ( Nabhan et al. , 1980).Traditional floodwater farming techniques were found to producebeans of comparable seed size which had significantly higher proteincontents (mean of 25.0 %) than those grown off -reservation in conven-tionally irrigated fields (mean of 21.6 %). Experimentation to elucidatethe physiological mechanisms underlying this phenomenon hereto-fore have not been undertaken. However, environmental effects onprotein content and quality of common bean and other grain legumes
Scheerens, Tinsley, Abbas, Weber and Berry
Table 2. Proximate composition of common grain legumes.'
Nutritional Significance 13
Species MoistureCrudeProtein
CrudeFat
CarbohydratesAsh Calories
per 100gCrude
Fiber %Total Carbo-hydrates %2
Cajanus cajan 11 20.9 1.7 8.0 62.9 3.5 343Cicer arietinum 11 20.1 4.5 4.9 61.5 2.9 358Lablab niger 11 22.8 1.0 4.6 62.1 3.1 340Lathyrussativus 10 25.0 1.0 15.0 61.0 3.0 293Lens esculenta 11 24.2 1.8 3.1 60.8 2.2 346Phaseolus aureus 11 23.9 1.3 4.2 60.4 3.4 340Phaseolus lunatus 11 19.7 1.1 4.4 64.8 3.4 341Phaseolus vulgaris 11 22.1 1.7 4.2 61.4 3.8 341Pisum sativum 11 22.5 1.8 5.5 62.1 2.6 346Vicia faba 11 23.4 2.0 7.8 60.2 3.4 343Vigna sinensis 11 23.4 1.8 4.3 60.3 3.5 342
'Adapted from: Aykroyd and Doughty, 1964.'Calculated by difference, including fiber, starch and other carbohydrates.
have been well documented and are discussed in reviews published byBressani (1975) and Smartt (1976).
Wild tepary samples from the Nabhan- University of Arizona collec-tion averaged 24.5% crude protein, but exhibited a more restrictedrange of values (from 23.3 -25.4 %) than did domesticated teparies.Waines ( 1978) reported a similar mean protein content (24.5 %; range22.4- 25.9 %) for 9 samples of wild teparies grown under cultivation.
Scientific concern about the decline in tepary use by southwesternIndians was sparked by a study comparing the nutritive value ofdistributed surplus commodities with foods traditionally producedand consumed (Calloway et al., 1974). The findings indicated thatteparies were higher in crude protein )24.0 -24.3%) than the pinto bean(crude protein 20.9 %) commonly dispensed through the surplus corn -modity program. In a study of Hopi legumes (Nahban et al., in prep.),protein contents of introduced pintos were found to be lowest (19.3 %)when compared to teparies sold at reservation trading posts (23.6%)and to traditionally grown common and tepary beans. Reservationgrown teparies and common beans (dry and green) compared in thisstudy averaged 22.9% and 25.6% respectively. A greater differencebetween P. vulgaris and P. acutifolius mean protein contents wasindicated by seed stocks grown under irrigated conditions, with com-mon beans averaging 5.4% more protein than teparies (Waines, 1978).
When compared with common legumes produced throughout theworld (Table 2), the crude levels of protein usually exhibited by tepary(22.0- 24.0 %) correspond favorably. Although commodity pintos havebeen shown to possess inferior protein levels, other P. vulgaris beansgrown on or off reservation have been reported to contain higherprotein contents than teparies (Calloway et al., 1974; Nabhan et al., inprep.; Waines, 1978). An evaluation of nutritional impact from chang-ing dietary habits of southwestern Indians based solely on proteincontent would suggest possible adverse effects from increased com-modity pinto consumption rather than from decreased tepary con-sumption per se. Immediate nutritional impact of increased pintoconsumption upon protein intake of various tribes may be negligibleas long as surplus commodities are readily available. There is, how-ever, an inherent risk in increased dependence upon commodity pin-tos at the expense of local legume production and consumption.
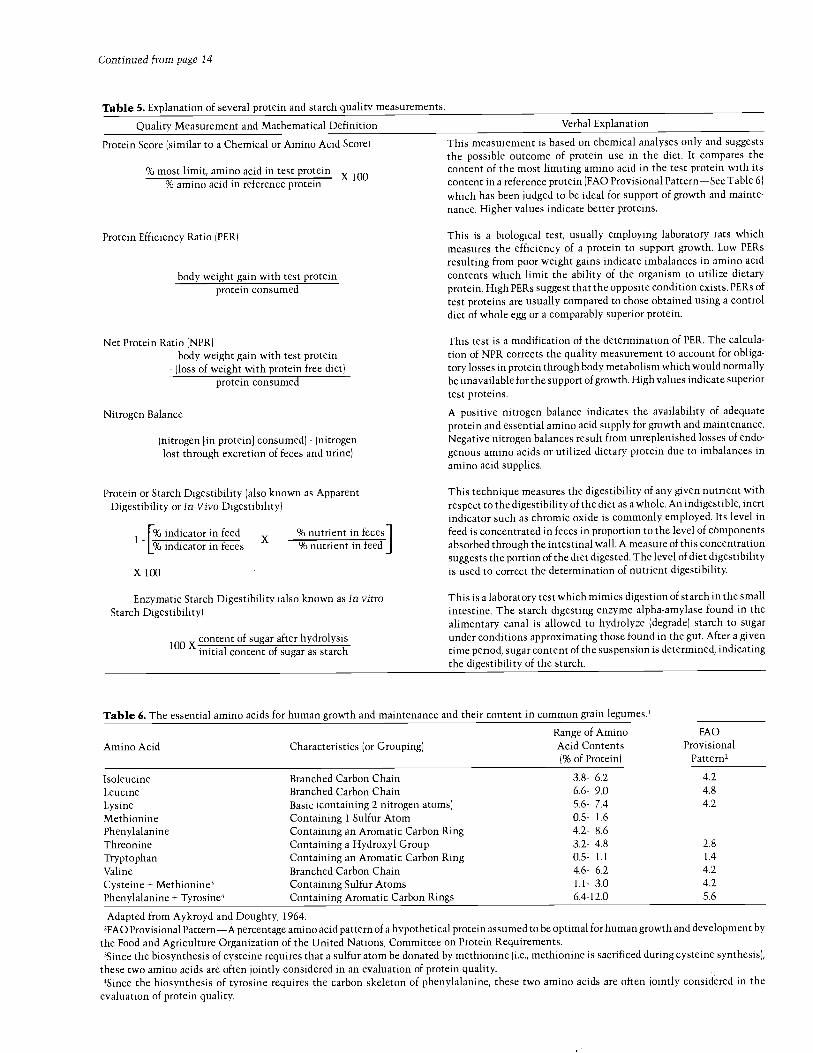
Protein Quality. Nutritional comparison among bean sourcescannot be made on protein content alone, but must also consider thequality of the protein and its relative digestibility. Protein quality canbe evaluated chemically by analysis of amino acid constituents (thebiochemical building blocks of the protein molecule) or biologicallythrough measurement of growth and development of test animalsconsuming a diet containing the protein source in question. Severaltypes of quality measurements are commonly used, each with specificimplications. Those mentioned below in the discussion of bean pro-tein quality are listed and explained in Table 5. Digestibility of pro-teins is most commonly determined in vivo using the laboratoy rat orother animals when appropriate.
Table 3. Published values of domesticated tepary protein levels.'
DataSource
SampleSize
ProteinContent (%)
Garcia, 1917Freeman, 1918Hendry, 1918Cerighelli et al., 1959
19.7
22.220.3 -27.021.2
Earle and Jones, 1962 1 32.2Aykroyd and Doughty, 1964 24.0National Research Council, 1971 1 24.5Dupin et al., 1973 19.3Calloway et al., 1974 2 24.0 -24.3Nabhan, 1976 2 23.3 -24.1Felger and Nabhan, 1976 23.2 -32.2Smartt, 1976 22.2Waines, 1978 22 17.2 -27.0National Academy of Sciences, 1979 23.0 -25.0Duke, 1981 24.5
'Adapted from Nabhan et al., 1980. Beans were grown under variedenvironments. Values cited herein from Nabhan, 1976 and Felger andNabhan, 1976, are part of the Nabhan- University of Arizona collection(see Table 4).
Typically, 20 -24 types of amino acids are present in food proteins.The adult human body is capable of synthesizing all but 8 of theseconstituents (termed essential amino acids) which must be obtainedfrom the diet (Table 6). As the body has no effective method to storeessential amino acids, a relatively constant dietary supply of all 8 mustbe present in balanced amounts for proper growth and maintenance ofbody tissues. Thus, the quality of any single food protein is only asgood as its balance of essential amino acids. Essential amino acidspresent in inadequate amounts are said to be "limiting ". Commentingon data reported by Aykroyd and Doughty (1964) concerning theprotein quality of commonly used legumes, Smartt (1976) states that:
`... in all cases where it is possible to define first and second limiting aminoacids these are always tryptophan and the sulphur amino acids. It can beconcluded therefore that this is probably a general feature of legumes as a whole.In no pulse does the level of sulphur amino acids reach the level in the FAOprovisional pattern' and in only one case is this level reached for tryptophan,namely the soya bean. All the pulses listed contain more than the provisionallevel forleucine and phenylalanine. Lysine and threonine are below the level onlyin the peanut ... Overall, the most satisfactory pulse protein from the stand-point of the FAO provisional pattern is that of the soya bean.
'FAO Provisional Pattern -A percentage amino acid pattern of a hypotheticalprotein assumed to be optimal for human growth and development by the Foodand Agriculture Organization of the United Nations, Committee on ProteinRequirements. The protein Score of the FAO provisional pattern is 100.
14 Desert Plants 5(1)
Table 4. Proximate composition of tepary beans.'
Spring, 1983
ComponentWild Teparies Domesticated Teparies
SampleSize
Mean Range SampleSize
Mean Range
Moisture ( %) 4 6.7 4.8- 8.4 39 6.1 3.0- 9.9Crude Protein ( %) 6 24.5 23.3 -25.4 39 23.2 13.0 -28.8
Crude Fat ( %) 4 1.4 1.0- 2.4 39 0.8 0.4- 1.9
CarbohydratesTotal Carbohydrates,Fiber ( %) 5
59.06.5 5.1- 9.9
Ash ( %) 1 4.4
Calories per 100g3 320.
'Values from the Nabhan- University of Arizona collection of tepary beans acquired from 1976 to present, consisting of published and unpublisheddata, including data from Nabhan, 1978; Nabhan et al., 1979; Nabhan et al., 1980; Nabhan et al., manuscript in preparation. Beans came from diverseenvironments.,Calculated by difference.3Estimated from proximate analysis.
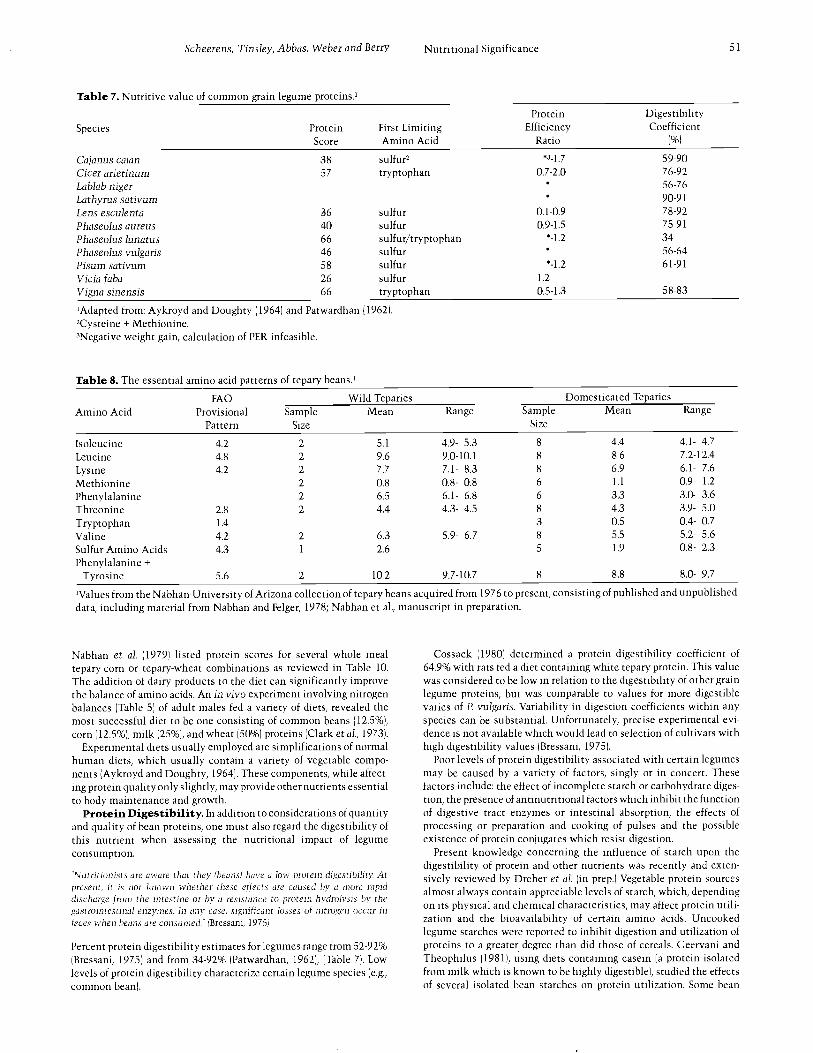
Protein scores based on the FAO provisional amino acid pattern forcommon grain legumes range from 26 -66 (for broad bean and both limabean and certain cowpeas respectively) (Table 7). Sulfur amino acidsare reported to be the first limiting amino acids in all three cases( Aykroyd and Doughty, 1964).
Essential amino acid patterns for wild and domesticated teparysamples were compiled and listed in Table 8. Mean values reported fordomesticated teparies agreed well with those of an amino acid profilepublished by Aykroyd and Doughty (1964). As is true with mostlegume samples, a comparison of tepary amino acid levels with thoseof the FAO provisional pattern revealed these beans to be deficient intryptophan and sulfur amino acids. Wild teparies assayed contained aslightly lower methionine level than did the average domesticatedseed stock. Based on the mean amino acid profile of domesticatedteparies, a protein score of 36 was calculated, with tryptophan appear-ing to be most limiting. Nabhan et al. (1979) reported sulfur aminoacids to be most deficient in tepary beans resulting in a much morefavorable protein score of 74.
For the domesticated teparies studied, the mean value of mostessential amino acids was intermediate in the range of values dis-played by common grain legumes (Tables 6 and 8). Tepary mean valuesfor phenylalanine and tryptophan were uncommonly low. When tyro-sine was considered jointly with phenylalanine, the mean aromaticamino acid content of these beans fell within the range reported forgrain legumes.
In a study contrasting several Hopi bean varieties ( Nabhan et al..,manuscript in preparation), lima beans were found to exhibit the mostsatisfactory overall amino acid pattern. All beans studied were defi-cient in either tryptophan or sulfur amino acids with commmoditypintos and introduced commercial teparies containing higher levels ofcysteine / methionine than reservation grown samples of either species.
One commonly used procedure for biological evaluation of proteinquality is the determination of a Protein Efficiency Ratio (Table 5).Protein Efficiency Ratios (PERs) for grain legumes in their uncookedstate are listed in Table 7. It appears that the quality of most beanproteins is inadequate to promote growth when incorporated as thesole dietary source of this nutrient. PERs for diets containing wholeegg as the protein source usually approach 3.5, whereas test animals(normally laboratory rats) often lose weight when placed on a beanprotein diet. The failure of beans as single protein sources lies intheir limiting levels of sulfur amino acids and tryptophan.
Isonitrogenous bean and egg diets were fed to weanling mice tofurther elucidate the quality of tepary bean protein. The resultingprotein efficiency and net protein ratios are listed in Table 9. All beandiets fared poorly when measured against the whole egg diet for theirability to promote growth. The diet containing wild tepary proteinresulted in the greatest weight loss measured, a negative (incalculable)
PER and the poorest protein utilization. As was demonstrated by theirPERs, white teparies appeared to be more efficient at promotinggrowth than either the brown tepary or pinto bean diets. In a separatestudy employing rats fed diets containing white tepary protein, Cos-sack ( 1980) determined values for PER and NPR to be 0.65 and 1.92respectively. In comparison with in vivo determinations of proteinquality characterizing other grain legumes (Table 7), PERs associatedwith tepary diets were low, but reflected the general performance ofmembers of this family as protein sources. Preliminary experimenta-tion suggested increased PER values obtained from tepary bean dietswhich had been supplemented with methionine.
Consuming proteins from several plant sources increases the likeli-hood of obtaining a dietary protein content which meets or exceedsthe quality requirements for growth and body maintenance. Indigen-ous Southwestern populations circumvented a potentially severenutritional problem by including complementary sources of proteinfrom corn and other grains in the diet at levels substantial enough tosupply the necessary quantities of cysteine and methionine. Cerealproteins are usually deficient in lysine, a basic amino acid fortunatelypresent at adequate levels in most bean proteins. The addition ofsquash seed and other vegetable proteins to this diet completed thebalance of essential amino acids, allowing indigenous populations tothrive when sources of meat protein were difficult to obtain.
There is now ample evidence to suggest that humans serendipit-ously discovered the advantages of the beans -corn dietary combina-tion through the natural association of climbing legume and cornprogenitors throughout Latin America. Nevertheless, cereals andlegumes are eaten in combination with one another throughout theworld. In experimentation with laboratory rats, the quality of proteinis highest when pulses comprise from 40% to 60% of the protein in thediet. Based on Indian (Asian) dietary habits, Phansalkar et al. (1957, asreported in Patwardhan, 1962) used cereal to pulse protein ratios of 7:3in determinations of protein quality, or ratios of 6:3:1 when leafy greenvegetables were added to the diet.
As cereals and legumes both vary in their respective amino acidpatterns, differences in growth response can be obtained by combiningdifferent legume and cereal sources. When 10% common bean proteinwas added to various cereal diets, PERs increased, with the mostdramatic improvements shown in efficiency of bean -supplementedwheat and oat diets (Bressani, 1975). In addition, the optimum ratio ofindividual cereal -legume protein combinations depends upon thequalities of the protein sources in question.
Elias et al. (1969, as reported in Bressani, 1975) determined specificprotein mixtures which provided maximum protein quality for severalcereal -legume combinations: corn:common bean or cowpea (5:5), corn:soybean (6:4), rice:common bean (8:2), and wheat:common bean (73:27).
Continued on page 50
Continued from page 14
Table 5. Explanation of several protein and starch quality measurements.
Quality Measurement and Mathematical Definition Verbal Explanation
Protein Score (similar to a Chemical or Amino Acid Score)
% most limit, amino acid in test protein X 100% amino acid in reference protein
Protein Efficiency Ratio (PER)
body weight gain with test proteinprotein consumed
Net Protein Ratio )NPR)body weight gain with test protein
- (loss of weight with protein free diet)protein consumed
Nitrogen Balance
(nitrogen [in protein) consumed) - (nitrogenlost through excretion of feces and urine)
Protein or Starch Digestibility (also known as ApparentDigestibility or In Vivo Digestibility)
% indicator in feed% indicator in feces
X 100
X% nutrient in feces% nutrient in feed
Enzymatic Starch Digestibility (also known as In vitroStarch Digestibility)
100 Xcontent of sugar after hydrolysisinitial content of sugar as starch
This measurement is based on chemical analyses only and suggeststhe possible outcome of protein use in the diet. It compares thecontent of the most limiting amino acid in the test protein with itscontent in a reference protein (FAO Provisional Pattern -See Table 6)which has been judged to be ideal for support of growth and mainte-nance. Higher values indicate better proteins.
This is a biological test, usually employing laboratory rats whichmeasures the efficiency of a protein to support growth. Low PERsresulting from poor weight gains indicate imbalances in amino acidcontents which limit the ability of the organism to utilize dietaryprotein. High PERs suggest that the opposite condition exists. PERs oftest proteins are usually compared to those obtained using a controldiet of whole egg or a comparably superior protein.
This test is a modification of the determination of PER. The calcula-tion of NPR corrects the quality measurement to account for obliga-tory losses in protein through body metabolism which would normallybe unavailable for the support of growth. High values indicate superiortest proteins.
A positive nitrogen balance indicates the availability of adequateprotein and essential amino acid supply for growth and maintenance.Negative nitrogen balances result from unreplenished losses of endo-genous amino acids or utilized dietary protein due to imbalances inamino acid supplies.
This technique measures the digestibility of any given nutrient withrespect to the digestibility of the diet as a whole. An indigestible, inertindicator such as chromic oxide is commonly employed. Its level infeed is concentrated in feces in proportion to the level of componentsabsorbed through the intestinal wall. A measure of this concentrationsuggests the portion of the diet digested. The level of diet digestibilityis used to correct the determination of nutrient digestibility.
This is a laboratory test which mimics digestion of starch in the smallintestine. The starch digesting enzyme alpha -amylase found in thealimentary canal is allowed to hydrolyze (degrade) starch to sugarunder conditions approximating those found in the gut. After a giventime period, sugar content of the suspension is determined, indicatingthe digestibility of the starch.
Table 6. The essential amino acids for human growth and maintenance and their content in common grain legumes.'
Amino Acid Characteristics (or Grouping)Range of AminoAcid Contents(% of Protein)
FAO
ProvisionalPattern2
Isoleucine Branched Carbon Chain 3.8- 6.2 4.2
Leucine Branched Carbon Chain 6.6- 9.0 4.8
Lysine Basic (containing 2 nitrogen atoms) 5.6- 7.4 4.2
Methionine Containing 1 Sulfur Atom 0.5- 1.6
Phenylalanine Containing an Aromatic Carbon Ring 4.2- 8.6Threonine Containing a Hydroxyl Group 3.2- 4.8 2.8
Tryptophan Containing an Aromatic Carbon Ring 0.5- 1.1 1.4
Valine Branched Carbon Chain 4.6- 6.2 4.2
Cysteine + Methionine3 Containing Sulfur Atoms 1.1- 3.0 4.2
Phenylalanine + Tyrosine' Containing Aromatic Carbon Rings 6.4 -12.0 5.6
'Adapted from Aykroyd and Doughty, 1964.2FAO Provisional Pattern -A percentage amino acid pattern of a hypothetical protein assumed to be optimal for human growth and development bythe Food and Agriculture Organization of the United Nations, Committee on Protein Requirements.3Since the biosynthesis of cysteine requires that a sulfur atom be donated by methionine (i.e., methionine is sacrificed during cysteine synthesis),these two amino acids are often jointly considered in an evaluation of protein quality.4Since the biosynthesis of tyrosine requires the carbon skeleton of phenylalanine, these two amino acids are often jointly considered in theevaluation of protein quality.
Scheerens, Tinsley, Abbas, Weber and Berry Nutritional Significance
Table 7. Nutritive value of common grain legume proteins.'
51
Species ProteinScore
First LimitingAmino Acid
ProteinEfficiency
Ratio
DigestibilityCoefficient
Cajanus tajan 38 sulfur, *3 -1.7 59 -90
Cicer arietinum 57 tryptophan 0.7 -2.0 76 -92
Lablab niger 56 -76
Lathyrus sativum 90 -91
Lens esculenta 36 sulfur 0.1 -0.9 78 -92
Phaseolus aureus 40 sulfur 0.9 -1.5 75 -91
Phaseolus lunatus 66 sulfur /tryptophan * -1.2 34
Phaseolus vulgaris 46 sulfur 56 -64
Pisum sativum 58 sulfur * -1.2 61 -91
Vicia faba 26 sulfur 1.2
Vigna sinensis 66 tryptophan 0.5 -1.3 58 -83
'Adapted from: Aykroyd and Doughty ( 1964) and Patwardhan ( 1962).2Cysteine + Methionine.3Negative weight gain, calculation of PER infeasible.
Table 8. The essential amino acid patterns of tepary beans.'
Amino AcidFAO
ProvisionalPattern
Wild Teparies Domesticated TepariesSample
Size
Mean Range SampleSize
Mean Range
Isoleucine 4.2 2 5.1 4.9- 5.3 8 4.4 4.1- 4.7Leucine 4.8 2 9.6 9.0 -10.1 8 8.6 7.2 -12.4
Lysine 4.2 2 7.7 7.1- 8.3 8 6.9 6.1- 7.6Methionine 2 0.8 0.8- 0.8 6 1.1 0.9- 1.2
Phenylalanine 2 6.5 6.1- 6.8 6 3.3 3.0- 3.6Threonine 2.8 2 4.4 4.3- 4.5 8 4.3 3.9- 5.0Tryptophan 1.4 3 0.5 0.4- 0.7Valine 4.2 2 6.3 5.9- 6.7 8 5.5 5.2- 5.6Sulfur Amino Acids 4.3 1 2.6 5 1.9 0.8- 2.3Phenylalanine +
Tyrosine 5.6 2 10.2 9.7 -10.7 8 8.8 8.0- 9.7
'Values from the Nabhan- University of Arizona collection of tepary beans acquired from 1976 to present, consisting of published and unpublisheddata, including material from Nabhan and Felger, 1978; Nabhan et al., manuscript in preparation.
Nabhan et al. )1979) listed protein scores for several whole mealtepary-corn or tepary-wheat combinations as reviewed in Table 10.The addition of dairy products to the diet can significantly improvethe balance of amino acids. An in vivo experiment involving nitrogenbalances (Table 5) of adult males fed a variety of diets, revealed themost successful diet to be one consisting of common beans )12.5 %),corn )12.5 %), milk (25 %), and wheat )50 %) proteins )Clark et al., 1973).
Experimental diets usually employed are simplifications of normalhuman diets, which usually contain a variety of vegetable compo-nents (Aykroyd and Doughty, 1964). These components, while affect-ing protein quality only slightly, may provide other nutrients essentialto body maintenance and growth.
Protein Digestibility. In addition to considerations of quantityand quality of bean proteins, one must also regard the digestibility ofthis nutrient when assessing the nutritional impact of legumeconsumption.
"Nutritionists are aware that they (beans) have a low protein digestibility Atpresent, it is not known whether these effects are caused by a more rapiddischarge from the intestine or by a resistance to protein hydrolysis by thegastrointestinal enzymes. In any case, significant losses of nitrogen occur infeces when beans are consumed." (Bressani, 1975)
Percent protein digestibility estimates for legumes range from 52 -92%(Bressani, 1975) and from 34 -92% (Patwardhan, 1962), )Table 7). Lowlevels of protein digestibility characterize certain legume species e.g.,common bean).
Cossack )1980) determined a protein digestibility coefficient of64.9% with rats fed a diet containing white tepary protein. This valuewas considered to be low in relation to the digestibility of other grainlegume proteins, but was comparable to values for more digestiblevaries of P vulgaris. Variability in digestion coefficients within anyspecies can be substantial. Unfortunately, precise experimental evi-dence is not available which would lead to selection of cultivars withhigh digestibility values (Bressani, 1975).
Poor levels of protein digestibility associated with certain legumesmay be caused by a variety of factors, singly or in concert. Thesefactors include: the effect of incomplete starch or carbohydrate diges-tion, the presence of antinutritional factors which inhibit the functionof digestive tract enzymes or intestinal absorption, the effects ofprocessing or preparation and cooking of pulses and the possibleexistence of protein conjugates which resist digestion.
Present knowledge concerning the influence of starch upon thedigestibility of protein and other nutrients was recently and exten-sively reviewed by Dreher et al. in prep.) Vegetable protein sourcesalmost always contain appreciable levels of starch, which, dependingon its physical and chemical characteristics, may affect protein utili-zation and the bioavailability of certain amino acids. Uncookedlegume starches were reported to inhibit digestion and utilization ofproteins to a greater degree than did those of cereals. Geervani andTheophilus )1981), using diets containing casein )a protein isolatedfrom milk which is known to be highly digestible), studied the effectsof several isolated bean starches on protein utilization. Some bean
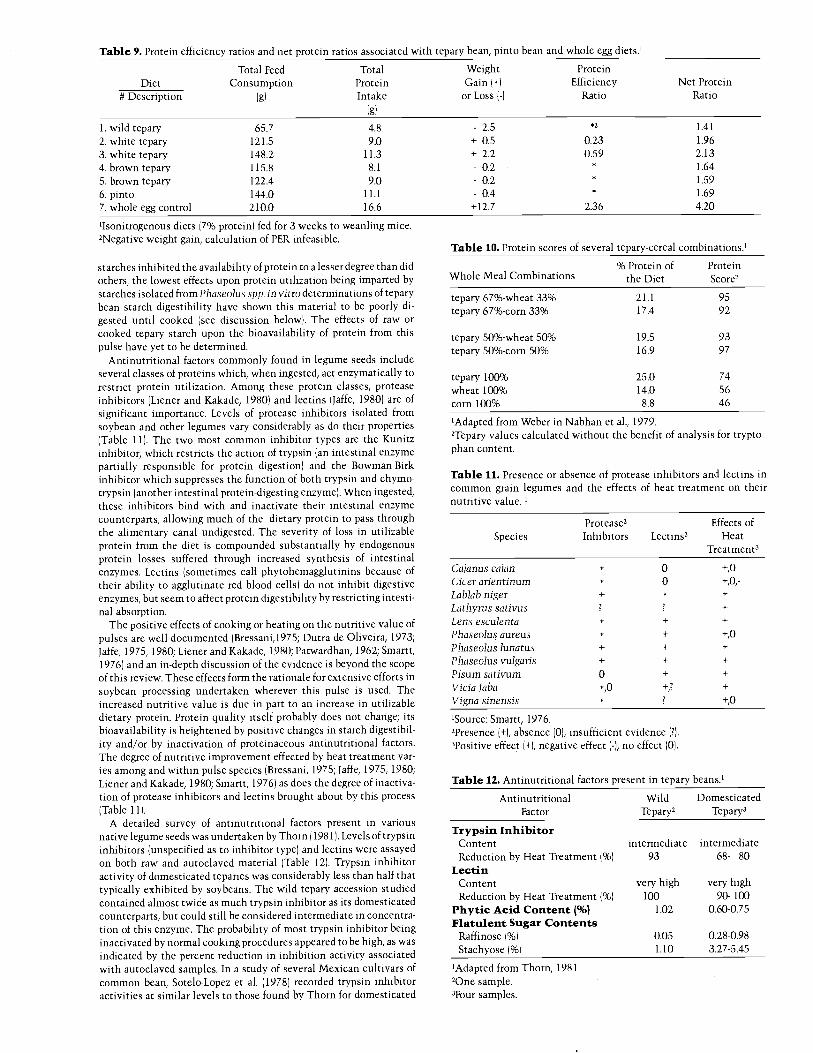
Table 9. Protein efficiency ratios and net protein ratios associated with tepary bean, pinto bean and whole egg diets.'
Total Feed Total Weight ProteinDiet Consumption Protein Gain ( +) Efficiency Net Protein
# Description (g) Intake or Loss ( -( Ratio Ratio
(g)
1. wild tepary 65.7 4.8 - 2.5 1.41
2. white tepary 121.5 9.0 + 0.5 0.23 1.96
3. white tepary 148.2 11.3 + 2.2 0.59 2.13
4. brown tepary 115.8 8.1 - 0.2 1.64
5. brown tepary 122.4 9.0 - 0.2 1.59
6. pinto 144.0 11.1 - 0.4 1.69
7. whole egg control 210.0 16.6 +12.7 2.36 4.20
'Isonitrogenous diets (7% protein) fed for 3 weeks to weanling mice.'Negative weight gain, calculation of PER infeasible.
starches inhibited the availability of protein to a lesser degree than didothers, the lowest effects upon protein utilization being imparted bystarches isolated from Phaseolus app. In vitro determinations of teparybean starch digestibility have shown this material to be poorly di-gested until cooked (see discussion below). The effects of raw orcooked tepary starch upon the bioavailability of protein from thispulse have yet to be determined.
Antinutritional factors commonly found in legume seeds includeseveral classes of proteins which, when ingested, act enzymatically torestrict protein utilization. Among these protein classes, proteaseinhibitors ( Liener and Kakade, 1980) and lectins (Jaffe, 1980) are ofsignificant importance. Levels of protease inhibitors isolated fromsoybean and other legumes vary considerably as do their properties(Table 11). The two most common inhibitor types are the Kunitzinhibitor, which restricts the action of trypsin (an intestinal enzymepartially responsible for protein digestion) and the Bowman -Birkinhibitor which suppresses the function of both trypsin and chymo-trypsin (another intestinal protein- digesting enzyme). When ingested,these inhibitors bind with and inactivate their intestinal enzymecounterparts, allowing much of the dietary protein to pass throughthe alimentary canal undigested. The severity of loss in utilizableprotein from the diet is compounded substantially by endogenousprotein losses suffered through increased synthesis of intestinalenzymes. Lectins (sometimes call phytohemagglutinins because oftheir ability to agglutinate red blood cells) do not inhibit digestiveenzymes, but seem to affect protein digestibility by restricting intesti-nal absorption.
The positive effects of cooking or heating on the nutritive value ofpulses are well documented (Bressani,1975; Dutra de Oliveira, 1973;Jaffe, 1975, 1980; Liener and Kakade, 1980; Patwardhan, 1962; Smartt,1976) and an in -depth discussion of the evidence is beyond the scopeof this review. These effects form the rationale for extensive efforts insoybean processing undertaken wherever this pulse is used. Theincreased nutritive value is due in part to an increase in utilizabledietary protein. Protein quality itself probably does not change; itsbioavailability is heightened by positive changes in starch digestibil-ity and /or by inactivation of proteinaceous antinutritional factors.The degree of nutritive improvement effected by heat treatment var-ies among and within pulse species (Bressani, 1975; Jaffe, 1975, 1980;Liener and Kakade, 1980; Smartt, 1976) as does the degree of inactiva-tion of protease inhibitors and lectins brought about by this process(Table 11).
A detailed survey of antinutritional factors present in variousnative legume seeds was undertaken by Thorn (1981). Levels of trypsininhibitors (unspecified as to inhibitor type) and lectins were assayedon both raw and autoclaved material (Table 12). Trypsin inhibitoractivity of domesticated teparies was considerably less than half thattypically exhibited by soybeans. The wild tepary accession studiedcontained almost twice as much trypsin inhibitor as its domesticatedcounterparts, but could still be considered intermediate in concentra-tion of this enzyme. The probability of most trypsin inhibitor beinginactivated by normal cooking procedures appeared to be high, as wasindicated by the percent reduction in inhibition activity associatedwith autoclaved samples. In a study of several Mexican cultivars ofcommon bean, Sotelo -Lopez et al. (1978) recorded trypsin inhibitoractivities at similar levels to those found by Thorn for domesticated
Table 10. Protein scores of several tepary- cereal combinations.'
Whole Meal Combinations
tepary 67%-wheat 33%tepary 67%-corn 33%
tepary 50%-wheat 50%tepary 50%-corn 50%
tepary 100%wheat 100%corn 100%
% Protein ofthe Diet
ProteinScoret
21.1 9517.4 92
19.5 9316.9 97
25.0 7414.0 56
8.8 46
'Adapted from Weber in Nabhan et al., 1979.2Tepary values calculated without the benefit of analysis for trypto-phan content.
Table 11. Presence or absence of protease inhibitors and lectins incommon grain legumes and the effects of heat treatment on theirnutritive value.
SpeciesProtease2Inhibitors Lectins"
Effects ofHeat
Treatment3
Cajanus cajan 0 +,0
Cicer arientinum 0 +,0,-
Lablab niger + +
Lathyrus sativusLens esculentaPhaseolus aureus + +,0
Phaseolus lunatusPhaseolus vulgarisPisum sativum 0
Vicia faba +,0
Vigna sinensis
'Source: Smartt, 1976.2Presence ( +), absence (0(, insufficient evidence ( ?).3Positive effect ( +), negative effect ( -), no effect (0).
Table 12. Antinutritional factors present in tepary beans.'
AntinutritionalFactor
WildTepary2
DomesticatedTepary3
Trypsin InhibitorContentReduction by Heat Treatment (%)
LectinContentReduction by Heat Treatment ( %)
Phytic Acid Content ( %)Flatulent Sugar Contents
Raffinose ( %)Stachyose ( %)
'Adapted from Thorn, 19812One sample.3Four samples.
intermediate intermediate93
very high
68- 80
very high100 90 -100
1.02 0.60 -0.75
0.05 0.28 -0.981.10 3.27 -5.45
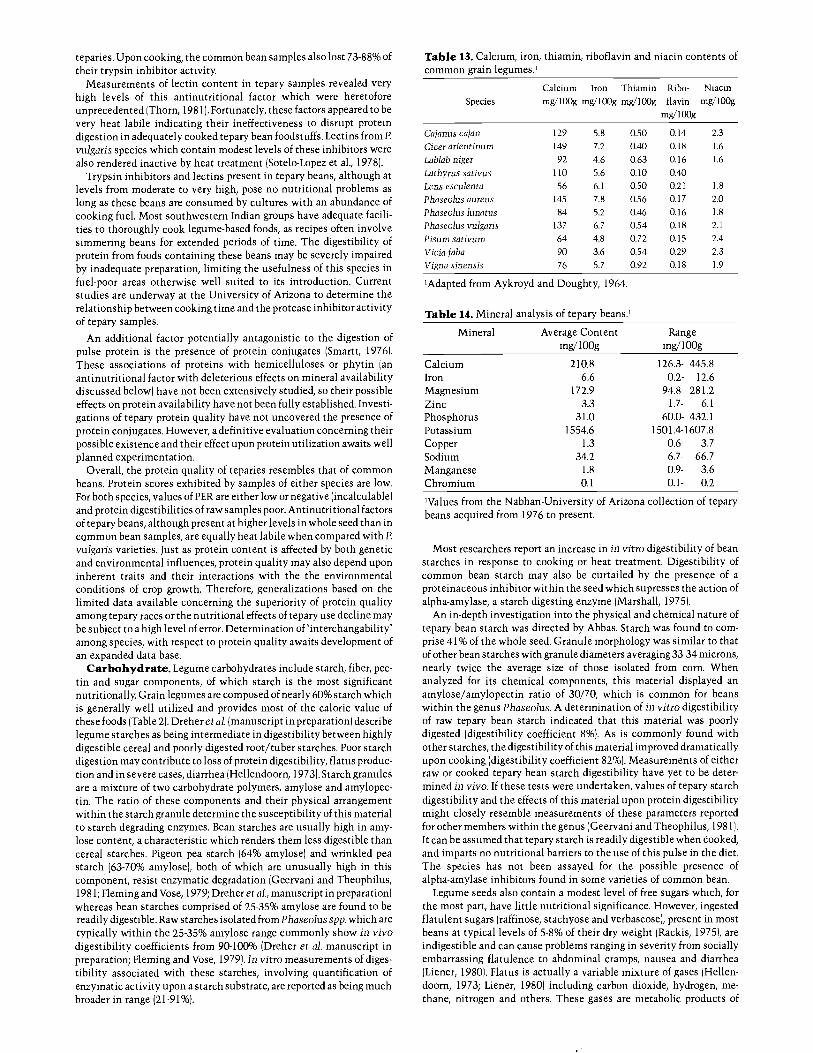
teparies. Upon cooking, the common bean samples also lost 73 -88% oftheir trypsin inhibitor activity.
Measurements of lectin content in tepary samples revealed veryhigh levels of this antinutritional factor which were heretoforeunprecedented (Thorn, 1981(. Fortunately, these factors appeared to bevery heat labile indicating their ineffectiveness to disrupt proteindigestion in adequately cooked tepary bean foodstuffs. Lectins from P.vulgaris species which contain modest levels of these inhibitors werealso rendered inactive by heat treatment (Sotelo -Lopez et al., 1978).
Trypsin inhibitors and lectins present in tepary beans, although atlevels from moderate to very high, pose no nutritional problems aslong as these beans are consumed by cultures with an abundance ofcooking fuel. Most southwestern Indian groups have adequate facili-ties to thoroughly cook legume -based foods, as recipes often involvesimmering beans for extended periods of time. The digestibility ofprotein from foods containing these beans may be severely impairedby inadequate preparation, limiting the usefulness of this species infuel -poor areas otherwise well suited to its introduction. Currentstudies are underway at the University of Arizona to determine therelationship between cooking time and the protease inhibitor activityof tepary samples.
An additional factor potentially antagonistic to the digestion ofpulse protein is the presence of protein conjugates (Smartt, 1976).These associations of proteins with hemicelluloses or phytin (anantinutritional factor with deleterious effects on mineral availabilitydiscussed below) have not been extensively studied, so their possibleeffects on protein availability have not been fully established. Investi-gations of tepary protein quality have not uncovered the presence ofprotein conjugates. However, a definitive evaluation concerning theirpossible existence and their effect upon protein utilization awaits wellplanned experimentation.
Overall, the protein quality of teparies resembles that of commonbeans. Protein scores exhibited by samples of either species are low.For both species, values of PER are either low or negative (incalculable)and protein digestibilities of raw samples poor. Antinutritional factorsof tepary beans, although present at higher levels in whole seed than incommon bean samples, are equally heat labile when compared with P.vulgaris varieties. Just as protein content is affected by both geneticand environmental influences, protein quality may also depend uponinherent traits and their interactions with the the environmentalconditions of crop growth. Therefore, generalizations based on thelimited data available concerning the superiority of protein qualityamong tepary races or the nutritional effects of tepary use decline maybe subject to a high level of error. Determination of "interchangability"among species, with respect to protein quality awaits development ofan expanded data base.
Carbohydrate. Legume carbohydrates include starch, fiber, pec-tin and sugar components, of which starch is the most significantnutritionally. Grain legumes are composed of nearly 60% starch whichis generally well utilized and provides most of the caloric value ofthese foods (Table 2). Dreher et al. (manuscript in preparation) describelegume starches as being intermediate in digestibility between highlydigestible cereal and poorly digested root /tuber starches. Poor starchdigestion may contribute to loss of protein digestibility, flatus produc-tion and in severe cases, diarrhea (Hellendoorn, 1973. Starch granulesare a mixture of two carbohydrate polymers, amylose and amylopec-tin. The ratio of these components and their physical arrangementwithin the starch granule determine the susceptibility of this materialto starch degrading enzymes. Bean starches are usually high in amy-lose content, a characteristic which renders them less digestible thancereal starches. Pigeon pea starch (64% amylose) and wrinkled peastarch (63 -70% amylose), both of which are unusually high in thiscomponent, resist enzymatic degradation (Geervani and Theophilus,1981; Fleming and Vose, 1979; Dreher et al., manuscript in preparation)whereas bean starches comprised of 25 -35% amylose are found to bereadily digestible. Raw starches isolated from Phaseolus spp. which aretypically within the 25 -35% amylose range commonly show in vivodigestibility coefficients from 90 -100% (Dreher et al. manuscript inpreparation; Fleming and Vose, 1979). In vitro measurements of diges-tibility associated with these starches, involving quantification ofenzymatic activity upon a starch substrate, are reported as being muchbroader in range (21 -91 %).
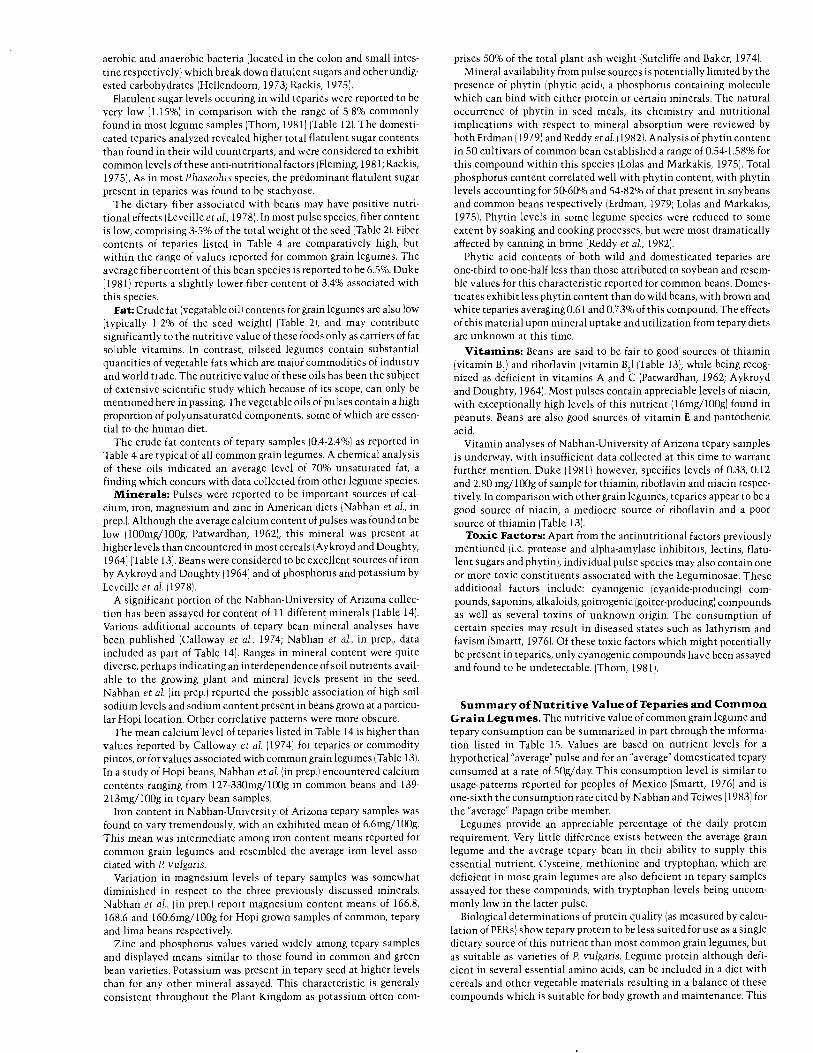
Table 13. Calcium, iron, thiamin, riboflavin and niacin contents ofcommon grain legumes.'
Species
Calcium Iron Thiamin Ribo- Niacinmg/100g mg/100g mg/100g flavin mg/100g
mg/100g
Cajanus cajan 129 5.8 0.50 0.14 2.3
Cicer arientinum 149 7.2 0.40 0.18 1.6
Lablab niger 92 4.6 0.63 0.16 1.6
Lathyrus sativus 110 5.6 0.10 0.40
Lens esculenta 56 6.1 0.50 0.21 1.8
Phaseolus aureus 145 7.8 0.56 0.17 2.0
Phaseolus lunatus 84 5.2 0.46 0.16 1.8
Phaseolus vulgaris 137 6.7 0.54 0.18 2.1
Pisum sativum 64 4.8 0.72 0.15 2.4
Vicia faba 90 3.6 0.54 0.29 2.3
Vigna sinensis 76 5.7 0.92 0.18 1.9
'Adapted from Aykroyd and Doughty, 1964.
Table 14. Mineral analysis of tepary beans.'
Mineral Average Contentmg/100g
Rangemg/100g
Calcium 210.8 126.3- 445.8Iron 6.6 0.2- 12.6
Magnesium 172.9 94.8- 281.2Zinc 3.3 1.7- 6.1
Phosphorus 31.0 60.0- 432.1Potassium 1554.6 1501.4- 1607.8
Copper 1.3 0.6- 3.7
Sodium 34.2 6.7- 66.7Manganese 1.8 0.9- 3.6Chromium 0.1 0.1- 0.2
'Values from the Nabhan- University of Arizona collection of teparybeans acquired from 1976 to present.
Most researchers report an increase in in vitro digestibility of beanstarches in response to cooking or heat treatment. Digestibility ofcommon bean starch may also be curtailed by the presence of aproteinaceous inhibitor within the seed which supresses the action ofalpha -amylase, a starch digesting enzyme (Marshall, 1975).
An in -depth investigation into the physical and chemical nature oftepary bean starch was directed by Abbas. Starch was found to corn-prise 41% of the whole seed. Granule morphology was similar to thatof other bean starches with granule diameters averaging 33 -34 microns,nearly twice the average size of those isolated from corn. Whenanalyzed for its chemical components, this material displayed anamylose /amylopectin ratio of 30/70, which is common for beanswithin the genus Phaseolus. A determination of in vitro digestibilityof raw tepary bean starch indicated that this material was poorlydigested (digestibility coefficient 8%). As is commonly found withother starches, the digestibility of this material improved dramaticallyupon cooking (digestibility coefficient 82 %). Measurements of eitherraw or cooked tepary bean starch digestibility have yet to be deter-mined in vivo. If these tests were undertaken, values of tepary starchdigestibility and the effects of this material upon protein digestibilitymight closely resemble measurements of these parameters reportedfor other members within the genus (Geervani and Theophilus, 1981).It can be assumed that tepary starch is readily digestible when cooked,and imparts no nutritional barriers to the use of this pulse in the diet.The species has not been assayed for the possible presence ofalpha -amylase inhibitors found in some varieties of common bean.
Legume seeds also contain a modest level of free sugars which, forthe most part, have little nutritional significance. However, ingestedflatulent sugars (raffinose, stachyose and verbascose), present in mostbeans at typical levels of 5 -8% of their dry weight (Rackis, 1975), areindigestible and can cause problems ranging in severity from sociallyembarrassing flatulence to abdominal cramps, nausea and diarrhea( Liener, 1980). Flatus is actually a variable mixture of gases (Hellen-doorn, 1973; Liener, 1980) including carbon dioxide, hydrogen, me-thane, nitrogen and others. These gases are metabolic products of
aerobic and anaerobic bacteria (located in the colon and small intes-tine respectively) which break down flatulent sugars and other undig-ested carbohydrates (Hellendoorn, 1973; Rackis, 1975).
Flatulent sugar levels occuring in wild teparies were reported to bevery low (1.15 %) in comparison with the range of 5 -8% commonlyfound in most legume samples (Thorn, 1981) (Table 12). The domesti-cated teparies analyzed revealed higher total flatulent sugar contentsthan found in their wild counterparts, and were considered to exhibitcommon levels of these anti -nutritional factors (Fleming, 1981; Rackis,1975). As in most Phaseolus species, the predominant flatulent sugarpresent in teparies was found to be stachyose.
The dietary fiber associated with beans may have positive nutri-tional effects (Leveille et al., 1978). In most pulse species, fiber contentis low, comprising 3 -5% of the total weight of the seed (Table 2). Fibercontents of teparies listed in Table 4 are comparatively high, butwithin the range of values reported for common grain legumes. Theaverage fiber content of this bean species is reported to be 6.5%. Duke(1981) reports a slightly lower fiber content of 3.4% associated withthis species.
Fat: Crude fat (vegatable oil) contents for grain legumes are also low(typically 1 -2% of the seed weight) (Table 2), and may contributesignificantly to the nutritive value of these foods only as carriers of fatsoluble vitamins. In contrast, oilseed legumes contain substantialquantities of vegetable fats which are major commodities of industryand world trade. The nutritive value of these oils has been the subjectof extensive scientific study which because of its scope, can only bementioned here in passing. The vegetable oils of pulses contain a highproportion of polyunsaturated components, some of which are essen-tial to the human diet.
The crude fat contents of tepary samples (0.4 -2.4 %) as reported inTable 4 are typical of all common grain legumes. A chemical analysisof these oils indicated an average level of 70% unsaturated fat, afinding which concurs with data collected from other legume species.
Minerals: Pulses were reported to be important sources of cal-cium, iron, magnesium and zinc in American diets (Nabhan et al., inprep.). Although the average calcium content of pulses was found to below (100mg /100g, Patwardhan, 1962), this mineral was present athigher levels than encountered in most cereals (Aykroyd and Doughty,1964) (Table 13). Beans were considered to be excellent sources of ironby Aykroyd and Doughty (1964) and of phosphorus and potassium byLeveille et al. (1978).
A significant portion of the Nabhan- University of Arizona collec-tion has been assayed for content of 11 different minerals (Table 14).Various additional accounts of tepary bean mineral analyses havebeen published (Calloway et al., 1974; Nabhan et al., in prep., dataincluded as part of Table 14). Ranges in mineral content were quitediverse, perhaps indicating an interdependence of soil nutrients avail-able to the growing plant and mineral levels present in the seed.Nabhan et al. in prep.) reported the possible association of high soilsodium levels and sodium content present in beans grown at a particu-lar Hopi location. Other correlative patterns were more obscure.
The mean calcium level of teparies listed in Table 14 is higher thanvalues reported by Calloway et al. (1974) for teparies or commoditypintos, or for values associated with common grain legumes (Table 13).In a study of Hopi beans, Nabhan et al. (in prep.) encountered calciumcontents ranging from 127- 330mg/ 100g in common beans and 139 -213mg/100g in tepary bean samples.
Iron content in Nabhan- University of Arizona tepary samples wasfound to vary tremendously, with an exhibited mean of 6.6mg/100g.This mean was intermediate among iron content means reported forcommon grain legumes and resembled the average iron level asso-ciated with P. vulgaris.
Variation in magnesium levels of tepary samples was somewhatdiminished in respect to the three previously discussed minerals.Nabhan et al., (in prep.) report magnesium content means of 166.8,168.6 and 160.6mg/100g for Hopi grown samples of common, teparyand lima beans respectively.
Zinc and phosphorus values varied widely among tepary samplesand displayed means similar to those found in common and greenbean varieties. Potassium was present in tepary seed at higher levelsthan for any other mineral assayed. This characteristic is generalyconsistent throughout the Plant Kingdom as potassium often com-
prises 50% of the total plant ash weight (Sutcliffe and Baker, 1974).Mineral availability from pulse sources is potentially limited by the
presence of phytin (phytic acid), a phosphorus containing moleculewhich can bind with either protein or certain minerals. The naturaloccurrence of phytin in seed meals, its chemistry and nutritionalimplications with respect to mineral absorption were reviewed byboth Erdman ( 1979) and Reddy et al. (1982). Analysis of phytin contentin 50 cultivars of common bean established a range of 0.54- 1.58% forthis compound within this species ( Lolas and Markakis, 1975). Totalphosphorus content correlated well with phytin content, with phytinlevels accounting for 50 -60% and 54 -82% of that present in soybeansand common beans respectively (Erdman, 1979; Lolas and Markakis,1975). Phytin levels in some legume species were reduced to someextent by soaking and cooking processes, but were most dramaticallyaffected by canning in brine (Reddy et al., 1982).
Phytic acid contents of both wild and domesticated teparies areone -third to one -half less than those attributed to soybean and resem-ble values for this characteristic reported for common beans. Domes-ticates exhibit less phytin content than do wild beans, with brown andwhite teparies averaging 0.61 and 0.73% of this compound. The effectsof this material upon mineral uptake and utilization from tepary dietsare unknown at this time.
Vitamins: Beans are said to be fair to good sources of thiamin(vitamin B1) and riboflavin (vitamin B2) (Table 13), while being recog-nized as deficient in vitamins A and C (Patwardhan, 1962; Aykroydand Doughty, 1964). Most pulses contain appreciable levels of niacin,with exceptionally high levels of this nutrient (16mg /100g) found inpeanuts. Beans are also good sources of vitamin E and pantothenicacid.
Vitamin analyses of Nabhan- University of Arizona tepary samplesis underway, with insufficient data collected at this time to warrantfurther mention. Duke (1981) however, specifies levels of 0.33, 0.12and 2.80 mg /100g of sample for thiamin, riboflavin and niacin respec-tively. In comparison with other grain legumes, teparies appear to be agood source of niacin, a mediocre source of riboflavin and a poorsource of thiamin (Table 13).
Toxic Factors: Apart from the antinutritional factors previouslymentioned (i.e. protease and alpha -amylase inhibitors, lectins, flatu-lent sugars and phytin), individual pulse species may also contain oneor more toxic constituents associated with the Leguminosae. Theseadditional factors include: cyanogenic (cyanide -producing) corn -pounds, saponins, alkaloids, goitrogenic (goiter -producing) compoundsas well as several toxins of unknown origin. The consumption ofcertain species may result in diseased states such as lathyrism andfavism (Smartt, 1976). Of these toxic factors which might potentiallybe present in teparies, only cyanogenic compounds have been assayedand found to be undetectable. (Thorn, 1981).
Summary of Nutritive Value of Teparies and CommonGrain Legumes. The nutritive value of common grain legume andtepary consumption can be summarized in part through the informa-tion listed in Table 15. Values are based on nutrient levels for ahypothetical "average" pulse and for an "average" domesticated teparyconsumed at a rate of 50g /day. This consumption level is similar tousage patterns reported for peoples of Mexico (Smartt, 1976) and isone -sixth the consumption rate cited by Nabhan and Teiwes (1983) forthe "average" Papago tribe member.
Legumes provide an appreciable percentage of the daily proteinrequirement. Very little difference exists between the average grainlegume and the average tepary bean in their ability to supply thisessential nutrient. Cysteine, methionine and tryptophan, which aredeficient in most grain legumes are also deficient in tepary samplesassayed for these compounds, with tryptophan levels being uncom-monly low in the latter pulse.
Biological determinations of protein quality (as measured by calcu-lation of PERs) show tepary protein to be less suited for use as a singledietary source of this nutrient than most common grain legumes, butas suitable as varieties of P. vulgaris. Legume protein although defi-cient in several essential amino acids, can be included in a diet withcereals and other vegetable materials resulting in a balance of thesecompounds which is suitable for body growth and maintenance. This

Table 15. Percentage of the recommended dietary allowance supplied by daily consumption of 50g of an "average tepary bean" and a hypothetical"average" grain legume.'
Content in 50g Content in 50g RDA Adultaa Portion of RDA Portion of RDANutrient "Average" Grain "Average" Tepary Range Supplied by Supplied by
Legume Bean Grain Legume Tepary Bean
Calories 170 160 1800 -2900 5.9 -9.4 5.5 -8.9
Protein 11.3g 11.6g 44 -56g 20.2 -25.7 20.7 -26.4
Thiamin 0.26mg 0.17mg4 1.0 -1.5mg 17.7 -26.5 11.3 -17.0
Riboflavin 0.10mg 0.06mg4 1.2 -1.7mg 5.9 -8.3 3.5 -5.0
Niacin 1.00mg 1.40mg4 13 -19mg 5.3 -7.7 7.4 -10.8
Calcium 51.5mg 105.4mg 800mg 6.4 13.2
Iron 2.9mg 3.3mg 10 -18mg 15.8 -28.5 18.3 -33.0
'Calculated from values reported in Tables 2, 4, 13 and 14.'Source: National Research Council, National Academy of Sciences, 1980.3Healthy adults not pregnant or lactating) who are 19 years of age or older.',Source: Duke, 1981.
protein is readily available when several antinutritional factors areabsent or when proper preparation and cooking practices have ren-dered them ineffectual. Although common levels of protease inhibi-tors and extremely high lectin contents are found among teparysamples, they have been shown to be heat sensitive. Inhibitory effectsof these molecules upon protein digestion of tepary diets will only bemanifested if consumed by cultures with inadequate cooking fuelsupplies.
Grain legumes are not good sources of vegetable oil, a characteristicwhich is also inherent in tepary beans.
Starch which is present in all grain legumes provides the bulk ofneeded dietary calories. Tepary beans are similar in carbohydratecontent to other grain legumes and when consumed in equal amounts,provide a similar portion of the daily energy requirement. Althoughtepary starch digestibility is poor in its raw state, normal cookingprocedures render this material readily digestible. Flatulent sugarspresent in teparies and other legumes detract from the value of thesecommodities as food sources, but with proper handling and process-ing, their effects can be minimized.
The average grain legume depicted in Table 15 is a good source ofthiamin and a relatively poor source of both riboflavin and niacin. Theaverage tepary contains less thiamin and riboflavin, but more niacinthan the hypothetical average pulse.
The calcium content of the tepary sample supplied over twice asmuch of the daily dietary requirement of this mineral than did theaverage grain legume, whereas contributions of needed iron fromeither pulse source were comparable. High phytin contents associatedwith beans may limit the availability of both protein and minerals.
Nutritional Significance of Tepary ConsumptionInformation currently available on the nutritional aspects of tepary
beans is based on analytical results from single or limited seed stocks.The volume of analyses needed to delineate inherent differences innutritional quality among tepary races or varieties, or to adequatelycompare the nutritional quality of teparies to that of other legumeshas yet to be completed. Environmental effects of cropping tech-niques, harvest and storage conditions as well as preparation andcooking methods upon nutritional quality are unknown or poorlyunderstood.
Nevertheless, an overall view of the known nutritional attributes oftepary beans results in acknowledgement of the similarities of thislegume with common beans and other grain legumes consumedworldwide. Perhaps the true significance of tepary beans lies notwithin the context of "superior" nutritional quality, but rather in itsability to produce a seed crop under conditions which cause morecommonly grown legumes to fail.
In an agriculturally rich and well developed country such as theUSA, where a reliance upon local food production is unnecessary forsurvival, the nutritional significance of a decline in tepary use may be
difficult to assess accurately. However, if teparies were to be intro-duced into lesser developed areas of the world suitable to their culture,their nutritional significance may possibly be measured by the differ-ence between adequate legume procurement or crop failure.
Introduction of Tepary Beans to Other Arid /Semi -aridEnvironments
Arid lands such as those of the Sonoran desert of North America arewell suited to the production of tepary beans. The main adaptiveadvantage of this legume is that of drought avoidance through earlymaturation of a seed crop (60 -70 days). This physiological pheno-menon together with traditional Indian floodwater farming tech-niques allowed indigenous peoples to produce tepary crops mostseasons without the aid of ground -water or conventional irrigation.
What then can be said about the suitability of teparies for use inother arid lands where subsistence agricultural systems may be vitalto the survival of the resident populations? The National Academy ofSciences (1979) recommends the species' introduction to areas inAfrica, South America, Asia, the Middle East and arid Pacific andCaribbean islands. In addition to use as a subsistence crop, tepariesmay also hold promise as a valuable commodity produced in arid areasof well developed nations such as Australia and the United States.
Little published information is available concerning attempts tointroduce teparies to other areas potentially suited to their culture.However, these beans have been introduced in several areas on theAfrican continent.
"Its (tepary bean's) introduction to Africa appears to date mainly from the periodbetween the First and Second World Wars. Its original home is said to be thesouth of North America, where many varieties are known. In Madagascar beforethe second world war it was favorably received and even preferred to Vigna andDolichos (Lablab). It was introduced into French -speaking Africa in the thirtiesand into Central and East Africa and the Congo about the same time. It is grownas far south as Lesotho and Botswana and appears to thrive as an upland crop inthe sub -Saharan areas of the Sudan savanna. It can also be grown on residual soilmoisture. In humid regions the complete lack of dormancy is a disadvantage asthe ripe seeds are ejected from the pods and will germinate immediatelyResearch is being continued on the crop in Kenya." (Stanton, 1966).
Cultural information gathered from areas where teparies have beenintroduced, perhaps revealing the adaptive potential of the species, isalmost non -existent.
Successful incorporation of a new legume food source into anyagricultural system will require not only its suitability of crop growthin the trial environment, but also the acceptance of traditionallyprepared foods containing the pulse by the producing populace.Recent research at the University of Arizona determined the accepta-bility of tepary beans in 5 traditional north African and middle Easternrecipes. The sensory quality and flavor of these foods were judged to beacceptable by students who were natives of the areas in question.When non -native judges tasted the same 5 recipes prepared with
56 Desert Plants 5(1)
either tepary beans or the traditional pulse (cowpeas or broad beans),they either preferred the food product containing teparies or had nopreference for foods containing either pulse source.
As stated earlier, introduction of tepary beans into fuel -poor areasmay precipitate potential nutritional hazards as these beans require asomewhat lengthy cooking time to counteract several antinutritionalfactors. Detailed experimentation to quantify protease inhibitors andlectins in raw and cooked tepary food samples and to explore therelationship between cooking time and the destruction of these nutri-tional antagonists are currently underway.
If the nutritional significance of this species lies in its ability toprovide a needed food source where growth of similar legumes mightfail, then the decline in tepary production and use by southwesternIndian groups may be potentially detrimental to the nutritional statusof many arid land dwellers. Tepary introduction to cultures which aremore dependent upon subsistence techniques might be greatly facili-tated by the availability of diverse germ plasm sources. However, thedecline or abandonment of floodwater agriculture in the Southwesthas resulted in the loss of familial seed stocks through decreased seedviability ( Nabhan et al., 1980), and thus, a loss of potential adaptabilityto areas where this species might serve as a major source of nutrition.
References
Aykroyd, W.R. and J. Doughty. 1964. Legumes in Human Nutrition.Food and Agriculture Organization of the United Nations, Rome.
Bressani, R. 1975. Legumes in human diets and how they might be improved.In M. Milner (ed.), Nutritional Improvement of Food Legumes by Breed-ing. John Wiley and Sons, New York.
Bouscaren, S.J., J.G. Waines and L.A. Boykin -Bouscaren. 1983. Cultivation anduse of teparies in Sonora, Mexico. Desert Plants, this issue.
Calloway, D.H., R.D. Giaque and F.M. Costa. 1974. The superior mineralcontent of some Indian foods in comparison to federally donated counter-part commodities. Ecol. Food Nutr. 3: 203.
Cerighelli, R. 1959. Contribution a l'Etude Chimique de quelques Legumi-neuses Tropicales. O.R.A.N.A., Dakar.
Clark, H.E., J.E. Malzer, H.M. Onderka, J.M. Howe and W.H. Moon. 1973Nitrogen balances of adult human subjects fed combinations of wheat,beans, corn, milk and rice. Am. J. Clin. Nutr. 26: 702.
Cossack, Z.T. 1980. Evaluation of Protein Quality Using Mice vs. Rats. Dis-sertation. University of Arizona, Tucson.
Doughty, J. and R. Orraca -Tetteh. 1966. The contribution of legumes toAfrican diets. In Stanton, W.R. Grain Legumes in Africa. Food and Agri-culture Organization of the United Nations, Rome.
Dreher, M.L., J.W. Berry and C.J. Dreher. Starch digestibility: a nutritionalperspective. Manuscript in preparation.
Duke, J.A. 1981. Handbook of Legumes of World Economic Importance.Plenum Press, New York.
Dupin, H. et al., 1963. Etude des Aliments de l'Ouest African Envisages sousl'Angle de l'Apport en Proteines. O.R.A.N.A., Dakar
Dutra de Oliveira, J.E. 1973. Studies on the nutritive value of beans. in Jaffe, W.G. (ed.(, Nutritional Aspects of Common Beans. Achivos Latinoamerica-nos de Nutricion, Caracas.
Earle, ER. and Q. Jones. 1962. Analyses of seed samples from 113 plantfamilies. Econ. Bot. 16: 221
Elias, L.G., R. P. Bates and R. Bressani. 1969. Mesclas vegetales para consumohumano. XVIII. Desarrollo de la vegetal INCAP 17, a base de semillasleguminosas. Arch. Latinoamer. Nutr. 19: 109.
Erdman, J.W. Jr. 1979. Oilseed phytates: nutritional implications. I. Am. OilChem. Soc. 56: 736.
Felger, R.S. and G. P. Nabhan. 1976. Deceptive barrenness. Ceres /FAO Rev. onDevel. 50: 34.
Fleming, S. E. 1981. A study of relationships between flatus potential andcarbohydrate distribution in legume seeds. f. Food Sci. 46: 794.
Food and Agriculture Organization of the United Nations. 1982. 1981 FAOProduction Yearbook, Vol. 35, FAO Statistics Series No. 40, Rome.
Freeman, G. F. 1912. Southwestern Beans and Teparies. Arizona Agr. Exp. Sta.Bulletin 68.
Freeman, G. E 1913. Tepary, a new cultivated legume from the Southwest. Bot.Gaz. 56: 395.
Spring, 1983
Garcia, E 1917. New Mexico Beans. New Mexico Agr. Exp. Sta. Bulletin 105.Geervani, P. and F. Theophilus. 1981. Influence of legume starches on protein
utilization and availability of lysine and methionine to albino rats. I. FoodSci. 46: 817.
Hellendoorn, E. W. 1973. Carbohydrate digestibility and flatulence activity ofbeans. in Jaffe, W. G. (ed.), Nutritional Aspects of Common Beans. ArchivosLatinamericanos de Nutricion, Caracas.
Hendry, G. W. 1918. Bean Culture in California. California Agr. Exp. Sta.Bulletin 294.
Jaffe, W G. 1975. Factors affecting the nutritional value of beans. in Milner,M., Nutritional Improvement of Food Legumes by Breeding. John Wileyand Sons, New York.
Jaffe, W. G. 1980. Hemagglutinins (lectins /. In Liener, I.E. (ed.), Toxic Constit-uents of Plant Foodstuffs. Academic Press, New York.
Liener, I. E. 1980. Miscellaneous toxic factors. in Liener, I. E. (ed.), ToxicConstituents of Plant Foodstuffs. Academic Press, New York.
Liener, I. E. and M. L. Kakade. 1980. Protease inhibitors. in Liener, I. E. (ed.),Toxic Constituents of Plant Foodstuffs. Academic Press, New York.
Leveille, G. A., S. S. Morley and D. D. Harpstead. 1978. Beans - a food resource.in Robertson, Farzier (ed.), Dry Bean Production. Michigan St. Agr. Exp.Sta. Bulletin E -1251.
Lolas, G. M. and P. Markakis. 1975. Phytic acid and other phosphorus com-pounds of beans (Phaseolus vulgaris L./. J. Agr. Food Chem. 23: 13.
Marshall, J. J. 1975. Alpha- amylase inhibitors from plants. In Jennes, A. and J.Hodge (eds.), Physiological Effects of Food Carbohydrates. AmericanChemical Society, Washington, D.C.
Nabhan, G. P. 1976. Teparies and other native beans (Phaseolus( in South-western North America. J. Ariz. Acad. Sci. 11: 18.
Nabhan, G. P. 1978. Tepary Bean Domestication: Ecological and NutritionalChanges During Phaseolus acutifolius Evolution. Thesis, Univ. of Ari-zona, Tucson.
Nabhan, G. P., J. W. Berry, C. Anson and C. W. Weber. 1980. Papago Indianfloodwater fields and tepary bean protein yields. Ecol. Food Nutr. 10: 71.
Nabhan, G. P. and R. S. Felger. 1978. Teparies in Southwestern North America,a biogeographical and ethnohistorical study of Phaseolus acutifolius.Econ. Bot. 32: 3.
Nabhan, G. P. and H. Teiwes. 1983. Tepary beans, O'odham farmers and desertfields. Desert Plants, this issue.
Nabhan, G. P., C. W. Weber and J. W. Berry. 1979. Legumes in the Papago -PimaIndian diet and ecological niche. Kiva 44: 173.
Nabhan, G. P., C. W. Weber and J.W. Berry. In prep. Variation in composition ofHopi Indian beans.
National Academy of Sciences, National Research Council. 1971. Atlas of Nutri-tional Data on the United States and Canadian Feeds. National Academy ofSciences, Washington, D.C.
National Academy of Sciences, National Research Council. 1979. TropicalLegumes: Resources for the Future. National Academy of Sciences, Washing-ton, D.C.
National Academy of Sciences, National Research Council. 1980. RecommendedDietary Allowances. 9th ed. National Academy of Sciences, Washington,D.C.
Orraca -Tetteh, R. 1973. The vital role of legumes in human nutrition. in Jaffe,W.G. (ed./, Nutritional Aspects of Common Beans. Archivos Latino -americanos de Nutricion, Caracas.
Patwardhan, V.N. 1962. Pulses and beans in human nutrition. Am. f. Clin. Nutr.11:12.
Phansalkar, S.V., M. Ramachandran and V.N. Patwardhan, 1958. Indian f. Med.Res. 46: 333.
Rackis, J.J. 1975.Oligosaccharides of food legumes: alpha galactosidase activityand the flatus problem. In Jeanes, A. and J. Hodge (eds.(, Physiological Effectsof Food Carbohydrates. American Chemical Society, Washington, D.C.
Reddy, N.R., S.K. Sathe and D.K. Salunkhe. 1982. Phytates in legumes and cereals.Adv. Food Res. 28:1.
Siegel, A.S. and B. Fawcett. 1976. Food Legumes Processing and Utilization.International Development Research Centre, Ottawa.
Smartt, J. 1976. Tropical Pulses. Longman Group Ltd., London.Sotelo -Lopez, A., M. Hernandez -Infante and M.E. Arteaga -Cruz. 1978. Arch.
Invest. Med. 9:1.Stanton, W.R. 1966. Grain Legumes in Africa. Food and Agriculture Organization,
United Nations, Rome.Sutcliffe, J.E and D.A. Baker. 1974. Plants and Mineral Salts. Eward Arnold Ltd.,
London.Thorn, K.A. 1981. Antinutritional Factors in Legumes of the Sonoran Desert.
Thesis, University of Arizona, Tucson.Waines, J.G. 1978. Protein contents, grain weights, and breeding potential of wild
and domesticated tepary beans. Crop Sci. 18:587.