Embed Size (px)
Citation preview

The Obesity Paradox:
BMI Related Health and
Mortality Outcomes
Gordon L Jensen, MD, PhD
Department of Nutritional Sciences
Penn State University

Objectives
Mortality outcomes
Health outcomes
The obesity paradox
– Are there benefits?
Confounding variables

How does body weight
affect health?
Obesity
– Impact on duration of
life
– Associated with
premature disease
– Functional decline
Underweight
– Nurses Health Study
found lowest mortality
for those weighing 15%
below national average.
– Confounded by smoking
and disease

Obesity / Mortality
Early studies that did not show relationship
were confounded by smoking.
Obesity does not generally confer health benefit
J-shaped mortality curve in relation to BMI
Associated with all cause mortality
Stronger predictor at younger ages
Associated with decreased life expectancy
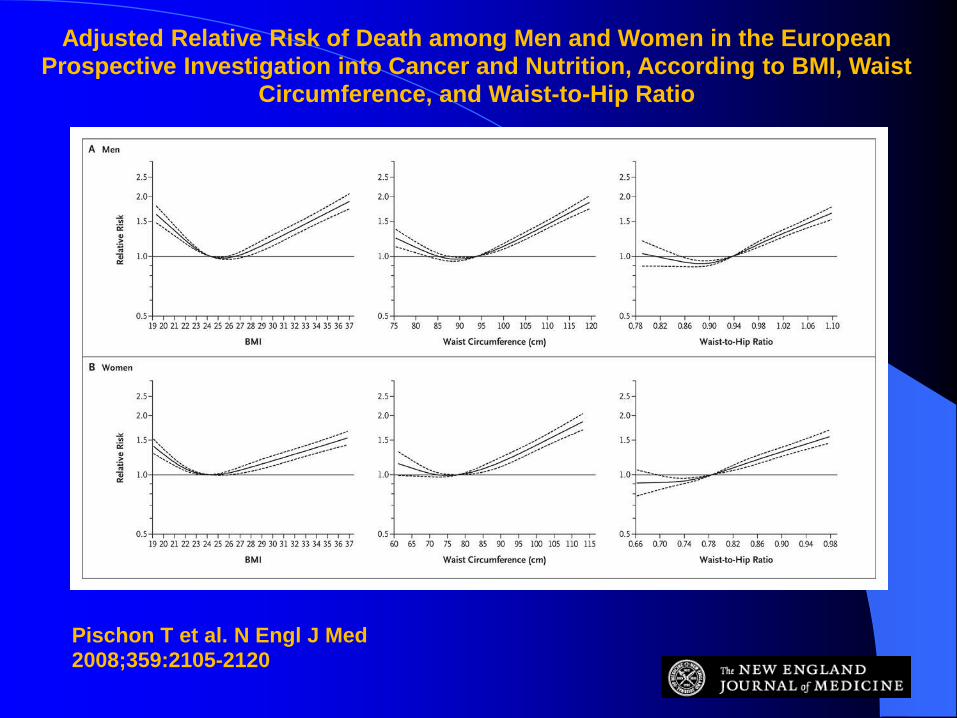
Adjusted Relative Risk of Death among Men and Women in the European Prospective Investigation into Cancer and Nutrition, According to BMI, Waist
Circumference, and Waist-to-Hip Ratio
Pischon T et al. N Engl J Med 2008;359:2105-2120

Obesity related co-morbidities
Cardiovascular disease /
hypertension
Sleep apnea / obesity
hypoventilation
Diabetes
Dyslipidemia
Metabolic syndrome
Hirsutism, menstrual
disorders, preeclampsia,
endometrial disorders
Cholecystitis / cholelithiasis
Malignancy
– colon
– prostate
– endometrium
– cervical
– ovarian
– breast
Osteoarthritis – destructive
joint disease
Gout

Functional decline
among obese older
persons.

Flegal, K. M. et al. JAMA
2007;298:2028-2037 Cause specific excess deaths associated with
underweight, overweight, and obesity?
NHANES follow up combined with vital statistics
data.
6,859 persons with 571,042 person years follow up – BMI <18.5 – more non-cancer, non-CVD deaths
– BMI 25-29.9 – fewer non-cancer, non-CVD deaths
– BMI ≥30 – more CVD deaths, more cancers considered to be
obesity-related
BMI-mortality association varies by cause of death.

Copyright restrictions may apply.
Flegal, K. M. et al. JAMA 2007;298:2028-2037.
Excess Deaths by Body Mass Index Category for Subgroups of Cardiovascular Disease and Cancer Deaths--Balanced Follow-up
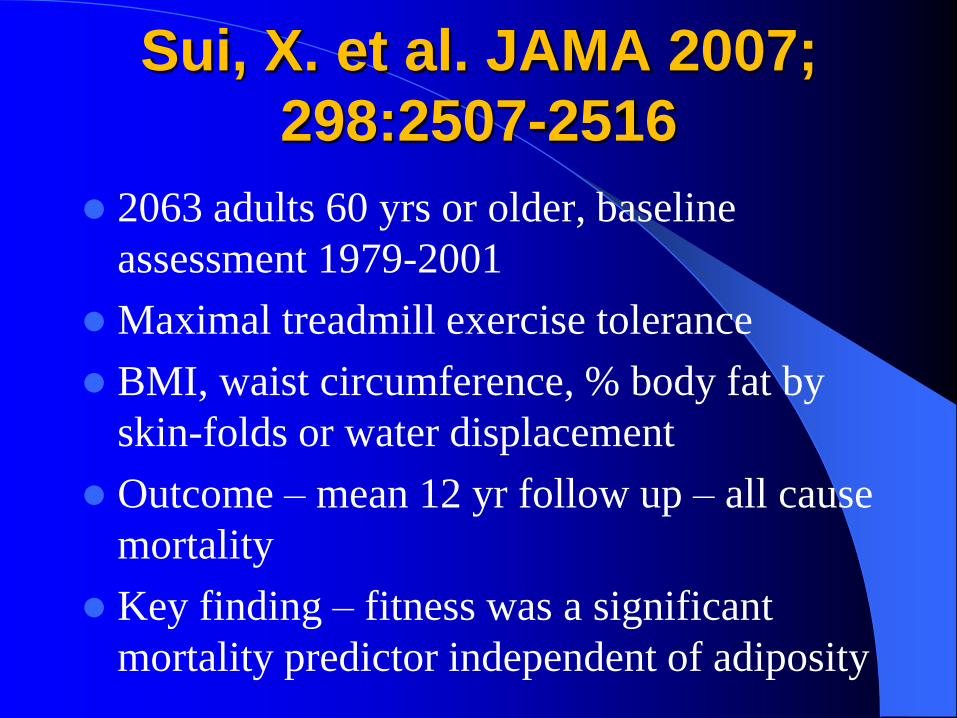
Sui, X. et al. JAMA 2007;
298:2507-2516
2063 adults 60 yrs or older, baseline
assessment 1979-2001
Maximal treadmill exercise tolerance
BMI, waist circumference, % body fat by
skin-folds or water displacement
Outcome – mean 12 yr follow up – all cause
mortality
Key finding – fitness was a significant
mortality predictor independent of adiposity

Copyright restrictions may apply.
Sui, X. et al. JAMA 2007;298:2507-2516.
Joint Associations of Cardiorespiratory Fitness (Fitness) and Adiposity Measures With All-Cause Mortality--Aerobics
Center Longitudinal Study, 1979-2003a
Wildman, R. P. et al. Arch
Intern Med 2008;168:16
5440 NHANES 1999-2004 participants
NIH BMI cut points
Cardio-metabolic abnormalities
– Elevated BP, triglycerides, fasting glucose,
C-reactive protein, and insulin resistance;
low HDL cholesterol
Findings – half of overweight and one-third of
obese were “metabolically healthy”, while
23.5% of normal weight were abnormal

Copyright restrictions may apply.
Wildman, R. P. et al. Arch Intern Med 2008;168:1617-1624.
Age-standardized prevalence of cardiometabolic abnormalities by body size and sex (A, men; B, women)
A -male,
B -female
Abnormal =
≥2 metabolic
abnormalities

The obesity paradox in the
elderly: potential mechanisms
and clinical implications.
Oreopoulos A, Clin Geriatr Med. 2009;
Nov;25(4):643-59.
In the elderly, obesity is paradoxically
associated with a lower, not higher,
mortality risk.

Fat mass protective in
hospitalized elderly?
Bouillanne O, AJCN 2009;90:505-10.
125 older patients, body composition by
DEXA and BIA
Fat mass was associated with reduced
mortality and complications, while there was
no relationship with lean mass or appendicular
muscle mass.
Association of all-cause
mortality with BMI categories
Flegal KM, at al. JAMA 2013;309:71-82.
Systematic review and meta-analysis
– Prospective studies that applied standard BMI
categories to general populations of adults.
– 97 studies with 2.88 million persons and 270K deaths
Referent to desirable BMI, class 2 and 3 obesity
had significantly greater all-cause mortality while
class 1 obesity was not associated with higher
mortality and overweight was associated with
significantly lower mortality.
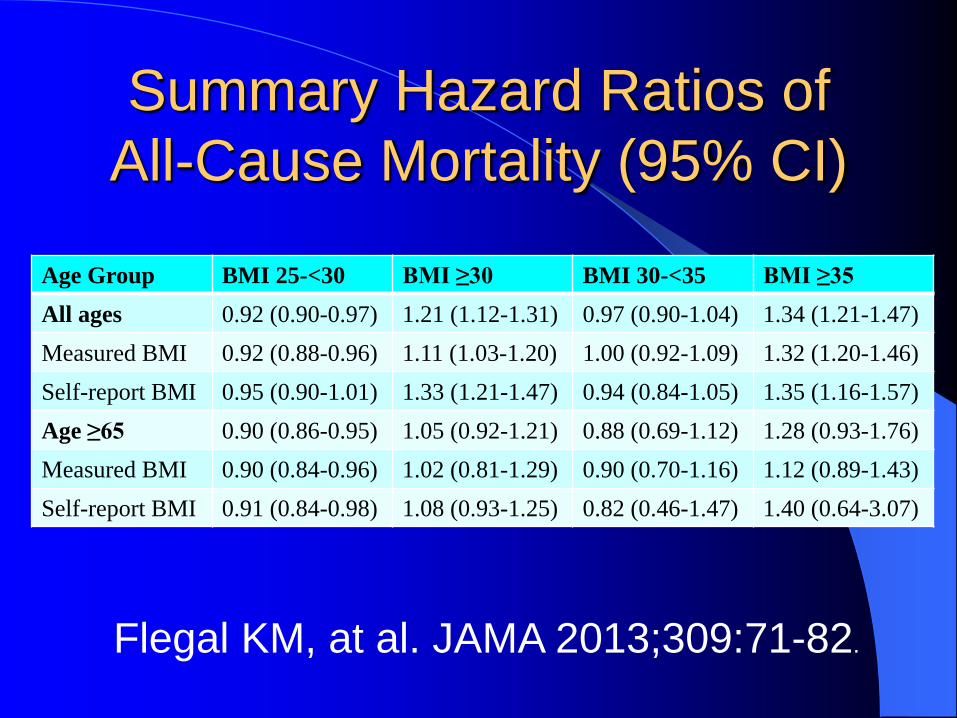
Summary Hazard Ratios of
All-Cause Mortality (95% CI)
Age Group BMI 25-<30 BMI ≥30 BMI 30-<35 BMI ≥35
All ages 0.92 (0.90-0.97) 1.21 (1.12-1.31) 0.97 (0.90-1.04) 1.34 (1.21-1.47)
Measured BMI 0.92 (0.88-0.96) 1.11 (1.03-1.20) 1.00 (0.92-1.09) 1.32 (1.20-1.46)
Self-report BMI 0.95 (0.90-1.01) 1.33 (1.21-1.47) 0.94 (0.84-1.05) 1.35 (1.16-1.57)
Age ≥65 0.90 (0.86-0.95) 1.05 (0.92-1.21) 0.88 (0.69-1.12) 1.28 (0.93-1.76)
Measured BMI 0.90 (0.84-0.96) 1.02 (0.81-1.29) 0.90 (0.70-1.16) 1.12 (0.89-1.43)
Self-report BMI 0.91 (0.84-0.98) 1.08 (0.93-1.25) 0.82 (0.46-1.47) 1.40 (0.64-3.07)
Flegal KM, at al. JAMA 2013;309:71-82.

Lowest mortality shifts towards
higher BMI for older persons
Source: Childers, D.K. & Allison, D.B. Int.
J. obesity 34, 1231–1238 (2010).

BMI and all-cause
mortality at advanced age
Ford DW, et al. J of Nutr in Gerontology and
Geriatrics. 2014;33:23-34.
2,995 participants (1,267 male, 1,728 female);
mean age 81.4 years, followed mean 3.1 years
BMI < 18.5 was associated with increased
mortality (HR 1.85, 95% CI 1.09-3.14, P=0.02),
while a BMI of 25–29.9 was associated with
decreased risk of mortality (HR 0.71 95% CI 0.55-
0.91, P=0.007). Reference range BMI 18.5-24.9.

Sarcopenic obesity
Sarcopenic
Obesity

Overweight only protective in
patients with high muscle mass
Murphy RA, et al. Diabetes Care 2014; 37:3213-9.
AGES-Reykjavik cohort, 637 participants with
diabetes aged 66-96 years old.
Median follow up 6.66 years.
Thigh muscle by CT scan.
Highest mortality in those with low muscle mass in
either normal or overweight.
Normal weight participants had elevated mortality
risk compared to overweight. This paradox was
partly mediated by muscle size.
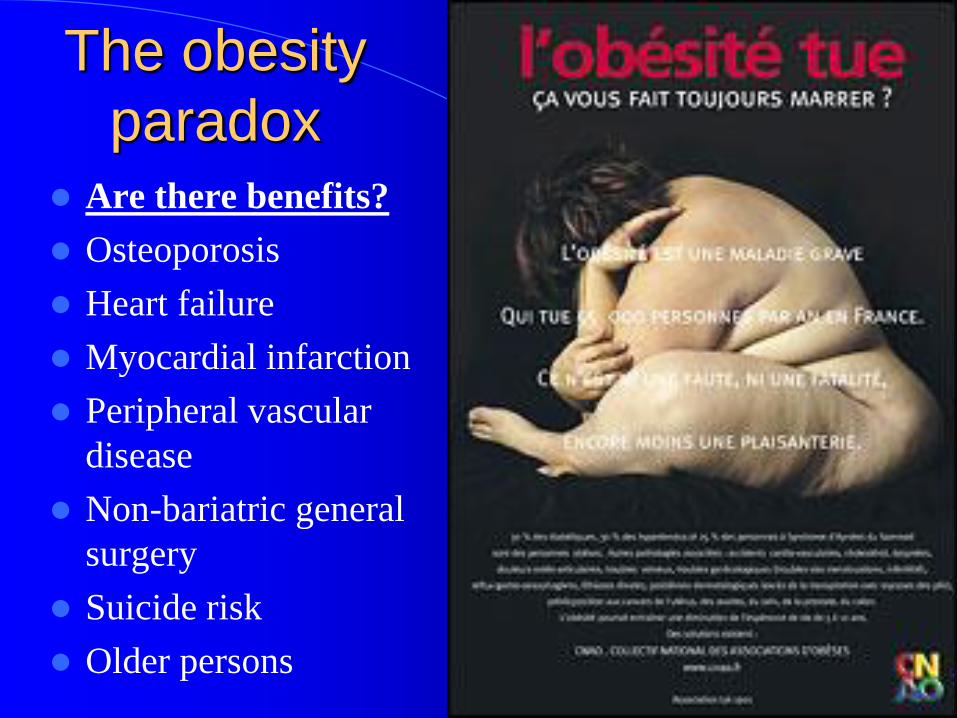
The obesity
paradox Are there benefits?
Osteoporosis
Heart failure
Myocardial infarction
Peripheral vascular
disease
Non-bariatric general
surgery
Suicide risk
Older persons
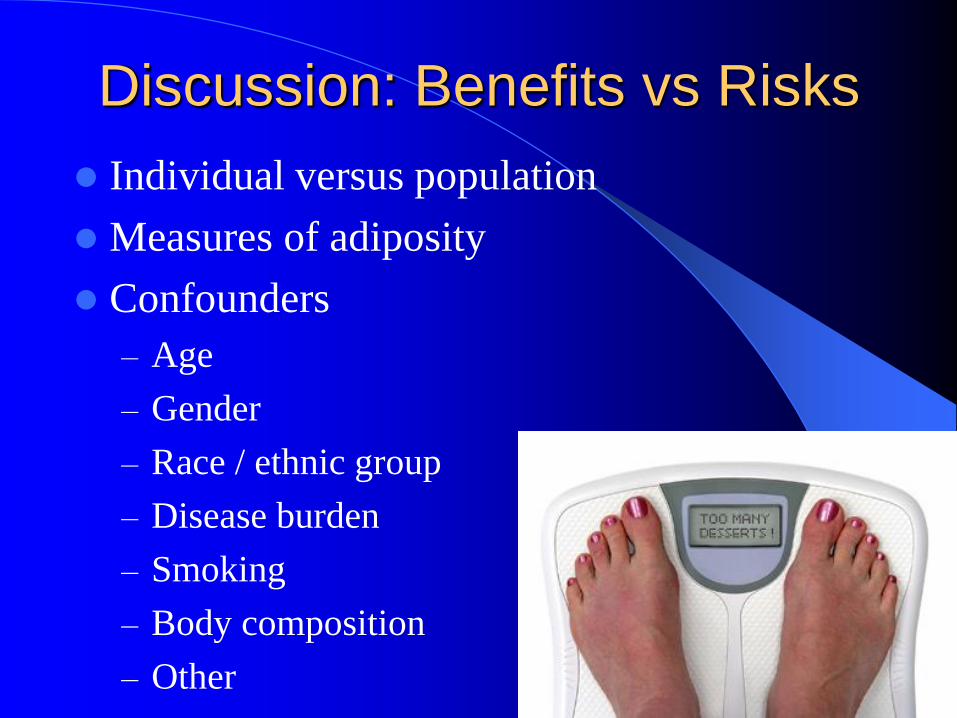
Discussion: Benefits vs Risks
Individual versus population
Measures of adiposity
Confounders
– Age
– Gender
– Race / ethnic group
– Disease burden
– Smoking
– Body composition
– Other
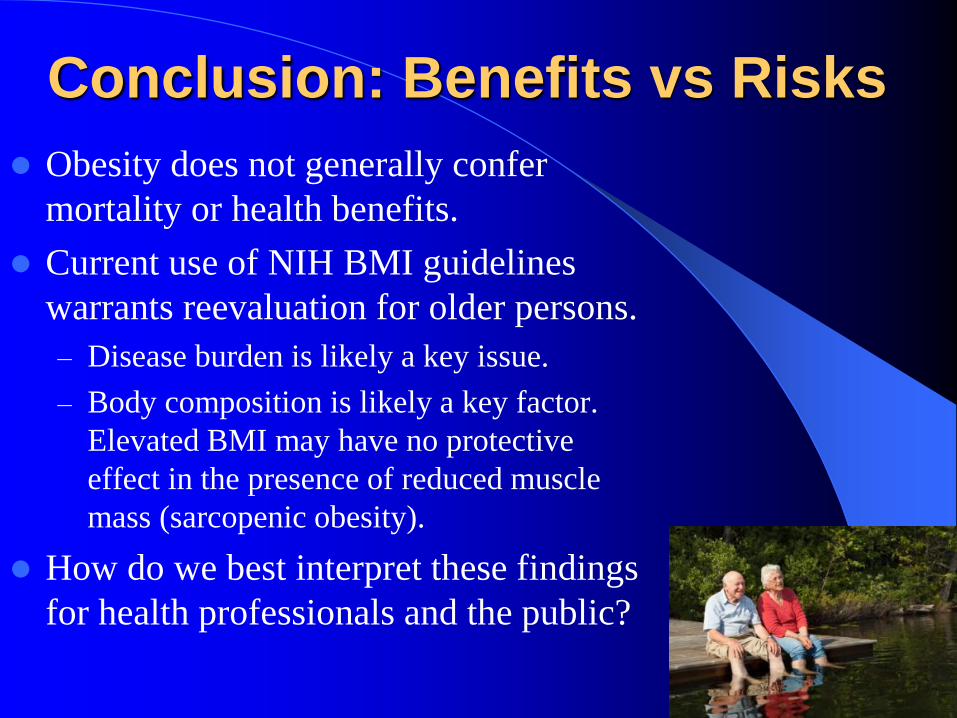
Conclusion: Benefits vs Risks
Obesity does not generally confer
mortality or health benefits.
Current use of NIH BMI guidelines
warrants reevaluation for older persons.
– Disease burden is likely a key issue.
– Body composition is likely a key factor.
Elevated BMI may have no protective
effect in the presence of reduced muscle
mass (sarcopenic obesity).
How do we best interpret these findings
for health professionals and the public?