Embed Size (px)
Citation preview
The OBR:
Working at the UK’s fiscal watchdog
Presentation to the Adam Smith Business School
University of Glasgow
Andy King
Chief of Staff
Office for Budget Responsibility
6 November 2015

Background
The Office for Budget Responsibility
• Created in 2010 to provide independent and
authoritative analysis of the public finances
• Produces the UK’s Budget and Autumn Statement
forecasts of the economy and public finances
• Assesses UK Government progress against fiscal targets
• Reports on the sustainability of the public finances and
the health of the public sector balance sheet
• Scrutinises UK Government’s costing of policy measures
• Objective to make fiscal forecasts and costings unbiased
and clear, but we have no role in making or commenting
on Government policy
Core outputs of the OBR
Core outputs of the OBR
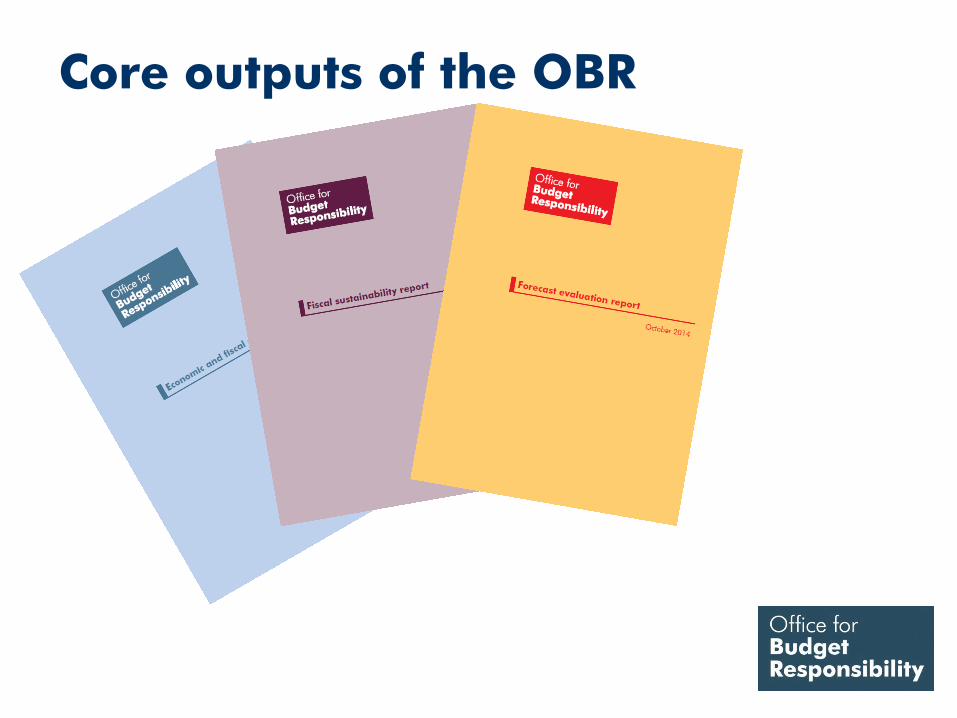
Core outputs of the OBR
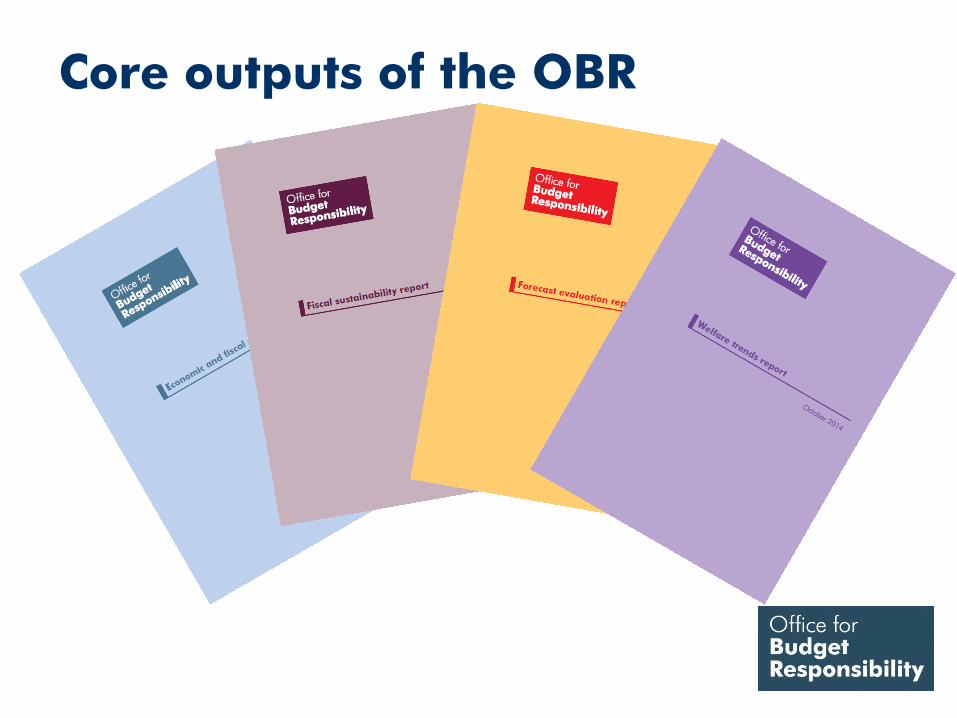
Core outputs of the OBR
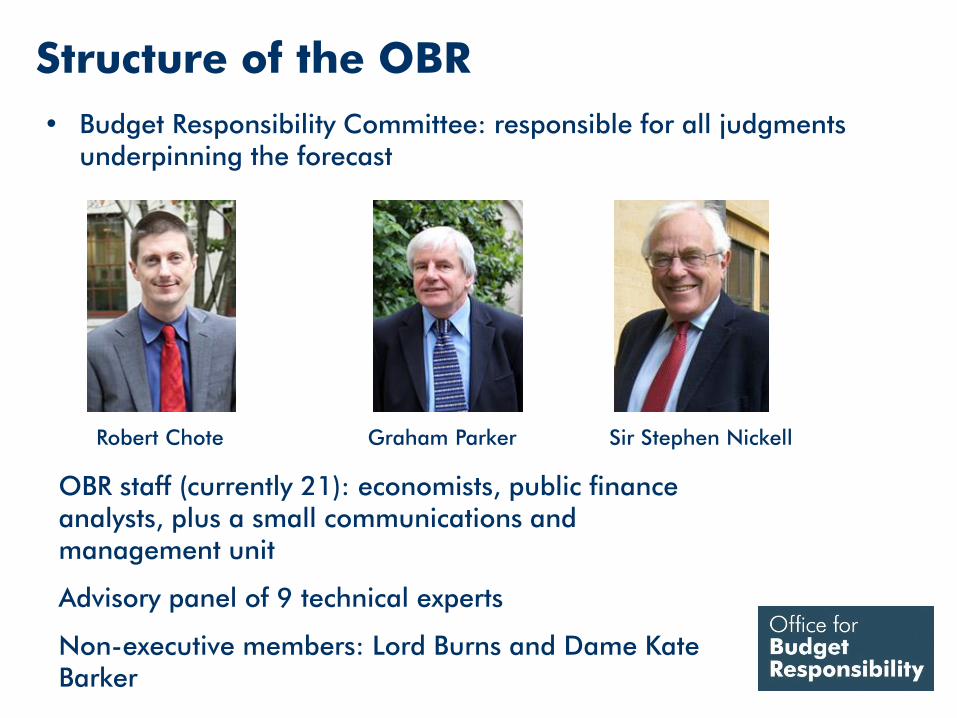
Structure of the OBR
• Budget Responsibility Committee: responsible for all judgments underpinning the forecast
Robert Chote Graham Parker Sir Stephen Nickell
OBR staff (currently 21): economists, public finance analysts, plus a small communications and management unit
Advisory panel of 9 technical experts
Non-executive members: Lord Burns and Dame Kate Barker

The Chief of Staff

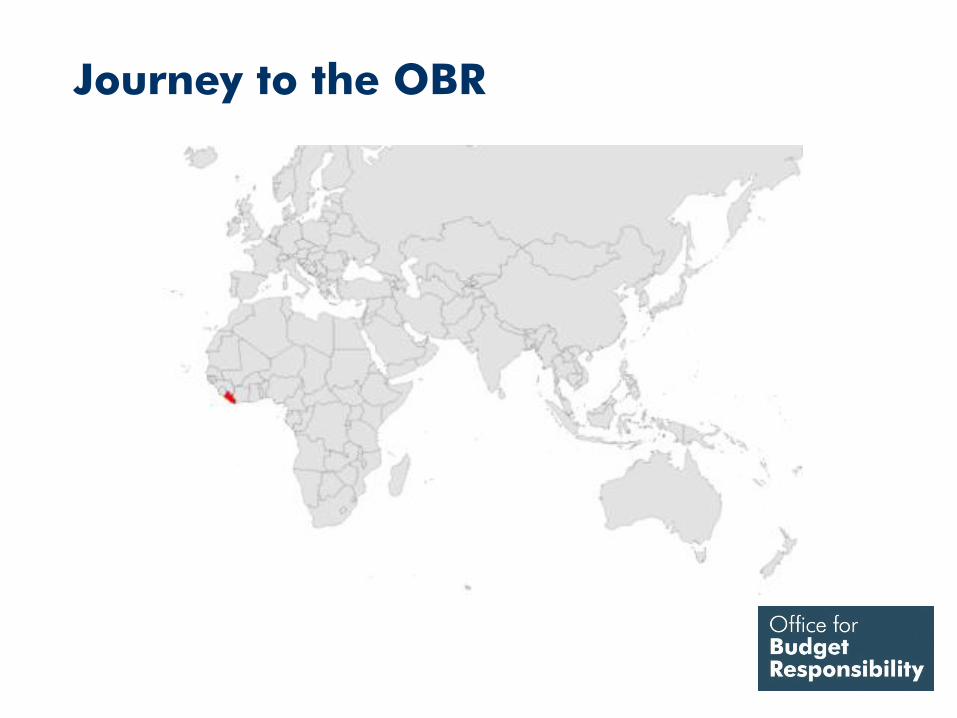
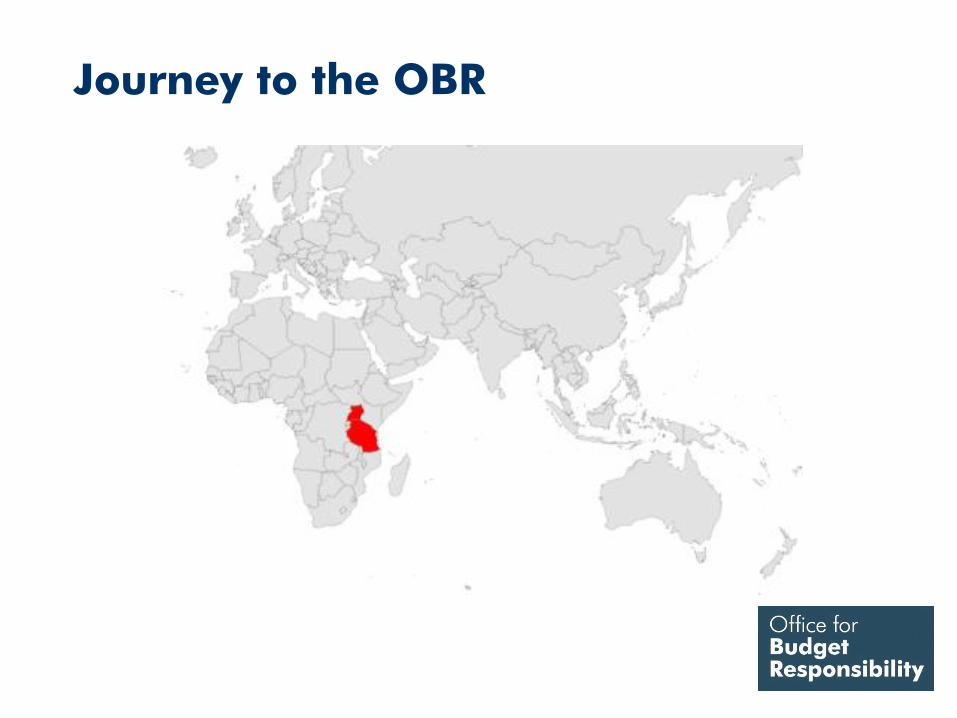
Journey to the OBR

Journey to the OBR
Journey to the OBR
Journey to the OBR

Journey to the OBR
Journey to the OBR

Journey to the OBR
The National Living Wage
and the July 2015 OBR forecast
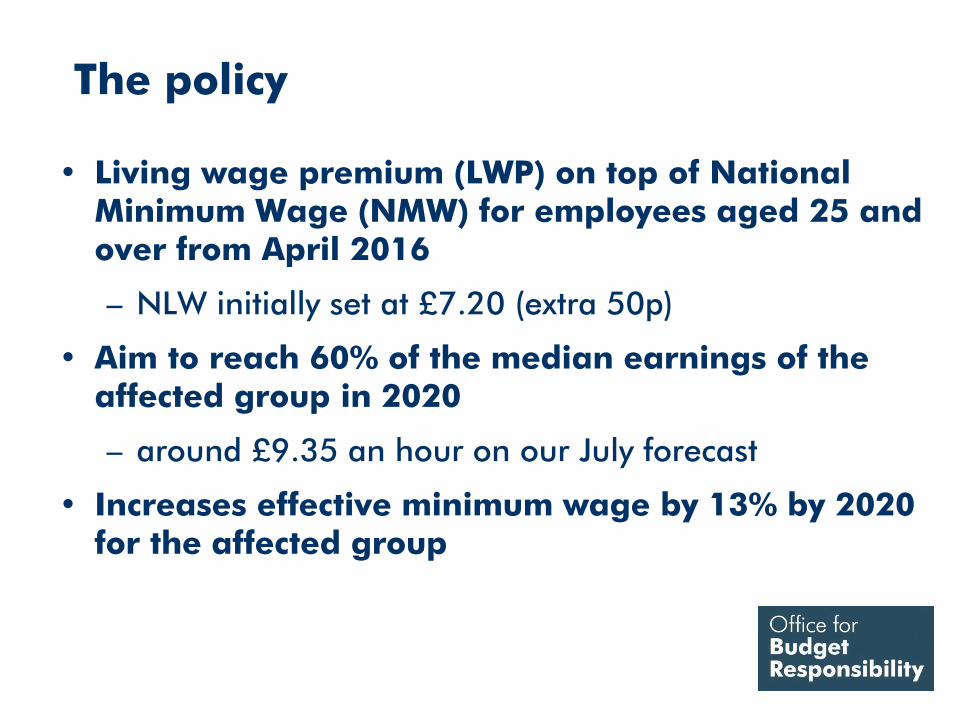
The policy
• Living wage premium (LWP) on top of National Minimum Wage (NMW) for employees aged 25 and over from April 2016
– NLW initially set at £7.20 (extra 50p)
• Aim to reach 60% of the median earnings of the affected group in 2020
– around £9.35 an hour on our July forecast
• Increases effective minimum wage by 13% by 2020 for the affected group
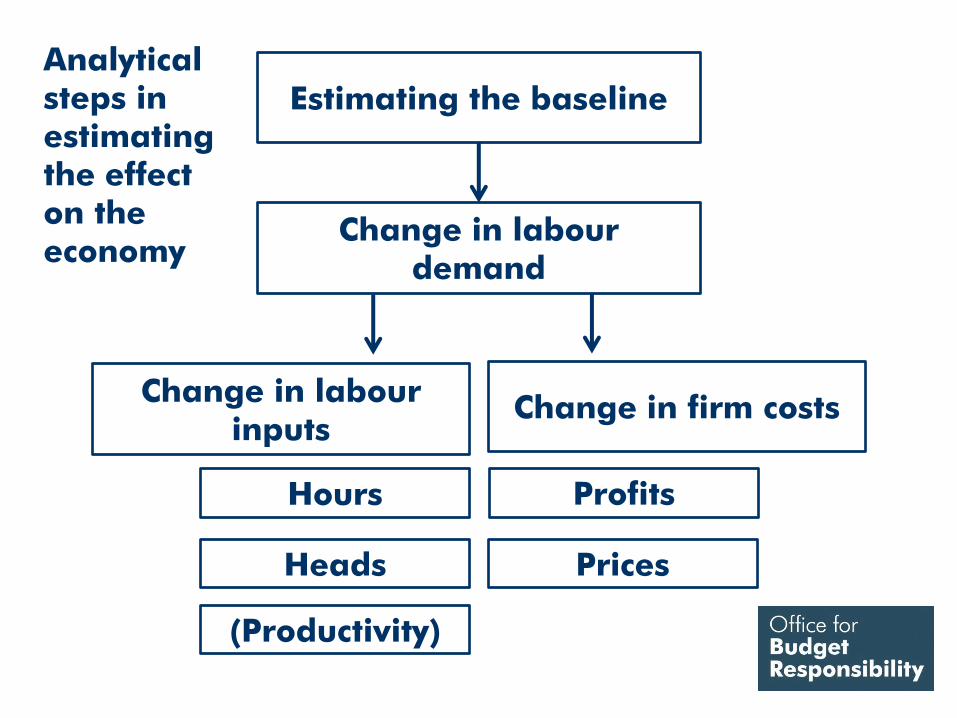
Analytical steps in estimating the effect on the economy
Estimating the baseline
Change in labour demand
Change in labour inputs
Change in firm costs
Hours
Heads
Profits
Prices
(Productivity)
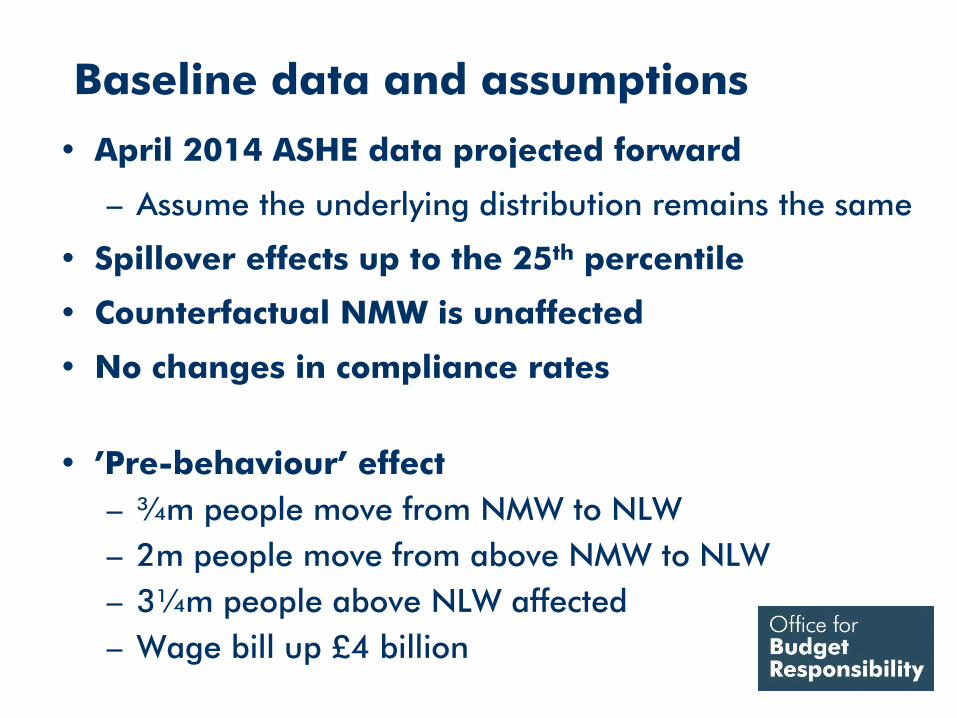
Baseline data and assumptions
• April 2014 ASHE data projected forward
– Assume the underlying distribution remains the same
• Spillover effects up to the 25th percentile
• Counterfactual NMW is unaffected
• No changes in compliance rates
• ’Pre-behaviour’ effect
– ¾m people move from NMW to NLW
– 2m people move from above NMW to NLW
– 3¼m people above NLW affected
– Wage bill up £4 billion
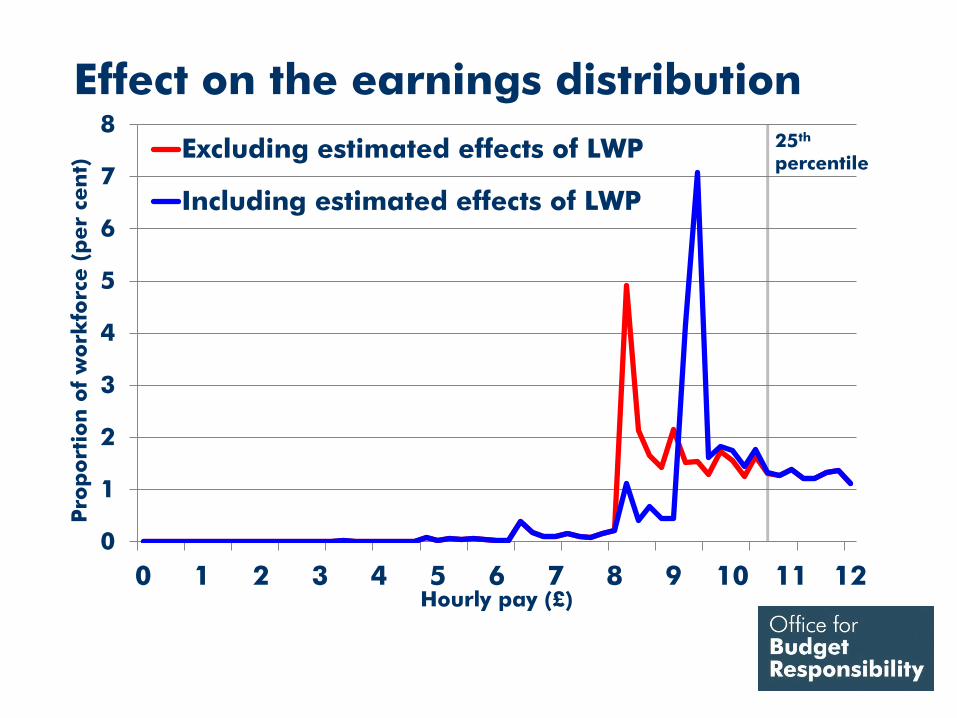
Effect on the earnings distribution
0
1
2
3
4
5
6
7
8
0 1 2 3 4 5 6 7 8 9 10 11 12
Pro
port
ion
of
work
forc
e (
per
cen
t)
Hourly pay (£)
Excluding estimated effects of LWP
Including estimated effects of LWP
25th percentile
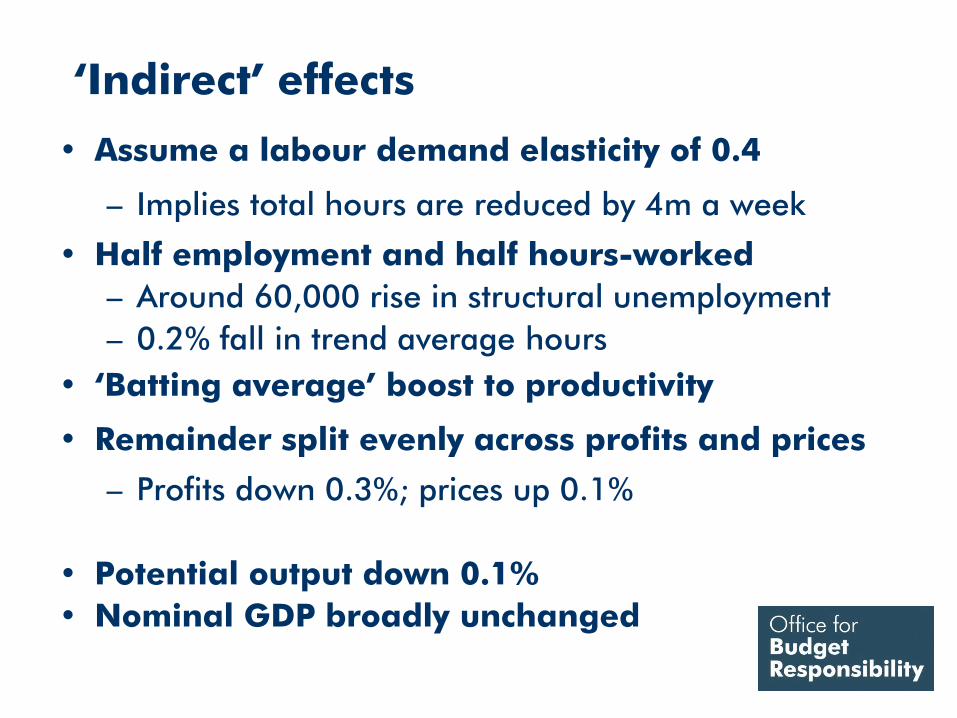
‘Indirect’ effects
• Assume a labour demand elasticity of 0.4
– Implies total hours are reduced by 4m a week
• Half employment and half hours-worked
– Around 60,000 rise in structural unemployment
– 0.2% fall in trend average hours
• ‘Batting average’ boost to productivity
• Remainder split evenly across profits and prices
– Profits down 0.3%; prices up 0.1%
• Potential output down 0.1%
• Nominal GDP broadly unchanged
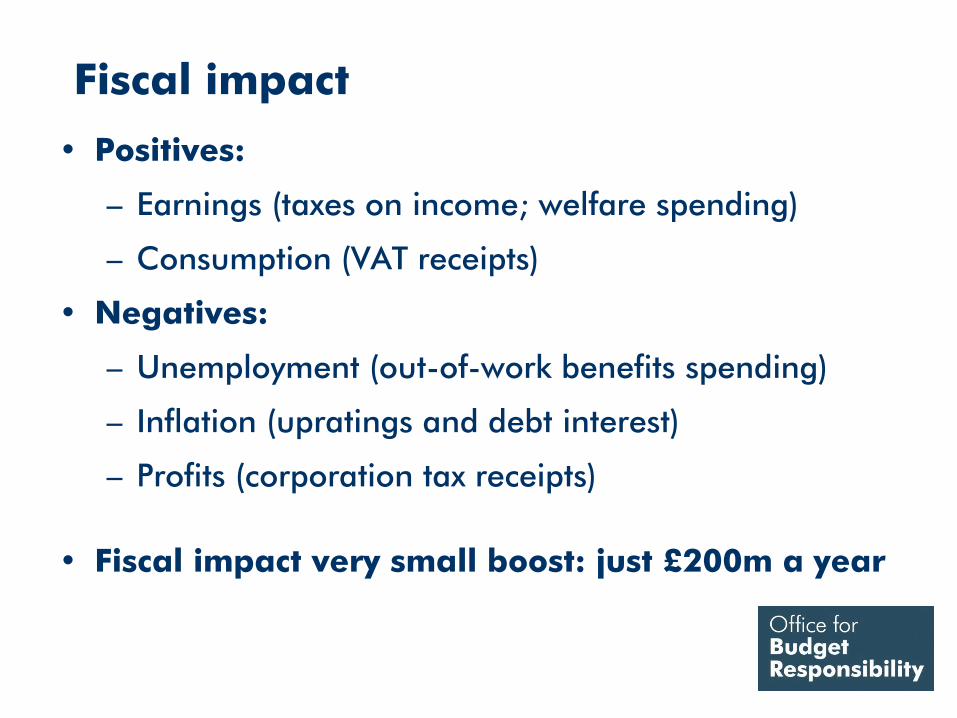
Fiscal impact
• Positives:
– Earnings (taxes on income; welfare spending)
– Consumption (VAT receipts)
• Negatives:
– Unemployment (out-of-work benefits spending)
– Inflation (upratings and debt interest)
– Profits (corporation tax receipts)
• Fiscal impact very small boost: just £200m a year

Questions?