Embed Size (px)
Citation preview

tradersworld.com • Spring 2001 1
$3.95 U.S. $4.50 Canada
Halliker’s Inc.2508 W. Grayrock Springfield, MO 65810Address Service Requested
PRESORTEDSTANDARD
U.S. POSTAGEPAID
Fulton, MissouriPERMIT NO. 38DISPLAY UNTIL JUNE 30, 2001
PRINTED IN U.S.A.
TradersworldcomSPRING 2001
TM
0 7 4 470 76912 5
3 0
Dynamic Trading and Multiple Time Frame Trend Continuation Signals The Time Factor of W.D. Gann Public Gann Methods for Using Planet’s Longitudes Counting on the 10 Year Cycle Something is Wrong with Gann Angles
Time and Price
A Coincidence of Numbers
Hidden Knowledge, Technical Analysis & the Holy Grail Part 2
ISSUE #30
FormulaMarketfor
Predictions
UNFAIR ADVANTAGE
TRADERS’ CHAT ROOM
GANNARTICLES
THE OFFICIAL MAGAZINE OF TECHNICAL ANALYSIS

2 Spring 2001 • tradersworld.comFor more information circle No. 1
tradersworld.com • Spring 2001 3
Trading securities, futures, and options on futures is not suitable for everyone. There is a substantial risk of loss in trading securities, futures,and options on futures. Securities are offered solely by LaSalle St. Securities LLC, through its Robbins Division. Robbins Division accepts cus-tomer orders only on an unsolicited basis, and does not make any recommendations regarding any security or securities product. Futuresand options thereon are offered solely through Robbins Trading Company. Active trading is subject to substantial investment risks. The speedof access for real-time quotes and equity order executions/confirmations may be affected by market conditions, a stock's liquidity, ordersize, and other factors.*Based on 500 entrants; may vary according to participation.
1-800-453-4444 • 1-312-454-5000
robbinstrading.com
Trade Stocks• Level I+ with Robbins Direct• Level II with Robbins Direct Pro• Pre & post-market trading• Dynamic top-20 lists & trailing stops• Real-time position management• Select ECN & order routing
preferences• Streaming quotes & intra-day charts
Trade Futures• State-of-the-art Robbins Online
order entry• Real-time quotes & intra-day charts• Point, click, & trade from your
quote screen • Trade direct-to-floor• Advanced order management
Compete• No entry fee required• Over $3,000 in trading tools for
all entrants• Prizes and trophies to top finishers• Voluntary cash prize pool• Competitive commission rates for
all accounts• Be considered for a position on the
worldcupadvisor.com team
Presidents Plaza • 8700 W. Bryn Mawr • 7th Floor South Tower • Chicago, IL 60631-3507 • www.robbinstrading.com
Visit us onlinefor officical rules and entry form.
For more information circle No. 2

4 Spring 2001 • tradersworld.com
tradersworldPublished by Halliker’s Inc.
Editor: Larry Jacobs
Dir. of Operations: Zachary D. Jacobs
Operations: Susan Pruett
Operations: Demetra Larrick
2508 W. Grayrock Dr.
Springfi eld, MO 65810
417-882-9697,800-288-4266
FAX: 417-886-5180
tradersworld, ISSN 1045-7690, is prepared from information believed to be reliable but not guaranteed us without further verifi cation and does not purport to be complete. Opinions expressed are subject to revision without further notifi cation. We are not offering to buy or sell securities or commodities discussed. Halliker’s Inc., one or more of its offi cers, and/or authors may have a position in the securities or commodities discussed herein. Any article that shows hypothetical or stimulated performance results have certain inherent limitations, unlike an actual performance record, simulated results do not represent actual trading. Also, since the trades have not already been executed, the results may have under - or over compensated for the impact, if any, of certain market factors, such as lack of liquidity. Simulated trading programs in general are also subject to the fact that they are designated with the benefi ts of hindsight. No representation is being made that any account will or is likely to achieve profi ts or losses similar to those shown. The names of products and services presented in this magazine are used only in editorial fashion and to the benefi t of the trademark owner with no intention of infringing on trademark rights. Products and services in the tradersworld Catalog are subject to availability and prices are subject to change without notice. Copyright 2001 Halliker’s Inc. All rights reserved. Information in this publication must not be stored or reproduced in any form without written permission from the publisher Halliker’s Inc. tradersworld is published quarterly by Halliker’s Inc., at 2508 W. Grayrock Dr., Springfi eld, MO 65810. Telephone (417) 882-9697 or Fax (417) 886-5180. For subscriptions and orders call (800) 288-4266. The subscription rate is $15.00 per year for 4 quarterly issues in the United States. Canadian subscribers add $8.00 and other foreign subscribers add $15.00 for airmail. The magazine is shipped via third class U.S. Bulk Rate Mail.
9 Commitment - the story of Tim Cho by Larry Jacobs
14 Murrey Math S&P 500 Futures Price Reversals Set To: 16 by T. H. Murrey
19 Gann’s Master Mathematical Formula for Market Predictions by Daniel T. Ferrera
22 Dynamic Trading and Multiple Time Frame Trend Continuation Signals by Robert Miner
18 The Time Factor of W.D. Gann by James Smithson
30 Special Trading Books 32 Commonsense Investing Technical Analysis for the Long-Term Investor by Gilbert Steele
33 Stacking the Deck, Using Cycles, Pattern and Volume to Increase Your Odds by Kent Austin and Mike Endert 36 Find the Currency Price You Want to Deal On, Using the Internet Brokerage System! by Jonathan S. Ziegel 37 Michael Jenkins Interview by Larry Jacobs
38 Counting on the 10 Year Cycle by Ken Turkin
39 Something is Wrong with Gann Angles by Ken Turkin
40 Time and Price by Howard Arrington
RR# ADVERTISERS PG# 01 Natural Order Educators 02 02 Robbins Trading Company 03 03 TCI Corporation 05 04 Air Software 06-07 05 TradersWorld Articles on CD 08 06 TRADERSCOACH 10 07 National Trading Institute 11 08 R.S. of Houston 12 09 Commodity Consultants 12 10 ChoicePicks.com 13 11 ADM Investor Services 15 12 Jack Winkleman Seminar 16 13 Sacred Science Institute 17 14 Murrey Math Supplies 18 15 Technicom, Inc. 20 16 Symmetrics Super Trades 21 17 Larry Pesavento 21 18 Dynamic Traders 23 19 Reality Based Trading 24 20 The Turtle Trader 25 21 Technical Analysis Forum 26 22 T. Mitchell 27 23 iPhoneBill 27 24 Gann Masters II 29 25 NeoWave 34 26 Options 40 in 4 34 27 Know Your Future 34 28 Strategem Software Intl 35 29 Trend Trader LLC 35 30 Jack Winkleman Newsletters 41 31 Gann Masters 42 32 Pyrapoint 43 33 Patterns of Gann 44 34 Your Image is Everything 45 35 Bank One 47 36 Joe Rondinone 47 37 Elliott Wave Masters 49 38 Gann Masters Charts Unveiled 49 39 Unfair Advantage 57 40 eSignal 59 41 SuperTiming 60 42 millennium-traders.com 61 43 Money-Tide.com 62 44 Write Your Financial Book 62 45 GannSoft Publishing 63 46 Prognosis Software 64
ContentsIssue No. 30 Spring 2001
44 A Coincidence of Numbers by Granville Cooley
46 Hidden Knowledge, Technical Analysis & the Holy Grail Part 2 by Dan Dodd
50 Trading Books
54 Unfair Advantage
55 Traders’ Chat Room by Larry Jacobs
56 The Right Trading Accessories
58 Scan Inspector
58 TradeStation Pro
60 Public Gann Methods for Using Planet’s Longitudes by Myles Wilson Walker
62 Are you Trading in a Dungeon by Dr. Al Larson, PhD, CTA
Gann Masters II Coursetakes off after the original Gann Masters and explains how to use all the Gann mathematical techniques plus astrology in your trading. It’s not diffi cult to learn and it’s easy to use.See page 29 for more information. Here are the planets covered:Sun / Earth AspectsAverage of PlanetsMoon LongtitudeMercury AspectsNeptune AspectsVenus AspectsMars AspectsJupiter AspectsSaturn AspectsUranus AspectsPluto AspectsNode AspectsKeeping Planetsand many more...

tradersworld.com • Spring 2001 5For more information circle No. 3
Market TraderSoftware
Alphee Lavoie/ Sergey Tarasov
AIR Software Copyright 1990-2000
FIRST INASTRO-FINANCE
WITHARTIFICIAL
INTELLIGENCE
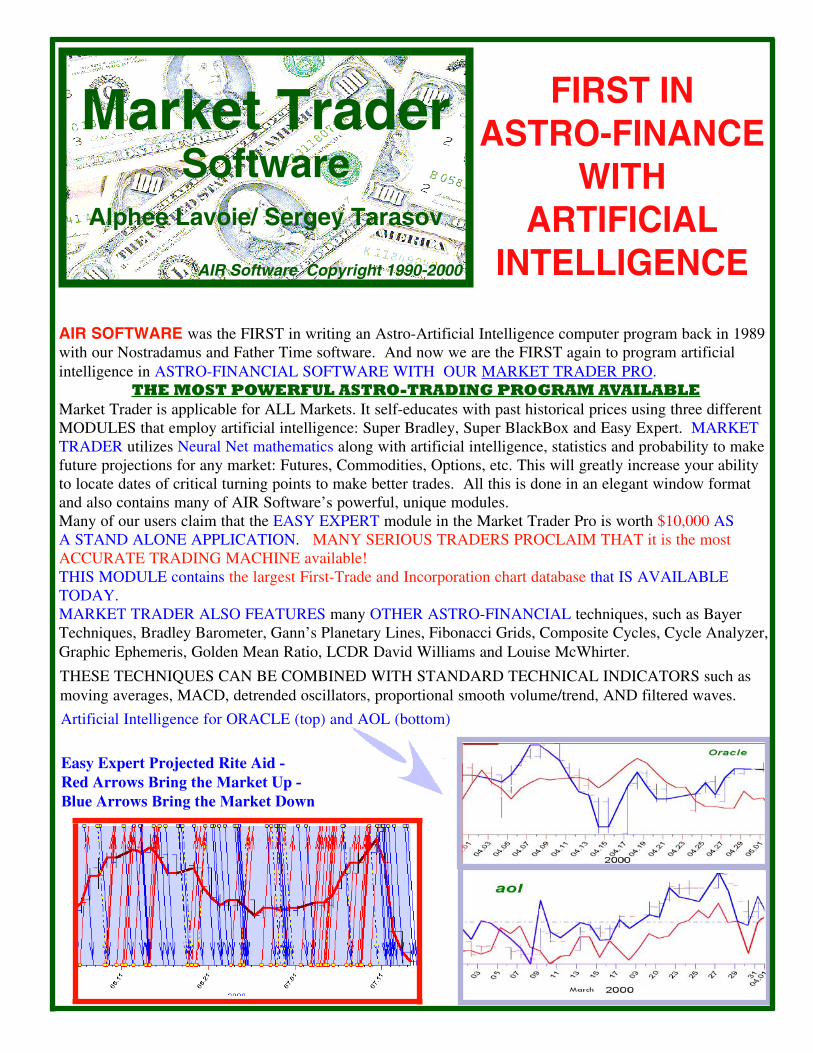
AIR SOFTWARE was the FIRST in writing an Astro-Artificial Intelligence computer program back in 1989 with our Nostradamus and Father Time software. And now we are the FIRST again to program artificial intelligence in ASTRO-FINANCIAL SOFTWARE WITH OUR MARKET TRADER PRO.
Market Trader is applicable for ALL Markets. It self-educates with past historical prices using three different MODULES that employ artificial intelligence: Super Bradley, Super BlackBox and Easy Expert. MARKET TRADER utilizes Neural Net mathematics along with artificial intelligence, statistics and probability to make future projections for any market: Futures, Commodities, Options, etc. This will greatly increase your ability to locate dates of critical turning points to make better trades. All this is done in an elegant window format and also contains many of AIR Software’s powerful, unique modules. Many of our users claim that the EASY EXPERT module in the Market Trader Pro is worth $10,000 AS A STAND ALONE APPLICATION. MANY SERIOUS TRADERS PROCLAIM THAT it is the most ACCURATE TRADING MACHINE available! THIS MODULE contains the largest First-Trade and Incorporation chart database that IS AVAILABLE TODAY. MARKET TRADER ALSO FEATURES many OTHER ASTRO-FINANCIAL techniques, such as Bayer Techniques, Bradley Barometer, Gann’s Planetary Lines, Fibonacci Grids, Composite Cycles, Cycle Analyzer, Graphic Ephemeris, Golden Mean Ratio, LCDR David Williams and Louise McWhirter.
Artificial Intelligence for ORACLE (top) and AOL (bottom)
Easy Expert Projected Rite Aid -
Red Arrows Bring the Market Up -
Blue Arrows Bring the Market Down
THE MOST POWERFUL ASTRO-TRADING PROGRAM AVAILABLE
THESE TECHNIQUES CAN BE COMBINED WITH STANDARD TECHNICAL INDICATORS such as moving averages, MACD, detrended oscillators, proportional smooth volume/trend, AND filtered waves.
DO YOU WANT TO COOK UP YOUR OWN INDICATORS? YOU CAN! USE ANY TYPE OF PLANETARY MOTION TO RESEARCH ANY MARKET WITH SUPER SEARCH: Planets in signs or houses, aspects and openings between planetary pairs, midpoints, harmon-ics, speed of planets, speed differences between planets, retrograde motion, planetary stations, ingresses, Moon phases, perihelion, aphelion, planetary nodes, eclipses, occultations, Time Cycles, planetary patterns such as grand trine, grand square, kites, etc.SEARCHES: Find all the companies in which Jupiter will make favorable aspects to their Sun. Search using any and all predictive techniques. The searches goes on and on!Calculations can be carried out in these COORDINATE SYSTEMS: Geocentric, Heliocentric, Declination, Right Ascension, and Latitude. If it’s in the sky, you can calculate it!The program reads PRICE DATA FROM ASCII, CSI and MetaStock formats. THE NEW CALENDAR feature will list PHENOMENA on a personal calendar for each.MARKET TRADER EXPECT is our newest version using artificial intelligence, neural net, fuzzy logic and all astronomical and astrological criteria, but with the expert you do not need to know any astrology at all. The EXPERT does all the work.
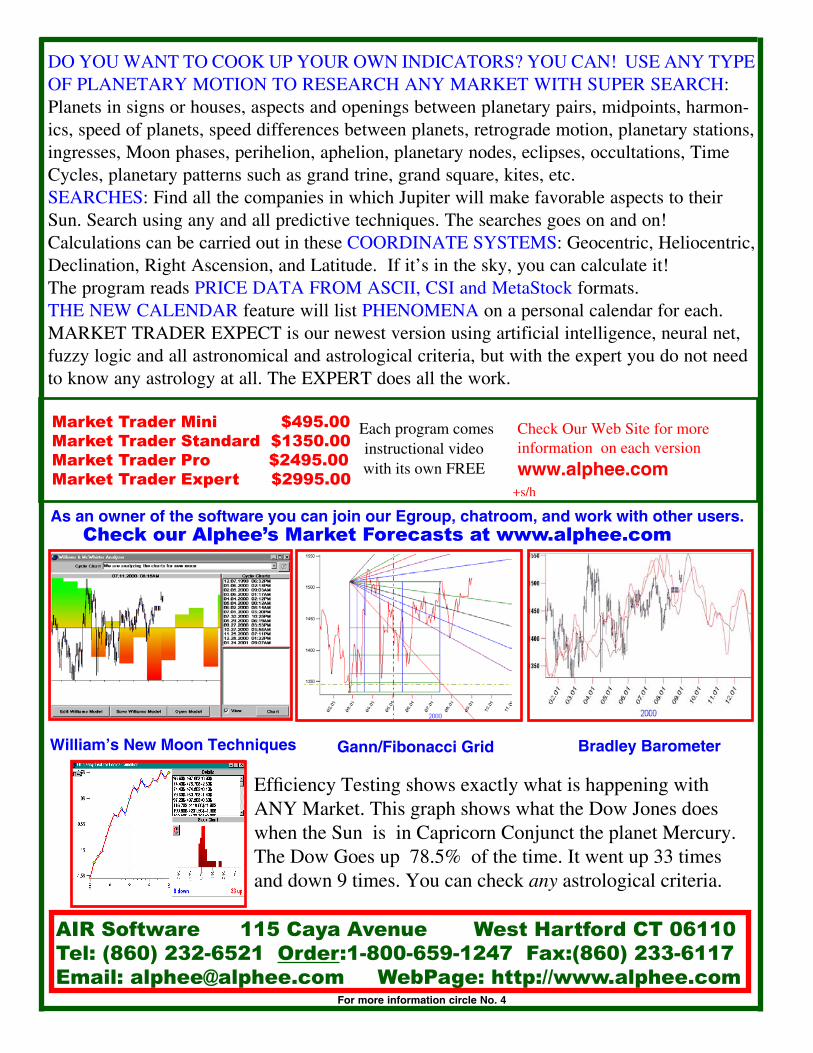
Bradley BarometerWilliam’s New Moon Techniques Gann/Fibonacci Grid
AIR Software 115 Caya Avenue West Hartford CT 06110Tel: (860) 232-6521 Order:1-800-659-1247 Fax:(860) 233-6117Email: [email protected] WebPage: http://www.alphee.com
Effi ciency Testing shows exactly what is happening with ANY Market. This graph shows what the Dow Jones does when the Sun is in Capricorn Conjunct the planet Mercury.The Dow Goes up 78.5% of the time. It went up 33 timesand down 9 times. You can check any astrological criteria.
Market Trader Mini $495.00Market Trader Standard $1350.00Market Trader Pro $2495.00Market Trader Expert $2995.00
Check Our Web Site for more information on each version
www.alphee.com
Check our Alphee’s Market Forecasts at www.alphee.comAs an owner of the software you can join our Egroup, chatroom, and work with other users.
Each program comes
with its own FREEinstructional video
+s/h
For more information circle No. 4

8 Spring 2001 • tradersworld.com
4901 - Issue #1, February 1988 Gann & Elliott WaveT-Bonds and Gann’s Square of 144 by Phyllis KahnThe classical market theory by Frank TaucherPredicting market trends using the Sq of 9 by Chris KakasuleffW.D. Gann’s within moves by Joel RensinkW.D. Gann’s Tunnel Thru the Air by Jim Prucker
#4902 - Issue #2, Aug/Sept 1988 Gann & Elliott WaveStock market timing using astrology by Larry PesaventoCompuWave by Robert SapersGann and the planets by Greg MeadorsWill history repeat? by Donald VodopichNo Title by Joel RensinkPrice pattern studies by Toby CrabelT-Bonds square of 144 by Phillis KahnIn sync with natural law by Jim Prucker
#4903 - Issue #3, Nov/Dec 1988 Gann & Elliott WaveUsing Gann with astrophysics by Hans Hannula PhDBeyond Gann: biblical cycles by Greg MeadorsThe Gann side of Fibonacci numbers by Granville CooleyRange expansion by Toby CrabelGann and the circle by Chris KakasuleffGann’s pyramid and fourth factor volume by Jim PruckerW.D. Gann and astrology by Norman WinskiTaking Gann and Fibonacci to the bank by Peter PichGann’s annual forecasts by Chuck CarpinoShort-term market forecasting astrology by Carol MullUsing holography to trade the markets by Keven LaRocca
#4904 - Issue #4, February/March 1989 Gann & Elliott WaveThe Gann emblem by David BowdenGann’s annual forecasts Part 2 by Chuck CarpinoHow to make the greatest profi ts by Jim PruckerCharting it Gann’s way by Phillis KahnTrading planetary cycles by Jeanne LongMcLaren charts by Larry JacobsBeyond Gann: vibration inversion points by Greg MeadorsProfi ts with Gann, Elliott, and Fibonacci by Robert MinerAstro-harmonics nature of retro motion by Larry PesaventoAn interview with A.J. Frost by Mark Levovich
#4905 - Issue #5, June/July 1989 Gann & Elliott WaveBeyond Gann: number vibrations by Greg MeadorsProj. the precise time of tops and bottoms by Robert MinerIndian astrology by Barry RosenAn A.J. Frost follow-up by Jeff WalkerGann’s annual forecasts Part 3 by Chuck CarpinoEquivolume a different diagnosis by Richard Arms Jr.A glimpse into market waves by Robert SapersteinThe Jupiter effect on the stock market by Bill MeridianSilver astrology and the golden mean ratio by James BrockAchieving the ultimate high by Eric HadikCycles: predicting price and time by Jeff RickersonThe Gann wheel on May 1989 Coffee by Jim Prucker
#4906 - Issue #6, Oct/Nov 1989 Gann & Elliott WaveTreasury Bonds a longer term perspective by Robert LussieAchieving the ultimate high by Eric HadikGann’s annual forecasts Part 4 by Chuck CarpinoVibration tables key to tops and bottoms by Phillis KahnSquare time with price by Robert MinerW.D. Gann’s price and time squares by Marcus RobinsonOrbits of Mercury/time distance/ stk by Alan Richter, PhDSubliminals for traders by Robert Krausz
#4907 - Issue #7 Traders WorldBack to basics by Terry DavisPhilosophy of trading by Les ClemensGann’s time price pattern factors by Robert MinerThe end of the fi fth wave by Dan DimockLaw of vibration by Greg MeadorsThe chain of command by Robert KrauszGann’s annual forecasts Part 5 by Chuck CarpinoAngle plotting by Jack Weiss
#4908 - Issue #8 Traders WorldGann’s law of vibration decoded by Greg MeadorsPredicting stock market crashes by Chris KakasuleffLearn more about indicators by Terry DavisAstroharmonics/ T-Bonds / Planet Mars by Larry PesaventoUse and abuse of geometric angles Part 1 by Robert MinerHow to use Gann in the agriculture markets by David Gleason
#4909 - Issue #9 Traders WorldThe future course of U.S. stocks by Glenn NeelyTrading system that is 90% accurate by Larry PesaventoThe Bible, Gann and the stock market by Greg MeadorsA new way to trade by Joe RondinoneGann’s astrology and the 60 year cycle by Bill MeridianSpeculating or investing by Terry DavisPredicting short-term changes /Dow by Chris KakasuleffIndian time cycles and market forecasting by Barry RosenElliott and Andy by David KruseThe use and abuse of geometric angles Part 2 by Robert Miner
#4910 - Issue #10 Traders WorldPrice bubble a new concept by Terry DavisRule #1 in T-Bonds by Larry PesaventoTrading strategies critical to profi ts by Robert MinerSimple rules / support and resistance / Dow by Chris KakasuleffW.D. Gann’s master time factor by James FlanaganHeavenly infl uences and the 90 stock market by Greg MeadorsThe golden cycle by Eric HadikTraders can enhance their profi t potential by Jack WeissThe lost cycle by Eric HadikUsing volume to determine trend by James BurnettGeometry and the stock market by Robert FlowerA lunar chaos theory by Hans Hannula PhD
#4911 - Issue # 11 Traders WorldThe solar eclipse by Greg MeadorsFinancial storm in the markets by James FlanaganWoody by Larry WoodsAstroharminc vibrations by Larry PesaventoGann, angles and the square of 9 by Bill McLarenAncient geometry by Bryce GilmoreNeural systems by Lou MendelsonDow topped? by Jerry Favors
#4912 - Issue #12 Traders WorldLearning fl awless exec/trading system by Mark DouglasSync your brain for successful trading by Larry JacobsSynergy the secret of cycles by Eric HadikGann’s geometric angles by Robert MinerHow to design artifi cial neural trading by Lou MendelsonCombust by Larry PesaventoW.D. Gann’s new permanent chart by James Flanagan
#4913 - Issue #13 Traders WorldThe law behind the markets by Lee FranklinMental harmonics by Robert KrauszProjecting time and price by Robert MinerPythoagoras and the powers of 1-2-3 by Joe RondinoneCycles made easy by Hans Hannula PhDThe jiggle line by the Cosmic CowboyPick your stocks with astrology by Carol Mull
#4914 - Issue #14 Traders WorldCounting the universal measurement by Joe RondinoneCharlatans, pipe dreams and cowboys by Bob BuranCapitalizing on chaos by Hans Hannula PhDA cycle of time by Eric HadikGann’s angles and squaring methods by David GreenDaytrading by Terry DavisVolatility range index by Maynard HoltMechanical approach to trading by Bruce Babcock
#4915 - Issue #15 Traders WorldW.D. Gann a legend by Les ClemensOrder in the markets by Danton LongMoney management by Mike RileySecret to success by Ted TesserMercury and the Dow by Carol MullAstrology and volatility by Carl WhitneyPsychoacoustics by Larry JacobsNeural Networks by Larry PesaventoMechanical approach by Bruce Babcock
#4916 - Issue #16 Traders WorldCashing in on chaos by Hans Hannula PhDInvesting may be hazardous to your wealth by Ted TesserTrading/role of the subconcious mind by Robert KrauszFollowing the footsteps of W.D. Gann by Jeanne LongTime price and distance by David FranklinHeliocentric and sidereal analysis by Barry RosenPrecision time and price analysis by Robert MinerThe myth of Fibonacci counts by James SchildgenQuest for the holy Grail by Terry DavisThe correct way to optimize by Bruce Babcock
#4917 - Issue #17 Traders WorldThe seven percent solution by Alan FriedmanTrading is psychological brain surgery by Bill Williams Gann’s angles and squares by Dave GreenTiming software by Will HobbsHow to qualify for trader status by Ted Tesser, CPAThe second dimension by Joe RondinoneTrading a mechanical system by Fred RuscherThe edge that makes the difference by Koppell & AbellThe law of vibration by Petter AmundsenFading Tommy’s daddy by Terry DavisGolden Gann by Jim Watkins
#4918 - Issue #18 Traders WorldThe importance of volume surges by Alan FriedmanHoggy Doggy by Terry DavisThe return of the natal node by Miller & WilliamsSecret rules of W.D. Gann by Mike RileyTime periods by James FlanaganSquared soybeans by Jim WatkinsFinding the end of wave 4 by Alan Richter PhDUniversal Clock software by Jeanne LongHow to trade a small account by John BrownTime sine wave of the market by Dave Franklin
#4919 - Issue #19 Traders World50% fan lines by Paul DickeyTrading the stock market indexes by Scott D. Wolfe, C.T.A.Don’t give your trading profi ts away ot IRS by Ted Tesser C.P.A.A new era by Patrick MikulaThe Gann Spiral by Petter AmundsenSynchronicity in market timing by Carolyn BorodenMichael S. Jenkins interviewPopular trading prices for wheat by Jim WatkinsPercentage change price projection by Robert MinerChaos theory and market reality by Bruce Babcock
#4920 - Issue #20 Traders WorldWhy people lose! by Terry DavisThe astrology of timing the markets by Nicholas SymingtonSolving one of Gann’s trades by Patrick MikulaAnatomy of a takeover winner by Alan FriedmanJoe DiNapoli on trading interviewMichael S. Jenkins interview part twoThe remarkable W. D. Gann by John L. Gann, Jr.Intermarket time by Will HobbsTime analysis qualifi es market position by Robert MinerFinding and forecasting cycles by Stan EhrlichChaos theory and market reality part two by Bruce Babcock
#4921 - Issue #21 Traders WorldGann and the pyramids by Larry JacobsInterview with Robert MinerTrue trandlines and the second wave by Joe RondinoneOf traders and geese by John ChapmanFibonacci TraderDynamic Trader software and trading courseA Man’s seasonal trend unvieled by Patrick MikulaThe easy does it stock selection system by Chris KakusulefThe cycle of time II by Eric HadikA great new trading system by T.M. MurryElliott Wave and you by Terry DavisEssentials of Day Drading by Gary Smith
#4922 - Issue #22 Traders WorldA moon - beam by Peter Ivar AmundsenThe Gann pull back by Jerry PegdenHolistic anaysis of the gold and silver marketsIntraday Trading by Thomas LongInvesting with horoscope of fi rst trade of 1996How to choose stocks that will outperform mkt by Smart money by Alan FriedmanTalent and potential in Gann’s birth chart by Andira LennonCashing in on natural energy by Dr. Hans HannulaCan you trade it? That is the question by T.H. MurreyIdeas for new or unsuccessful traders by Bruce Babcock
#4923 - Issue #23 Traders WorldInterconnected Finl Markets New Strategies by Louis MendelsohnA Plan for Trading a Fast Trend by Jerry PegdenElection Year Stock Market Statistics by Robert MinerWhat is Gann’s Natural Law? by G.R.Forecasting for Profi t by Jeanne LongGann Masters is Hot by Larry JacobsIs Your Computer Causing You to Loose Money? by L. JacobsCan You See It? Truth Lost in Translation? by T.H. MurreyCashing in XGO by Dr. Hans HannulaInterview with Bill Meridian by Larry Jacobs
TradeStation Review by Larry JacobsBest Way to Trade with Limited Capital by Bruce Babcock#4924 -
Issue #24 Traders WorldPersonality of Markets Theory by Ed DownsForecasting The Power of Ranges by David E. BowdenTiming is Everything by Eric HadikCombining Price Projections and Time Counts by Jerry PegdenAndrews Channels and Parallel Lines by Robert MinerVibrations is the Golden Key Pythagras Used by Joe RondinoneOut-of-Range Settlement Prices by Bob PelletierSetting the Square in Time by T.H. MurreyWhy Johnny Can’t Trade by Dr. Hans HannulaThe C Wave Method of Trading Elliott Wave by Miles WalkerHow to Trade with the Trend by Bruce Babcock
#4925 - Issue #25 Traders WorldTrading Strategies and Trade Management by Robert MinerTiming is Everything II How to Utilize Cycles by Eric HadikCashing in on Chaos by Dr. Hans Hannuh PhDPlanetary Timing for Buying Stocks by Jeanne LongThe Alpha Application of Natural Law by Gregg RuffMurrey Math or W. D. Gann by T.H. MurreyFinding the End of Wave Four Again by Alan Richter PhDChoosing the Right Computer Display by Larry JacobsChoosing the Right Computer by Larry JacobsHome Trading Offi ce Design by Larry JacobsThe Only Way to Trade by Bruce Bruce Babcock
#4926 - Issue #26 Traders WorldSwing Vibration and Anniver Day Studies by Robert MinerThe Cycle of Time III by Eric HadikAn Ancient School in Modern Times by G.R.Bullish & Best Stock Groups for 1998 by Grace K. MorrisThe Moon and the S&P500 by Dr. Hans Hannula PhD, CTASeasonal Timing by Larry JacobsThe Memory of Numbers by Joe RondinoneWhat is the Trading Index Really Telling Us by Elton BortonForecasting the Power of Time by David BowdenWinning 75% of All Trades by T.H. MurreyNatural Law is the Basis of Market Movement by David CerfHow to Setup Your Home Trading Offi ce by Larry Jacobs
#4927 - Issue #27 Traders WorldThe Secrets of Internet Day-Trading by Larry JacobsFive Waves to See a Market Reversal by T.H. MurreyGann Theory by James A. HyerczykEverything Comes Full Circle by Daniel FererraThe Future of Fiancial Astrology by Patrick MikulaAstrology Points the Way for our Future by Alphee LavoleTrading on Scales by John ChapmanGann Harmony: The Theories & Teachings by BradStreet StewartTrue Time Tells Truth by John Berends CTATime and Price Forecasting by J. WhiteA Reliable Indicator:NYSE Bullish Percent Index by T. DorseyLeading and Lagging Indicators by Joe DiNapoliTiming is a Measurement, Tempo is a Rate by Jone RondinoneHow to Succeed in the Markets by Neal HughsW.D. Gann’s May Soybean Chart by Myles WilsonBill Cruz Interview Gilbert Steele’s Time & Dimension Chart by Larry Jacobs
#2928 - Issue #28 Traders WorldElliott Wave Analysis by Jeffrey KennedyW.D. Gann Coffee and Astrology by Myles WilsonAstrology for Timing, Cycles and Turning Points by Dr. Martin BootThe Vision and Pasion to Do the Right Thing by Iles SiewGann’s Secret Pythagorean Cube by Don HallThe Gann Wheel, Octagon Chart, Pythagorean Cube by Dan FerreraDynamic Trader 3.0If You Colud See Tomorrow by Larry PesaventoDo Murrey and Gann Teach Same Price & Time by T.H. MurreyGann et all: As Good as it Gets by Don MackPut Selling: A Winning Strategy by Bernie SchaefferCombining Tactical and Strategic Ideas in Trading by Walter DownsThe At-Home Trader by Larry Jacobs
#2929 - Issue #29 Traders WorldMurrey Math and the Nsdaq 5000 by T.H. MurreyWave-5 Price Targets by Robert MinerGain an Edge in Trading by Joel RensinkThe Cycle of Seventeen Years by Earnie P. QuigleyCycles by Jack WinklemanPut the Odds in Your Favor by Larry PesaventoGann’s Road Map Approach by Don HallCan the Skills of a Successful Commodity Trader Be LearnedInitial Capital Exposure and Risk Reward by Stephen Griffi thsImprove Your Trading Performance by Following your AstrologyHow and Individual Trader Can Understand and Profi t by J.LukemanHidden Knowledge,Technical Analysis and the HolyGrail, D. DoddElliott Wave Masters by Larry JacobsGann Master Charts Unveiled by Larry JacobsLarry Williams Interview by Larry JacobsProfi ts if Done Properly by Myles Wilson WalkerFinding Tops with Float Analysis by Steve Woods
Traders World Articles on CD �Yes, Please send me all the articles in the back issues of Traders World on CD in PDF format for just $49.95 plus $4.95 U.S. shipping. Printed issues $6 each.
Name ______________________________
Address_____________________________
City________________________________
State ____________________ Zip_______
�Check �MC �Visa �AMAX
Card# _____________________Exp._____Traders World Magazine
2508 W. Grayrock St.,Springfi eld, MO 65810800-288-4266, www.tradersworld.com
All Traders World Articles on CD - $49.95
For more information circle No. 5
tradersworld.com • Spring 2001 9
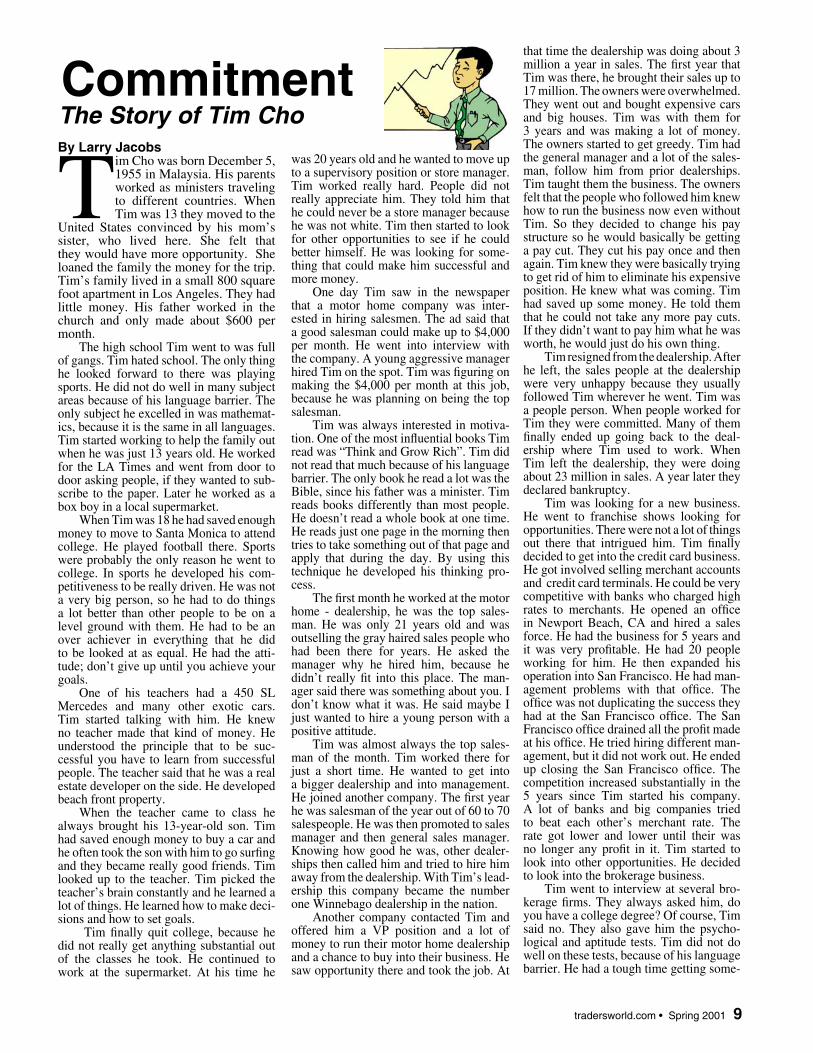
CommitmentBy Larry Jacobs
Tim Cho was born December 5, 1955 in Malaysia. His parents worked as ministers traveling to different countries. When Tim was 13 they moved to the
United States convinced by his mom’s sister, who lived here. She felt that they would have more opportunity. She loaned the family the money for the trip. Tim’s family lived in a small 800 square foot apartment in Los Angeles. They had little money. His father worked in the church and only made about $600 per month.
The high school Tim went to was full of gangs. Tim hated school. The only thing he looked forward to there was playing sports. He did not do well in many subject areas because of his language barrier. The only subject he excelled in was mathemat-ics, because it is the same in all languages. Tim started working to help the family out when he was just 13 years old. He worked for the LA Times and went from door to door asking people, if they wanted to sub-scribe to the paper. Later he worked as a box boy in a local supermarket.
When Tim was 18 he had saved enough money to move to Santa Monica to attend college. He played football there. Sports were probably the only reason he went to college. In sports he developed his com-petitiveness to be really driven. He was not a very big person, so he had to do things a lot better than other people to be on a level ground with them. He had to be an over achiever in everything that he did to be looked at as equal. He had the atti-tude; don’t give up until you achieve your goals.
One of his teachers had a 450 SL Mercedes and many other exotic cars. Tim started talking with him. He knew no teacher made that kind of money. He understood the principle that to be suc-cessful you have to learn from successful people. The teacher said that he was a real estate developer on the side. He developed beach front property.
When the teacher came to class he always brought his 13-year-old son. Tim had saved enough money to buy a car and he often took the son with him to go surfi ng and they became really good friends. Tim looked up to the teacher. Tim picked the teacher’s brain constantly and he learned a lot of things. He learned how to make deci-sions and how to set goals.
Tim fi nally quit college, because he did not really get anything substantial out of the classes he took. He continued to work at the supermarket. At his time he
was 20 years old and he wanted to move up to a supervisory position or store manager. Tim worked really hard. People did not really appreciate him. They told him that he could never be a store manager because he was not white. Tim then started to look for other opportunities to see if he could better himself. He was looking for some-thing that could make him successful and more money.
One day Tim saw in the newspaper that a motor home company was inter-ested in hiring salesmen. The ad said that a good salesman could make up to $4,000 per month. He went into interview with the company. A young aggressive manager hired Tim on the spot. Tim was fi guring on making the $4,000 per month at this job, because he was planning on being the top salesman.
Tim was always interested in motiva-tion. One of the most infl uential books Tim read was “Think and Grow Rich”. Tim did not read that much because of his language barrier. The only book he read a lot was the Bible, since his father was a minister. Tim reads books differently than most people. He doesn’t read a whole book at one time. He reads just one page in the morning then tries to take something out of that page and apply that during the day. By using this technique he developed his thinking pro-cess.
The fi rst month he worked at the motor home - dealership, he was the top sales-man. He was only 21 years old and was outselling the gray haired sales people who had been there for years. He asked the manager why he hired him, because he didn’t really fi t into this place. The man-ager said there was something about you. I don’t know what it was. He said maybe I just wanted to hire a young person with a positive attitude.
Tim was almost always the top sales-man of the month. Tim worked there for just a short time. He wanted to get into a bigger dealership and into management. He joined another company. The fi rst year he was salesman of the year out of 60 to 70 salespeople. He was then promoted to sales manager and then general sales manager. Knowing how good he was, other dealer-ships then called him and tried to hire him away from the dealership. With Tim’s lead-ership this company became the number one Winnebago dealership in the nation.
Another company contacted Tim and offered him a VP position and a lot of money to run their motor home dealership and a chance to buy into their business. He saw opportunity there and took the job. At
that time the dealership was doing about 3 million a year in sales. The fi rst year that Tim was there, he brought their sales up to 17 million. The owners were overwhelmed. They went out and bought expensive cars and big houses. Tim was with them for 3 years and was making a lot of money. The owners started to get greedy. Tim had the general manager and a lot of the sales-man, follow him from prior dealerships. Tim taught them the business. The owners felt that the people who followed him knew how to run the business now even without Tim. So they decided to change his pay structure so he would basically be getting a pay cut. They cut his pay once and then again. Tim knew they were basically trying to get rid of him to eliminate his expensive position. He knew what was coming. Tim had saved up some money. He told them that he could not take any more pay cuts. If they didn’t want to pay him what he was worth, he would just do his own thing.
Tim resigned from the dealership. After he left, the sales people at the dealership were very unhappy because they usually followed Tim wherever he went. Tim was a people person. When people worked for Tim they were committed. Many of them fi nally ended up going back to the deal-ership where Tim used to work. When Tim left the dealership, they were doing about 23 million in sales. A year later they declared bankruptcy.
Tim was looking for a new business. He went to franchise shows looking for opportunities. There were not a lot of things out there that intrigued him. Tim fi nally decided to get into the credit card business. He got involved selling merchant accounts and credit card terminals. He could be very competitive with banks who charged high rates to merchants. He opened an offi ce in Newport Beach, CA and hired a sales force. He had the business for 5 years and it was very profi table. He had 20 people working for him. He then expanded his operation into San Francisco. He had man-agement problems with that offi ce. The offi ce was not duplicating the success they had at the San Francisco offi ce. The San Francisco offi ce drained all the profi t made at his offi ce. He tried hiring different man-agement, but it did not work out. He ended up closing the San Francisco offi ce. The competition increased substantially in the 5 years since Tim started his company. A lot of banks and big companies tried to beat each other’s merchant rate. The rate got lower and lower until their was no longer any profi t in it. Tim started to look into other opportunities. He decided to look into the brokerage business.
Tim went to interview at several bro-kerage fi rms. They always asked him, do you have a college degree? Of course, Tim said no. They also gave him the psycho-logical and aptitude tests. Tim did not do well on these tests, because of his language barrier. He had a tough time getting some-
The Story of Tim Cho

10 Spring 2001 • tradersworld.com
one to hire him. He fi nally went to a small brokerage fi rm. They gave him the test and he passed it because of the math part. Tim was very savvy with business and he knew what these people were looking for. Tim fi gured he could be hired anywhere if he was a licensed broker.
To be licensed as a broker, one must past a diffi cult series 7 test. Tim studied for this test sometimes eighteen hours a day for two straight weeks. He tried to cram all the information into his head. The test day came and he failed it. He had to wait a month and took the test again. The second time he passed the test. After passing he went back to the big brokerage fi rms. He was now a licensed broker. He went into Merrill Lynch and talked to the VP of that offi ce. He was feeling really good about himself and told the manager how he had built his business and of his background. He really sold himself. He told them that he was already licensed and that he wanted to work with a reputable brokerage fi rm. He felt that the fi rst time he interviewed with these brokerage fi rms they felt that he could not pass the test because of his com-prehension level. Tim said to the manager, “Just give me a chance and I will be the best broker you ever hired”. The manager was very impressed and hired him. Later on the Manager told him that he had been a manager for 10 years and Tim was one of only two people he ever hired on the spot.
Tim started with just a handful of accounts. These were people that he knew and that he had business dealings with in the past. He called them up and said give me your money. I will take care of it like my own. Tim studied very hard trying to fi nd a good method to trade the markets. Every other broker there, was just telling stories to sell the stocks or mutual funds that the fi rm recommended. After custom-ers bought the stocks, they would always go down like clockwork. It was almost comical. Tim just looked at himself and said that he could not do that to his clients. Tim developed great trading skills and he was profi table. He got a lot of referrals from clients due to his success and he was able to build a large book of accounts. He never did any cold calling.
At Merrill Lynch they ranked their bro-kers according to fi rst year, second year, third year and so on. As a broker you could go in and see exactly where you were every month when the production report came out. Tim would always go in to view the reports. His goal was to be number one. He was very determined. Tim was always in the top one percent. Tim knew that if he did the same thing that the other brokers did, he would just be like them. He decided he would have to do something different. He fi gured out, he had nothing to loose. He started developing systems on his own. He tried different things to trade. He stud-
ied the mathematics behind the market. He learned what made the market move. He started doing better and better. The fi rst year he was the top broker in the western region.
Tim was at Merrill Lynch for 3 years and then management changed. The new manager went around talking to get to know the new brokers. The new manager got to know Tim’s type of trading and the velocity on his accounts. He felt it was too high. He also noticed Tim’s own account had a lot of trading. At that time Tim was trading really heavy in options. Options to Merrill Lynch were considered high risk from the retail brokers standpoint. He asked Tim how much time he spent on prospecting customers, like cold calling and that kind of thing. Tim said that he never did any cold calling. The manager said how do you bring in new assets into the fi rm. Tim said by getting referrals from his present customers and by doing a good job managing their money. The manager said maybe you should stop trading your own account and spend the time prospect-ing for new accounts. Tim did not really know what to say to the guy. There was no possible way that Tim would stop trading his own account.
Other brokerage fi rms were constantly perusing Tim. They were offering him up front money with stock options and every-thing. They told him to bring his accounts
For more information circle No. 6

tradersworld.com • Spring 2001 11
NTI
has a unique
and innova-
tive four-
month edu-
cational
course de-
signed to
teach you to
become a profitable trader.
Our students receive
an (800) number to talk to
their own professional trader/
mentor. The course curricu-
lum includes two of the very
best books on trading (each
with its own companion study
guide), and other materials
and aids to trading…but these
items are not the CORE of the
program. Anyone can go out
and buy books on trading.
The core value that you are
National Trading Institute
3440 Wilshire Blvd. Suite 610
Los Angeles, CA 90010
(800)966-1NTINTINTINTI
FAX (213)252-2980
Pursue the dream of
financial independence
getting is access to your own
personal coach who will teach
you how to trade, one-on-one,
over the telephone. Our Men-
tors are successful, licensed
commodity trading profession-
als, who have been trading for
many years, some for decades.
The course requires two
hours of work a week. Stu-
dents with more time can move
faster and call their mentor
every day (30-minutes maxi-
mum per call).
Your personal mentor
will gather information on who
you are and where you are in
your trading pilgrimage. Then
he or she will design an indi-
vidualized teaching program to
guide you in developing your
own trading strategy, custom-
tailored to your situation.
Once you have success-
fully completed the first two
modules of the structured cur-
riculum, and you feel you are
ready, you will begin trading
with real money, making your
own trading decisions, but with
your mentor giving evaluation
after you liquidate the trade.
People who want to
learn how to trade commodi-
ties should stop and take the
time to educate themselves
first. At NTI we place a special
emphasis on teaching our stu-
dents to eliminate “the human
element” in their trading. We
will teach you to make educated
decisions as opposed to emo-
tional ones. Conquering “the
human element” is the one com-
mon denominator of all profit-
able commodity traders. If you
are interested, call (800)966-
1NTI and ask to speak to an
Enrollment Counselor.
Be free! Own your own business.
Be your own boss.
NNNNTTTTIIIICommodities
Mentoring
Program
How long has it been since you’ve
had a real vacation?
“The only way you’re going to
change your financial situation
is to stop, and really take the
time to educate yourself.”
For more information circle No. 7
12 Spring 2001 • tradersworld.com
R.S. of HoustonShort-term and Daytrading Workshop
Call NOW for FREE INFO (281) 286-9736
The Clock Is Ticking
Life Isn’t A Dress Rehearsal...
You Need To DoSomething About Your
Trading Now!!
There’s BIG $$ available everydayDon’t trade another day without our Method
See Why After 5 Years Our Students Continue to Say We’re the Best
Student Support & Training is Unrivaled
Testimonials and Success stories keep coming in -
see our website
Winning Signals Day After Day
• An R.S. First: “Live Squawk Box” Audio Market Commentary
Follow along as we confidently demon-strate our methods trade signals real time, all day from bell to bell. The best learning tool available today. You need to learn how to think like a trader in real time. Books and charts alone don’t do it.
• Any Market - DayTrade To Long
V I S I T O U R W E B S I T E
For Exciting Charts and Info
www.RSofHouston.com
Teaching The Simple Way To Trade. Call Now -We’ll SHow You How
Home Study Now and/orOn Site Training Per Schedule
over and they would give him a VP title. Tim had no reason to move, at that time. He did know that if he left Merrill Lynch one day, he could get another job right away.
The manager of the Merrill Lynch offi ce one day left for a managers corporate meeting and then came back a few days later. He started looking at Tim’s account. Tim had been doing a lot a trading in it. He called Tim in his offi ce and said did I not tell you not to trade your own account? Tim said, yes I remember you saying some-thing about that. The manager then said, then why did you trade your own account? He said that I did not agree to what you said. I did not tell you that I was not going to trade my own account. He said the only way that I would stop trading my own account, is that you would have to make everyone in the fi rm not trade their own account. The manager got mad and said, if you want to trade your own account then you won’t be working for Merrill Lynch. Tim said, fi ne, I’ll go work for someone else.
Tim cleaned his desk and went over to Smith Barney and talked to the manager. They worked out the details. It was a fast negotiation. They gave him stock options and the whole works. The next day Tim was working over there as a VP.
After he worked with Smith Barney for a while a similar thing happened. The man-ager got transferred to San Jose. The new manager came in. Brokerage fi rms all are about the same. They transfer the manag-ers around a lot. The fi rst manager of Smith Barney hired Tim, because he was differ-ent. The new manager coming in didn’t have the same ideas. Tim was different than most everyone else. He was more of a risk taker because he did not sell mutual funds and annuities like most other brokers. He traded stocks and options and most of his accounts were discretionary. Some manag-ers have a different way to look at those kinds of things. Some of them don’t want to take the risk.
Tim said to himself that he could trade his own account and make a living doing it without putting up with all the politics of working at a brokerage fi rm. So Tim ended up leaving Smith Barney and decided to
just trade his own account. After Tim left Smith Barney they split
all of his accounts between the brokers in their offi ce. A lot of his customers started calling him. They asked him how is this broker they gave me. Is he any good? They asked him, if he was going to go to work for any other brokerage fi rm, because the guy handling my account I don’t like. He is telling me I should buy mutual funds or get a money manager to handle my money. They asked Tim if they could just give him the money to trade with and give him 20 percent of the profi ts he made. Tim said that he could not do that because he was not a broker anymore. A lot of people came to Tim for help. Tim said no, I am just going to trade my own account. Many of these people said, how about teaching me how to trade then? So Tim started teach-ing a little, but not for money. Just to help his old clients out. The word started to get around that Tim had left his fi rm and was just trading his own account and was teach-ing other people how to do it. There were so many people asking for help that Tim decided to charge them money to teach them. Tim decided maybe he should just put something together and make it a busi-ness. Tim liked to teach people, because it made him feel good. Tim fi rst started to teach people for about a day and would charge them $2500. It started to snowball. Many people who Tim had previously taught said to him maybe $2500 is too cheap. So Tim changed it to $4,000. The business kept growing and more and more people wanted to be taught. So Tim then raised the price to $6,000.
Tim fi nally opened an offi ce who’s main purpose was to teach people how to invest and trade in the markets. His company is called TCI. Some of his stu-dents asked him for the opportunity to open another offi ce and market the trading school for him. Tim held back on this for a long time. He said to himself, do I really want to get that big, because my lifestyle was really cool now. Tim asked himself, what would it be like if I expanded? So Tim thought it over and said if I am going to go big, I probably want to go big all the way. So he said, maybe I should. So he
For more information circle No. 8
Commodity Consultants, LLC assists firms in the hedge fund and commodity futuresindustries with the start-up of their operations and ongoing compliance matters. Theservices provided include:
• Monthly financial statement preparation
• Commodity fund, hedge fund, CTA, and IB preparation & consulting
• Compliance examinations
Reduce costs and increase efficiency through outsourcing.
For more information, please visit our web site at www.commodityconsultant.com, or
contact Mark Ruddy at (301) 530-1339.
CCommodity Consultants, LLC
For more information circle No. 9

tradersworld.com • Spring 2001 13
Try us Free for Four Weeks!Try us Free for Four Weeks!Try us Free for Four Weeks!Try us Free for Four Weeks!
ChoicePicks.com
Members Receive...
•Daily Stock Analysis
•ChoicePicks.com Portfolio!
•Specific Buy and Sell Targets
•Valuable Educational Tools
Rules to Trade…
Tools to Trade
ChoicePicks.com is an online educational
investment service offering a unique sector-oriented approach to trading
based on their Volumentum Indicator.
Free weekly picks, newsletter, technical
analysis and valuable educational tools are offered on the Web site.
Premium services offer daily stock picks,
advanced technical analysis and portfolio management.
did it. He opened the next branch and then another and another. It snowballed. Today he has 12 branch offi ces across the United States.
Tim feels these branch offi ces will train people with the necessary skills to make them successful trading and invest-ing in the markets. Not everyone is going to be successful with what they are teaching. People who take their classes even if they don’t do well; they know that the instruc-tors will give them 200 percent effort to help them. They also have a full year of fol-low-up support via an toll free 800 number. The people teaching at these offi ces are honorable people.
Tim’s goal is to make an impact in this industry to educate people. In the invest-ment business many uneducated people are being taken advantage of. A lot of people just don’t know any better. They don’t know where to get help. Tim worked with brokerage fi rms and knows how much these guys really know. A lot of brokers just got out of college with a degree and got a job in a brokerage fi rm. The bro-kerage fi rms have led these brokers to believe that they can manage money with no experience. They have no clue on how to manage money. Tim said he wants to educate people so that they can control their own destiny, so that they don’t have to rely on people that are incompetent to manage their money.
Tim says the number one thing that makes some traders successful and others not is commitment. If a person is commit-ted to doing something, he will fi nd a way to succeed. The human thought process is powerful. Most people really don’t start thinking until they are desperate. Think about all the trial and tribulation periods people go through. Think of the lowest point in someone’s life. A person might owe lot of bills and not have any way to pay. Tim has been there as many people have. Somehow and someway a person in this unfavorable position works himself out of it. Our minds are really powerful. The most important thing to success is constant commitment. If a person has this commitment he is going to fi nd a solution to accomplish what he wants. The best run-ning back or wide receiver in football is not the fastest person, not the strongest or the biggest. He is the one that has the most commitment and works the hardest. He is the one that never gives up. The best quar-terback, like Joe Montana, he doesn’t have the strongest arms, he’s not the biggest, and he’s not 6’ 5” and 225 pounds. Joe has the commitment and the will to be the best.
If you are interested in learning more about Tim’s investing and trading in the markets, and how he uses motivation, there is now a new book available, “Methods of Trad-ing”. It’s available from Traders World at $49.95 Call 800-288-4266.
For more information circle No. 10
14 Spring 2001 • tradersworld.com
Murrey Math S&P 500 Futures Price Reversals Set To: 16 Day Trading SquareBy T.H. Murrey
Theory: All markets are set to Price movement to the right over Time against old highs or lows. Please don’t believe this anymore. This is the wrong
way to set your trading frame. We set frames in advance into the future and let the price come to us. It’s much easier.All markets are running up and down on either side of its current 4/8th MM Line inside its current trading frame. You don’t have to worry how to set it. Our software program sets it. All extremes in markets above (or below) our preset 0/8th and 8/8th are created by “rookie” traders, who are greedy on tops and bail out too late in exhaustion, sell offs.
No experienced trader would have been long any NASDAQ stocks after it had already run up + 100% in only 5 months as of March 2000.
Every software program, Fibonacci Sequence Ratio Future Price Projector said sell last March 15th, 2000, but every-one wanted + 5% more free greed before they would sell.
No one I know ever heard what W. D. Gann and I said about Time and market speed of appreciation based on each season which is 13 weeks.
I wrote an article proving that the NASDAQ Index was destined to reverse up at 5,000 simply because it had appreci-ated from 2,500 up to 5,000 in fi ve months from October to April.
Please go back to the last issue of Trader’s World Magazine and read where the proof is that all price movement is set to math (up and down) and the four sea-sons to the right.
On October 8th, 2000 everyone was told the world was coming to an end and all NASDAQ stocks would be worth only 12.50 before they got back down to P.E. Ratios, that would make them worth buying short term. What now?
Stocks reverse by mutual fund com-puters. There are over 47,000 mutual funds spitting out buy/sell orders faster than logic can tell them what to imagine will happen next.
Most high profi le money managers simply let an expensive software program tell them where to buy or sell, off highs or lows, against having to keep 5% in cash. That’s all they do to keep their jobs.
The only true stock indicator, without any computer program, for reversals is seen in reversals of the S&P 500 Futures Index set inside our MM Harmonic Trad-
ing Frame.Pure and simple logic tells us that the
S&P 500 Futures Index serves only one good purpose: a trend reversal signal, to allow us to enter “longs” in other markets just as we see it reverse.
There are numerous simpler ways to profi t off market reversals than to try and “master” the S&P 500 Futures. You are always late entering S&P 500 Futures trades. This is the hardest market to trade and profi t from. Addictive personalities love to trade this market. This market has very few good traders.
The S&P 500 Futures contract is a great “reversal signal” indicator, but it will never replace the S&P 500 Cash Index and S&P 100 Cash Index for telling us when all stocks will stop to the upside or down-side.
We don’t want to discuss an easier way to trade in this article. We have plenty of students who make 20% per month aver-age trading a NASDAQ Index Hedge fund. Why struggle to profi t? Simply watch for market reversals.
The cash takes over after the futures reverses in all markets. After the futures reverse in any market, the cash pushes it to its 3/8th or 5/8th moves. We always shift our thinking from the futures to the cash after any market reverses. We decide to change strategy when the futures tell us it is reversing.
The S&P 500 Cash Index, S&P 100 Cash Index, are subject to reversals of the futures.
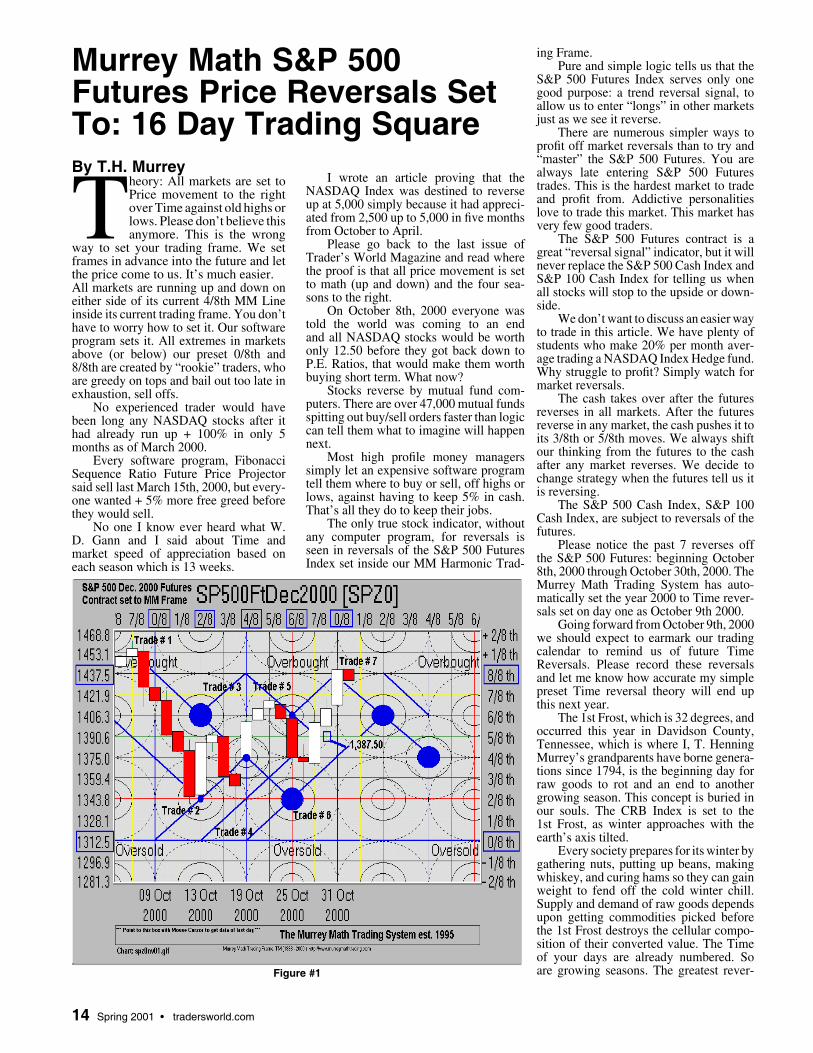
Please notice the past 7 reverses off the S&P 500 Futures: beginning October 8th, 2000 through October 30th, 2000. The Murrey Math Trading System has auto-matically set the year 2000 to Time rever-sals set on day one as October 9th 2000.
Going forward from October 9th, 2000 we should expect to earmark our trading calendar to remind us of future Time Reversals. Please record these reversals and let me know how accurate my simple preset Time reversal theory will end up this next year.
The 1st Frost, which is 32 degrees, and occurred this year in Davidson County, Tennessee, which is where I, T. Henning Murrey’s grandparents have borne genera-tions since 1794, is the beginning day for raw goods to rot and an end to another growing season. This concept is buried in our souls. The CRB Index is set to the 1st Frost, as winter approaches with the earth’s axis tilted.
Every society prepares for its winter by gathering nuts, putting up beans, making whiskey, and curing hams so they can gain weight to fend off the cold winter chill. Supply and demand of raw goods depends upon getting commodities picked before the 1st Frost destroys the cellular compo-sition of their converted value. The Time of your days are already numbered. So are growing seasons. The greatest rever-Figure #1
tradersworld.com • Spring 2001 15
The futures forecast uses Elliott Wave and Fibonacci Cycle Techniques to help predict cycle tops and bottoms for futures and option traders.
When is the next cycle high for the stock market? Has the low in cur-rencies been made? A new bull move for precious metals? Have we seen the high for crude oil and unleaded gas?
Where should the low in T-Bonds be? Where is the high point for cattle and hogs? A new bull market in beans, wheat, and corn?
Write or call for your FREE copy of the most recent update, or for infor-mation to set up an account.
THE FUTURES FORECAST
For more information circle No. 11
1-800-621-2719www.anspacher.com
ADM Investor Services10 S Wacker Dr. #2935
Chicago, IL 60606
sal days are already numbered if you start on our 1st Frost Day, which changes each year. We are in a Leap Year presently. In Murrey Math you are instructed to reset your trading frame off preset Times. Most traders start from a high or low which is the wrong way to do it.
If you really knew back in 1927 how simple it is to trade, would you tell other traders the truth? Gann told the world he would let them know that the crash would come in the 1st Fall Frost of 1929 and the low in the Depression would occur exactly 6 months on the other side of the axis tilt of the Earth, which was July 4th, 1932. You don’t have to go back any earlier than the 1st Frost of 1999, when the NASDAQ Index was down at 2,500. It reversed up fast and 5 months later it had doubled in price. 2,500 to 5,000 in fi ve months has never been done before. Four weeks later it had fallen back 75 percent. Gann said all markets should fall back 50 percent after a fast run up to be worthy of buying short term. Where was Gann when we needed his common sense?
The Time 19.53125 years equals 1/8th speed. Please move forward every 19.5 years from the high of 1929 and see what the Dow 30 Stocks did. It reversed off these old MM 1/8th dates. If you ever come to the truth on this subject you will see it. W. D. Gann and I saw that all markets begin over every fall on the 1st Frost. You have no choice but to convert to our way of thinking, learning, trading, and fi nally profi ting off simple rules. Please try and decipher all those esoteric trading strategies set to cabalistic terse jargon. It takes the average trader one cycle of the moon to unlearn bad trading habits. If you want to speed up your mental habit con-vert it to pure logic? You must change techniques.
Please come to my web site and look at stocks, bonds, currencies, and commod-ity charts set to last year’s automatic Time Reversal Dates set off last year’s Frost. We set all markets to the same simple Time Frame: Frost. There are three sets of Inter-nal Time Frames inside one year’s trading calendar:
1) 64 days2) 32 days3) 16 day
The Sixteen day Time Trading Frame is a traders’ frame price/speed/ratio that gives you the most profi t per run up or down.
Since every investor coming into trad-ing is a beginner. Every market also must start over. Everything has a birthday or starting point. Now, let’s move into this year’s new Time Trading Frame, which started on my birthday. This year we are “running” to: 4, 8, 16, 32, or 64 days, off my birthday, which occurred October 9th 1942, which next spring shall be exactly + 3/8th which is 58.59 years.
My life-span is set to El Nino. El Nino is set to 156.25 years in time. This may be proven going back to minus 10,390 b.c. and the star Soraya that shined into the Pyramid at Giza, in Egypt. This star was called Teli in Gensis. It means ball on a string.
All markets want to reverse off Time Cycles of 19.53125 years. We must learn to be more exact with our Time Predic-tion Frames. There is no 20-year cycle. There is no 60 year cycle. You must get this out of your trading strategy. W. D. Gann copied this cycle from The Book of fate from China. Did you know it? Please convert to 19.53125 year cycles.
Please multiply 19.53125 years by 3 or 5 or 8 and look for market reverses off this starting point? Hint: I have already revealed this in an earlier article in Trad-er’s World Magazine some issues back.
We may start our preset Murrey Math Time Lines: 4 days, 8 days, 16 days, 32 days or 64 days. This is why Muneshia Homma, from Japan, in 1724 said no commodity wants to move in one direc-tion, up or down, more than 10 to 12 days in a row.
Were you really surprised when the NASDAQ Index fell - 75% in only four weeks, when it had just run up + 100% in only 5 months.
Please read how W. D. Gann and I predict about market “doubles” against
multiples of the number thirteen. Thirteen equates to the alphabet’s word love and one. One MM Trading Frame of 64 days is equal to one quarter or thirteen. This is how we anticipate Time market rever-sals forward. We know to begin on the 1st Frost:
# 0 October 9th, zero day,# 1 October 13th, 25% day,# 2 October 19th, 50% day,# 3 October 25th, 75% day,# 4 October 31st, 100% day.
The Murrey Math Trading System’s 1995 preset Time dates matches up to the T-3 Rule by the S.E.C. This forces every stock trader to align himself to our nat-ural Time reversals by forcing brokerage houses to keep your money for three days after you sell, then give it back on the fourth day. This stimulates cash fl ow infu-sions on our preset days, once any market starts reversing on our MM Time Lines. T. Henning Murrey set the market’s rhythm to the hertz magnetism of the Earth: 3:1, four days. Please don’t try and understand it, just use it.
Start of the 2nd (16 day) Frame was October 31st 2000. Based on this, the general markets should fall lower short term. Please look at our chart of the S&P 500 Futures, Dec. 2000 Contract and see for yourself how often the stock market
16 Spring 2001 • tradersworld.com
Jack Winkleman Trading Seminar
Mr. Winkleman will teach you the secret to trading using his Gann math-ematical techniques never revealed before! Your learn:
• Gann’s secret number and how to apply it to the market. • How to forecast the probable highs/lows and their dates. • How to tell if its going to be a high or a low on a specific date. • To apply squares in a natural way from highs and lows. • Where to expect the next recurring cycle. • Unique astro timing of the markets. • You’ll also learn how you yourself should trade that market • Gann’s secret number and how to apply it to the market. • How to get an almost perfect 100% trade. And much, much more...
For more information or to register go to:www.tradersworld.com/seminars Call 1-800-288-4266
Plus you get 3 months of telephone followup.
If you are looking to learn the most advanced trading method limited to just 20 people at this this important seminar.
A NONDISCLOSURE FORM MUST BE SIGNED.
Price: $2500 (you won’t be disappointed!)
For more information circle No. 12
reverses off our preset dates. See Figure # 1. Please begin a count of 4, 8, 16, 32, and 64 trading days for the next year and “record” how many reverses occur on this simple Time formula.
We are able to predict the future of the S&P 500 Futures market off my birth-day, for this year. It will be consistent for the next 1,250 years into the next millen-nium.
Every sixteen trading days we get stronger reverses. Why waste your trad-ing strategy learning time trying to fi gure, which is the best Time Reversal Day off which Time Frame. Simply remember to count to 16.
Please look at October 9th and now go out into the future to October 31st for the next reverse. Gann told you to take the last high or low extreme, going back at least one year. and set your square in Time and set your 8/8th.
We believe that with Murrey Math we can fi ne-tune your thinking by accepting preset Price and Time MM Lines and not waste Time by guessing where to start any Frame.
Does it really matter to you if you miss, by one day, a reversal in the Dow 30 if it moves up + 1,250 points the next eight? The Dow 30 Stocks just went up 1,250 points one day after everyone was bragging about predicting lower lows.
Why do so many want markets to drop lower after they are already low?
87.5% of all traders spend too much time studying Time reversals, when they should be cashing in on 2/8th Price moves. Everyone is still thinking the markets are low and we see that you could have made + 482 points in the hardest market to trade, by simply reversing every four days.
Today, we are discussing Time. We want to automatically preset our Time Square and trade off standard Time Lines inside the Trading Frame. We always go back 12 months, then 6, then three months for support or resistance to go long or short against.
If you look at charts done by W. D. Gann, you will arrive at the same conclu-sion, as we did, that all markets begin each fall on the 1st frost. If you believe thir-teen to be a lucky number, please go and see what markets do every 3 months or 13 weeks. A detailed study of major stock market reverses was done by an Austra-lian and he reported that 87.5% of all big moves occur within one week of each thir-teen week cycle extending out from the last week in September. Why does this repeat happen?
W. D. Gann laughed at all of you for not seeing his joke in his famous May 1948 Soybean chart. Please go back to October in 1947, and you shall see what
I did. He began his famous astrological chart simply off the 1st Frost. It was so simple he hid it from you by calling it May 1948.
Most traders don’t like doing their homework, so they want someone to tell them how, when and what to trade. Now, if the trade doesn’t work every time they switch witch doctor gurus to another one, who will think as they do not as they need.
Most new rookie traders and old worn out traders are out there trying to learn too much information, when all you need to know is which four ways to measure any market’s reversal. All markets reverse off:
1) horizontal MM Price lines,2) vertical MM Time lines,3)45 degree angled MM Lines4) 11.25 degree MM Speed lines.
Presently, we are addressing the 2nd most critical traders’ strategy which it’s Time. Historical Note: Gann “preached” Time is the 1st factor and Price is second. We have found that with computers (today) Price is # 1.
Time Reversals must be “fi ltered” into the other primary “fi lters” that give us directional changes based on thinking and consumption.
Stocks are traded off thinking. Com-modities are traded off consumption. You can miss quote, but can’t destroy millions of acres of soybeans, when you see them piled up at the rail head waiting for some-one to ship them or let them rot at the next rain. Remember: Gann taught commod-ities only. He hated stocks because they were subject to overnight lies of a few that affected the entire market. Why be subject to others sins?
Gann would laugh at stock traders for allowing themselves to be subject to losing gains from the whim of news hounds who whip lash entire markets off one sentence of “poor earnings.” Does it happen today?
If coffee falls from too much over supply does Orange Juice fall in sympa-thy? Does lumber fall when Cotton falls? Do Live Hogs go up when Live Cattle moves higher? Why care? All markets are reacting to:
1) our Internal Harmonic MM Lines,2) our Internal 5 Circles of Confl ict,3) the last high and low extremes,
actually the present 0/8th and 8/8th off the closest 4/8th,
4) where any market is (currently) above or below its MM 4/8th.
Please count how far our futures market ran up or down inside our preset Time Frame:
Trade # 1 fell - 7/8th,Trade # 2 rose + 3/8th,Trade # 3 fell - 4/8th,Trade # 4 rose + 6/8th,Trade # 5 fell - 5/8th,
tradersworld.com • Spring 2001 17
INCLUDING MATERIAL NEVER BEFORE AVAILABLE IN ANY PREVIOUS COLLECTION.
ORGANIZED TOPICALLY BY SUBJECT & APPLICATION FOR CLEAREST UNDERSTANDING.
NOW IN 5 DETAILED VOLUMES
I. MARKETING BROCHURES, INTERVIEWS, ANNUAL FORECASTS & TRADING RECORDS
II. THE MASTER TIME FACTOR: NO. 3 MASTER FORECASTING METHOD & ADVANCED STOCK
MARKET FORECASTING COURSES
III. MASTER MATHEMATICAL FORMULA, CALCULATORS & ASTROLOGICAL WRITINGS
IV. THE COMPLETE COMMODITY MARKET COURSES
V. INTRODUCTORY STOCK COURSES, MECHANICAL METHODS, & TREND INDICATORS
Each Volume Available Individually Or As A Complete Set:
5 Volumes, 4 Large Plastic Calculators, & 30 Oversized Charts. $1,000.00
THE ONLY SOURCE FOR THE
INVESTMENT CENTRE SEMINARS
“GANN HARMONY”THE LAW OF VIBRATION
BY
DR. JEROME BAUMRING
THE MOST ADVANCED & DETAILED
INTERPRETATION OF W. D. GANN’S
THEORIES EVER PRESENTED!
100’S OF TITLES ON THESE ESSENTIAL SUBJECTS
NATURAL PHILOSOPHY - COSMOLOGY - VIBRATION
ASTRONOMY - HARMONICS - CYCLES -NUMEROLOGY -
ASTROLOGY - SACRED GEOMETRY - QABBALLAH -
NATURAL ORDER - ANCIENT CIVILIZATIONS -
METROLOGY - FREEMASONRY - HERMETICS
BAUMRING’S RECOMMENDED READING LISTS
W. D. GANN’S RECOMMENDED READING LIST
- SACRED SCIENCE INSTITUTE -
THE MOST COMPLETE,
BEST ORGANIZED & BEST PRICED
COLLECTION OF W. D. GANN’S WRITINGS
EVER OFFERED IS NOW NEWLY AVAILABLE!
THE COLLECTED WRITINGS OF W. D. GANN
WWW.SACREDSCIENCE.COM EMAIL: [email protected] (800) 756-6141
LARGEST COLLECTION OF WRITINGS BY
THE GREATEST MARKET MASTERS
THE COMPLETE WORKS OF
GEORGE BAYER
For more information circle No. 13
Trade # 6 rose + 6/8th,Trade # 7 fell - one ½ of 1/8th.No actual extreme high/low reversal is
considered when we set our 8/8th. Every other software program sets trading action against the two latest and widest extremes. Wrong.
Murrey Math students prefer to believe what W. D. Gann said on page 64, which was to trade the natural numbers. Do you? We have addressed this natural trading frame in previous articles in this maga-zine. Gann spoke to the subject of seasonal and anniversary date reversals. We concur. Please don’t fall into the Fibonacci Ratio trap of believing all markets are driven by a desire to want to reverse after 3/8th or 5/8th. Please don’t fall into the bean count-ing trap of thinking every move is going to be 3/8th or 5/8th. You will miss the fast money waiting for the big move. Please go and count how many moves reverse after only 2/8th.
Why do you think Mr. Gann pushed the 3/8th and 5/8th move theory? Do think he was exiting off your staying in an extra 1/8th? Yes sir. Remember he only stayed in a trade an average of 43 minutes. If he told you to follow the trend, why didn’t he?
Would you be satisfi ed to close out your positions with only 2/8th profi t, or would you want to make the last 1/8th of every move?
The question comes down to whether or not you want to make fast money or try and brag about how many successful trades you made with a high profi t margin. Who cares later? This market has run up and down a total of 31/8ths and it still hasn’t escaped our MM Trading Frame set off an Internal Octave set in a square. The Chinese exposed this simple musical box stanza logic in 3,125 b.c.
Each 1/8th, for this market, is equal to 15.625 points El Nino. Each S&P point move is worth + $ 250. Please read for-ward and count how many total points profi t reversing off Murrey Math Price and Time accumulates.
Everyone can always make any trade the next day after there is no threat of loss. Please read what happened:
1) Reversal (on high at) MM 7/8th Time Line: 1,456 - fell to 1,343.75. Stopped down on MMT Line 2/8th, exactly. Fall: exactly - 7/8th) inside MM Harmonic Trad-ing Frame. Short: winning points in fi ve trading days: + 112.50 points profi t. Spe-cial Notice: gap down open: Sell Signal
2) Reversal (on lows at) MM 2/8th Time Line: 1,343.75 - up to 1,390.625. Reversed up on MM 2/8th Line exactly. Long: win-ning points (in two trading days) + 47 points profi t. Stopped up on MMT Line 1,390 exactly. Move up (exactly + 3/8th) inside MM Harmonic Trading Frame. Spe-cial Notice: Oct. 13th reversal off 45-degree up angle inside square. Special Notice: gap
up open: Buy signal
3) Reversal (on lower highs at) MM 5/8th Trading Line: 1,390 - down to 1,328. Stopped down on MMT Line (exactly) 1/8th. Short position winning points (in only two trading days) + 62.5 points profi t. Fall (exactly - 4/8th) inside MM Harmonic Trading Frame. Special Notice: October 18th reversal touch-reversed exactly off MM Speed Line. Special Notice: gap down open: Sell Signal
4) Reversal (on lows at) MM Trading Line 1,328 - up to 1,421. Reversed up on MMT Line 1/8th 1,328, exactly. Long: winning points, in only four trading days + 93 points profi t. Move up: (exactly + 5/8th) inside MM Harmonic Trading Frame. Spe-cial Notice: October 18th reversal signaled off MM Speed Line inside square. Special Notice: gap up open reversal below yes-terday’s close: Sell Signal below 1,359 MMTL
5) Reversal (up on highs at) MM Trading Line 1,421 - down to 1,348. Reversed down on MMT Line (exactly) 7/8th. Short: winning points (in only fi ve trading days) + 73 points profi t. Move down: - 4. ½ MMT Lines inside MM Harmonic Trad-ing Frame. Special Notice: low price rever-sal occurred on: MM Momentum Line
45 degree angle. Special Notice: formed “Evening Star” tails off highs: Sell Signal6) Reversed (up off lows at) ½ MMT Line 1,348 to 1,437.50 Reversed up on ½ MMT Line. Long: winning points (in only four trading days) + 89 points. Move up: + 5/8th MMT Lines inside MM Harmonic Trading Frame. Special Notice: Reversed up exactly off MM Momentum parallel 45 degree angled Trend line
7) Reversed (lower off highs) 1,437.50 Reversed down off 8/8th MMT Line. Move down - ½ of 1/8th. Short: winning poin-tsin only one trading day Special Notice: gapped up then went lower 18 Trading days: (on 7 trades) resulted in the follow-ing: Winners - money - Profi ts - confi dence - wealth - stability - wealth
1) Short: winning points (in fi ve trad-ing days): + 112.50 points profi t
2) Long: winning points (in two trad-ing days) + 47 points profi t
3) Short: winning points (in only two trading days) + 62.5 points profi t
4) Long: winning points (in only four trading days) + 93 points profi t
5) Short: winning points (in only fi ve trading days) + 73 points profi t
6) Long: winning points (in only four trading days) + 89 points profi t
7) Short: winning points (in only one trading day) + 5 points profi t
18 Spring 2001 • tradersworld.com
1-800-288-4266 www.tradersworld.com (order on-line)
The MurreyMath Trading Frame software program will automatically decide for you if a market is Over Bought or Over Sold, and automatically display the Trading Strategy whenever the Daily Price Action
The MurreyMath Trading Frame Software• All Gann Lines (8/8ths)• All Vertical Time Lines• All Squares in Time Lines• Entry Price Points• Set all Overbought/Oversold Lines• Set 5 Circles of Confl ict
• Set Parallel Momentum Lines• Set Speed Angles (7)• Set Learning Mode Data• Present “Best Entry Price”• Present Daily Volume differential• Sell 50.% of Position Price Points
PRICE $750.00End-of-Day version includes: Two Sets of Software,
Murrey Math Book, CD Learning Lessons & EMail Updates
For more information circle No. 14
MURREY MATH SUPPLIES
Murrey Math Bookalone
$78.00
90 Day Software Trial & credit for full version
$90.00
+ 482 points profi t on 7 trades going through one (16) Daily MM Harmonic Trading Frame (to the right through time). This is not luck. It is harder to reverse with a market than to thread a camel through the eye of the camel. What was the eye of the camel really? Certain people really could get through it.
The S&P 500 Futures Market starts over every year at the 1st Frost. The US 10 Year Bonds do the same thing. They reevaluate infl ation against raw goods to fi nished supply. Too many rookie traders and old tired traders need much more help than the support of weekly market support levels to assist them in deciding to con-tinue with a trade “long” or “short.” MM / Gann provides the best answer.
Every successful trader learns from a teacher who has a rule to cover any trade situation. We provide simple, consistent rules wrapped around Gann thinking.
I learned to trade from Maynard Holt from Nashville, Tennessee. He traded in the pits in Chicago and learned from Andrews. Maynard Holt is a Master Level#13 Trader. Very few teachers qualify. You must be an active trader to qualify with at least 5 years of active trading to prove your theories. Why learn from someone who won’t trade their own trading strategy? We spent hours conversing every Friday after market hours. It isn’t possible for us to meet today and talk trading and not share knowledge about how Gann would have traded a certain market. We don’t say what we think, but refer to how he thought.
The Internet messaging system solves lots of time and space learning problems. Every Sunday night I predict for my pri-vate E Mail Group, the support and resis-tance for all the major Indexes, so we are ready to react off logic, math, and expe-
rience rather than emotion, tips, and t.v. commentator gossip.
Few serious traders today, have the time or patience to learn another trading system, after investing in so many past theories. Our Weekly Private Group is able to read my thoughts about where I expect support and resistance to reverse every market, off math lines inside preset trad-ing square.
It is a better trading class when every-one is thinking the same thing and looking at the same trading 8/8th. Trading should be simple.
Please look at a simple example of how to judge whether a market will reverse lower or continue up higher to its 8/8th MMT Line.
October 31st 2000 is a Tuesday.October 30th 2000 is a Monday.October 27th 2000 is a Friday.
The S&P 500 Futures moved up strongly last Friday and closed far enough above our MM 4/8th Line signaling that this market would travel up at least one more 1/8th (to 1,421).
Please fi nd the small square that encompasses the inter day low opening gap down reversal of this market that reversed minutes after the market opened and moved the Dow 30 stocks up over + 250 points
Today’s October 30th gap down open low was 1,388.50. Immediately it reversed and pulled the cash markets up with it. The S&P 500 Futures reversal drove Dow 30 up + 250 points in one day of trading.
Exert from MM Private Weekly Pre-dictions placed on Private Web Board each (Sunday) night: October 29th for the next week’s Trading Frame.
Gann said to trade off Weekly Charts
and weekly Price change data. Then switch back to inter day to make fast profi ts off fast reverses.
This is an exact copy of our predic-tion: week of October 27th, 2000:
Market: S & P 500 FUTURES Symbol: SPZ0 Contract: DEC 2000 Open: 1369.900024 Close: 1401 Waist: 1385.450012 Volume today: 872.629943 Volume Yesterday: 788.989990 Reversed on MMTL: 3/8th 1,343.75 Length of Last Run: Up + 2/8th off - 6/8th fall Trading Range 0/8-8/8: 1250-1500 Trading Frame Days: 16 Target Price to Sell: up at: 1,406, 1,437, or 1,468 Target Prices to Buy back: na Price to Go Long: better support down at 1,387.50 Comments: stay long if Monday doesn’t fall more than 1,387.50 support Murrey’s Results Last Week (7): The S&P 500 Futures gapped down on the open and reversed exactly at 1,388.50. The cash markets went up + 250 points off this simple reversal off our MMT Line sup-port on our 5/8th line, which we call the Premium Trading Range, where the rook-ies buy in.
T. Henning Murrey teaches that the futures contract reverses the markets and the cash drives forward on its own power.
T. Henning Murrey and his simple trading system, October 30th, missed the low reversal by only one point at the start of the day. You would have made + $ 4,000 per contract off this sentence, if you reversed with the futures market’s support at 1,387.50. What is hard about trading off MM? Change.
Please look at Figure #1, the attached chart of the S&P 500 Futures for only 18 days Time. Please observe the MM Time Lines, preset off our Harmonic square in Time. You will see that Time is measured along the top of the chart. Why waste Time guessing the frame?
Trading is no more diffi cult than your mind makes it or your friends confuse your strategy. Do you punish your ego by going against your natural instincts? Is this simple approach too hard to convert to? The Murrey Math Learning Center wants to present simple trading strategy formulas that will stand the test of time. Time has no test. If the Earth tilts back every fall and raw goods freeze, the mar-kets will go up and down in price off supply and demand. The three best months in the stock market are always in the fall of each year. Why?T. Henning Murrey is the author of The Murrey Math Trading System. For more information on Murrey Math go to www.tradersworld.com/murreymath

tradersworld.com • Spring 2001 19
By Daniel T. Ferrera
In 1954, at the age of nearly 76, W.D. Gann released a course based upon mathematical rules for making market predictions. In the advertisement for this method the author of the add writes: “We will not sell the course of instructions or teach the mathematical formula for market predictions just to get
money, which we do not need or have to have; we will only sell the courses to people who meet our requirements, and if we feel after a thorough investigation that a man or woman cannot make a success investing or trading we will refuse to teach them the courses”. “The Master Calculator can only be used with the Master Courses. It is not sold separate from the other courses”. The price shown for Gann’s Master Course in this ad is $5,000.00, it does not list the addi-tional cost of the Master Mathemat-ical Calculator. The ad describes the calculator as a plastic overlay that accurately measures Time, Price and Trend. Many Gann experts and students have tried to use these overlays, which require the chart to be hand drawn to a proper scale on graph paper that has 8 squares to one inch. This creates a lot of extra tedious work. This has caused one of Gann’s greatest discoveries to have been overlooked for many years. I know that some software programs have the ability to make these overlays on price charts but that is still not going to help most people because it turns out that there are also very precise mathematical rules regarding the hori-zontal axis or Time! In fact, these same mathematical rules apply to price as well but we will leave this topic for latter. The adver-tisement itself contains clues about the calculator, such as “W.D. Gann’s Record for 52 years”, “After fi fty-two years of experience and research going back hundreds of years, I have proved to my entire satisfaction that history repeats and that when we know the past, we can determine the future of prices”. The calculator that
Gann’s Master Mathematical Formula
Gann is talking about in this ad is his square of 52 overlay, which is based upon the 52 weeks in a year. The basic overlay looks like the square in the middle of this page.
This is also the same geometric form that Gann used for the Square of 90 and Square of 144 plastic overlays. This basic structure or overlay appears in many books on Sacred Geometry and is also the secret to George Bayer’s “Trend Determination” course. Get-ting back to Gann and the square of 52 course we fi nd that this is the course where Gann made the confusing statement: “ Within the circle forms the square, there is an inner circle and an inner square, as well as an outer square and an outer circle which prove the Fourth Dimension in working out price movements”. This quote is describ-ing a fractal nature or structural pattern existing in the markets that is the same on smaller levels as it is at larger levels.
Jumping over to Gann’s Angle course, on the last page, GA-32, Gann says: “Figuring $100, or par, as a basis for stock prices and changing these prices to degrees, 12½ = 45-degrees, 25 = 90-degrees, 37½= 135-degrees, 50 = 180-degrees, 62½ = 225-degrees, 75 = 270-degrees, 82½ = 315-degrees, and 100 = 360”. This tiny little paragraph is the basis of the entire Murrey Math Trading Course, which read-ers of Traders World should be very familiar with since, T.H. Murrey has written numerous arti-cles for the magazine. These num-bers are all natural 8th numbers off of the base of 10, 100, 1000, 10000, 100000, etc. The part that is most confusing is balancing this with the time element, but based on the information given by Gann himself it should be obvious that
he has already shown us part of the relationship. For example: If shares of XYZ stock moved up 12½ dollars in 45 days, weeks or 45 months then the stock is on the price degree of it’s time angle, that is to say that price and time are equal or balanced. Gann’s example: “When a stock sells at 50 on the 180th day, week or month, it is on the degree of its time angle”. “On February 1, 1915, U.S. Steel made a low at $38, which is closest to a price of $37½, which is 3/8th of 100 and equals 135-degree angle. Steel was 14 years or 168 months old on February 25, 1915, and hit the angle of 135-degrees, which showed that the price of Steel was behind time, but was in a strong position, holding at $38 above the 135-degree angle or the price $37½”. Just to make sure that you understand this informa-
For Market Predictions
20 Spring 2001 • tradersworld.com
tion, U.S. Steel would have been balanced or “on the degree of its time angle” at a price of $46 5/8th because $100/ 360-degrees = 0.27777cents per degree and 168 months multiplied by 0.27777 = $46.67 which is closest to $46 or 5/8th in price. Therefore, Steel is $8 5/8th behind time. I would stick to W.D. Gann’s time defi nitions when using this natural 8th system and his plastic over-lays as his method has a clear degree rela-tionship to both price and time and also to the fractal structure, which he described in the quote mentioned above. I will dis-cuss how to set up these charts properly in terms of time latter in the article with spe-cifi c examples. Gann goes on to say: “When Steel reached $200, it equaled 2 circles of 360-degrees (two complete cycles of $100). When it advanced to $261¾, it was closest to $62½ (5/8th) in the third cycle of $100 or nearest the 225-degree angle or 5/8th point, which is the strongest angle after it crossed the half-way point at $250 or the 180-degree angle”. Note that Gann rejects the two cir-cles or cycles of $100 price to convert the time angle. These instructions are also very different than what Murrey Math instructs students to do but I do not want to get into that subject.
Moving on to the subject of time we know that Gann placed great emphasis on the cardinal points of the solar year. These are the Vernal Equinox, Summer Solstice, Autumnal Equinox and Winter Solstice or March 21st, June 21st, September 21st, and December 21st respectively. Gann always said that the year begins at March 21st
square also maintains the exact center of our old square at $50. This new square is now an exact musical octave of the old square because it’s based upon powers of 2 or is exactly ½ our old square. This tells us that if we want to fi nd a square that is within our old square that we will only fi nd it between the two Solstice points in the year! If we wanted to enlarge the original square (to fi nd an outer square) we would again follow the natural law of the musical octave, i.e. powers of 2. The fi rst part of the problem is easy because we know that the next square is going to be twice as large as our old square. So this means that we are moving up from a one-year square to a two-year square in terms of time but this does not answer where in time this new square begins and ends. To calculate where this larger square begins and ends we have to use the rule “as above so below”. In other words, when we made the smaller square, we found that it existed within the larger square at the 25% and 75% points in time, therefore March 21st to March 21st is within the ¼ points of the larger square above it. In our one-year square, a ¼ of time is 90-degrees or 91.3125 solar days. This means that a ¼ of time in the next larger square is 180-degrees or 182.625 solar days, i.e. twice as big. If we add and subtract 180-degrees/days from our smaller square running March to March, we will fi nd that our two-year square begins and ends at the Autumnal Equinox. The same is true for a 4-year, 8-year, 16-year square, etc. Getting back to the inner squares, a 90-degree square (1/2 of our 180-degree Summer Solstice to Winter Solstice and winter back to summer circle) would begin and end 45-degrees after the Summer Sol-stice and 45-degrees before the Winter Sol-stice because 45 is ¼ of 180. This would be 45.65 days or ¼ of 182.625. So this means we would have another (90-degree) square running inside the (180-degree) Sol-stice squares beginning on August 5th and ending November 5th. Then just as we have two 180-degree Solstice squares running from Summer to Winter, then Winter back to Summer, we also have four 90-degree squares running from August 5th to Novem-ber 5th, November 5th to February 5th, Feb-ruary 5th to May 5th and May 5th back to August 5th. These are all exact mathemati-cal points to look for squares based upon Gann’s plastic overlay pattern. I am provid-ing two charts of the Dow Jones Industrial Average (closing price only) so that you can visually see what Gann was describing in his Square of 52 course. Anyone interested in studying Gann, should purchase their materials from Brad Stewart at Sacred Sci-ence Institute (www.Sacredscience.com), as I have found them to contain many unique sections of information that is not provided by others selling Gann related material. I have made many of my best discoveries, including the information presented in this article, from the course materials provided by the Sacred Science Institute!
(not January 1st) and that this was a very important seasonal time. Now this is where Gann’s “within the circle forms the square” quote gets real interesting! If we treat each natural year (March 21st to March 21st) as a complete circle, which it is because the earth has gone 360-degrees around the Sun, and take W.D. Gann at his word that there is a square within this orbit then we come up with some very unique geometrical infor-mation about time and squares, i.e. Gann’s plastic overlays. Lets build a hypothetical square running from Vernal Equinox to Vernal Equinox as our horizontal axis and we will use 0 to 100 as our vertical. If we draw in the two 45-degree Angles corner to corner we have a shape that looks like a box with an x in it. The two 45’s will meet at the exact center of both price and time at $50 on the Autumnal Equinox or September 21st. If we bisect this square again with a horizon-tal line going left to right at $50, and a verti-cal line going straight up from the Autumn Equinox we can create four smaller squares with half of the x already completed. If we complete these smaller boxes with the miss-ing 45-degree line we will fi nd that these points come out at $25 and $75 in price and also 25% and 75% in time or Summer Sol-stice to Winter Solstice (June 21st to Decem-ber 21st). If we take these 4 points, which are $25 on June 21st, $75 on June 21st, $25 on December 21st and $75 on Decembers 21st and make a new square, we fi nd that our new square is exactly half the size of our former square set within the ¼ points in terms of both price and time. Our new
ACCOUNTING SOFTWARE FOR TRADERS
Technicom’s latest fast and easy-to-use Account Manager 11 accounting soft-ware is specifi cally designed to create and maintain accurate records and audit trails as required by today’s traders conforming to the requirements of the IRS, the CFTC, and the NFA.
It will display and print practically any kind of report including P&S state-ments, open position reports, closed position reports, client statements, equity runs, pool client statements, performance summaries, and it can automatically export them to a fi le, fax, or email if you wish.
Graphical displays and printouts are included that will show the performance of ay client’s trading account in addition to performance summary graphs as required by the NFA suitable for disclosure documents in addition to the 14-col-umn performance summary.
Account Manager 11 can also create and maintain completely automatic accounting for both Pools and Pool Client shares.
The program optionally works with a number of live data vendors giving users instant viewing of all open position profi ts or losses.
Account Manager 11 is designed for use with all Windows 95, 98, and NT4 operating systems.
Technicom, Inc.736 North East 20th Avenue, Ft. Lauderdale, FL 33304-3414
Tel: (954) 523-5394 Fax (954) 523-3245Please visit us at www.technicominc.com
For more information circle No. 15
tradersworld.com • Spring 2001 21
By Larry Pesavento
When my daughters were small they would always ask me what I did for a living. It is diffi cult enough to explain it to
an adult - explaining it to a 6-year-old is impossible. I am a speculator. Speculator is a derivative of the Latin “speculare”, which means to “see”! I try to see oppor-tunity. It’s ironic that the Chinese letter for opportunity and risk are the same. The context of the sentence determines its meaning.
Speculation (i.e. trading) is a noble profession because it provides three ele-ments necessary for capitalization. First - transfer of risk from one party to another. Second - it provides liquidity for the movement of capital. Third - it provides a profi t motive for the individual in the transaction.
The fi nancial press loves to embel-lish the similarities of speculating and gambling. Nothing could be further from the truth. Gambling creates a risk when none existed before, such as the roll of the dice, spin of the wheel and the out-come of a football game. Trading has a transfer of risk from one party to another. This allows one of the parties (or both) to hedge or transfer the risk. This trans-
action is similar to an insurance policy. When an insured event occurs, the insur-ing party pays off the policy.
Tuition costs for the speculator’s pro-fession can be prohibitive. Studies have shown that 90% of all fi rst time traders lose. Those that remain and can survive the next three years will be ready to start consistently profi table trading. This makes it equivalent in cost and time to a college education.
As the time arrives when you are a successful trader, you can look in the mirror and feel proud. It’s the only adu-lation you will get because there are no commencement exercises. There are no fi nal tests or certifi cation. Your daily posi-tion statement will be the source of your strength.
If you are really one of the lucky ones, a neophyte trader asking for help will approach you. This wake-up call is your chance to help a fellow human being start a career that Confucius described: “Find a job you love and you will always be on a vacation”.
Larry Pesavento can be reached at the Trading Tutor, 4625 E. Camino Rosa, Tucson, AZ 85718 (520) 529-0569 E-mail [email protected]
Trading as a Profession
For more information circle No. 17
LARRY
PESAVENTO_______________
WILL TEACH
YOU TO
“TRADE LIKE A PRO”
DAY TRADE
LONG TERM
SHORT TERM
STOCKS
COMMODITIES
S&P & EMINI
A UNIQUE
APPROACH
TO LEARNING. A
ONE ON ONE
PERSONAL PROGRAM
ASK ABOUT OUR
UNUSUAL GUARANTEE
1-800-716-0099
SYMMETRICS SUPER TRADES
• Soybeans • Wheat • Corn • Hogs • Meal • Gold • Cotton • Cattle And many more, plus...
Cutting-edge daily predictions - using the latest Symmetrics technology - true squaring of price with time.
To sign up or for more information:www.tradersworld.com/trades or Call 1-800-288-4266
Joe Rondinone’s
It’s the ultimate service for only $100 per month.
ENTRY WITH STOP PRICE AND EXIT
Daily trades in selected commodities via E-mail
Trading in futures is not suitable for everyone. There is a substantial risk of loss in trading futures.
For more information circle No. 16
FREE2 WEEK TRIAL
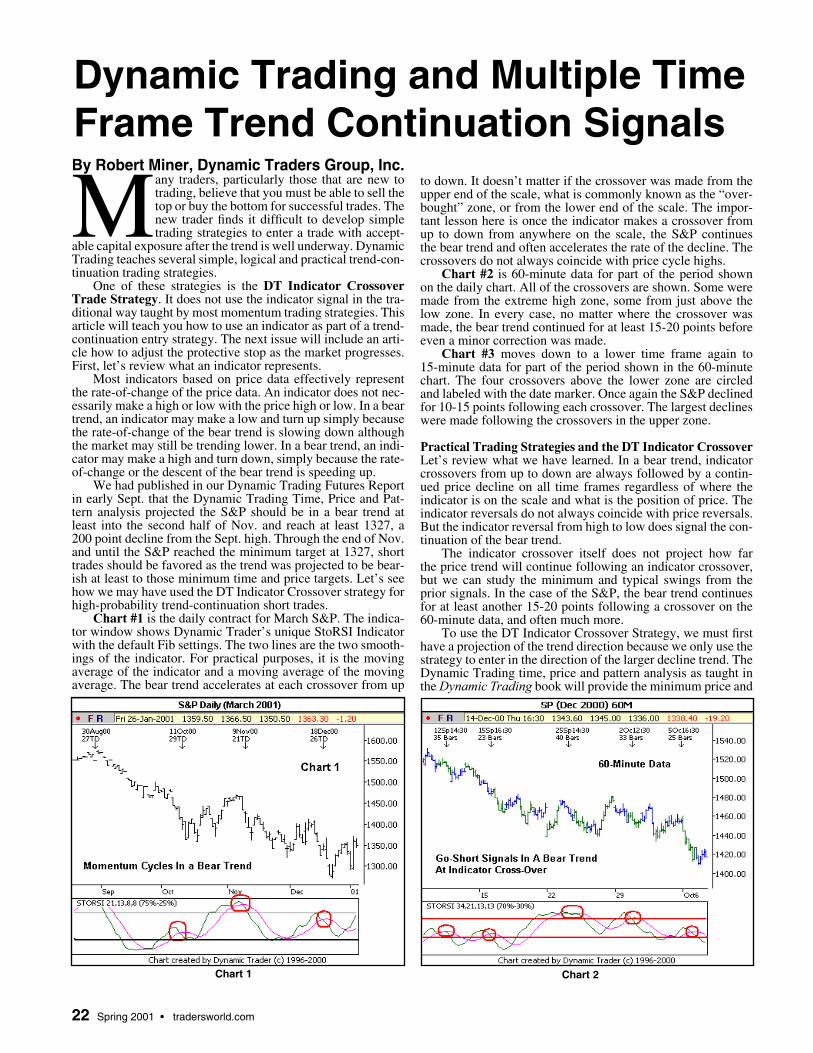
22 Spring 2001 • tradersworld.com
By Robert Miner, Dynamic Traders Group, Inc.
Many traders, particularly those that are new to trading, believe that you must be able to sell the top or buy the bottom for successful trades. The new trader fi nds it diffi cult to develop simple trading strategies to enter a trade with accept-
able capital exposure after the trend is well underway. Dynamic Trading teaches several simple, logical and practical trend-con-tinuation trading strategies.
One of these strategies is the DT Indicator Crossover Trade Strategy. It does not use the indicator signal in the tra-ditional way taught by most momentum trading strategies. This article will teach you how to use an indicator as part of a trend-continuation entry strategy. The next issue will include an arti-cle how to adjust the protective stop as the market progresses. First, let’s review what an indicator represents.
Most indicators based on price data effectively represent the rate-of-change of the price data. An indicator does not nec-essarily make a high or low with the price high or low. In a bear trend, an indicator may make a low and turn up simply because the rate-of-change of the bear trend is slowing down although the market may still be trending lower. In a bear trend, an indi-cator may make a high and turn down, simply because the rate-of-change or the descent of the bear trend is speeding up.
We had published in our Dynamic Trading Futures Report in early Sept. that the Dynamic Trading Time, Price and Pat-tern analysis projected the S&P should be in a bear trend at least into the second half of Nov. and reach at least 1327, a 200 point decline from the Sept. high. Through the end of Nov. and until the S&P reached the minimum target at 1327, short trades should be favored as the trend was projected to be bear-ish at least to those minimum time and price targets. Let’s see how we may have used the DT Indicator Crossover strategy for high-probability trend-continuation short trades.
Chart #1 is the daily contract for March S&P. The indica-tor window shows Dynamic Trader’s unique StoRSI Indicator with the default Fib settings. The two lines are the two smooth-ings of the indicator. For practical purposes, it is the moving average of the indicator and a moving average of the moving average. The bear trend accelerates at each crossover from up
to down. It doesn’t matter if the crossover was made from the upper end of the scale, what is commonly known as the “over-bought” zone, or from the lower end of the scale. The impor-tant lesson here is once the indicator makes a crossover from up to down from anywhere on the scale, the S&P continues the bear trend and often accelerates the rate of the decline. The crossovers do not always coincide with price cycle highs.
Chart #2 is 60-minute data for part of the period shown on the daily chart. All of the crossovers are shown. Some were made from the extreme high zone, some from just above the low zone. In every case, no matter where the crossover was made, the bear trend continued for at least 15-20 points before even a minor correction was made.
Chart #3 moves down to a lower time frame again to 15-minute data for part of the period shown in the 60-minute chart. The four crossovers above the lower zone are circled and labeled with the date marker. Once again the S&P declined for 10-15 points following each crossover. The largest declines were made following the crossovers in the upper zone.
Practical Trading Strategies and the DT Indicator CrossoverLet’s review what we have learned. In a bear trend, indicator crossovers from up to down are always followed by a contin-ued price decline on all time frames regardless of where the indicator is on the scale and what is the position of price. The indicator reversals do not always coincide with price reversals. But the indicator reversal from high to low does signal the con-tinuation of the bear trend.
The indicator crossover itself does not project how far the price trend will continue following an indicator crossover, but we can study the minimum and typical swings from the prior signals. In the case of the S&P, the bear trend continues for at least another 15-20 points following a crossover on the 60-minute data, and often much more.
To use the DT Indicator Crossover Strategy, we must fi rst have a projection of the trend direction because we only use the strategy to enter in the direction of the larger decline trend. The Dynamic Trading time, price and pattern analysis as taught in the Dynamic Trading book will provide the minimum price and
Dynamic Trading and Multiple Time Frame Trend Continuation Signals
Chart 1 Chart 2
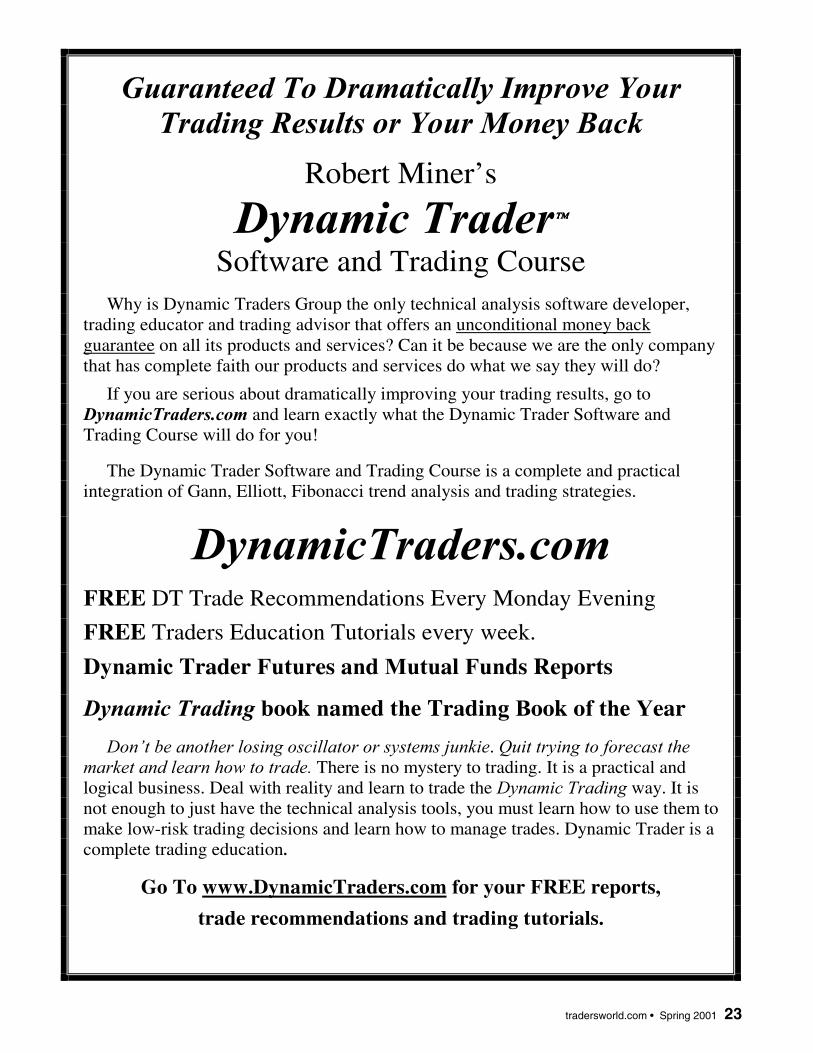
tradersworld.com • Spring 2001 23
Guaranteed To Dramatically Improve Your Trading Results or Your Money Back
Robert Miner’s
Dynamic Trader
Software and Trading Course
Why is Dynamic Traders Group the only technical analysis software developer, trading educator and trading advisor that offers an unconditional money back guarantee on all its products and services? Can it be because we are the only company that has complete faith our products and services do what we say they will do?
If you are serious about dramatically improving your trading results, go to DynamicTraders.com and learn exactly what the Dynamic Trader Software and Trading Course will do for you!
The Dynamic Trader Software and Trading Course is a complete and practical integration of Gann, Elliott, Fibonacci trend analysis and trading strategies.
DynamicTraders.comFREE DT Trade Recommendations Every Monday Evening
FREE Traders Education Tutorials every week.
Dynamic Trader Futures and Mutual Funds Reports
Dynamic Trading book named the Trading Book of the Year
Don’t be another losing oscillator or systems junkie. Quit trying to forecast the
market and learn how to trade. There is no mystery to trading. It is a practical and logical business. Deal with reality and learn to trade the Dynamic Trading way. It is not enough to just have the technical analysis tools, you must learn how to use them to make low-risk trading decisions and learn how to manage trades. Dynamic Trader is a complete trading education.
Go To www.DynamicTraders.com for your FREE reports,
trade recommendations and trading tutorials.
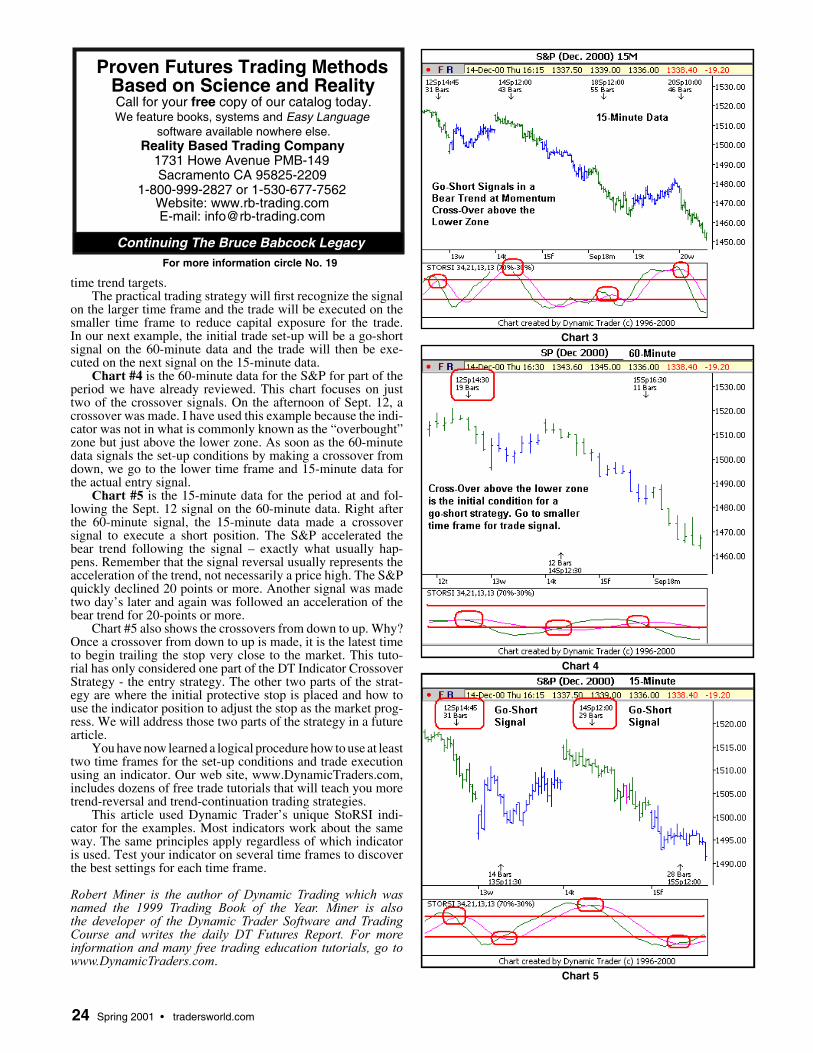
24 Spring 2001 • tradersworld.com
Proven Futures Trading MethodsBased on Science and RealityCall for your free copy of our catalog today. We feature books, systems and Easy Language
software available nowhere else.Reality Based Trading Company
1731 Howe Avenue PMB-149Sacramento CA 95825-2209
1-800-999-2827 or 1-530-677-7562Website: www.rb-trading.com E-mail: [email protected]
Continuing The Bruce Babcock Legacy
For more information circle No. 19
time trend targets. The practical trading strategy will fi rst recognize the signal
on the larger time frame and the trade will be executed on the smaller time frame to reduce capital exposure for the trade. In our next example, the initial trade set-up will be a go-short signal on the 60-minute data and the trade will then be exe-cuted on the next signal on the 15-minute data.
Chart #4 is the 60-minute data for the S&P for part of the period we have already reviewed. This chart focuses on just two of the crossover signals. On the afternoon of Sept. 12, a crossover was made. I have used this example because the indi-cator was not in what is commonly known as the “overbought” zone but just above the lower zone. As soon as the 60-minute data signals the set-up conditions by making a crossover from down, we go to the lower time frame and 15-minute data for the actual entry signal.
Chart #5 is the 15-minute data for the period at and fol-lowing the Sept. 12 signal on the 60-minute data. Right after the 60-minute signal, the 15-minute data made a crossover signal to execute a short position. The S&P accelerated the bear trend following the signal – exactly what usually hap-pens. Remember that the signal reversal usually represents the acceleration of the trend, not necessarily a price high. The S&P quickly declined 20 points or more. Another signal was made two day’s later and again was followed an acceleration of the bear trend for 20-points or more.
Chart #5 also shows the crossovers from down to up. Why? Once a crossover from down to up is made, it is the latest time to begin trailing the stop very close to the market. This tuto-rial has only considered one part of the DT Indicator Crossover Strategy - the entry strategy. The other two parts of the strat-egy are where the initial protective stop is placed and how to use the indicator position to adjust the stop as the market prog-ress. We will address those two parts of the strategy in a future article.
You have now learned a logical procedure how to use at least two time frames for the set-up conditions and trade execution using an indicator. Our web site, www.DynamicTraders.com, includes dozens of free trade tutorials that will teach you more trend-reversal and trend-continuation trading strategies.
This article used Dynamic Trader’s unique StoRSI indi-cator for the examples. Most indicators work about the same way. The same principles apply regardless of which indicator is used. Test your indicator on several time frames to discover the best settings for each time frame.
Robert Miner is the author of Dynamic Trading which was named the 1999 Trading Book of the Year. Miner is also the developer of the Dynamic Trader Software and Trading Course and writes the daily DT Futures Report. For more information and many free trading education tutorials, go to www.DynamicTraders.com.
Chart 3
Chart 4
Chart 5

tradersworld.com • Spring 2001 25
By James Smithson
W.D. Gann’s outstanding skill was his ability to produce accurate annual forecasts of the stock and commodity markets. Gann
stated that his forecasts were based on his secret “time factor”. However, careful analysis of his novel entitled “The Tunnel Thru The Air” reveals Gann’s belief in the overwhelming importance of astrol-ogy. Therefore astrology is the real basis of Gann’s annual forecasts. Indeed, astro-logical analysis is implicit at key points in his books and courses. Consequently it is concluded that if we wish to emulate Gann’s outstanding forecasting skills we must follow in his footsteps by firstly learning astrology and then apply this knowledge to the stock and commodity markets.
William D. Gann (1878 to 1955) was an outstanding stock and commodities trader. He was also a prolific teacher of how to make speculation a profitable profession, writing some seven books and producing two courses on trading the stock and com-modity markets. However, Gann’s superla-tive skill was his ability to produce annual forecasts of the stock and commodity mar-kets one year in advance. Although he also sent his clients supplements, which corrected his annual forecasts when necessary, the overall accuracy of these annual forecasts is highly impressive. For example, Gann’s annual stockmarket forecast for 1929, which was published in November 1928, unequivo-cally forecast the “Great Crash” in the fall of 1929. However, Gann continued to produce and publish annual forecasts of the stock and commodity markets until shortly before his death in 1955.
THE “TIME FACTOR” IS THE KEY TO GANN’S FORECASTSGann’s forecasts of the stock and commod-ity markets were based on the “time factor”, the dictionary definition of which is “The passage of time as a limitation on what can be achieved”. Gann provided the following comments on the time factor:
“The most important thing of all is the Time factor, which I use in making up my annual forecasts. It is not my object here to give away that secret, but I am showing you plain enough and giving you rules enough that, if you follow them, you will be able to make a success in the stock market” (“Truth Of The Stock Tape”, 1923, page 116).
“Many people want to know what method I use to determine future indications on the market. I keep charts of the various active stocks and also a set of averages. My charts are different from the charts of the average statistician because they are based on a discovery of my own. I have discovered a ‘time’ factor that enables me to determine important tops and bottoms one year or more in advance. My annual forecasts on stocks, issued in December for ten years past, have proved remarkably correct. The cotton and
grain markets can also be forecast by this ‘time’ factor, which enables me to tell when extreme highs and lows will be made, as well as the minor moves” (“Truth Of The Stock Tape”, 1923, page 41 of appendix).
“The time factor and time periods are most important in determining a change in trend because time can over balance price, and when the time is up the volume of sales will increase and force prices higher or lower” (“45 Years In Wall Street”, 1941, page 10).
“Time is the most important factor of all and not until suffi cient time has expired does any big move start up or down. The time factor will overbalance both space and volume. When time is up, space movement will start and large volume will begin, either up or down. At the end of any important movement - monthly, weekly or daily - Time must be allowed for accumulation or distribution or for buying and selling to be completed” (“How To Make Profi ts In Commodities”, 1951, page 56).Therefore we learn from Gann that:
1) The time factor is the most important element in forecasting markets; and there-fore he used this time factor in producing
his highly-accurate annual forecasts of the stock and commodity markets.
2) The time factor is so fundamental that it precedes (and therefore causes) changes in prices and changes in volume in the stock and commodity markets.
3) The time factor is a valuable secret, details of which he is unwilling to reveal. He is however prepared to teach trading rules which, when properly applied, pro-duce profi ts in the stock and commodity markets.
GANN’S NOVEL ENTITLED “THE TUNNEL THRU THE AIR”Although Gann was unwilling to explicitly reveal his time factor in his books and courses on trading the stock and commod-ity markets, he was prepared to leave strong clues in his novel entitled “The Tunnel Thru The Air”, which he wrote in 1927. This book describes the events in the United States leading up to the Second World War through the life of the principal character, Robert Gordon. Most importantly, in the foreword to this book Gann wrote, “’The Tunnel Thru The Air’ is mysterious and contains a valuable secret, clothed in veiled language…..When you read it the third time, a new light will dawn. You will fi nd the hidden secret…..The future will become an open book”.
Gann’s “valuable secret, clothed in veiled language” is that, as the Bible clearly states, astrology really works. This theme runs throughout the book and is highlighted in the following quotations:
TurtleTrader.com
Learn the Original Turtle Trading Techniques
With Full Support
"This site offers no comfort to those who are looking for a quick buck or the Holy Grail, and the proprietors don't seem to suffer fools gladly. The message is open, honest, straightforward and makes no hyped-up promises. It sticks to the facts; it is one of the best system trading sites for...traders I have seen.”-- Gibbons Burke, Futures Magazine Review
Mention Traders World and get 5% off.
For more information circle No. 20
The Time Factor of W.D. Gann
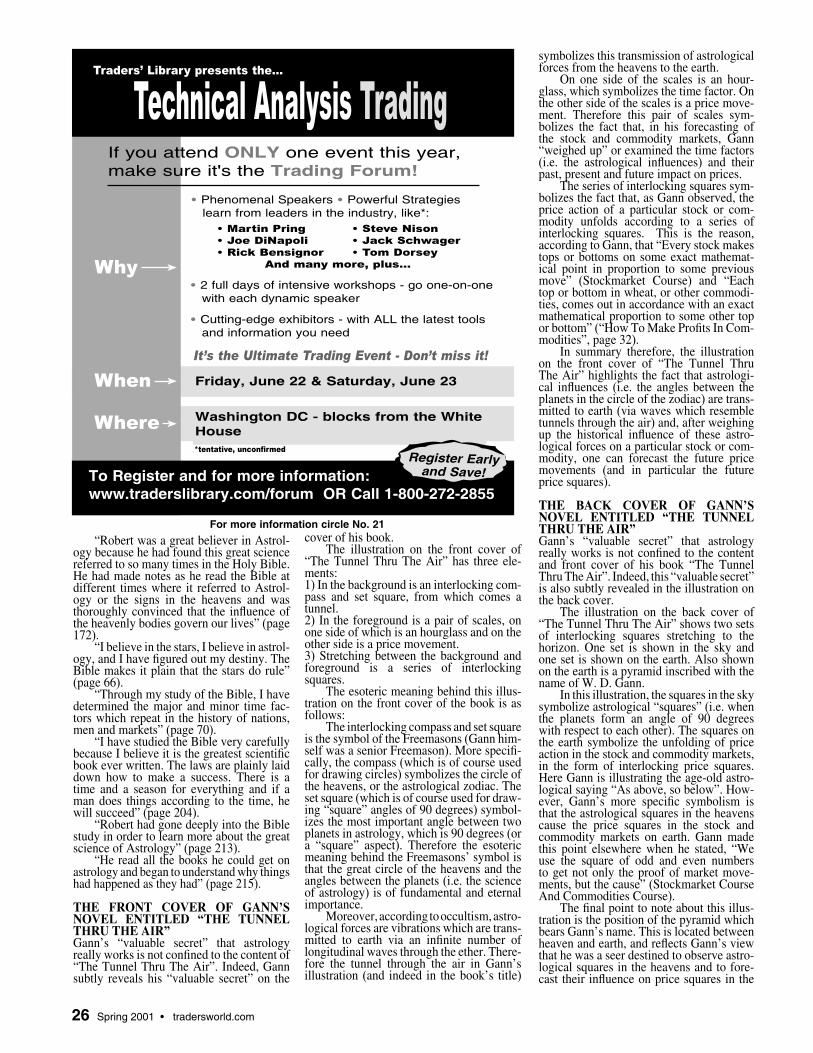
26 Spring 2001 • tradersworld.com
“Robert was a great believer in Astrol-ogy because he had found this great science referred to so many times in the Holy Bible. He had made notes as he read the Bible at different times where it referred to Astrol-ogy or the signs in the heavens and was thoroughly convinced that the infl uence of the heavenly bodies govern our lives” (page 172).
“I believe in the stars, I believe in astrol-ogy, and I have fi gured out my destiny. The Bible makes it plain that the stars do rule” (page 66).
“Through my study of the Bible, I have determined the major and minor time fac-tors which repeat in the history of nations, men and markets” (page 70).
“I have studied the Bible very carefully because I believe it is the greatest scientifi c book ever written. The laws are plainly laid down how to make a success. There is a time and a season for everything and if a man does things according to the time, he will succeed” (page 204).
“Robert had gone deeply into the Bible study in order to learn more about the great science of Astrology” (page 213).
“He read all the books he could get on astrology and began to understand why things had happened as they had” (page 215).
THE FRONT COVER OF GANN’S NOVEL ENTITLED “THE TUNNEL THRU THE AIR”Gann’s “valuable secret” that astrology really works is not confi ned to the content of “The Tunnel Thru The Air”. Indeed, Gann subtly reveals his “valuable secret” on the
cover of his book.The illustration on the front cover of
“The Tunnel Thru The Air” has three ele-ments:1) In the background is an interlocking com-pass and set square, from which comes a tunnel.2) In the foreground is a pair of scales, on one side of which is an hourglass and on the other side is a price movement.3) Stretching between the background and foreground is a series of interlocking squares.
The esoteric meaning behind this illus-tration on the front cover of the book is as follows:
The interlocking compass and set square is the symbol of the Freemasons (Gann him-self was a senior Freemason). More specifi -cally, the compass (which is of course used for drawing circles) symbolizes the circle of the heavens, or the astrological zodiac. The set square (which is of course used for draw-ing “square” angles of 90 degrees) symbol-izes the most important angle between two planets in astrology, which is 90 degrees (or a “square” aspect). Therefore the esoteric meaning behind the Freemasons’ symbol is that the great circle of the heavens and the angles between the planets (i.e. the science of astrology) is of fundamental and eternal importance.
Moreover, according to occultism, astro-logical forces are vibrations which are trans-mitted to earth via an infi nite number of longitudinal waves through the ether. There-fore the tunnel through the air in Gann’s illustration (and indeed in the book’s title)
symbolizes this transmission of astrological forces from the heavens to the earth.
On one side of the scales is an hour-glass, which symbolizes the time factor. On the other side of the scales is a price move-ment. Therefore this pair of scales sym-bolizes the fact that, in his forecasting of the stock and commodity markets, Gann “weighed up” or examined the time factors (i.e. the astrological infl uences) and their past, present and future impact on prices.
The series of interlocking squares sym-bolizes the fact that, as Gann observed, the price action of a particular stock or com-modity unfolds according to a series of interlocking squares. This is the reason, according to Gann, that “Every stock makes tops or bottoms on some exact mathemat-ical point in proportion to some previous move” (Stockmarket Course) and “Each top or bottom in wheat, or other commodi-ties, comes out in accordance with an exact mathematical proportion to some other top or bottom” (“How To Make Profi ts In Com-modities”, page 32).
In summary therefore, the illustration on the front cover of “The Tunnel Thru The Air” highlights the fact that astrologi-cal infl uences (i.e. the angles between the planets in the circle of the zodiac) are trans-mitted to earth (via waves which resemble tunnels through the air) and, after weighing up the historical infl uence of these astro-logical forces on a particular stock or com-modity, one can forecast the future price movements (and in particular the future price squares).
THE BACK COVER OF GANN’S NOVEL ENTITLED “THE TUNNEL THRU THE AIR” Gann’s “valuable secret” that astrology really works is not confi ned to the content and front cover of his book “The Tunnel Thru The Air”. Indeed, this “valuable secret” is also subtly revealed in the illustration on the back cover.
The illustration on the back cover of “The Tunnel Thru The Air” shows two sets of interlocking squares stretching to the horizon. One set is shown in the sky and one set is shown on the earth. Also shown on the earth is a pyramid inscribed with the name of W. D. Gann.
In this illustration, the squares in the sky symbolize astrological “squares” (i.e. when the planets form an angle of 90 degrees with respect to each other). The squares on the earth symbolize the unfolding of price action in the stock and commodity markets, in the form of interlocking price squares. Here Gann is illustrating the age-old astro-logical saying “As above, so below”. How-ever, Gann’s more specifi c symbolism is that the astrological squares in the heavens cause the price squares in the stock and commodity markets on earth. Gann made this point elsewhere when he stated, “We use the square of odd and even numbers to get not only the proof of market move-ments, but the cause” (Stockmarket Course And Commodities Course).
The fi nal point to note about this illus-tration is the position of the pyramid which bears Gann’s name. This is located between heaven and earth, and refl ects Gann’s view that he was a seer destined to observe astro-logical squares in the heavens and to fore-cast their infl uence on price squares in the
Technical Analysis Trading
• Phenomenal Speakers • Powerful Strategies learn from leaders in the industry, like*:
• Martin Pring • Steve Nison • Joe DiNapoli • Jack Schwager • Rick Bensignor • Tom Dorsey
And many more, plus...
• 2 full days of intensive workshops - go one-on-one with each dynamic speaker
• Cutting-edge exhibitors - with ALL the latest tools and information you need
Friday, June 22 & Saturday, June 23
Washington DC - blocks from the White House
To Register and for more information:www.traderslibrary.com/forum OR Call 1-800-272-2855
Register Early and Save!
Traders’ Library presents the...
It’s the Ultimate Trading Event - Don’t miss it!
*tentative, unconfirmed
Why
When
Where
If you attend ONLY one event this year,make sure it's the Trading Forum!
For more information circle No. 21

tradersworld.com • Spring 2001 27
stock and commodity markets on earth.In summary therefore, the “valuable
secret, clothed in veiled language” of Gann’s book “The Tunnel Thru The Air” is that, as the Bible clearly states, astrology really works.
GANN’S “TIME FACTOR” IS ASTROLOGYGann’s forecasts of the stock and com-modity markets were based on the “time factor”, which may be defi ned as “The pas-sage of time as a limitation on what can be achieved”. Since astrology may be defi ned as “The study of the effects of the trends of time”, we see that time factor may be syn-onymous with astrology. It therefore appears that Gann preferred to state that his market forecasts were based on the “time factor”, rather than to state that they were based on astrology. Indeed, this is certain after care-fully studying Gann’s book “The Tunnel Thru The Air” and identifying its “valuable secret” that astrology really works.
The reason for Gann’s secrecy is sug-gested in the following quotation:
“It has taken me twenty years of exhaus-tive study to learn the cause that produces effects according to time. That is my secret and is too valuable to be spread broadcast. Besides, the public is not yet ready for it” (“Morning Telegraph” interview, December 1922).
Therefore Gann preferred not to reveal that astrology is the basis of his market fore-casts for the following reasons:
1) The principle that astrology may be used to produce detailed forecasts of the stock and commodity markets is a valuable secret that had taken Gann much time and effort to master.
2) Gann fi rmly believed that his stu-dents should, like him, devote much time and hard work to their studies on how to make speculation a profi table profession.
3) Gann was well aware that the sug-gestion that the stock and commodity mar-kets are governed by astrological infl uences is an astounding new paradigm, which vio-lates the conventional wisdom and would therefore attract hostility. This is highlighted in the following quotation:
“It appears to be a fact that Mr. Gann has developed an entirely new idea as to the principles governing stockmarket move-ments. He bases his operations on certain natural laws which, though existing since the world began, have only in recent years been analyzed with precision and added to the list of so-called modern discoveries.
We have asked Mr. Gann for an outline of his work, and have secured some remark-able evidence as to the results obtained therefrom. We submit this in full recognition of the fact that a man in Wall Street with a new idea - an idea which violates the tra-ditions and encourages a scientifi c view of the proposition - is not usually welcomed by the majority, for the reason that he stimu-lates thought and research. These activities said majority abhors” (“Ticker & Investment Digest” interview, December 1909).
GANN AND ASTROLOGY Since Gann’s book “The Tunnel Thru The Air” reveals the “valuable secret” that astrol-ogy really works and, by implication, astrol-ogy is the basis of Gann’s stock and commodity market forecasts, one should
look for evidence of the use of astrology by Gann in his other writings.
1. Gann’s Chapters On Forecasting In His Stock And Commodity Market Courses
Gann produced and sold separate courses for trading the stock and commodity markets. These courses overlapped to some signifi cant extent. One chapter common to both courses is entitled “The Basis Of My Forecasting Method: Geometrical Angles”. An important quotation from this chapter is as follows:
“We use three fi gures in geometry, the circle, the square and the triangle. We get the square and triangle points of a circle to determine points of time, price and space resistance. We use the circle of 360 degrees to measure time and price.
There are 360 degrees in a circle, no matter how large or small the circle may be. Certain numbers of these degrees and angles are of vast importance and indicate when important tops and bottoms occur on stocks and commodities, as well as denote important resistance levels.
Every movement in the market is the result of a natural law and of a cause which exists long before the effect takes place and can be determined years in advance” (Stock-market Course and Commodities Course).
The esoteric meaning behind this state-ment is as follows:
There are 360 degrees in any circle, the largest of which is the great circle of the heavens, or the zodiac. Certain points on this zodiac (identifi ed by a precise number of degrees) are very important because they relate to specifi c stocks and to specifi c com-modity markets. Consequently the angles between a planet and these specifi c points on the zodiac and also the angles between two planets are very important because they signify tops and bottoms in the stock and commodity markets. Two important angles (or “aspects”, as they are called in astrol-ogy) are the square (or 90 degrees) and the triune (or 120 degrees). Since the angles between a planet and a particular point on the zodiac or between two planets can be calculated years in advance, stock and com-modity markets can in principle be forecast years in advance.
It is also important to note that the above quotation by Gann was in the intro-duction to his chapter on forecasting by means of “Gann angles”; i.e. forecasting by using the 1 X 1, 2 X 1, 1 X 2, etc. trend-lines from important tops and bottoms on price charts. Therefore the very important implication here is that (as the chapter title suggests) the basis of Gann’s fore-casting method was not merely the geo-metrical “Gann angles” drawn on a price chart, but (more fundamentally) the geomet-rical angles between planets and the zodiac (which is of course astrology). In summary therefore, Gann is suggesting that the angles between the planets and the zodiac in the heavens (i.e. astrological infl uences) cause the particular angle of a trendline on a price chart, and this is the real basis of his fore-casting method.
2 Gann’s Emphasis On Anniversary Dates And Seasonal Tendencies In The Stock And Commodity Markets
Gann’s consummate book on the stock-market was “45 Years In Wall Street” (writ-ten in 1949) and his consummate book on the commodity markets was “How To
Learn to profi tably trade Trends & Pick Tops & Bottoms in Any Market on Any Time Frame w/my Proprietary Meth-ods. Learn how to calculate tomor-row’s Highs & Lows & know when & where the S&P 500 make their reversals during the day! Learn a Highly Accu-rate, Low Risk/High Reward, Easy to use S&P 500 intra-day trading method, which can easily be used in Any Mkt on Any Time Frame! LEARN with Trad-ing Manuals, Video’s, Audio’s, Propri-etary Software, FREE Daily Faxes & Unlimited Phone Consultation. You’re also invited to come for one day of FREE One-On-One LIVE Hands on Trading! I will show you how to become a professional full time trader in a short period of time with my Home Study Course & LIVE Hands On market Trading! Call Todd Now for FREE Info, Ref’s and FREE faxes!
Unlimited Income Potential!GOAL: $500 to $1,000 + A DAY
CALL (800) 664-3343FAX (248) 593-5962www.tmitchell.com
For more information circle No. 22
UNBEATABLE RATES SUPERIOR SERVICE
2.9 cents!Due to our revolutionary new True Cost™ Program, iPhoneBill is able to offer our customers some of the best telephone long distance rates available today, on or off the Internet! In some cases, you may pay as little as 2.9 cents per minute for state-to-state long distance calls! Utilizing the advanced fibre optic networks of major long distance carriers and buying the time from them on a wholesale basis, we are able to offer unprecedented low rates for calls originating in the 48 Continental US States. Additionally, information about your phone calls will be updated DAILY on a special password protected website which will be provided to you. Immediately on sign up, you will be E-mailed your ID and password to view your calls online. For more information go to: www.ld.net/?uoi8la
For more information circle No. 23
28 Spring 2001 • tradersworld.com
Make Profi ts In Commodities” (fi rst written in 1941 and updated in 1951).
The common feature of both books is their emphasis on the importance of anni-versary dates and seasonal tendencies, as the following quotations illustrate:
“My object in writing this book ‘45 Years In Wall Street’ is to give you some new and valuable rules on time periods which will help to guide you in determin-ing high and low prices in the future. In my research work I have discovered that stocks make an important change in trend in the months when they reach extreme highs and lows. These are what I call anniversary dates, and these important dates should be watched each year for important changes in trend” (“45 Years In Wall Street”, page 92).
“It is very important to watch the date when an individual commodity makes an extreme high or low. The fi rst important time period to watch from any anniversary date is third or fourth month, then around the sixth or seventh month, where many important tops and bottoms are reached” (“How To Make Profi ts In Commodities”, page 58).
The esoteric meaning behind these statements is as follows:
Certain points on the zodiac (identifi ed by a precise number of degrees) relate to specifi c stocks and to specifi c commodity markets. The sun is unique amongst the planets in that it completes one revolution of the zodiac every year. Moreover on any given day of the year the sun is in exactly the same position (in the zodiac) as it was on that day one year earlier, ten years ear-lier or a century earlier. Consequently the sun will aspect a particular point on the zodiac on the same day every year. This is the cause of seasonal tendencies in the
stock and commodity markets (indeed, this is the cause of all seasonal tendencies on earth).
The important point to note here is that Gann emphasized the seasonal tenden-cies in the stock and commodity markets to encourage his students to think about and to identify the cause. The cause is the position of the planets, and in particular their angles to a specifi c point on the zodiac (which is of course astrology).3. Gann’s Recommendation To Study Astro-logical Infl uences On The Commodity Mar-kets
Amongst Gann’s surviving papers are his two “astrology letters”. More specifi -cally, in January 1954 Gann wrote to one of his students recommending that he study the astrological infl uences on the soybean market (“The longitude of the planets and the longitude of the average of the planets determine the resistance levels as the price of soybeans moves around each cycle of 24 cents per bushel”); and in March 1954 he again wrote to his student recommend-ing that he study the astrological infl uences on the coffee market (“By studying all of the (astrological) data outlined above and applying it to coffee, you will be able to learn more about what causes the changes in trend”).
Gann died in June 1955 and therefore these astrology letters are some of his last teachings. However, it is notable that in these two short letters Gann does not reveal any clear and specifi c method of astrologi-cal forecasting of the commodity markets. Instead, Gann encouraged his student to observe, experiment and learn for himself how the angles between the planets and their angles to specifi c points on the zodiac forecast the changes in price trends. Indeed,
it appears that Gann had for over fi fty years kept secret his method of market forecast-ing and at the age of 76 he was not simply going to reveal it to a student. Nevertheless Gann was continuing his lifelong practice of helping his students to make speculation a profi table profession by giving them guid-ance and letting them learn for themselves.
CONCLUSION1.W.D. Gann’s highly-accurate annual fore-casts of the stock and commodity markets were based on astrology. Therefore, if we as investors and traders wish to emulate Gann’s outstanding forecasting ability, it is absolutely necessary that we learn astrol-ogy.Although astrology may be learned fro a variety of sources, the present writer rec-ommends, as a fi rst step, the correspon-dence courses in spiritual astrology taught by The Rosicrucian Fellowship, which may be contacted at International Headquarters, 2222 Mission Avenue, Oceanside, Califor-nia 92054, U.S.A.2. Once we have learned astrology, we must apply this knowledge to the stock and com-modity markets. This task requires much hard work, as Gann himself observed: “I soon began to note the periodical recurrence of the rise and fall in stocks and commodities. This led me to conclude that natural law was the basis of market move-ments. I then decided to devote ten years of my life to the study of natural law as applicable to the speculative markets and to devote my best energies toward making speculation a profi table profession” (“Ticker & Investment Digest” interview, December 1909).However, Gann has provided us with spe-cifi c guidance. In summary, we should obtain daily price charts which depict impor-tant tops and bottoms in the stock and com-modity markets and we should then observe the following:i) The angles between the planets (the most important of which is the 90 degrees, or “square”, angle);ii) The angles (especially the 90 degrees angle) between the planets and particular points on the zodiac;iii) The longitudinal position of the sun and especially its 90 degrees angle to particular points on the zodiac (because this causes the seasonal tendency in a particular market).
When we have mastered how astrolog-ical infl uences affect the stock and com-modity markets, we will be in a position to produce accurate annual forecasts. Like Gann, we will then become the foremost speculators and traders of our generation.3. Although there are many individuals and companies around the world claiming to teach “Gann analysis” through books, courses, videotapes and computer programs, they should certainly be avoided. This is because, since none of these individuals or companies can produce an accurate annual forecast of the stock or commodity mar-kets, they do not in fact teach Gann’s real method.
James Smithson the author of this article e-mail is [email protected]. He is an investor and speculator based in London, England and Dallas, Texas.
W.D. Gann Books & Material - Traders World 800-288-4266
�W.D. Gann’s Original Commodity Trading Course, W.D. Gann - $999.00
�W.D. Gann’s Original Stock Market Trading Course, W.D. Gann - $999.00
�How to Make Profi ts in Commodities - $49.00
�The Truth of the Stock Tape, W.D. Gann - $49.00
�45 Years on Wall Street, W.D. Gann - $49.00
�Tunnel Thru the Air, W.D. Gann - $49.00
�Gann Masters I, Jacobs - $90.00
�Gann Masters II (now with astrology) - $90.00
�Gann Masters Charts Unveiled - $49.95
�SuperTiming, Walker (How Gann Used Astrology to Trade With) - $250.00
�Patterns of Gann, Cooley - $159.00
�Pyrapoint, Hall (How Gann Used the Square of Nine)
�Geometry of Stock Market profi ts, Jenkins - $45.00
�Chart Reading for Professional Traders, Jenkins - $67.50
�Complete Stock Market Trading and Forecasting Course, Jenkins - $529.00
�Murrey Math Trading, Murrey - $78.00
�How to Make Time and Price Overlays, Jacobs - $49.00
�Transparent Overlay Plastic .005 Thickness - 20” x 12’ roll - $14.95
�Chart Paper Gann’s (8x8) to the sq inch, 50 sheet pad - 11” x 17” - $12.95, �(10x10) -$12.95
�Set of 3 Clear Plastic Overlay Permanent Drawing Pens (black, red, blue) Ultra Fine - $5.95
�12” Clear Plastic folding Parallel Ruller - $9.95, 15” - �$11.95, �18” - $14.95
Method of Payment: �Check Encl. �MC �VISA �AMEX �Shipping U.S. $4.95/$1.95
Credit Card No.____________________________________________Exp._____________
Name______________________________________________Ph.__________________________
Address_________________________________________________________________________
City____________________________________________State________Zip_________________
Traders World, 2508 W. Grayrock St., Springfi eld, MO 65810 www.tradersworld.com

tradersworld.com • Spring 2001 29
Introduction
Swings
Angles
True Trend Lines
Dimension Lines
The 1 X 1 Angle
Setting the 1X1 Angle
Values for the 1X1 Angle
The Live 1X1 Angle
Mirror Image Foldbacks
Zero Angles
Sizes Labels and Markers
Squares
Natural Squares
Temporary Squares Made Permanent
The Squares of Highs and Lows
The 1X1 and the Square’s Size
Modifying an Existing Square
Division of the Range
Price Targets Using Ranges
Price Targets Using & Times the Base
Squaring a Range with the Mouse
Squaring Time with the Mouse
Temporary Squares Made Permanent
Deleting a Square
Square of 9
Square of 9 Natural Cycle of 365.25
The Square of 9 Time Divisions
The Square of 9 Price Divisions
Other Price and Time Divisions
Increment Value
Square of 9 Circle Price Lines
Modifying an Existing Square of 9
Square of 9 from a High or Low
Other Square of 9 Circle Sizes
Time Cycles
What is Astrology
Geocentric Planets
Heliocentric Planets
Planet Angle
Time Cycles as Support and Resistance
Signs of Zodiac
Time Cycles and Measure Transits
Time by Degrees
Averages of the Planets
Latitude and Declination
Parallels and Contra-Parallels
The Third Dimension
Growth of Markets
New Energy Levels
Squaring a Circle
Basic Arcs and Circles
Arcs and Circles to Project Price
Vertical Points in Arcs
Expansion of Arcs and Circles
Square Root Expansions
Inside Radii Contractions
Square Root of 3
Third Dimension Factor
Miscellaneous Expansions
Odd & Even Squares
Odd & Even Square Time Expansions
Fiboancci Expansions
Expanding Square Roots
Diamter Instead of Radius
Modify an Existing Setup
Appendix A
Degree Assignments for Zodiac Signs
Planetary Cycles
Appendix B
Heliocentric Sature
Heliocentric Planets
Important Dates Each Month
Heliocentric and Geocentric Aspects
Geocenric Maps Movement
Soybean Price Resistance Levels
Active Angles and Degrees
24 Revolutions of Time and Price
24 Cent Moves or More
Appendix C
Basic
Loading Files
Using Old Paths
Daily File Types
As Day Week Month Quarter Year
Default File Setup
Included in Active Batch
Showing Active Batch
Selecting Active Batches
Viewing Charts
Volume and Open Interest
Geocentric, Earth View
Heliocentric, Sun View
Latitude or Declination
Swing and T/L Indicator
Main Trend Indicator
Square of 9
All Swing Angles
Main Trend Angles
Square of 9
All Swing Angles
Main Trend Angles
Selected Angles
Back 360 High Low Angles
Setting Up Charts
1X1 Angle
Live 1X1 Angle
Planet Angle
Planet Hour
Third Dimension Factor
User Defi ned Expansion
Swing Charts
Square of 9 Increment Value
Gann Masters IIThe Most Advanced W. D. Gann Trading Course Ever. Now learn the techniques of angles, swings, squares, time cycles and astrology...
Back 360 Angles
Automatic Setups
Square of 9 Setups
Square Setup
Time Cycles
Planets Only
Mercury Aspects
Venus Aspects
Sun / Earth Aspects
Mars Aspects
Jupiter Aspects
Saturn Aspects
Uranus Aspects
Neptune Aspects
Pluto Aspects
Moon Longtitude Apects
Node Aspects
Average of 5
Mean of Five
Aveage of 6
Circle of Eight
Average of 9
Average of Planets
Keeping Planets
Third Dimensions
Turning Off Radii
PT Circles
PT Arcs
Radii Only
Square Root of 2,3,4,5,6 and 7
Squared Circles
Fiboancci Ratios
PI Ratios
Odd and Even Squares
Musical Notes
User Defi ned Expander
Expanding Rts 2,3,4,5...
Show as Diameter
Square Price Range
Kursor Radius
Marked Point Radius
Both Kursor and Marked Point
Show Inner Radii
Half Points
Options
HL Range
High, Low, Close
Open +High Low and Close
Space Between Bars
Divide Range
7 Times the Base
Auto Center
Scale Screen
Grids
Snap to High and Low
Sizes, Labels and Markers
Shade Swings
Close Only
Go to Date, Price, G
Gann Masters II Order Blank�Yes, please send me the most advanced Gann trading course ever. I understand that this course will me learn how Gann used mathematical techniques to trade the markets including using angles, swings, the squares, time cycles, astrology and many other techniques listed in the above table of contents.
I have enclosed $90.00 to cover the cost. Add $4.95 shipping in the U.S. $7.00 shipping to Canada and $18.00 shipping to the rest of the world. 30 day money back guarantee.
�Check Enclosed � MC � VISA � AMAX
Name____________________________________________
Company_________________________________________
City___________________________State____Zip________
Phone____________________________________________
E-Mail____________________________________________
Traders World 2508 W. Grayrock St. Springfi eld, MO 65810
www.tradersworld.com 800-288-4266
For more information circle No. 24
30 Spring 2001 • tradersworld.com
The Profi t Magic of Stock Transaction Timing by J.M. Hurst Big money in the stock market comes
from compounding prof-its on short term trades, but until now, no tool of investing has achieved the timing accuracy nec-essary to do it. This book reports on a price-fore-casting technique the author has refi ned over the course of 20,000
hours of computer research. $25.00 Now $20.00
Jesse Livermore: Speculator King by Paul Sarnoff
Jesse Livermore, though he died over forty years ago, is still known today as one of the most colorful, fl amboyant, and respected market specu-lators of all time. Known by epithets such as Boy Plunder, the Great Bear,
and the Cotton King, Livermore both made, and subsequently lost, four multi-million dollar fortunes during his career as a speculator, which spanned three decades. 25.00 Now $17.05
Understanding Fibonacci by Ed Dobson.
This primer booklet on Fibonacci numbers is intended to: Give the reader an initial acquain-tance with the concepts of the Fibonacci number sequence,applying the concepts to trading stocks and commodities. $5.00
The Trading Rule That Can Make You Rich by Ed Dobson
Discusses a simple but effective method for timing market entry, based on a technique used by the leg-endary W.D. Gann, who said of this method, You can make a fortune by fol-lowing this one rule alone! Incorporates a technical
trading rule which utilizes a consistently repetitive pattern of market behavior. Applies to all markets and all time peri-ods, whether short term (intraday), imme-diate, or long term. Many traders have written or called us months after reading this book and told us it has been the single most useful book they have ever read on futures trading. (67 pgs) $29.95 $22.95
Reminiscenses of a Stock Operator by Edwin LeFevre
This reprint of the 1923 classic has become over the years one of the most widely sought after and read books ever published on the stock market. This work of fi ction is in fact a thinly disguised biogra-phy of the most colorful
market speculator in the stock and com-modity trader’s Hall of Fame, Jesse Livermore.This work of fi ction is in fact a thinly disguised biography of the most col-orful market speculator in the stock and commodity trader’s Hall of Fame, Jesse Livermore. $19.95 $16.95
Wall Street Ventures & Adventuresby Richard D. Wyckoff
The author is best known as the founder and pub-lisher of the Magazine of Wall Street. It covers his fascinating career as self-made stock market oper-ator from 1888 to 1928. Many of the market oper-ators of the day, such as
Livermore and Keene, were personally known to Wyckoff and in their work he recalls their views and methods of trad-ing. This is a must-have book for the stu-dent of market lore. 313 pgs. This major Wall Street classic was fi rst published in 1930. $19.95 $17.95
The Taylor Trading Technique by Douglas G. Taylor
For those interested in day trading and short-term swing trading in futures, this classic 1950 work is an indis-pensable reference. The 3-Day Method (a.k.a. The Book Method) described herein, maintains that mar-kets move in a three-day
cycle that can be tracked by measuring ral-lies and declines. Linda Bradford Raschke highly recommends this book and the principles it teaches. (128 pgs) $25.00
AstroCycles: TradersViewpoint by Larry Pesavento
Pesavento begins at the very beginning of this book by teaching the basics of astrology. He includes the basic defi nitions and expla-nations fo the planetary movements. Included in the topics covered are expla-nations of the Zodiac and
its relationship to the signs and houses, eclipses, equinoxes and solstices as well as Lunar phenomena.(190 pgs) $40.00
Planetary Harmonicsby Larry Pesavento.
Provides phenomenal trend change dates and Applies George Bayer’s Secrets of Forecasting Prices to fi nancial markets, Proves the validity of plan-etary harmonics, Illustrates hidden Fibonacci ratios. 202 pgs.$49.00 $44.10
Harmonic Vibrations by Larry Pesavento
In this book, Pesvanto deals with planetary aspects and their relation-ship to day-trading. He takes you to the fl oor of the Chicago Mercantile Exchange with wave trad-ing techniques such as a geometric trading plan
based on George Bayer’s secret mes-sage, Combust (one of the most impor-tant astro-harmonic cycles in soybeans) and the Rosh Hashanah Cycle. 176 pgs. $49.00 $44.10
Geometry of the Markets by Bryce Gilmore
Book explains the theory behind time in the mar-kets, Ancient Geometry and Numerology, Squaring Price Levels, Time Sup-port and Resistance. Helio-centric Planetary Cycles. $49.00 Now just $40.00
The Opening Price Principal by Larry Pesavento
There is an amazingly reli-able relationship between the opening price and the high/low range for the entire day. This relationship is gen-erally known only to sea-soned veterans. This new book from 2 traders with over 50 years combined
experience reveals this consistent pat-tern, illustrates it with many tabular and charted examples, and tells you how to trade profi tably using it. If you are a short term trader in EITHER stocks or futures, the knowledge you will gain from this book will give you a tremendous advan-tage every day for the rest of your trading life. $29.95 $23.70
Complete Stock Market Trading and Forecasting Courseby Larry Pesavento
SPECIAL TRADING BOOKS
In this course Jenkins teaches you to trade the markets using the time and price principals of Gann.. He also reveals his secret trading techniques which he only has revealed to some of his close friends.(284 pgs) $529.00
Complete
Stock Market
Trading
Forcasting
Course

tradersworld.com • Spring 2001 31
The Geometry of Stock Market Profi tsby Michael Jenkins
This book is about Jenkins’ proprietary techniques, with major emphasis on cycle analysis, how he views and uses the methods of W. D. Gann, and the geometry of time and price. Among the many topics you will learn: *Which angles are impor-
tant & how to draw them correctly, *How professional traders think and the types of strategies they use day to day, *How to place stops correctly, *How to construct and use Gann Squares for analysis and forecasting of individual stocks and com-modities, *How long the basic trend can be expected to last, *When and where to buy and sell, *How to utilize Gann angles and Methods that predict exact turning points with high probability, *The numero-logical interrelationships of price and time forecasting, *Ten trading tips to make you rich. This book is a trading classic and you will treasure the contribution it will make to your trading profi ciency and prof-its. $50.00 $45.00
Chart Reading for Professional Tradersby Michael Jenkins
This book is a complete, comprehensive study on reading charts, forecasting the market, time cycles, and trading strategies. Explains reversal of trends, when to expect them, and how to know the trend has change. Shows you how to forecast
with great reliability how long the new trend will last and its price target. As does Geometry of Markets, this book discusses in-depth the Gann techniques of time and price. Progresses to the very advanced concepts of day trading off of circular arc segments and calculating fi nal high and low price targets. Each principle is demonstrated with numerous chart illus-trations and real world applications. The information found in this book is unique with many of the techniques discovered personally by Mr. Jenkins and found nowhere else! $75.00 $67.50
Investing by the Stars by Henry Weingardner
Your guide is prominent fi nancial astrologer Henry Weingarten, managing direc-tor of the Astrologers Fund and predictor of such market benchmarks as the 1990 Tokyo Stock Market Crash and the start of the Persian Gulf War. Here he helps
readers learn what many big-time money managers already know: that a little celes-tial knowledge can go along way towards accurately timing the market... charting economic cycles and fi nancial trends... foreseeing market psychology... and pre-dicting global events that can devour your
profi ts or double them over night. $29.95
Fiboancci Trading with Pattern Recognitionby Larry Pesavento
Quoted from Robert Min-er’s Dynamic Trader Analy-sis Report, Pesavento has been trading for 30 years. Today, he is primarily a day trader. His new book is well focused and orga-nized. The bulk of the book describes a limited number
of high probability patterns which coincide with clusters of Fib price projections that provide the short-term trader with high probability and low capital exposure trade set-ups. These trade set-ups are equally valuable for intermediate term traders as well. The short-term set-ups can also be used to enter for an intermediate term position. $49.00 $44.10
Stock Patterns for Day Tradingby Barry Rudd
Quoted from Robert Miner’s Dynamic Trader Analysis Report, Pesavento has been trading for 30 years. Today, he is primarily a day trader. His new book is well focused and organized. The bulk of the book describes a limited number of high probability
patterns which coincide with clusters of Fib price projections that provide the short-term trader with high probability and low capital exposure trade set-ups. These trade set-ups are equally valuable for intermediate term traders as well. The short-term set-ups can also be used to enter for an intermediate term position. $95.00 $75.05
Profi table Patterns for Stock Tradingby Larry Pesavento
Over the past 20 years the use and misuse of the Fibonacci Summation series has proliferated to the point that commenta-tors on the nation’s TV business channels are now resident experts. I lay no claim to being an expert.
I have, however, studied the subject of Fibonacci numbers extensively, especially how it relates to trading. I have always taken the pragmatic position that if I could not use what I was studying to help in trading, then I was not interested in pur-suing it any further. If this material can stimulate your interest in the subject, then introducing you to the subject will have been worthwhile $49.00 $44.10
Channels and Cycles by Brian Millard For many years I have heard how valu-able the work of J.M. Hurst has proven to those interested in the use of cycles in the pursuit of market profi ts. Many Traders Press customers have advised me how
valuable any material would prove to them that would shed any additional light on the work of Hurst. It is with great pride that we present the work of Brian Millard, Channels and Cycles, which clarifi es the original work of Hurst as well as updating
it and bringing it forward to the present time. Millard, like other market technicians such as Jim Tillman and Peter Eliades, found the work of Hurst of such seminal importance in infl uencing his approach to market analysis that it became the corner-stone of his methodology. $49.00 $40.50
Cycle Analysis by M.M. Hurst
This booklet is the overview of The Hurst Cycles Course and if purchased prior to the course, the price of this booklet can be deducted from the price of the com-plete course. $29.95 $19.95
Book Order Form800-288-4266
Fax 417-886-5180
Qty Item# Description Price
_________________________________________________
_________________________________________________
_________________________________________________
_________________________________________________
_________________________________________________
_________________________________________________
_________________________________________________ _________________________________________________
Shipping in (x.xx) beside price _________________________
MD residents add 5% to order ________________________
Total Amount of Order _________________________
Name____________________________________________
Company_________________________________________
Address__________________________________________
City_________________________________State________
Zip ___________ Phone ____________________________
Country__________________________________________
Method of Payment: __ MC __VISA __ AMAX __ Check
Card#__________________________________Exp.______
Shipping: U.S. Orders: 1st book $4.95, each additional $1.95 International Airmail: Canada: $8.00, $4.50, Mexico: $12.00, 4.00 Europe: $19.20, $9.50, Asia $25, $$19.50
TradersWorld, 2508 W. Grayrock St., Springfi eld, MO 65810
www.tradersworld.com

32 Spring 2001 • tradersworld.com
Commonsense InvestingTechnical Analysis for the Long-Term InvestorBy Gilbert Steele
I would like to speak to you as if you were looking to invest in the next four months in the stock market. Are you are looking for a low to buy to hold three or four years in
the future? What do you think constitutes a good buy? Using logic, if stocks fall then they should go up. If you tell me you don’t know why they fall, then by that very logic you cannot tell me why they are going to go up. It is easier said, the smart people knew there was a top and sold the top of the stock market, the way it should have been done. Accept the fact, they did a good job. So the very essence of this article is what makes a good buy.
The equipment you will need is a Gann pinwheel and a daily chart of stock Q. com, ticker [ QCOM ].
By looking at the Gann pinwheel you’ll see $200 in the upper right hand corner.
This is where Q. com made its top. Draw a line from $200 or the number 200 to the middle of the chart (which is No. 1) and through the center. We are looking for the number on the other side of the center No 1.
The number 2 equals 360 degrees. The No. 1 equals 180 degrees. The number point .5 equals 90 degrees. For example, take the square root of 200 equals 14.14 and subtract 1 and that equals 13.14. Now, square 13.14 and you get 172.7. This number is on the lower left hand corner of the Gann pinwheel.
The very fi rst observation one should make is, that the top of the chart of Q. com at 200 matches the Gann pin-wheel. But the bottom of the chart at 50 is in alignment at 180 degrees across the middle of the Gann pinwheel. This would be the very fi rst thing done on all
your charts if they align.At this point we realize that top
was at 200. The next inside number is 148, that is 360 degrees down. The next number on the inside is 103, then another 360 degrees down at 67. Now at 67 that is another 180 degrees down to 50 dol-lars. That’s a long way down, that is a low on the chart now. So when the stock went up you can see $50 going up 180 degrees to the top of about $103. Now at about $103 top the stock is falling. Now the question is, will it bottom at $50, or
continue down to $38? It can also keep going up. You could invest in this area if you are a long term investor. If you are a day-to-day trader you would be trad-ing $50 low up to the $102 then short-ing coming back down to the $50 area. Then you would have to look and see if it is going lower. You can make a lot more money trading the stock. If you are an intra-day trader working at $.25 to $.5 at 45 to 90 degrees you might take even more money out of the market with more trades. Of course, you have to be a very fast and a good day-trader. But just
remember, long term trading is safer than short term.
SUMMARY1. A way to look at the overall market is:
markup, top, distribution, bottoming, and re-accumulation.
2. At the bottom is like watching water come to boil - this is simmering just before the boil we’re building latent energy.
3. Going back to the chart of Q. com. Before the top you must think in a three-dimensional Helix. It is a round cylinder like a Barber pole (where you get your haircut). The barber pole is lying on its side. The stock going up, moving away from you, coming up over the top and falling 360 degrees, up over the top fall-ing 360 degrees, up over the top at 180 degrees, to the $50 area, then going up away from you to the $102 area, and coming down 90 degrees and maybe 90 more degrees back at $50 or lower.
4. Another way of looking at this is, if you were sitting in the bathtub and let the water out, you would see the water as it went down, start to make a whole in the middle of the water. In your mind, think of the Gann pin on top of that hole. Now think of the numbers on the Gann pinwheel at 200 going lower, lower, and faster and lower, lower all the way down to 50. Do not think of the money now, it could be bad on your heart. Your fi rst loss is your best loss. Learn to walk away and forgive yourself.
5. If a system has truth you are polar-ized by two, that is male and female, up and down, truth and false, to buy or sell.
6. International Paper chart to look at. I hope I have helped a number of people to have a better grip on their stock market trading.In no way, is this meant to be a buy recom-mendation on Q. com ticker [ QCOM] or any other stock in particular, etc. To contact the author you can call him at 330-395-8129 or e-mail him at [email protected]
Chart #1 Chart #2 Chart #3
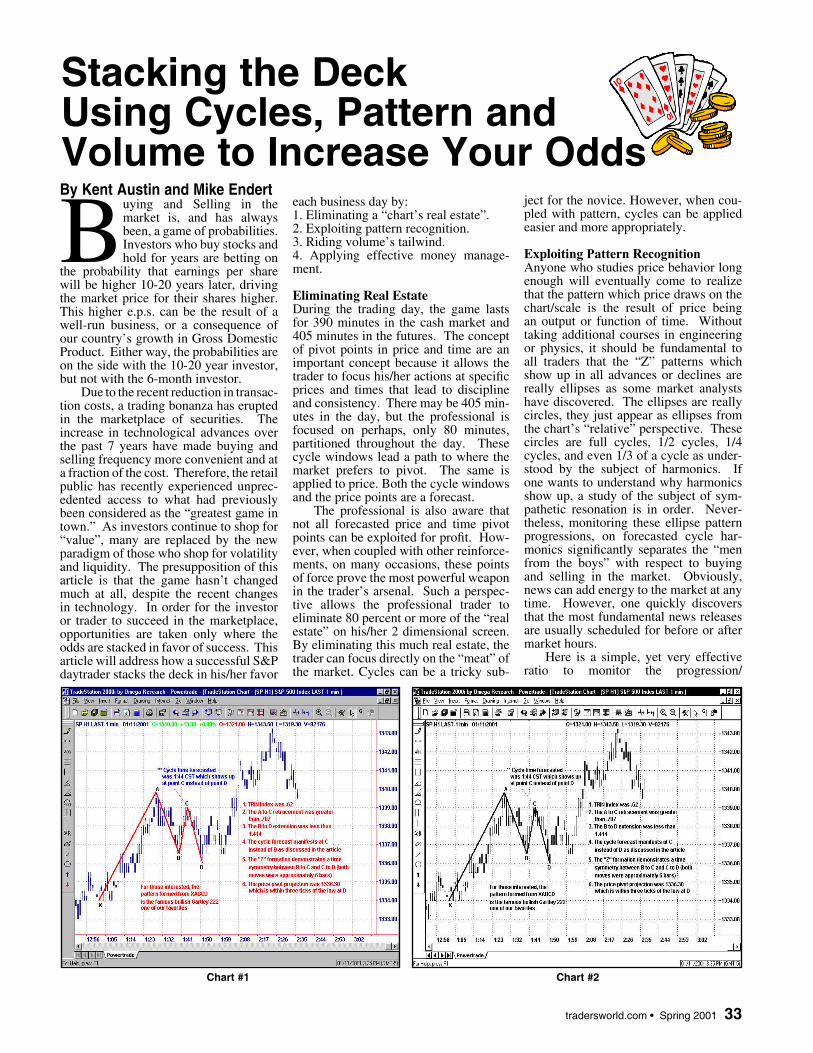
tradersworld.com • Spring 2001 33
By Kent Austin and Mike Endert
Buying and Selling in the market is, and has always been, a game of probabilities. Investors who buy stocks and hold for years are betting on
the probability that earnings per share will be higher 10-20 years later, driving the market price for their shares higher. This higher e.p.s. can be the result of a well-run business, or a consequence of our country’s growth in Gross Domestic Product. Either way, the probabilities are on the side with the 10-20 year investor, but not with the 6-month investor.
Due to the recent reduction in transac-tion costs, a trading bonanza has erupted in the marketplace of securities. The increase in technological advances over the past 7 years have made buying and selling frequency more convenient and at a fraction of the cost. Therefore, the retail public has recently experienced unprec-edented access to what had previously been considered as the “greatest game in town.” As investors continue to shop for “value”, many are replaced by the new paradigm of those who shop for volatility and liquidity. The presupposition of this article is that the game hasn’t changed much at all, despite the recent changes in technology. In order for the investor or trader to succeed in the marketplace, opportunities are taken only where the odds are stacked in favor of success. This article will address how a successful S&P daytrader stacks the deck in his/her favor
each business day by: 1. Eliminating a “chart’s real estate”.2. Exploiting pattern recognition.3. Riding volume’s tailwind.4. Applying effective money manage-ment.
Eliminating Real EstateDuring the trading day, the game lasts for 390 minutes in the cash market and 405 minutes in the futures. The concept of pivot points in price and time are an important concept because it allows the trader to focus his/her actions at specifi c prices and times that lead to discipline and consistency. There may be 405 min-utes in the day, but the professional is focused on perhaps, only 80 minutes, partitioned throughout the day. These cycle windows lead a path to where the market prefers to pivot. The same is applied to price. Both the cycle windows and the price points are a forecast.
The professional is also aware that not all forecasted price and time pivot points can be exploited for profi t. How-ever, when coupled with other reinforce-ments, on many occasions, these points of force prove the most powerful weapon in the trader’s arsenal. Such a perspec-tive allows the professional trader to eliminate 80 percent or more of the “real estate” on his/her 2 dimensional screen. By eliminating this much real estate, the trader can focus directly on the “meat” of the market. Cycles can be a tricky sub-
ject for the novice. However, when cou-pled with pattern, cycles can be applied easier and more appropriately.
Exploiting Pattern RecognitionAnyone who studies price behavior long enough will eventually come to realize that the pattern which price draws on the chart/scale is the result of price being an output or function of time. Without taking additional courses in engineering or physics, it should be fundamental to all traders that the “Z” patterns which show up in all advances or declines are really ellipses as some market analysts have discovered. The ellipses are really circles, they just appear as ellipses from the chart’s “relative” perspective. These circles are full cycles, 1/2 cycles, 1/4 cycles, and even 1/3 of a cycle as under-stood by the subject of harmonics. If one wants to understand why harmonics show up, a study of the subject of sym-pathetic resonation is in order. Never-theless, monitoring these ellipse pattern progressions, on forecasted cycle har-monics signifi cantly separates the “men from the boys” with respect to buying and selling in the market. Obviously, news can add energy to the market at any time. However, one quickly discovers that the most fundamental news releases are usually scheduled for before or after market hours.
Here is a simple, yet very effective ratio to monitor the progression/
Stacking the DeckUsing Cycles, Pattern and Volume to Increase Your Odds
Chart #1 Chart #2

34 Spring 2001 • tradersworld.com
p prespect to the octave of sound (frequency doubling), but its square root can also be used to monitor momentum strength/weakness. If cycle/price pivots call for a complex top/bottom such as a “W” pat-tern or “M” pattern, check the ratio of the fi nal extension against its previous reaction. If this semi-major (extension) is equal to or less than 1.414, then the momentum is static. The logic is simple if one accepts logarithmic progression in the form of squares. 1.414 is well known by mathematicians as the ratio of a square’s diagonal to its side.
The inverse of 1.414, or .707 is used conversely when trading with the trend at a forecasted cycle. If a retracement of .707 or less is observed, one can expect the trend to continue without excessive swing action. Many articles and books have been written about this ratio (and others related to the square) showing up in the market when price swings are related to each other. These ratios, in the author’s opinion, should not be overlooked for quantifying momentum. When momentum and cycle point in the same direction, the odds for profi t increase.
Finally, for the acute observer and student of price, each ellipse should be viewed as the mating of two triangles. One will observe that the minor axis of the ellipse is shared by each triangle. And to keep the research appetite wet, here is additional “food for thought”. Market students who identify A, B, C, D ellipses (where D is either the high or
fore, do not be discouraged with the research if a cycle time forecasted shows up at C instead of D. This occurs every day. The solution is to let the triangle complete at the cycle points of force. Additionally, the size of this triangle is a determining factor with respect to money management.
Riding Volume’s TailwindWouldn’t it be great if measuring the accumulation/distribution in the market was as easy as licking your fi nger to fi nd out which way the wind is predom-inantly blowing? One indicator works better than any other I am aware of as a precursor to big breaks in the market. What’s even better is knowing what ratio really acts as a pivot for converting the market from bearish to bullish. Dick Arms’ indicator, also known as the TRIN Index, measures the up-volume and down-volume for a complete basket of stocks and can be created for any basket of stocks. Today as this article is being written, the TRIN index has been bearish all day. Therefore it should be no surprise that the fastest move as mea-sured by angle speed was to the down-side, despite the fact that the market has traded above its opening tick for most of the day.
Most traders are familiar with .618 as an important ratio to follow. The square root of .618 is more important when monitoring the TRIN index. This ratio is .78 and is also the 4th harmonic
For more information circle No. 25
OPTIONS“40 IN 4”
For those who like a simple system
Objective: +40% gain or more, within 4 trading days.
Homework: 10 to 20 minutes after the close.
Data needed: S&P 100index option prices only.
Signal logic: plain math gives you your next day’s Trading Edge value which controls the profi t outlook.
User Satisfaction: strict criteria permit partial or full fee rebate.
Modest One-Time Fee: range is $395 to $645, depending on how promptly you order.
Performance: Most trades gain +40% or more consistently. Most of those that miss still end up with a gain. Get the proof, with additional detail and current offer, by Fax or mail, call toll free today:
KEY VOLUME STRATEGIESnow in our 32th year;
800-334-0411 x12-w828-692-3401
Website: www.key-volume.comE-mail: [email protected]
For more information circle No. 26
Know Your Future?
It is the desire of Traders World Magazine that the magic of astrology should become available to as many people as possible as inexpensively as possible. Traders World will have a professional astrology report done
for you. The professional report is approximately 30 pages beautifully pre-sented in columns with beautiful fonts covering both your personal and professional life. You can use the professional part of the report to develop your talents, so you will be better able to attain your desired growth in your profession. Problems can be avoided and transformed into positives through insight and wise action. The personal part of the report given will deal with your identity, emotion, love, destiny, etc. Another section of the report deals with the major times of change in your life, showing clearly in graphic form the months when these changes are the strongest. Through this timing you will know what to do and what not to do during these changes. The report is $19.95 plus $3.00 shipping and will be sent to you by U.S. Priority Mail. Without any extra charge. To receive the report fi ll out the following form:Birthdate______________________________ Time of Birth________________City of Birth_______________________State_______Country______________Name___________________________________________________________Address_________________________________________________________City___________________________________State_______Zip____________Telephone________________________________________________________Payment Method __Check Enc. __VISA __MC __AMAX Credit Card #_____________________________________________Exp._____
Traders World, 2508 W. Grayrock St, Springfi eld, MO 65810
For more information circle No. 27
tradersworld.com • Spring 2001 35
of PI, or 3.14 divided by 4. Most text-books will tell you that a TRIN index below 1 is bullish and above 1 is bearish. After further observation, .78 - .88 is completely neutral. Only after the market has been trading below .78, should one expect any signifi cant advances for the market. It’s almost as if the market needs extra air in the pump to keep things primed. Oh sure, the market “bucks” the wind often. But if one is to put the odds in favor of a “big break” occurring, it is best to trade with the wind. In the fi rst 30 min. of trading the TRIN can be less effective because specialists are “shor-ing” up their books from open orders, etc. For the fi rst 30 minutes, the open-ing tick takes precedence. Otherwise, checking the TRIN before making the trade can lead to a “10-bagger”. It’s the only technique discussed that addresses the odds favoring the reward side of the equation. Now for the risk side...
Money Management“Cut your losses short; let your profi ts run” is probably the best laymen version for one of Newton’s laws of motion ever stated. Letting profi ts ride always seems less challenging (psychologically) when the position has moved in one’s favor beyond the point of break even. But nothing seems more paralyzing than watching a P&L “pivot” between profi t and the risk of the position. A “catch 22” seems inevitable for those who have only risked a small amount on a position because prematurely moving a stop loss to break even can fl utter one out on vola-tility alone. On the other hand, “letting profi ts run” calls for letting the trades play out.
Here is a technique that accelerates the position to risk free, without prema-turely moving the stop loss to break even and jeopardizing the trade’s ability to “play out.” When momentum is quan-tifi ed properly as discussed earlier, a position can hit risk free in a matter of minutes, prompting additional patience on behalf of the trader to “let the house’s money ride.” The trick is to catch a break by which one covers half of the position back at a profi t equal to the original risk on the trade. The accompa-nying chart shows this trade technique. Of course there is less profi t, but money management is focused on the expense side: limiting losses.
More times than not the cover point on half the position is very close to where the fi nal cover signal comes in or the trail stop is hit. Additionally, one can discover that he/she was originally wrong on the trade, but did not withstand a loss. When profi t on a position hits 3-4 times the amount at risk, a .382 trail stop is in order. When you fi nd yourself fre-quently canceling and replacing a stop order due to a parabolic move in your favor, enjoy the process; as it is a good
Compare Brokers for real traders!Which broker gives Day Traders
TREND TRADER LLC TRADING � SECURITIES
FREE Real-time streaming Quotes and Charts FREE Streaming Time and Sales on screen FREE Level II Market Marker Screens FREE Order Entry Routing to NASDAQ Small Order Execution System FREE Order Routing to ECN’s like Island and Archipelago FREE Order Routing to DOT System FREE On-line P&L of open positions YES/NO Trend Trader, LLC YES Schwab NO Ameritrade NO DLJ Direct NO Merrill Lynch NO Waterhouse NO Suretrade NO Olde NO
*Day Trader makes an average of 2 round trip in the same stock per trading day Trend Trader, LLC Member NASD/SIPC1-888-32TREND 1-888-328-7363 For more information www.trendtrader.com
For more information circle No. 29
problem to have as a disciplined money manager. For those of you fi shing for the big one, where .382 is too much to give back (on such a parabola), PI’s inverse of .318 or .214 may serve as alterna-tives. .214 is the difference of .786 from 1 and the inverse of Feigenbaum’s con-stant 4.66 for parabolic bifurcation.
Hopefully these aforementioned techniques illustrate a professional approach to stacking the odds in one’s favor. Certainly additional statistical studies can be applied for correlating market turns, etc. However, the key is to place oneself in a position to receive only what the market is willing to give as frequently as probable. Joe Montana is considered one of the most successful professional quarterbacks ever to play the game of football. Those who enjoyed the privilege of watching Joe play for most of his career, remember a quarterback who constantly exploited what defenses were willing to give up. Whether it was fi nding the open receiver in the “soft spot” of the zone or capital-izing on a particular man to man mis-match, Joe was the best. The result: a movement of the chains, and some of the best drives in football history. The best way to “keep the chains moving” in the brokerage account is simply taking what the market gives by those who can rec-ognize a “stacked deck.”
For more information on this program go to www.tradersworld.com/doubleedge
Stratagem Software
International, Inc.����������������������� ������������� ����������������� ������������
SM
AR
Tra
der/R
T��������� ������ ��� ��� ���������
!����"��!�"���#$������%
•�&'�()����*��
'�$���)�!�'�+�•,+���
�!�-���.����
•�/.�'
'0��'���•�1
��!���"�'�!'������)�"$���'������!������•
2$���
����
$���3$'�!���
•3��(����'���
•1'4���+��"����!'����+���
��
5�
������-�'��4����$����4��'���
For more information circle No. 28

36 Spring 2001 • tradersworld.com
By Jonathan S. Ziegel
Every day you read the news; uti-lize the charts; follow your mar-ket-maker’s dealing rates and you still have a certain intuition that there may be a better, truer refl ec-
tion of a currency’s fair market price else-where. Unfortunately, you have only one trading account and you’re locked into that market maker’s dealing prices. What are your options? Your fi rst choice is to try to fi nd a foreign exchange dealing company that allows you to name your own price and trade with other traders. This option, however, entails the risk of lower liquidity, which could prevent you from capitalizing on key trading opportunities. Your second (and best) option is to go with the only dealing platform in the world that provides traders with both a deal-ing desk, and a parallel matching platform to name your own price as well as deal with other traders. MG Financial Group’s Deal Sta-tion 2000ä incorporates both trading media onto one single trading platform, empower-ing you, the trader, with the authority to make your own market.
How are Prices established?By defi nition, the market price of a currency in the cash market is determined by the play-ers’ (banks, market makers, etc.) willingness to trade on that price. Smart investors will often check many sources to help determine the fair market value of a currency. The quotes you see on a service provider’s screens are reference points or indications of where the market stands, while the prices you see on a trading platform are dealing prices, i.e. prices quoted by the Dealing Desk that repre-sent the rates upon which they are willing to deal.
The main thing to keep in mind is that spot Forex trading is an over-the-counter market as opposed to an exchange market. In an exchange market set-up such as NYSE, there are no individual market makers. This means that prices and quotes are the same, regardless of the quoting service. While it is impossible to fi nd price differences in an exchange market, such differences do exist in an over-the-counter market.
What is IBS and how does it work?IBS is a trading platform where traders can offer price-quotes to other traders, or choose to hit prices currently being offered by other traders on the system. The benefi t is that trad-ers have the control over setting their prices. At times, traders may feel that they can offer a better price than the 5-pip spread offered by the Deal Desk and can show everyone logged onto the system what they believe to be the better price to trade.
Here’s an example: EUR/USD is cur-rently dealing at 0.9450/55. A speculator, let’s call him Peter, believes that the Euro will con-tinue to appreciate. Instead of entering a posi-tion by joining the ask rate of 0.9455 (the market rate), Peter can choose to place an IBS Order to sell Euro to another trader at 0.9453. This trade, once hit, will be benefi -cial to both traders. If another trader takes that order, then Peter has bought euros in the market at .0.9453, 2 pips better than the rate of the deal desk. Simultaneously, another trader, let’s call her Margaret, has now gotten into a Sell Euro-Buy USD position at 0.9453, 3 pips better than the rate offered by the deal desk. Traders around the world would rather sell euros, buy dollars at 0.9453 than at the 0.9450 price, and they would also prefer to buy at 0.9453 than at 0.9455. At any given moment, there will always be a buyer and seller looking for a better rate than the deal desk’s prices.
Margaret’s “aggressive” action on this trade has just saved her three pips. The per-pip value of a 100,000 Euro/Dollar unit stands at $10. Traders who act aggressively on IBS orders benefi t from the system because they are, in fact, shopping for the best price. By shaving three pips off of her order, Margaret has already saved $30.00 while only paying $15 commission fee to pick up that order. Peter, on the other hand, has saved 2 pips, worth $20.00, and he hasn’t paid any fees because “passive” orders on IBS are free.
Let’s assess another example from an “aggressive” trader’s point of view. A 75,000 Great British Pound/US Dollar unit is fi xed at $7.50 per pip and let’s assume the current market price is 1.5030/35 for our second example. Let’s imagine there’s a third trader, John, on IBS who believes that the pound will appreciate following some breaking news. He now wants to buy sterling and can place an order on the IBS system to buy GBP from another trader at a price that is 3 pips better than the (1.5035) asking price that’s offered by the dealing desk. He places an IBS order to sell GBP to another trader at 1.5032. A fourth trader, Chris, believes sterling will depreciate and elects to pay the $15 ‘aggressor’ fee to sell GBP to John at 1.5032. Chris has just dealt on a price that is still 2 pips better than the dealing desk. He’s glad to have sold ster-ling for a price 2 pips better than the dealing desk while John is happy to have bought GBP at 1.5032, rather than 1.5035 (had he dealt on the dealing desk’ prices). The 3-pip advan-tage actually saved John $22.50.
The foreign exchange market is the world’s largest fi nancial market, trading over $1.5 trillion a day. While trading is conducted on a 24-hour a day basis, forex speculators
must be aware that market conditions may be volatile and subject to substantial price swings. With this in mind, it is imperative to fully comprehend how your IBS orders most ideally work. All IBS orders are good-till-cancelled or hit by another trader. While the main intention of using IBS is to minimize the price spread, a sudden price change may inadvertently shift your IBS order to outside the 5-pip bid/ask rates and into the undesir-able side of the market. All traders, especially Momentum, Swing, and Day Traders, should always closely watch their IBS orders and immediately dismiss them, should the market move outside the realm of your desired trade. Case in point: In the above example, it is safe to say that John would be quite unhappy if his order was taken after the dealing desk’s market price had gaped 20 pips to 1.5015 and his original order to buy GBP at 1.5032 was hit by the other trader for an immediate $150 pip loss.
Advantages of IBSThere are two more considerations to keep in mind… 1) A trader using the IBS system can always square up positions with the dealing desk, and vice versa; a trader who has used the dealing desk to enter a position can also square up their positions by posting a trade on IBS (and avoid commissions). And…2) When a trader is interested in ‘bidding’ a currency, he/she must be sure to show other traders the offering price on IBS because the trader who acts on that order will, in effect, be clicking on the ‘Ask’ price for that cur-rency. In essence, entering an IBS Order on the platform is initiated in the same manner as entering a limit order but with the use of the IBS button on the order box.
Participation and a fully liquid system are keys to fi nding the best price. IBS will only work as effectively as the trades put into it and as the market participants are them-selves. The IBS System has been designed to show the most competitive prices by ranking in terms of priority with the most attractive prices listed at the top of the page while the least attractive prices are listed at the bottom of the page.
MG Financial Group strives to provide its trades with an array of trading options. Client-traders have the ability to use the deal-ing desk for reliable, quick execution and they can also choose to set prices on IBS to make their own market.
Please keep in mind that leveraged trading of the currency markets is highly speculative and is only recommended for sophisticated traders. It is highly recom-mended that you fi rst paper trade on both systems before committing to a live trading strategy using the aforementioned strategies.
For more information on IBS or other forex trading related questions, feel free to con-tact MG Financial Group account represen-tatives at 212-835-0100 or by visiting the website at www.mgforex.com.
Find the Currency Price You Want to Deal On, Using The Internet Brokerage System!

tradersworld.com • Spring 2001 37
Question: Do you feel that W.D. Gann was the greatest trader of all time and if so why?
Answer: Gann was the best fore-caster of all time but I have my doubts about his trading since if you examine his detailed swing trades they often went against him for several days to even a week or more. Obviously he was using his astrological rules to forecast highs and lows and just put in 10% stops. His use of support and resistance numbers helped him scalp intra-day to great suc-cess but modern day traders do as well but can’t reproduce his long term swings so accurately.
Question: In your new trading course what do you feel are the most important trading ideas to learn and why?
Answer: You must learn how to defi -nitely determine the trend and trade with it. Past extremes forecast future extremes so we use measured moves, time counts and circular arcs to determine points for culminations.
Price targets are likewise determined with measured moves and arcs but the square root increments from highs and lows pin point the exact selling levels we expect at the fi nal high or low. Gann’s use of the square of nine is also a very important concept as is the conversion of astrological longitudes into stock and commodity selling prices.
Question: In today’s market, what in your opinion is the way a person should trade to succeed?
Answer: First study hard and learn how to read charts thoroughly. Then study your emotional state of mind and develop a strategy that will allow you to analyze the market without becoming emotion-ally involved.
Learn day trading techniques as well as swing trading and adopt the approach that suits your needs and time require-ments. Volatility is so great these days that making $1,000 to $20,000 per day is more than possible with modest capital ($200,000) but only if you learn how to scalp and most importantly how to take a loss when you are wrong. None of this is possible without a basic understanding of charts and how to read them. Cycles and forecasting is used to develop strate-gies to leverage up for great opportunities when they are anticipated. Most traders make 80% of their annual income in 4 to 6 big trades over two to three week peri-ods during the year and the rest of the time is spent scalping small gains to keep them in the game when the big moves come. A knowledge of cycles is a very
big competitive advantage here. Remem-ber there’s a loser and a winner on each side of every trade. Anticipating the turn is everything.
Question: Do you feel that it is nec-essary for a trader to use some astrologi-cal trading concepts and why?
Answer: In my 30 years of trading I fi nd the astrological approach is the only one that works all the time for forecast-ing. This is not to say you can’t become rich day trading without any knowledge of the planets but you must jump in and out every day each time the market wiggles and it’s a tremendous strain on your emotions. A knowledge of what the cause of the move is and how long it will last gives you a big emotional advan-tage and an objective measure to use stops when you have an opinion. Many trader friends of mine make $300,000 to $400,000 per month by just playing the opening bulges and front running recom-mendations but none of them can leave the tape for more than fi ve minutes or they are lost. If you understand the plan-ets like Gann did you can swing trade for three days to three months at a time and make huge gains with reasonable risk and a lot less work. It’s not for everyone but it is the fi nal answer for those who must know.
Question: Do you recommend day-trading or another type of trading?
Answer: Day trading is the hardest game in town. You can lose huge amounts of money in a stock day trading a whippy range of only $5 dollars whereas a long term trader my not ever get stopped out once. The trade off is that most long term traders make 20 to 40% a year on their money and the best day traders in the world make 300 to 400% or more per year. Inexperienced day traders fre-quently lose 40-70% of their capital within three months. Beginners should fi rst learn chart reading and apply it to long term daily and weekly charts and trade less frequently with bigger stops until they know how to trade. After that they can learn the subtleties of day trad-ing scalps but what they really need to learn before day trading is what their mental and emotional limits are and if there are any psychological factors that could sabotage their day trading efforts.
Question: What is the reason that you think most traders fail today.
Answer: They are not prepared and have no game plan, and if they do they change it. Discipline is required and basic skills must be learned. Reading analytical reports and thinking too much
will kill you. Stocks are just pieces of paper that go up and down with emo-tional buying and selling. If you think you are trading because you have read some report you are only fooling your-self. Trading is pure supply and demand analysis through chart or tape reading. The reasons why stocks go up or down are irrelevant to trading. Price action is the only reality. Trading can be learned-just like going on a diet will lose weight. Can you lose weight and keep it off? If so you can be a successful trader.
Question: What equipment and ser-vices do you recommend to today’s trader.
Answer: A computer with chart graphics and a good quote data feed. Good chart books and a compass and some plastic angles. A table of support and resistance numbers or Gann’s square of nine or four or six charts. Perhaps a subscription to a good hot wire and news-letter service to get an outside technical opinion each day. Astrological ephemeri-des if you go that route.
Michael Jenkins is a professional trader who has written two very popular trading books: “Geometry of the Stock Market a Guide to Professional Trading for a Living” and “Chart Reading for Pro-fessional Traders”.
Many people have asked him to write a course of instructions to enhance his two previous books. He has now done this. The course is developed around the principals of technical analysis, which forecast price trends and probabilities so you can anticipate the big moves long before the fundamental really develop. Much of the course is based on the perspective of W.D. Gann of which Jen-kins is a master. The Jenkins trading course contains the following chapters:Introduction, Basics, Charts, Reversal of Trend, Hourly Charts, Time and Price Square, Angles, Arcs, Support and Resistance, Gann Square of Nine, Gann Astrological Techniques, Time Cycles, Mirror Image, Waves, Day-TradingSetup, Advanced, and Review
In this course Jenkins teaches you how to trade the markets in today’s envi-ronment using many of the principals of W.D. Gann. Jenkins fully explains many of Gann’s key concepts concerning the principal of squaring time and price. A large part of the course is devoted to time cycles and Gann Astro of which Jen-kins is a master. A chapter on Mirror Image Foldbacks is also very enlighten-ing. Jenkins also reveals several of his secret trading techniques which he only has revealed to some of his close friends.
This new Trading Course as well as Jen-kins two previous books come highly recommended. The course is $529.00 To order call Traders World at 800-288-4266.
Michael Jenkins Interview
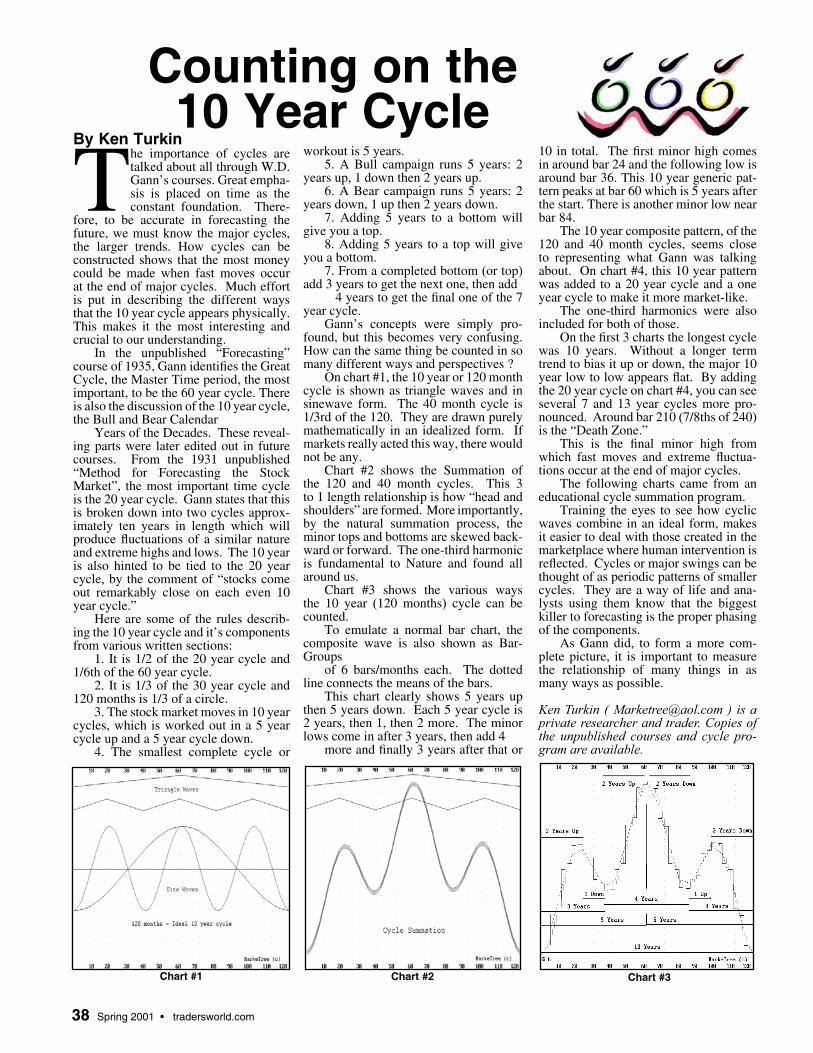
38 Spring 2001 • tradersworld.com
By Ken Turkin
The importance of cycles are talked about all through W.D. Gann’s courses. Great empha-sis is placed on time as the constant foundation. There-
fore, to be accurate in forecasting the future, we must know the major cycles, the larger trends. How cycles can be constructed shows that the most money could be made when fast moves occur at the end of major cycles. Much effort is put in describing the different ways that the 10 year cycle appears physically. This makes it the most interesting and crucial to our understanding.
In the unpublished “Forecasting” course of 1935, Gann identifi es the Great Cycle, the Master Time period, the most important, to be the 60 year cycle. There is also the discussion of the 10 year cycle, the Bull and Bear Calendar
Years of the Decades. These reveal-ing parts were later edited out in future courses. From the 1931 unpublished “Method for Forecasting the Stock Market”, the most important time cycle is the 20 year cycle. Gann states that this is broken down into two cycles approx-imately ten years in length which will produce fl uctuations of a similar nature and extreme highs and lows. The 10 year is also hinted to be tied to the 20 year cycle, by the comment of “stocks come out remarkably close on each even 10 year cycle.”
Here are some of the rules describ-ing the 10 year cycle and it’s components from various written sections:
1. It is 1/2 of the 20 year cycle and 1/6th of the 60 year cycle.
2. It is 1/3 of the 30 year cycle and 120 months is 1/3 of a circle.
3. The stock market moves in 10 year cycles, which is worked out in a 5 year cycle up and a 5 year cycle down.
4. The smallest complete cycle or
workout is 5 years.5. A Bull campaign runs 5 years: 2
years up, 1 down then 2 years up.6. A Bear campaign runs 5 years: 2
years down, 1 up then 2 years down.7. Adding 5 years to a bottom will
give you a top.8. Adding 5 years to a top will give
you a bottom.7. From a completed bottom (or top)
add 3 years to get the next one, then add 4 years to get the fi nal one of the 7
year cycle.Gann’s concepts were simply pro-
found, but this becomes very confusing. How can the same thing be counted in so many different ways and perspectives ?
On chart #1, the 10 year or 120 month cycle is shown as triangle waves and in sinewave form. The 40 month cycle is 1/3rd of the 120. They are drawn purely mathematically in an idealized form. If markets really acted this way, there would not be any.
Chart #2 shows the Summation of the 120 and 40 month cycles. This 3 to 1 length relationship is how “head and shoulders” are formed. More importantly, by the natural summation process, the minor tops and bottoms are skewed back-ward or forward. The one-third harmonic is fundamental to Nature and found all around us.
Chart #3 shows the various ways the 10 year (120 months) cycle can be counted.
To emulate a normal bar chart, the composite wave is also shown as Bar-Groups
of 6 bars/months each. The dotted line connects the means of the bars.
This chart clearly shows 5 years up then 5 years down. Each 5 year cycle is 2 years, then 1, then 2 more. The minor lows come in after 3 years, then add 4
more and fi nally 3 years after that or
10 in total. The fi rst minor high comes in around bar 24 and the following low is around bar 36. This 10 year generic pat-tern peaks at bar 60 which is 5 years after the start. There is another minor low near bar 84.
The 10 year composite pattern, of the 120 and 40 month cycles, seems close to representing what Gann was talking about. On chart #4, this 10 year pattern was added to a 20 year cycle and a one year cycle to make it more market-like.
The one-third harmonics were also included for both of those.
On the fi rst 3 charts the longest cycle was 10 years. Without a longer term trend to bias it up or down, the major 10 year low to low appears fl at. By adding the 20 year cycle on chart #4, you can see several 7 and 13 year cycles more pro-nounced. Around bar 210 (7/8ths of 240) is the “Death Zone.”
This is the fi nal minor high from which fast moves and extreme fl uctua-tions occur at the end of major cycles.
The following charts came from an educational cycle summation program.
Training the eyes to see how cyclic waves combine in an ideal form, makes it easier to deal with those created in the marketplace where human intervention is refl ected. Cycles or major swings can be thought of as periodic patterns of smaller cycles. They are a way of life and ana-lysts using them know that the biggest killer to forecasting is the proper phasing of the components.
As Gann did, to form a more com-plete picture, it is important to measure the relationship of many things in as many ways as possible.
Ken Turkin ( [email protected] ) is a private researcher and trader. Copies of the unpublished courses and cycle pro-gram are available.
Counting on the 10 Year Cycle
Chart #1 Chart #2 Chart #3
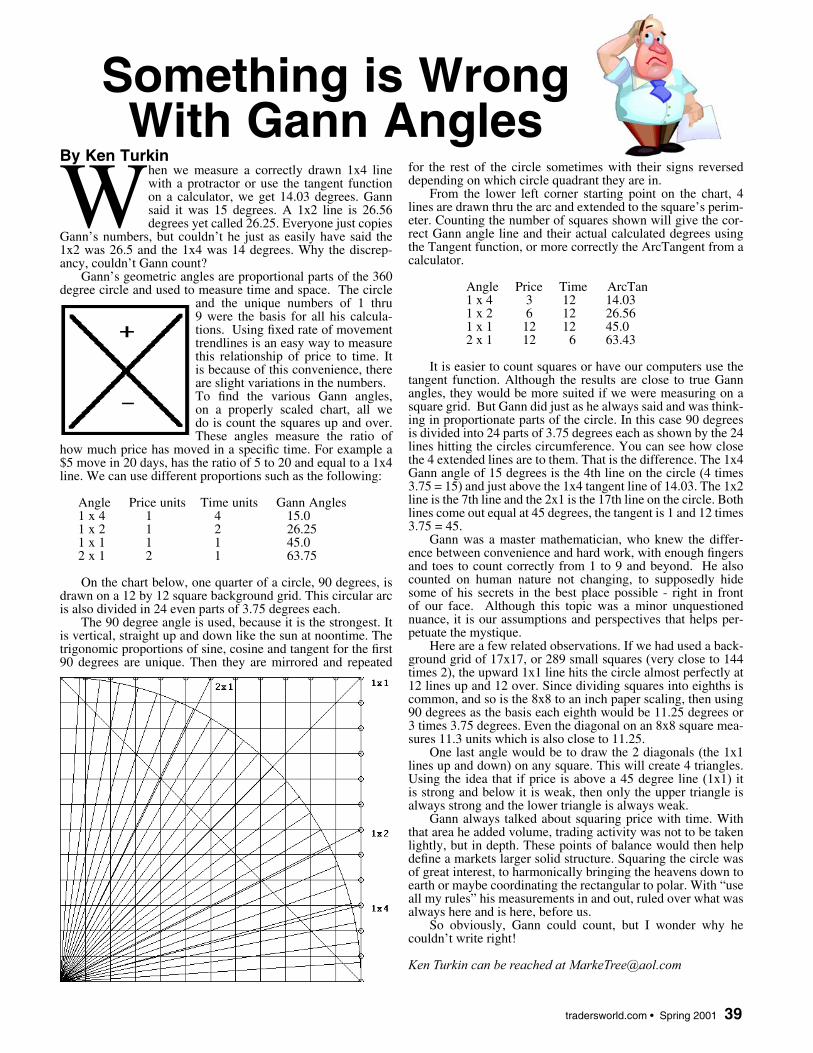
tradersworld.com • Spring 2001 39
By Ken Turkin
When we measure a correctly drawn 1x4 line with a protractor or use the tangent function on a calculator, we get 14.03 degrees. Gann said it was 15 degrees. A 1x2 line is 26.56 degrees yet called 26.25. Everyone just copies
Gann’s numbers, but couldn’t he just as easily have said the 1x2 was 26.5 and the 1x4 was 14 degrees. Why the discrep-ancy, couldn’t Gann count?
Gann’s geometric angles are proportional parts of the 360 degree circle and used to measure time and space. The circle
and the unique numbers of 1 thru 9 were the basis for all his calcula-tions. Using fi xed rate of movement trendlines is an easy way to measure this relationship of price to time. It is because of this convenience, there are slight variations in the numbers.To fi nd the various Gann angles, on a properly scaled chart, all we do is count the squares up and over. These angles measure the ratio of
how much price has moved in a specifi c time. For example a $5 move in 20 days, has the ratio of 5 to 20 and equal to a 1x4 line. We can use different proportions such as the following:
Angle Price units Time units Gann Angles 1 x 4 1 4 15.0 1 x 2 1 2 26.25 1 x 1 1 1 45.0 2 x 1 2 1 63.75
On the chart below, one quarter of a circle, 90 degrees, is drawn on a 12 by 12 square background grid. This circular arc is also divided in 24 even parts of 3.75 degrees each.
The 90 degree angle is used, because it is the strongest. It is vertical, straight up and down like the sun at noontime. The trigonomic proportions of sine, cosine and tangent for the fi rst 90 degrees are unique. Then they are mirrored and repeated
Something is WrongWith Gann Angles
for the rest of the circle sometimes with their signs reversed depending on which circle quadrant they are in.
From the lower left corner starting point on the chart, 4 lines are drawn thru the arc and extended to the square’s perim-eter. Counting the number of squares shown will give the cor-rect Gann angle line and their actual calculated degrees using the Tangent function, or more correctly the ArcTangent from a calculator.
Angle Price Time ArcTan 1 x 4 3 12 14.03 1 x 2 6 12 26.56 1 x 1 12 12 45.0 2 x 1 12 6 63.43
It is easier to count squares or have our computers use the tangent function. Although the results are close to true Gann angles, they would be more suited if we were measuring on a square grid. But Gann did just as he always said and was think-ing in proportionate parts of the circle. In this case 90 degrees is divided into 24 parts of 3.75 degrees each as shown by the 24 lines hitting the circles circumference. You can see how close the 4 extended lines are to them. That is the difference. The 1x4 Gann angle of 15 degrees is the 4th line on the circle (4 times 3.75 = 15) and just above the 1x4 tangent line of 14.03. The 1x2 line is the 7th line and the 2x1 is the 17th line on the circle. Both lines come out equal at 45 degrees, the tangent is 1 and 12 times 3.75 = 45.
Gann was a master mathematician, who knew the differ-ence between convenience and hard work, with enough fi ngers and toes to count correctly from 1 to 9 and beyond. He also counted on human nature not changing, to supposedly hide some of his secrets in the best place possible - right in front of our face. Although this topic was a minor unquestioned nuance, it is our assumptions and perspectives that helps per-petuate the mystique.
Here are a few related observations. If we had used a back-ground grid of 17x17, or 289 small squares (very close to 144 times 2), the upward 1x1 line hits the circle almost perfectly at 12 lines up and 12 over. Since dividing squares into eighths is common, and so is the 8x8 to an inch paper scaling, then using 90 degrees as the basis each eighth would be 11.25 degrees or 3 times 3.75 degrees. Even the diagonal on an 8x8 square mea-sures 11.3 units which is also close to 11.25.
One last angle would be to draw the 2 diagonals (the 1x1 lines up and down) on any square. This will create 4 triangles. Using the idea that if price is above a 45 degree line (1x1) it is strong and below it is weak, then only the upper triangle is always strong and the lower triangle is always weak.
Gann always talked about squaring price with time. With that area he added volume, trading activity was not to be taken lightly, but in depth. These points of balance would then help defi ne a markets larger solid structure. Squaring the circle was of great interest, to harmonically bringing the heavens down to earth or maybe coordinating the rectangular to polar. With “use all my rules” his measurements in and out, ruled over what was always here and is here, before us.
So obviously, Gann could count, but I wonder why he couldn’t write right!
Ken Turkin can be reached at [email protected]

40 Spring 2001 • tradersworld.com
By Howard Arrington
William D. Gann (1878-1955) was a legendary trader who designed several unique techniques for analyzing price charts. He developed a unique combination of precise mathematical and geometric principles which are not easy to
grasp. Gann analysts have spent years pouring over old charts and writings in search of Gann’s secret, and there is no end to the number of people who claim to have discovered Gann’s insight and technique that has eluded everyone else. Perhaps someone has discovered it. I am not in a position to appraise all the claims because I am not a Gann expert and have not read Gann’s writings.
Don Hall has published a book and developed a system called Pyrapoint which seems to me to be well founded in Gann principles. The purpose of this article is to take one idea used in Don’s work, and present it from a different approach, and yet arrive at the same useful conclusion. I hope even Don will fi nd my article to be an original insight to substantiate the validity of his work.
Gann’s geometric angles are trend lines drawn from promi-nent tops or bottoms at certain angles. The most important angle is 45 degrees, which means the line’s slope is one unit of price per unit of time. (Note: Depending of the chart scale used, the line may or may not appear to be plotted at a 45 degree angle.) For years, I thought this is what Gann analysts meant by the phrase ‘squaring time and price.’ However, Don’s Pyrapoint method gave me a new insight, which is:Price = Time squared or P = t ^ 2
Let me take this mathematical relationship and develop it in this article. The above relationship between price and time can be plotted on a chart as shown in this illustration. The time values of 10, 20, and 30 are marked by the three arrows. See Figure 1.
For the sake of illustration, let’s suppose a prominent top or bottom occurs at a price of 400. The theory is that this signifi cant point has a mathematical counterpart. Start a new time curve at this point in time, and it will give us an expecta-tion for a future top or bottom to occur on this curve. This
principle can be stated as ‘When price meets time, a change is imminent.’ This ‘price meets time’ relationship is shown in the following chart. See Figure 2.
With the prominent top or bottom at P, if price meets the curve at point A it will do so in 18 bars. The time to A is the square root of the price at A. Price at A is 324. Square root of 324 is 18.
If price meets the curve at point B, it will do so in 20 bars. The time to B is the square root of the price at B. Price at B is 400, therefore the time to B is 20 bars.
If price meets the curve at point C, it will do so in 22 bars. This is a very interesting concept!
Remember that price and time are related by the formula: P = t ^ 2 or t = sqrt( P )
In this article, I will develop the mathematics for the slope of a trend line using the price and time relationship presented in the previous article. Let’s work with the model illustrated in this See Figure 3.
From the previous article, the next time curve will be t bars away for a given price P. At a time t+1 price would meet the curve at price P1. Now, lets solve for the slope of the trend line shown in blue which connects P and P1.
P = t ^ 2
P1 = (t + 1) ^ 2 = t ^ 2 + 2 t + 1 = P + 2 t + 1
Slope = (Change in price) / (Change in time)
Change in price = P1 - P = P + 2 t + 1 - P = 2 t + 1 = 2 t + 2 - 1 = 2 [ t + 1] -1
Change in time = t + 1
Therefore, slope of P to P1 is = (2 [ t + 1] - 1) / (t+1) = 2 - 1 / (t+1) = 2 - 1 / sqrt( P1 )
If we normalize all prices to consider three signifi cant
Time and Price
Figure 1 Figure 2
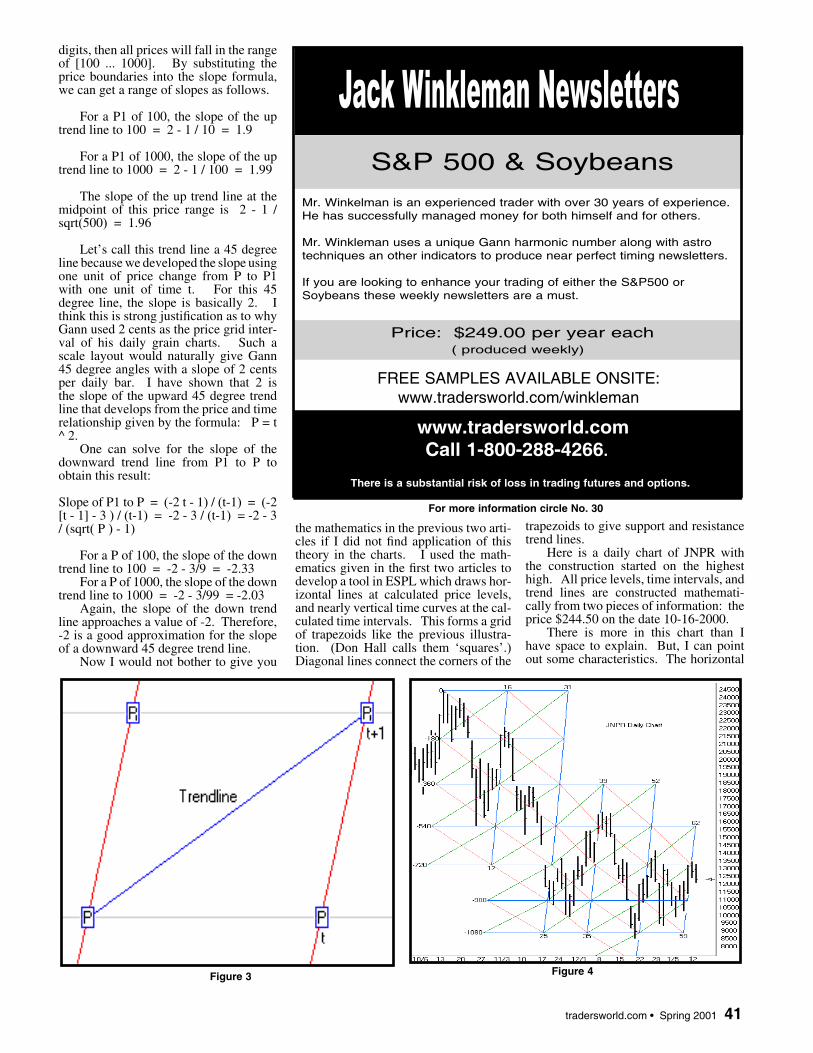
tradersworld.com • Spring 2001 41
digits, then all prices will fall in the range of [100 ... 1000]. By substituting the price boundaries into the slope formula, we can get a range of slopes as follows.
For a P1 of 100, the slope of the up trend line to 100 = 2 - 1 / 10 = 1.9
For a P1 of 1000, the slope of the up trend line to 1000 = 2 - 1 / 100 = 1.99
The slope of the up trend line at the midpoint of this price range is 2 - 1 / sqrt(500) = 1.96
Let’s call this trend line a 45 degree line because we developed the slope using one unit of price change from P to P1 with one unit of time t. For this 45 degree line, the slope is basically 2. I think this is strong justifi cation as to why Gann used 2 cents as the price grid inter-val of his daily grain charts. Such a scale layout would naturally give Gann 45 degree angles with a slope of 2 cents per daily bar. I have shown that 2 is the slope of the upward 45 degree trend line that develops from the price and time relationship given by the formula: P = t ^ 2.
One can solve for the slope of the downward trend line from P1 to P to obtain this result:
Slope of P1 to P = (-2 t - 1) / (t-1) = (-2 [t - 1] - 3 ) / (t-1) = -2 - 3 / (t-1) = -2 - 3 / (sqrt( P ) - 1)
For a P of 100, the slope of the down trend line to 100 = -2 - 3/9 = -2.33
For a P of 1000, the slope of the down trend line to 1000 = -2 - 3/99 = -2.03
Again, the slope of the down trend line approaches a value of -2. Therefore, -2 is a good approximation for the slope of a downward 45 degree trend line.
Now I would not bother to give you
the mathematics in the previous two arti-cles if I did not fi nd application of this theory in the charts. I used the math-ematics given in the fi rst two articles to develop a tool in ESPL which draws hor-izontal lines at calculated price levels, and nearly vertical time curves at the cal-culated time intervals. This forms a grid of trapezoids like the previous illustra-tion. (Don Hall calls them ‘squares’.) Diagonal lines connect the corners of the
Jack Winkleman Newsletters
Mr. Winkelman is an experienced trader with over 30 years of experience. He has successfully managed money for both himself and for others.
Mr. Winkleman uses a unique Gann harmonic number along with astro techniques an other indicators to produce near perfect timing newsletters.
If you are looking to enhance your trading of either the S&P500 or Soybeans these weekly newsletters are a must.
www.tradersworld.com Call 1-800-288-4266.
There is a substantial risk of loss in trading futures and options.
FREE SAMPLES AVAILABLE ONSITE:www.tradersworld.com/winkleman
Price: $249.00 per year each ( produced weekly)
trapezoids to give support and resistance trend lines.
Here is a daily chart of JNPR with the construction started on the highest high. All price levels, time intervals, and trend lines are constructed mathemati-cally from two pieces of information: the price $244.50 on the date 10-16-2000.
There is more in this chart than I have space to explain. But, I can point out some characteristics. The horizontal
For more information circle No. 30
Figure 3 Figure 4
S&P 500 & Soybeans
42 Spring 2001 • tradersworld.com
price lines have a label on the left which is a degree of rotation around a Square of 9. This is covered in the Pyrapoint book, but is beyond the scope of this article. Note that in my example, the time lines are nearly vertical. This is a slight variation from the method of con-struction in the Pyrapoint book which shows vertical lines. I feel that my pre-sentation is appropriate because of the theory of the time curve illustrated in my fi rst article. The time curve forms the left and right sides of the trapezoid, and the price levels form the top and bottom sides.
Time: Time is measured by the time curve, which is related to price. Tip: ‘As price meets time, a change is immi-nent.’ Note the fi rst time line labeled 12 on the bottom and 16 on the top. If price meets time at the -720 horizontal, then the time for the change would be the 12th bar from the top. If price meets time at the -540 horizontal, then the time for the change would be the 13th bar from the top. At the -360 horizontal, the time change would be in the 14th bar. At the -180 horizontal, the time change would be in the 15th bar. At the 0 line, the time measured would be 16 bars. That is why the top of the time line is labeled with a 16, and the bottom of the line is labeled with a 12. Starting at 16, for each 180 degree down the time count is reduced by one bar, or for every 180 degree rise, the time count increases another bar. Note that the market did experience a change when price met the time curve labeled 12 to 16!
The price at the 12 to 16 time line was used to obtain a forecast of the 2nd time line, which is labeled 25 to 31. As the price meets each time curve, a new time curve is calculated based on the price. Each of the time curves shows excellent correlation with market change when price met the time line.
Prices: The prominent high of $24.50 is the calculation basis for all the hori-zontal price levels that are shown. Tip: The market seeks out these price levels, and you can calculate these prices in advance. Note how the market fell to the -540 horizontal, rallied to the -180 hori-zontal, fell to the -900 level, rallied to the -540 level, fell to the -1080 level, and rallied to the -720 level.
Trend Lines: The downward 45 degree trend lines shown in red create a fl ow channel, or ‘price highway’ as Don calls it. The upward 45 degree trend lines shown in green create a price high-way going the other direction. The red lines are resistance lines that the market must close above to change direction from bearish to bullish. The green lines are support lines that the market must close below to change direction from bullish to bearish. We all have used upward trend lines placed under-neath action lows to indicate support, and downward trend lines placed above action highs to indicate resistance. The beauty of this tool is that these diagonal trend lines are computed in advance, and the market seems to have respect for them. Price fl ows up and down the chan-nels. The more you study the example,
Gann MastersTM
As you know, W.D. Gann was a legendary trader who amassed a fortune of $50 million trading the markets. He died in 1955. He wrote several important books on trading as well as a com-modity trading course and a stock market trading course.
He charged $3000 to $5000 for the trading courses which included 6 months of per-sonal instruction by phone. The books and courses were written in veiled language which is almost impossible to understand by the average person.
Traders World Research found that many successful traders used the techniques of W.D. Gann. Due to the overwhelming inter-est in the W.D. Gann trading techniques, Traders World created the Gann Masters Trading Course to help traders become suc-cessful. The course was created by Traders World Research in combination with asking large traders how they used the techniques of W.D. Gann. This was put together in an easy-to-understand course designed for the average person. The course includes dozens of charts and illustrations which were not included in the courses of W.D. Gann. The course length is 200 pages. An Excel tem-plate was also developed to help the stu-dents with master table and circle charts. It includes electronic versions of all the master charts including the square of 4 and 9. It is possible to extend these master charts out to infi nity with the Excel template. It is rec-ommended that you purchase the Microsoft Excel software to run the program, but it is not necessary. Students can download a Excel viewer from the Microsoft internet site. This will run the template.
It still takes a lot of work and study to achieve the trading expertise of W.D. Gann. To help the understanding of mate-rial a secret internet site was developed just for students of the course. The site is used for students only. Students can ask questions of the material they don’t understand. A master instructor will respond. A discussion group was also created so students could talk to each other and help each other under-stand the material in study groups. The site also includes updated versions of the Excel template as well as viewer fi les as to how to use techniques and programs such as Quick Charts. It also includes a regular publication of Gann Today.
A degree program is now in place and part of Traders World University program.. All students who want level degrees in Gann Masters must pass essay tests. The tests are not easy and involve much work, but they help you to learn and to trade better. To enroll in GannMasters please send $90.00 printed course or $80.00 for PDF-CD version plus $4.95 shipping to Traders World use the catalog order blank in this magazine.
Gann Masters c/o Traders World Phone: 800-288-4266 Fax: 417-886-5180
For more information circle No. 31 Figure 3

tradersworld.com • Spring 2001 43
PYRAPOINTCourse Contents: 300 pgs.IntroductionPart I: Factors Contributing to the Formation of PYRAPOINT • An introductory word about trading. • An outline of what to expect in the pages to follow • Fundamentals of trading as applied to PYRAPOINT and their role in the trading sys-tem. • The PYRAPOINT system of tradingPart II: Core Basics of PYRAPOINT • What is the derivative of this PYRAPOINT system? • Studies and the theorems of which make PYRAPOINT valid • Basics of the simple square • Specific PYRAPOINT rules • The core dataPart III: Developing the Application of Learned Basics • The square applied • A word about trendlines • A word about the charting program per the computer • Overbalance as a tool of trend • Using the three-place floating decimalPart IV: Charting Our Knowledge of Learned Basics • Chart and “setup” recognition • Continuing our study in chart applicationPart V: Learning to Use Our Charts to Guide Our Decisions • A further review with July Oats and July Corn • A study in synchronizing what we now know • Some additional uses to assist your under-standing in charting PYRAPOINT • A parallel example using the stock marketPart VI: Principles & Examples Applied to the “Firing Line” • Quick examples of assistance to us • A word about 2 x 1 and 4 x 1 lines • Further use of 2 x 1 lines • A longer look at a complete trend cycle, and related uses for successful trading • Integrating squares • Coordinating more than one time framePart VII: In Conclusion • Observations for “setup” recognition • Summarily SpeakingStudent Internet Support Site AvailableProgram Script Included
Real-Time Trading for Ensign (Signal, Bonneville, DTN compatible) with Ensign Demo program.
From the early ‘60’s when I began to study somewhat in earnest, and fol-lowing at least to the mid-seventies, I attended many seminars, but I especially attempted to attend all seminars avail-able on Gann.
Alas, however! I never found the secret as shown by Gann’s verified results.
It was only after attending most of the Gann seminars, administered by people, all of whom were claiming to have his secret, that I came to the conclusion that there was a question as to whether the teachers were actually duplicating his record. Indeed, they were usually not even in fair range of his results.
It was then that I began dissecting his seminars and assimilating certain segments of different seminars. I came to some conclusions, not the least of which was, in my opinion: THAT HE WASN’T ALWAYS TEACHING THAT WHICH HE WAS ACTUALLY TRADING.
I can stand corrected, but the next ten years proved to me the validity of my convictions. Mr. Gann indicated that he would not reveal the true secret of the math involved. However, he also indicated that if one were to spend the time which he had (25 years) and covered the material at least three times, that it could be revealed to a serious student.
I have qualified for the years, plus some, and have subjected my family to at least ten of those years, sometimes to their exhaustion, I’m sure.
I SUBMIT TO YOU THAT THE PYRAPOINT SYSTEM IS THE PRINCIPLE WHICH HE USED. I can prove it, I feel. Gann never taught this in any of his seminars, even to his associ-ate, who I had the privilege to person-ally know for some seven years, Mr. Renato Alghini. “Reno” was with Gann for six years, actually sharing close trad-ing desks. Reno revealed that Gann carried into the trading pit a piece of paper when he did his most successful recorded trades. I have figured out how Gann used this piece of paper to suc-cessfully trade. I will teach you in my complete PYRAPOINT course how I feel he used this piece of paper.
�Yes, please send me the complete PYRAPOINT Course for $179.95 plus U.S. S&H of $4.95. �PDF version on CD version for $169.95 plus $4.95 U.S. S&H
Name_______________________________________________________________________
Address_____________________________________________________________________
City____________________________________________State______Zip________________
Method of Payment: � Check � VISA � MC � AMEX
Credit Card No._________________________________________Exp._________________
Traders World, 2508 W. Grayrock St., Springfield, MO 65810, 800-288-4266
For more information circle No. 32
THE PRINCIPLE THAT GANN USED!
the more impressed I think you will be with this tool.
The Pyrapoint tool can also be applied to intra-day charts with good success. The size of the price interval used on a daily chart seems to be too big for use on an intra-day chart. No problem. Don points out that there are squares within a square. All one needs to do is sub-divided the price interval into halves, fourths, or eighths. The time interval is determined from price and will not change.
One question that I have dealt with is this: If the time interval computes to be 11 bars because the price is at 121, which intra-day bar time frame should I use? If 1-minute bars are used, then we have a time curve 11 minutes later. If 2-minute bars are used, then the time curve would be 22 minutes later. If 5-minute bars are used, then the time curve is plotted 55 minutes later. Now do you see why I have a question? The selection of the intra-day bar time frame greatly affects the time interval measured by the next time curve.
Here is how I tackled the problem, and the proposed solution. I displayed a 1-minute chart and used a cycle tool to measure in hindsight the cycle rhythm from bottoms to bottoms, tops to tops, and/or bottoms to tops. When I found a cycle width that seems to fi t by catch-ing multiple turning points, I note the number of minutes in the cycle. I use this formula to estimate a good intra-day time frame to use.
Intra-day Bar Time Frame = Cycle width in minutes / sqrt( P )
Example: On the JNPR 1-minute chart I found a 65 minute cycle when the price was around $133. Therefore, bar time = 65 / sqrt( 133 ) = 5.6 minutes per bar. So, using a 6-minute chart, or possibly a 5-minute chart should show a good fi t with the Pyrapoint tool. I hap-pened to have been following a 5-minute chart, and I do fi nd excellent correlation. I have used a smaller price interval by subdividing the 180 degree interval into eighths in this example. See Figure 5.
Please study the chart, and observe the fl ow of prices in the up and down trend channels. Note how trend changes occur on or near the vertical time curves, and how the market seeks the horizontal price levels. This entire road map is computed in advance from the prominent top that occurred on January 12th at 9:35 a.m.Mr. Arrington can be reached at Ensign Software, www.ensignsoftware.com. This article came from thier technical newsletter. If you are interested in the Pyrapoint System. You can purchase the Pyrapoint Book with the script and demo program on CD for just $179.95. + shipping. Call 800-288-4266 or go to www.tradersworld.com
44 Spring 2001 • tradersworld.com
By Granville Cooley
In Book I “The Cycle of Mars” in the series “The PATTERNS of Gann” I told how a friend and I had put down the square of 144 on the weekly soybean chart of the
late 1940 and early 1950 period as Gann had said to do.
I said then that our reaction had been “So what?” Since we did not really see anything that caught our eye. Maybe you have done that and maybe you found something or maybe your reaction was the same as ours.
In Book I, I told of how I had laid out the heliocentric planets over this period with a little better luck.
But I am never satisfi ed. I keep look-ing or PATTERNS. I want to fi nd things that make an exact fi t. My friend says I’m too exacting. He thinks I should be satisfi ed if things are within a number or two of being exact.
I have gone back to this chart many times, looking for that exact fi t.
One day I took another approach and found what appears to be an exact fi t. At least there were enough of “coincidences of numbers” to make me think I had an exact fi t.
So take a look at the following work-out and see what you think.
Let’s put down the three important numbers on the chart.
436-the high in January, 1948
44-the low in December 1932267-the number of weeks from Janu-
ary, 1948.In my Book I, I told why the number
of weeks might be 266, but since Gann had 267, let’s assume that it was not arbitrary. Let’s assume he had a reason for fi guring from that particular date. In other words, he didn’t just one day sit down and make a commentary on this period. He picked 267 weeks from the top for some reason.
He said that the square of 144 could be used for any squares we would like to make.
But I put that square aside and decided to pick another. I picked the square of 49 or 7x7.
Why? Because the chart we are deal-ing with is a weekly chart. If we lay down a square of 49, then it comes out on 49 weeks or 343 (49x7) days. And that would be a cube or 7x7x7.
You do not need to make up a square of 49 to look for the coincidences. You don’t need a computer. A hand-held cal-culator would be helpful, but you can do it with a piece of paper and a pencil.
We don’t even have to have the chart. We can just picture it in our mind. At the top we have 436 and down under it we
have 44 and on out to the right we can mark our 267 weeks. Now let’s use the square of 49 in the same way Gann told us to use the square of 144.
He subtracted the square of 144 from the top. So let’s subtract 49’s from the top, one at a time slowly and see if we can see any “coincidence of numbers.”
436-49=387, nothing there.387-49=338, nothing there.338-49=289, that’s the square of 17,
but doesn’t seem to mean much here.289-49=240, yes, something here. Do
you recognize it. Yes, it is2/3 of a circle but it is also something
else. It is the halfway point between the high of 436 and the low of 44 since 436+44/2=240.
240-49=191, nothing there.191-49=142, nothing there.142-49=93, nothing there93-49=44, certainly something here.
We have subtracted 49 several times from the high of 436 and the result is the low.
So let’s put down the coincidences we have found so far:
(1) 240-the halfway point.(2) the low of 44, by continually sub-
tracting 49 from 436.Gann put the square of 144 at the
time of the 436 high and worked over, but I saw nothing there.
Instead of doing that, I went over to 267 weeks and started subtracting the square of 49 from that. So let’s see if we can fi nd some other coincidence of num-bers.
267-49=218. Yes right off we have found the halfway point of
436218-49=169, another square, not
much here apparently, but...169-49=120, one-third of a circle, but
not much else.120-49=71, nothing here.71-49=22, one half of the low of 44.
So let’s add those coincidences to the ones we already have:
(1)-240, the half-way point between 44 and 436
(2)-the low of 44, by subtracting 49’s
(3)-218, the half-way point of 436(4)-22, the half-way point of 44
Just those coincidences alone look pretty good. But I kept looking for any others I might fi nd using the square of 49.
In his work Gann told about subtract-ing 360 from 436 and getting 76. We could subtract 76 from 436 and get 360. I decided to “add” 76 to 436 and I got 512! 512? Look familiar?
Divide it by 8 and you get 64. Got it now? 512 is the cube of 8 or 8x8x8.
Well, that’s very interesting you say but what does that have to do with the
For more information circle No. 33
The Patterns of Gann
This is a new book by Granville Cooley who has been researching W.D. Gann’s work since 1983. Cooley has found patterns (cycles) using numbers. His approach to understanding of cycles will enlighten any student of Gann. If you are serious about the study of Gann and the study of cycles and patterns, this book is a necessity. 611 pages (8 1/2” x 11”) perfect bound book. 30 day. money back guarantee.
� I have enclosed $159.00 to cover the cost. Add $4.95 shipping in the U.S. $7.00 shipping to Canada and $18.00 shipping to the rest of the world. 30 day money back guarantee.
�Check Enclosed � MC � VISA � AMAX
Name__________________________________________________________
Company_______________________________________________________
City_________________________________________State____Zip________
Phone__________________________________________________________
E-Mail__________________________________________________________ TradersWorld, 2508 W. Grayrock, Springfi eld, Mo 65810, 800-288-4266
A Coincidence of Numbers
by Granville Cooley
tradersworld.com • Spring 2001 45
work at hand.When we laid down the square of 49
on the weekly chart we were also count-ing the cube of 7 since a week has 7 days. The cube of 7 is 7x7x7 or 343.
If you draw a 45 degree line down from 436 it will cross the week of 267 at 169. Or to put it another way 436-267 is 169. This coming out on a square (13x13) always intrigued me.
Remember in Gann’s discussion of the hexagon chart he mentioned that 169 was important for more reasons than one? I always wondered about that as maybe you have to.
But somewhere along the way I found out one of the reasons.
Let’s now subtract the cube of 7 from the cube of 8.
512-343=169!That’s right. The difference in the
cube of 7 and the cube of 8 is the same as 436-267.
So there is another coincidence to add to our list.
(1)-240, the half-way point between 44 and 436
(2)-the low of 44, by subtracting 49’s
(3)-218, the half-way point of 436(4)-22, the half-way point of 44(5)-The 45 degree angle from 436
crosses the week of 267 at 169 which is also the difference in the cube of 7 and the cube of 8.
But I wasn’t done looking yet. You know me. Always adding, subtracting numbers, etc.
I decided to “add” 267 to 436 and I got 703. To you that might not mean too much but it stuck out like a sore thumb to me. 703 is the triangle of 37. Look it up and see where it falls on the Square of Nine chart. It is also a Teleois angle (the book on that is in the works).
Now subtract 343 (the cube of 7) from 703 and you get 360!
So let’s add those coincidences to our list.
(1)-240, the half-way point between 44 and 436
(2)-the low of 44, by subtracting 49’s
(3)-218, the half-way point of 436(4)-22, the half-way point of 44(5)-The 45 degree angle from 436
crosses the week of 267 at 169which is also the difference in the
cube of 7 and the cube of 8.(6)-Adding 267 to 436 is 703, the tri-
angle of 37.(7)-Subtracting 343 from 703 is 360.And now for some more.When I added 76 to 436 and got 512,
the cube of 8, I found that 436 was the “arithmetic mean” between 360 and the cube of 8 since 360 plus 76 is 436. (The arithmetic and geometric means were discussed in Book IV-”On the Square.”)
The difference in 343, the cube of 7,
and 267 is 76.The number of weeks from the high
of 436 to the low of 202 was 56 weeks. And for those of you who read Book IV you will recognize that as the geometric mean between the square of 7 and the square of 8 since 7x8 is 56.
In my book “On the Square” I showed where some prices were the differences in squares. We can see that the difference in 436 and 44 is a difference in several squares of 7. The difference is also equal to two squares, two squares of 14 since 14x14 is 196 and two times 196 is 392 and 436-44 is 392.
Now let’s add those coincidences to our list.
(1)-240, the half-way point between 44 and 436
(2)-the low of 44, by subtracting 49’s
(3)-218, the half-way point of 436(4)-22, the half-way point of 44(5)-The 45 degree angle from 436
crosses the week of 267 at 169 which is also the difference in the cube of 7 and the cube of 8.
(6)-Adding 267 to 436 is 703, the tri-angle of 37.
(7)-Subtracting 343 from 703 is 360.(8)-436 is the arithmetic mean
between 360 and the cube of 8.
(9)-76 is the difference in the cube of 7 and 267.
(10) From the high in January, 1948 to the low in February of 1949 is 56 weeks and 56 is the geometric mean between the square of 7 and the square of 8.
(11)436-44 is 392 which equals the sum of two squares of 14.
There are 11 coincidences in num-bers we found with our original three numbers. What does it mean and how can they be used? Frankly I don’t know. But it sure cries for more study!
OK, want some more!The difference in the cube of 7 (343)
and the cube of 5 (125) is 218! The half-way point from 436.
In other words if we had an overlay with the cubes marked on it, when we put the cube of 7 (343) on 436, the cube of 5 (125) would fall on 218.
Where would the end of our overlay fall? Since 436 minus 343 is 93, the end of the overlay would fall on 93.
Is the number 93 signifi cant? Why don’t you subtract 44 from it.
You get 49!
Granville Cooley is author of the new book “The Patterns of Gann” available from TradersWorld. 800-288-4266
Your Image is EverythingAdvertisers, brokers, accountants, insurance agents, software program writers, fi nancial services companies, fi nancial book writers, etc. Traders World can help you with your public image. We offer a number of services to do this.
Advertising Ad Design and PlacementWe can fully design your ads with or without color and have in placed in the media of your choice with excellent placement.
Internet Site Design If you need help getting a professional internet site setup with or without ecommerce, we have a complete solution.
Perfect Binding SystemWhether you’re creating a fi nancial statement, report, or proposal, or even a book we can enhance it with the Bind-it Desktop Perfect Binding System. Choose the color and stock of your cover from our endless selection. And whether you prefer offset printing, foil stamping, or embossing, you can add a professional fi nishing touch by having your name or log imprinted on every binder. Bind a few pages or 450 without the fuss of hole punching and threading of clamps or rings. The binding system uses a patented adhesive technology that assures you that every page of your document will adhere without the loss of margin space, and the smooth edge fi nish allows for easy handling and fi ling. Bind up to 15 statements in only 30 sections. This binding system is ideal for: fi nancial statements, audit reports, client proposals, tax returns, and even books.
Envelopes and LettersWe can design a professional image logo for you on envelope and letter stock and statements and have it printed for you on high quality paper.
For more information call us at 800-288-4266 or go to our site at:
www.tradersworld.com/advertisingFor more information circle No. 34
46 Spring 2001 • tradersworld.com
Hidden Knowledge, Technical Analysis and The Holy Grail- Part 2 By Dan Dodd
If you stay in the commodities trad-ing business for even a short time, the idea of the ‘Holy Grail’ of trad-ing systems or indicators is sure to come up. You will hear it all the
time. I have always understood refer-ences to ‘The Holy Grail of Trading’ to mean some system or method or indica-tor that is perfect- a perfect winner- a perfect fi t for all traders that if applied consistently will give anyone the ability to always be in the right market at the right time in the right direction, and out in the same light. - ‘Tomorrow’s Wall Street Journal today’. More often than not, the term ‘Holy Grail’ is used to describe what a system is not, how it falls short of the ideal. In some senses, depending on the trader, the term implies something magical in our understanding of trading the commodities markets, like a genie’s lamp or a golden goose. In another sense, the ‘Holy Grail of Trad-ing’ implies the search for such a magi-cal understanding, the end of which is a miraculous key to trading which will make the holder of the key rich beyond imagination.
Whether such a magical or in another sense practical trading ‘key’ exists is at this point immaterial; we will get to the sub-stance later. What is most important is how the references to the Holy Grail characterize us, and just what it is that we are trying to do in our trading.
As I have outlined before, our ideas of hidden knowledge about the markets always fall into two camps- those who believe that there is more, and those who believe that all is seen now, or at least, that we already see what can be seen. Regardless of the point of view you hold, the idea of the ‘Holy Grail of Trading’ is enticing. In the very same way that Glinda the Good Witch told Dorothy- ‘You have ALWAYS had the power to go home,’ and pointed to the Ruby Slippers with her star wand, we ALL wonder about click-ing our heels together exactly three times and saying ‘I am long and tomorrow Soy-beans are limit up, Soybeans are limit up, Soybeans are limit up.’
Just what is this? A veteran trader with many years of experience might put on a trade and be elated and confi dent because she has seen the same set-up 1000 times before. (62% of these are winners. You have always had the power to go home.) A novice trader might put on a trade from a 1,2,3 bottom and be elated and confi dent. (My trading guru said that a lot of these make people rich.
You have always had the power to go home.) Within each of us, no matter what our back-ground, system or bearing, there is an ele-ment beyond us, the Unknown, a white gap of space into which we trade. We trade into that space with our experience or the lack of it, with or without a plan, with hope, with con-viction, or with fear. Very often, we click and click and click our heels, and we are still in OZ, and for us, at that time, there is no Magic Key. We wonder if we ever had the power at all.
Trading into the white space is an adven-ture into the Unknown. We prepare. We do our analysis, we watch, we act. Beyond that, we place our intentions and our actions into the Unknown. A trader may be well pre-pared and experienced or not. She may have the fi nest technical tools and a beautiful trad-ing mind, and a huge account, but she will ALWAYS venture into the Unknown with each trade. It’s unavoidable. Even the great-est technical traders venture into the markets right along side the rawest novice with one common binding cord- No one is ever certain how this one will turn out.
To that degree, and in that way, as trad-ers of any kind we are bound by the way the world is put together and we all start out in the same lifeboat. How we proceed into the Unknown will differ for each of us, but the problem is universal and our trading problem runs exactly parallel to the biggest human problems of existence, whether we like it or not. In other words, we all LIVE into the white space just as we TRADE into the white space. We never really know how this one is going to turn out. The idea of the ‘Holy Grail’ of anything is a natural and unavoid-able part of anything we do. To grow and evolve- to get better at trading, and especially to remain successful, we must always pro-ceed into the white space and in doing so, we cannot avoid our own innate intention to discover the world’s secrets. So let’s pro-ceed….
For the Greeks and the Egyptians in the really old days, living into the white space was an ordered thing of which virtually every-one was required to be conscious. Organized religion of the time occupied center stage, its long fi ngers reaching into the darkest crev-ices of each individual life. For the sake of moving along, let’s just say that in these countries at that time, coming to terms with the Unknown was an expected part of living. Organized religion was the vehicle for this coming to terms and it was always divided into two parts. One part was dogmatic and ceremonial, and the other was mystical and
esoteric. The fi rst consisted of the popular cults while the other was the religion of Mys-teries. The religion of the Mysteries went far beyond the cults and attempted to explain the symbolic meaning of the cult myths and practices. The Mysteries were secret soci-eties, devoted to fi nding and passing down hidden knowledge, and it was only through diffi cult initiation that a person could become a part of it.
Each year, at various exact times of the year, these societies produced passion plays, acting out the condition of people in the world and their relationship to their gods in the context of hidden knowledge which only the chosen few could know. These plays were the only public part of the Mys-teries. Everything else, including the schools in which the hidden knowledge was taught, was kept secret. Beyond that, not much is known.
I loved being a Steam Locomotive Engi-neer on the Cog Railway. This particular roadside attraction seemed to me to exist beyond the ordinary and within the heart of it, I found a huge white space into which I was pushed while I wasn’t looking. In the 70’s, the Mt. Washington Railway Company was comprised of a plot of land six miles up a steep winding base road, 8 miles from the nearest cross road and country store. There was a big log cabin Base Station with a kitchen, a snack bar, a stuffed bear, and benches to sit on in front of a huge stone fi re place. Black coal dust and cinders were everywhere. There were a couple miles of track which ran right to the summit, an Engine Shop, a Coach Shop, 3 wooden water towers, 7 locomotives and 7 coaches, a row of cheesy cabins and the Boardinghouse, a 2 storey wood fi re trap boarding house where 10 or 12 of us had a room. Room and board was $ 21 a week. When I made Engineer, I got a raise to $ 3.00 an hour, no overtime.
Mt. Washington is famous for some of the very worst weather in the world next to Antarctica, and the trails leading to the summit are lined with crosses. At 6288 ft., Mt. Washington is a hill by western stan-dards, but beautiful and treacherous and cun-ning and wild nonetheless. When we workers arrived in the Spring, we literally left our reg-ular lives behind, and to me, we stepped into the Mysteries.
Because of our physical separation from the rest of civilization, and the dated state of our existence the place took on a feeling and a presence all its own. Almost nothing had changed since WWI. It was part Wild West, part Lord of the Flies Revisited, part Itinerate Carnival, part hat trick in a medicine show. Every part of it was hard and bawdy. We were connected by the only task we had, to make our iron machines conquer the moun-tain 3 or 4 times a day and to bring all the tourists, whom we called ‘goofers’ back in one piece. Beyond that and within that there was no structure to speak of. We made our own rules and we fought for our place in the kingdom. We bargained with and fought nature and each other, like a pack of black

tradersworld.com • Spring 2001 47
sled dogs. It was a phantasmal place, a brutal place, anarchy reigned much of the time, anchored and propelled by the naked forces of weather and will, of gravity and inertia, of the four elemental powers: Fire, Air, Water and Earth. I loved it.
Watching the tape, staying up at night drawing lines on charts, calculating my trad-ing plan, executing my trades, it is a daily passion play, my part in the Mysteries which I was given on the mountain, not on the fl oor. To a mind and spirit tempered and expanded in the elements, there is no question about Hidden Knowledge in the markets, because that is the way the world works. As the ancient Greeks played out their Mysteries each spring, so the markets play out to us. The markets are a huge passion pageant- far bigger, far more brash than Mt. Washington- in the bars lie the secrets we long to learn.
Of all the secret societies devoted to the preservation of Hidden Knowledge, the alchemists were the most secret of all, and it is probable that the legend of the Holy Grail was a knock-off of the alchemist’s Philoso-pher’s Stone. As you may know, Alchemists were devoted to trying to fi nd a way to turn lead into gold. At the time, compliments of the Greeks, it was believed that there were only four elements, fi re, air, water and earth, and that manipulation of these elements pro-duced all things in the world. Alchemists all had a special container and a special set of experiments devoted exclusively to attempt-ing to capture the spirit of the Universe- the essential magical glue that held every-thing together in a magic substance which would have great magical powers and this special substance was called the Philosopher’s Stone. For many Alchemists, the Philoso-pher’s Stone Project was far more important than the Gold Project. We got Chemistry from the Alchemists, who believed, in the words of Graeham Stein ‘that there was no borderline between magic and science’.
A perfect metal, a perfect substance, a perfect way to trade, no borderline between magic and science, a world in which there is much that exists that we don’t directly know about or perceive.
The Holy Grail was said to appear and disappear because its appearance was con-ditional and magical. King Arthur’s three chaste knights only glimpsed it and were never able to bring it back to Camelot, but they did see it after they had searched.
The Alchemists may not have found the Philosopher’s Stone (or maybe one of them did, who knows, they were so secretive) but they gave us Chemistry, they expanded Phi-losophy and they led us to elemental forms of new philosophy, medicine, religion, logic, science and mathematics. They went on the journey, and more was revealed to them and the human position with the Unknown was advanced a few notches.
At 5:00 a.m. on a four trip day in the dog days of the August tourist season, you stum-ble up to the parked engines in the fi rst black and white of dawn. You went to bed dirty
last night. No hot water left, and you were so exhausted that you crashed on the fl oor by your bed so as not to get grease on the sheets. In the engine cab you rake over the banked fi re, check the water cocks, and look for the orange glow of the resting coals. Here is your Alchemist’s laboratory. This is your work. You will begin now to create the second greatest force the world knows, and you need to create perfect harmony between all four elements in order to get it. FIRE- in the box. EARTH- is the coal. WATER in the boiler. AIR in the fl ues. You bring the fi re up slowly. You need a little steam to create a little draft. Water in the boiler is only warm, but there is enough. Clean out the grates with your fi ve foot rake. Close down the side stack. The brass water injectors don’t work until there is steam. Rake and rake. Add a little coal to the front. Close the fi rebox door. The kettle is on to boil. Over the next two hours, you tend the fi re, bringing the kettle to boil. The red coals turn orange as the steam appears and you have forced draft. Steam gage says 10 pounds. You need 70 pounds to move the locomotive forward on the fl at. By 7:55 a.m. you will need 139 pounds, no more, to move the engine fast and clean up the fi rst leg of your fi rst trip, to the water tank at Waumbec.
A mountain-climbing steam locomotive harnesses elements to overcome monumen-tal forces. Each mile and a half trip up the side of the mountain is a contest against gravity, a leveling of human will against the world’s phantasmal desire to tear our efforts to pieces. We give power to fi re with air as we burn the earth and superheat water to steam. We feed that stupendous power to a machine that has potential to bring us up. Nothing is automatic. A certain amount of water, a certain amount of draft- coal spread in a certain way, a certain color to the fi re. We adjust, adjust, and adjust these four things, and as we pitch up on the grades and down on the fl ats, the elements and their propor-tions change and we adjust again. On the 8:00 a.m. trip I will shovel 2200 pounds of coal uphill into the fi rebox . The Boiler will suck 1600 gallons of water out of the tender and turn it into the second most explosive power the world has ever known. Open the main steam valve and we instantly lurch for-ward, and begin to climb. A good Fireman will spend the next hour in intense physical and mental work. Shovel, door, spread, door, watch the burn out the stack, do it all again, hook, shovel, stack, do it again. You cannot break the rhythm or you won’t make it. The noise is deafening. Engineer and Fireman communicate with hand signals. The fi rebox door is open only long enough to dispense a shovel-full of coal- Don’t mess up the draft. We wear gauntleted leather gloves against the white hot howling fi re wind in the box. There is enough power around us to blow us off the mountain. As we pitch down to a fl at from the grade, the water in the boiler gushes forward. If the level is too low, the fi restorm heats the boiler plate almost white hot- tip up to the next grade, the water sloshes back
Joe RondinoneDeveloper of
Angle Symmetrics
Change of address
NoticePrevious Address:
Plano, Texas
New Address:204 Palmer Rd
Madison AL 35758
New Phone:256-464-0833
Write or call for your
FREEFibonacci
8 x 11” Ratio Card
For more information circle No. 35
For more information circle No. 36
48 Spring 2001 • tradersworld.com
over the plate and expands to two hundred times its volume at the speed of light with an explosive power second only to nuclear- Make this mistake, and suddenly, no more train. (Pieces of plate steel from low water explosions on the main steam railroad lines were often found 7 miles from the accidents.) Black-billowing coal smoke shoots straight up into the blue sky and disperses into a grey-black fi lm hundreds of feet above us- and we are on our way up again.
Each locomotive had its own capabili-ties. My regular engine, #4, was capable and dependable, but slow as a snail. A week after I started regular trips on the #4, I had maxed out its production- we tweaked everything- until it could not give us any more speed. We hit the top end and it was still slow. Being a Junior Engineer, I was relegated to the slow, safe engine, while the old timers rode the thoroughbreds, and I wanted nothing more than every single opportunity to push the limits in the #6 and the #10. Even then, I knew that the power of steam that we gen-erated was theoretically unlimited in itself, but defi nitely limited by the machine in our ability to harness it. Running the 4 was like riding a pony in the Kentucky Derby. We got to the fi nish, but there was no contest. By then I had this idea of the power under me running through my veins. Not much else mattered but pushing into the white space with a thoroughbred locomotive. The thing that thrilled me most was that the 6 and the 10 were fi nicky and high strung. They required skill to run at all, let alone to the limit.
There is no second dimension in a com-modity price chart now. What we see is one dimension and time, but that does not mean that it does not exist. I can assure you that a second dimension, at least, does exist, but I did not know that until I went on the search. Through all time, the secrets of the Uni-verse have existed as they do today and though most of us discount the existence of magic, in commodities or anything else, there remains a constant evolution of percep-tion which must occur as we venture into the white space. There is evidence that a hand-ful of monks in the Middle Ages knew how to make electricity, but they kept it a secret because the Church would have considered it sorcery. It wasn’t until much later, under the acceptance of scientifi c inquiry and dis-covery that electricity has become as normal a part of our lives as breathing. The same is true of all our advances into the white space of nature’s secrets. As we discover new parts to the puzzle, this grand mosaic that is our world, what was once fantastic and magical when it was unknown, becomes a part of our stable rock of understanding as it becomes known and we work it into our lives. It is fair to say that much must exist out of our ability to sense with our fi ve senses, and in time, we will need to develop new methods and perception equipment to delve past our normal three dimensions and time.
For modern people, this is where the
magic begins and in our attempt to get our arms around certainty in trading the com-modities markets, we are a long, long way from even needing to explore the magical. We have just barely made it to dimension 2 and most of us, even the best of us, are still perpetually stuck in one dimension plus time, and in a world dominated by the Atom and Relativity, we traders still cling feebly to Newton’s Laws of Mechanics, as if these were the only concepts we could possibly perceive, and we never know how this one is going to turn out.
To me, the world of technical analysis is just as locked in time as were the Mt. Wash-ington locomotives and the people who ran them. In a way, the steam we created, the limits we pushed were sweet alchemy. We took what the Known presented to us, and then pressed it into the Unknown, and we were rewarded with its secrets, which in turn yielded more secrets, none of them magic, but all were fantastical, and all propelled us toward our individual goals.
We modern technicians have a unique opportunity in this modern world because although we press into the white space each trade, we have failed miserably in demand-ing nature’s secrets. My insane, brilliant boss at the Cog would have called us all ‘living dead men (women)’ and ‘drone bees’. We are fully capable of perceiving and under-standing what already exists and we don’t do it and that is the greatest commodity trading loss there is. There is money lying on the table here, and let me be the fi rst to tell you. Despite its current computer glitz, Technical Analysis in the commodity and stock mar-kets is stuck in the Middle Ages, where the Holy Grail is electricity and there is no dif-ference between science and magic…
If you are willing to enter the Commod-ity Mysteries now, here is a formula for you. It is not rocket science. As I said, we are starting with a snail’s view of the markets.
It is a hard road, if you want to discover it for yourself, but it is a good road, and there is no question in my mind that you will be better for it. Before you lie the series of keys to predictability in the markets, but you must fi nd each one. They are there for everyone to see, but they are hidden now because you have not been paying attention. You must balance and correct the four elements as you move along in your journey up the hill but you can do it. I know you can.
Begin with work that was done just prior to and just after the turn of the century. That is where the explosion of knowledge into the new age began, and that is where technical analysis of the fi nancial markets stopped dis-covering and became redundant. There is a lot of it. You just have to fi nd it. Pay attention to forces. Pay attention to natural laws that you have never heard of. Pay attention to the numbers 2,3,5,6 and 7. Stay away from cryptic discussions on commod-ities and stocks by the supposed Masters. They will only confuse you and if these guys revealed any secrets, there wouldn’t be so
much confusion over just what they said. Study your charts every day, and try to relate what you have learned in your studies. Give yourself at least two years of experimen-tation. And Nature will reveal herself to you. You have every capacity you need to understand and trade the markets better than anyone, and all you need is already available to you.
Have you ever wondered how rich and powerful you could make yourself if you were transported back in time from now to 1900 and you brought a refrigerator with you? That is literally where we are in tech-nical analysis, but you must jump now. It won’t last long. There are experienced com-modity traders and vendors out there right now, who can steer you into a lot that is good in trading the markets and you should under-stand them and their axioms as well. A Nick Van Nice will take you a long way into what we already know, and that is an important part of your education. But you must go fur-ther, and in that sense, the Holy Grail is a journey, not an end.
On a deep, clear August evening in 1977, I got my chance. The Engineer of the #10 wanted to go dancing, and I was the only qualifi ed Engineer available to make the 6:00 p.m. trip. I raced to the boarding house and grabbed L.A., my Fireman, out of the shower. Weeks before, we had worked out a ‘run the 10 to the limit plan’ over whiskey on a dark night. ‘We’re in. We’re in’ , I shouted. We screamed up to the base and put the plan into action. We took the 10, wished Buddy a real good time dancing, and quickly dropped the engine back to the coal bunker. We both shoveled all the coal from the tender out onto the ground, while U.S.N., the brake-man (named for his tattoo) loaded our hand-picked load of premium coal back into the tender with the front loader. This stuff was Vanilla Ice. Took me two days to separate it out of the piles. We moved the 10 back up to the platform, and watered up. We skipped dinner inside and ate salami sandwich track lunches toasted on a shovel in the fi rebox. L.A. and I both worked on the fi re, pulling the last molten clinkers out of the grates, and leveling it out to a perfect, fl at air-infi ltrated fi re. I fi red up the injectors and fi lled the boiler to exactly two gauges. We opened the draft, and built the steam to 139#. The fi re was so hot before we started off, that we had to keep opening the fi rebox door to keep it from popping off. The instant the last passenger boarded, I blew the whistle and opened the forward steam valve all the way. The 10 rocketed out up the fi rst grade. I have NEVER experienced such instant power! I sat L.A. in my seat and took over the fi re. He knew exactly what to do. I would fi re, and also run the locomotive. His job was to watch the water and hit the injectors at the last possible moment. Our objective was to run the fastest trip ever made up Mt. Wash-ington and the only way to do it was to keep a perfect fi re and run the water in the boiler to the lowest possible level while running the forward throttle all the way open. Run-

tradersworld.com • Spring 2001 49
ning with these two things in mind, I set and reset the side stack, which helped control the draft every few moments. I can remem-ber that trip as if it were happening now. I have never been so fully focused and intense since.
We reached the water tank at Waumbec in under 8 minutes, a stretch that normally takes 15. We had calculated that we could hook to the water tank and take on water for 4 minutes and have just enough to make it to the top. L.A. took on the water, and I fi xed the fi re. It was like Indy. I blew the whistle and we were catapulted up the main grade, right on time. The 10 ran like a Ferrari- We Screamed up the mountain, running low water, the hottest fi re I have ever seen. When we had almost reached the top of the last big grade, L.A. started to signal me about the water- He was frantic. We absolutely HAD to have 3 gages of water there, and the water cock was spitting air- but man, we were almost there- riding this jetliner of a loco-motive. I leaped at the injector, which failed and failed again. I hit the other injector and it caught, and started feeding water in. Our steam started to drop almost immediately, so I set to building the fi re. My hands were on automatic. I hooked and shoveled with Barishnakov grace, outside of myself. The steam held, but we were dangerously low on water. I backed off on the throttle a little, and hit the other injector. L.A. was signal-ing ‘Drop the Fire. Drop the Fire!’ No Way. I whacked the injector with a pipe wrench, and it caught. I turned both injectors on full. We were almost to the fl at. Steam at 136#. 100’ to go. We had to have 3 gages. Just as the steam dropped to 125#s and we were about to pitch onto the fl at, the water cock spit a tiny bit of water. That was close, but we made it. I jammed off one injector, and returned to the fi re. Even though we were on the fl at, I built it up white as if I were Vul-can’s apprentice. We fl ew onto the summit, with a new record. We had chopped 36 min-utes off the fastest time ever. Yeah, we won. Not bad for the under 20 crowd. Talk about laughing like idiots.
When we got back to the base, a kanga-roo court had already been convened. I was convicted of sorcery, but it didn’t stick.
Begin now to push the Hidden Knowl-edge of the commodities markets. You do not need magic and if the legend of the Holy Grail is of use to you, make it the name of your search. We have a whole century to make up for.
Dann Dodd, CTA, is the principal of Good Trader He has developed The Greyseal Trad-ing Tool, a new technical indicator for com-modities and stocks which adds a second dimension to price charts in a simple way, and uses the ancient Law of Three Forces to accurately trade short term swings. Dann is also the author of The Small Commodity Trader’s Handbook, which is designed to cut years off the small trader’s learning curve. His website is: www.commoditysystems.com
For more information circle No. 38
Elliott Wave Masters
Finally learn Elliott Wave, both the classical and the modern version. Get this complete 200 page lesson course of Elliott Wave Masters plus a demo CD of the ELWAVE software program. Taking this course you will begin to understand how the Elliott Wave Theory, Fractals, and Fibo-ancci numbers and counts work in the trading markets. You then should be able to integrate the Elliott Theory into your trading methodology. You can also join the Elliott Wave Masters Secret Website (password pro-tected). You will be able to ask questions and have them answered and see questions and answers by other students. $79.95 plus $4.95 U.S. (S&H). There is a 30 day money-back guarantee. To order call Traders World at 800-288-4266 or go to www.tradersworld.com.
Gann’s Master Charts Unveiled
Get this complete 100 page book explaining how to use Gann’s Master Square of Nine Chart, The Gann Hexagon Chart and the Gann Circle Chart. It includes a fantastic CD which contains the electronic version of these charts in template form - requires Microsoft Excel. This book will help supplement your other technical analysis techniques that you trade with. You can also go to the Gann Master Charts Unveiled Internet Site to ask questions and see the questions and answers of other pur-chases of this book. $49.95 plus $4.95 for U.S. shipping. 30 day money back guarantee. To order call Traders World at 800-288-4266 or go to www.tradersworld.com.
For more information circle No. 37
50 Spring 2001 • tradersworld.com
Save Money, Order these books now...call: 800-272-2855 ext. B540 or go to: www.tradersworld.com
TRADING BOOKS
7 Chart Patterns that Consistently Make Money by Ed Downs Item #B540-11559 $19.95 now $15Discover 7 chart patterns that are key pre-
dictors of direction in any market. Plus - simple, sure-fi re steps for 1) Determining market direction 2) Recog-nizing winning chart patterns 3) Mastering money man-agement techniques: setting Profi t Targets, Stop Loss levels and Risk/Reward
ratios for every trade. 4) Making Support & Resistance, Trendlines, Gaps, Fibonacci Retracements - and other amazing technical analysis tools easy to implement. Whether you’re an active trader or occasional investor, “If you confi rm your entries with these simple patterns, you’ll be light years ahead of the average investor.”
How I Trade Optionsby Jon Najarian
Item #B540-11651 $29.95 now $22.50Finally - top Market Maker Jon Najarian reveals his pri-vate methods for trading to win. You’ll fi nd - Amazing Options trading techniques- Proven methods for han-dling volatility - Tips for trading like a pro by exercising strict discipline- Beating risk - and reaping
big rewards- Easy explanations of puts, calls, spreads - and more.
The After Hours Trader Michael Sincere & Deron Wagner Item #B540-11570 $29.95 now $23
Learn to succeed in today’s newest market - After Hours Trading - with the fi rst-ever book on the topic. Covers - The advantages & pitfalls of trading after hours- Techniques to profi t from after-hours news- The best ECN, how to side-
step costly mistakes - and other techniques to benefi t from this exciting new trading opportu-nity.
Trend Forecasting with Technical Analysis: Unleashing the Hidden Power of Intermar-ket Analysis to Beat the Marketby Lou Mendelsohn Item #B540-11836 $19.95
Market methods from the last century won’t work in this one - and Lou Mendelsohn’s breakthrough book takes technical anal-ysis to a new level. He presents a powerful new framework for accurately forecasting trends by com-bining technical and inter-
market fundamental data. You’ll discover 1) Precise trading strategies that work for day & position traders 2) The limitations of traditional technical analysis methods 3) How to accu-rately forecast moving averages using Inter-market analysis and neural networks. It’s time for a fresh approach to technical analysis. Now, get the latest market timing and trend forecast-ing methods you need to profi t consistently in the equity, options and futures markets.
NASDAQ Level II Trading Strategies 90 min. videoWith Mike McMahon
Item #B540-11815 $99Trade like the real pros - using Nasdaq Level II quotes! Learn to maxi-mize each trade by read-ing a Level II quote, selecting the right routing system, and spotting hot trading opportunities by watching the actions of the market makers.
J.K. Lassar’s PICK WINNING STOCKS by Edward F. Mrkvicka Jr.
Item #B540-11821 $16.95 now $12.95Trade safe, trade smart, and trade to win in ALL markets with this brand new guide for picking winner after winner using the proven “Trinity Trading System.” Learn basic to complex methods includ-ing ...spotting stock splits beforehand ...when to unemotionally place or
cancel an order...invest online or with a broker ...and much more.
High Impact Options Trading: 90 min. videoOption Profi ts through Superior Stock Selection With Price Headley
Item #B540-11837 $64.95 When it comes to powerhouse options strat-egies, Price Headley of BigTrends.com is an indus-try leader, and his new workshop provides a hands-on overview of the top options strategies. Traders will learn to 1) Target the best stocks - and leverage them with
options 2) Spot trends - before the “crowd” does 3) Use a powerful indicator - Accelera-tion Bands - to fi nd upcoming buying surges and pinpoint trend changes. And discover the awesome power of market timing indicators like the put/call ratio. Great for improving mar-keting timing & general trading skills.
The Ultimate Trading GuideJohn Hill, George Pruitt & Lundy Hill
Item #B540-11452 $69.95 Develop original trading systems that really work with this complete new tutorial. You can create a system to meet your own needs & for accounts of all sizes - from $10,000 to $1 million - plus all the tools and background for getting computerized sys-tems going.
How I Trade for a Living by Gary Smith Item #B540-10700 $29.95 now $23.95
Quickly becoming the new “bible” of the trading industry - it’s the fi rst new work to show a new gen-eration not only key trad-ing strategies - but what it takes to successfully trade from home, and for a living. Now at a great price - from a 15-year vet-eran.
New Thinking in Technical Analysis by Rick Bensignor
Item #B540-11706 $55 now $41.95When pinpointing the best time to buy - or take profi ts - technical analysis is the only true predictor of price behavior. Now - discover the proven methods of the top traders - adapted for today’s markets. Learn how to use each model, when to use it - and when not to.
tradersworld.com • Spring 2001 51
Fast Stocks, Fast Money Investing in New Issues and Small Com-pany Stocksby Robert Natale
Item #B540-11813 $21.95 now $15 Interest in IPOs - also called New Issues - remains red-hot. Now, the country’s leading IPO analyst pro-vides tools and strategies for investing to win - safely - in these popular public offerings.
The Options WorkbookProven Strategies from a Market Wizardby Anthony J. Saliba
Item #B540-11702 $40 now $32Benefi t from the proven techniques of this world-class option trader/trainer - with this comprehensive new guide that covers options from the basics through advanced strate-gies. You’ll discover the best ways to ..1) Incorpo-rate options into a balanced
portfolio 2) Trade online 3) Use the Trade$tar simulator to practice on-target trading strate-gies - just like the pros do - BEFORE trading in the “real world”
The Traders Tax Solutionby Ted Tesser
Item #B540-11074 $59.95 now $49Money saving strategies for active traders and seri-ous investors. Don’t start the new year without this money-saving guide.
High Probability Chart Reading with John Murphy
110 min. video Item #B540-11351 $99
For active traders, new trad-ers and experienced inves-tors alike, Murphy’s new video presentation - with online companion manual - brings together the most important aspects of tech-nical analysis into one pow-erful session - focusing on
the chart patterns he’s found to be the most reliable over time.
Japanese Candlestick Charting Techniquesby Steve Nison
Item #B540-2331 $75 now $59Nison is the world’s fore-most Candlestick authority - and this top selling book allows you to seize every
trading opportunity using the power of candle-sticks - now at the best price anywhere.
The Intelligent Asset Allocator How to Build Your Portfolio to Maximize Returns & Minimize Risk by William Bernstein Item #B540-11574 $29.95
Safe, simple, PROVEN, and time-tested techniques for building your own, balanced and diversifi ed investment portfolio. “This is a GREAT book,” says John Bogle, “Any reader who takes the time and effort to understand his approach will surely be rewarded.”
Dow 40,000 Portfolioby David Elias
Item #B540-11418 $24.95 now $19.95What are tomorrow’s blue chips - and how can you target them today? David Elias identifi es 40 compa-nies that are poised for explosive growth in the new economy. Plus, he pres-ents model portfolios that promise exceptional returns today - and hot strategies for fi nding top sector plays
in today’s volatile marketplace.
J.K. Lasser’s Invest Online, 2nd ed.by Laura Gold & Dan Post
Item #B540-11834 $16.95 now $13.50Do it yourself - and keep more of what you earn - with this updated new manual for investing online. Will help you reach your invest-ing goals easier, faster, smarter - and cheaper than ever before.
Inside IPOs The Secrets to Investing in Today’s Newest Companiesby Richard J. Peterson
Item #B540-11671 $21.95 now $16.95Let an “insider” show you how to tell the winners from the losers in this lucrative market. You’ll discover 1) 4 key areas of “red her-rings’2) Industries to target - or avoid 3)Ways to evaluate management, underwriters & profi t potential 4) How to
navigate the “quiet period” and the “lock up” 5) Mutual funds that provide access to the IPO market - and much more. Order early - and save.
The Investor’s Desk ReferencebyEllie Williams
Item #B540-11579 $29.95It’s a one-stop resource for terms, tools, strategies, styles - and more. This unique reference provides investor’s with 1) A com-plete dictionary of main terms 2) Methods for using the “net” as an investment tool 3) Investment vehi-cles, styles and key indi-
cators 4) International markets & exchanges, names to know in the industry and much more. Don’t invest WITHOUT this at your side.
Understanding Electronic Day Tradingby Carol Troy
Item #B540-10610 $21.95 now $12.95Every investor’s guide to Wall St’s hottest phenom-enon - for savvy traders, curious investors or true rookies.
Long Term Day Traderby Michael Sincere & Deron Wagner
Item #B540-11549 $14.95 now $9.95Find short-term strategies to boost your long-term profi ts with this #1 selling new guide.
Investment Gurusby Peter Tanous
Item #B540-10260 $24.95 now $6.95The hard cover bestseller that shows how top trad-ers and money managers make tough trading deci-sions - and how you can too. A great gift book.
The Way to Trade: Discover Your Success-ful Trading Personalityby John Piper
FT/Prentice Hall Item #B540-11567 $24.99Introducing an amazingly simple method that allows traders to diagnose their individual trading person-ality - isolating strengths & weaknesses - to construct & apply trading systems with confi dence and disci-
pline in the face of crowd instincts. This “Trad-
52 Spring 2001 • tradersworld.com
ing Pyramid” model provides a framework for identifying a trading “personality” that lets YOU succeed in the market YOUR way - NOT with
other people’s models that doom you to failure. Explores it all ... Commitment, discipline, Money management risk control, system parameters, Plus - a 10-step approach to futures and options trading.
How to Trade Futures & Options NEW!by the Center for Futures Education
Item #B540-11816 $137It’s a “How-To” manual from a top source in trading education. Step by step, this 3-ring binder manual provides a “course book” and training guide to learn-ing the futures and options markets from the ground up. You’ll fi nd everything from basic concepts to who trades these markets - and
why. Plus - in-depth training and coverage of 1) Options, calls and puts 2) Futures trading techniques 3) Option Trading Volatility meth-ods 4) Spreads, strangles, trading systems, trading indicators 5) Chart Patterns, Technical trading, fundamental trading, stop and limit orders, money management - and everything in-between. If you’re serious about learning to trade these markets - then start here.
The Undergrounder.com Guide to Electronic Trading NEW! Day Trading Techniques of a Master Guerilla Traderby Jea Yu
Item #B540-11571 $39.95 now $31The mastermind between a popular day trading web site shares hard-core tech-niques he’s proven to be winners. Learn to stand fi rm, trust your instincts and knowledge, and discover effective methods for order routing, discerning market maker activity, making real-
time recommendations and more. Plus a day in the life of a successful electronic trader. See how a “master” does it - and how you can, too.
The Day Traders’ Guide to Technical Analy-sis by Chris Lewis
Item #B540-11572 $49.95Learn to Use Chart Pat-terns, Level II and Time of Sales to Profi t in Elec-tronic Markets. Traders have always turned to tech-nical analysis and charting techniques to profi t in the markets. Now, these time-honored rules can be adapted and applied
directly to today’s fast-action, electronic day trading environment. Walk through a week a “real” trades and learn what wins, what loses - and why. Plus 1) In-depth coverage of Nasdaq Level II screens & time of sales 2) Strategies to get the best price for any trade - buy OR sell 3) Discussion of trading psychology & proven
rules for maintaining discipline - and more. The fi rst of it’s kind - devoted strictly to the short-term markets.
Trade Stocks Online Save $10!by Mark Larson
Item #B540-11154 $29.95 now $19.95Here’s a “Basic training manual for the Online Army!” From getting started to lucrative stock split and option strategies, this guide covers it all. With an emphasis on fundamentals and discipline, you’ll fi nd clear, non-technical expla-nations of how to use 1)
Analyst’s research 2) ratings systems 2) Chart-ing 3) using options in stock trading - and more winning strategies.
Out Perform the Dow Using Options, Futures and Portfolio Strategies to Beat the Marketby Gunter Meissner & Randall Folsom
Item #B540-11524 $39.95 now $31.95Discover options and futures - what they are, how they work, how to trade them. Plus - 45 methods for beating the Dow using them. You’ll learn to: 1) predict the movement of the market using diverse analysis methods 1) How to win off the volatility of the Dow 3) Different analy-
sis approaches including fundamental analy-sis, technical analysis, time series analysis - and a wide range of portfolio strategies to beat the Dow’s overall average. Written for the indi-vidual investor - with advanced techniques for professionals and active traders.
How to Pick Stocks Like Warren Buffett by Timothy Vick
Item #B540-11009 $22.95 now $18 Profi ting from the Bargain Hunting Strategies of the World’s Greatest Investor Revealed 1) the actual tools and techniques that helped Buffett 2) and his legion of followers - amass huge fortunes. Follow his
path to fi nding bargains in all markets. And 3) Strategy-packed “Buffett in Action” boxes 4) Buffett’s only portfolio - continually updated on the author’s website. 4) Step-by-step instruc-tions for using fi nancial tools and information to your ultimate investment success.
Tools & Tactics for the Master Day Trader Lowest Price ANYWHERE!by Oliver Velez
Item #B540-11221 $55 now $39 A no-nonsense, straight-shooting guide from the
founder of Pristine.com, designed for active, self-directed traders. Provides potent trading strategies, technical skills, intuitive insights on discipline, psychology and winning methods for capturing more winning trades, more often. Now - at the lowest price around.
Secrets of the SOES Bandit ½ Price - while supplies lastby Harvey Houtkin & David Waldman
Item #B540-10061 $29.95 now $15Now any trader can profi t from intraday price move-ments on NASDAQ. This #1 bestseller shows how to 1) Use & profi t from - direct access electronic trading 2) Think like the most successful traders 3) Trade to maximum advan-tage - every day, every
trade!
Now - save 50% - while supplies last.Commodity Options 2nd ed.Spectacular Profi ts with Limited Riskby Larry Spears
Item #B540-2909 $29.95 now $9.95A to Z primer gives com-plete descriptions of the 12 most popular commod-ity option strategies. Learn about time value, pre-mium, option pricing and best trading months for each commodity. See how to use options in conjunc-tion with futures for risk
abatement and profi t enhancement. Great for getting started or refi ning techniques.
Stock Traders Almanac - 2001 Buy in Bulk & SAVE!by Yale Hirsch
Item #B540-11861 $34Start the new year by get-ting - or giving - this pop-ular annual planner. For decades it’s been pinpoint-ing seasonal trends and patterns of market fl uctu-ation with dead-on preci-sion. More than a daily planner - it’s packed with tips, quotes, and historical
data that tells you when to buy, when the market is dangerous - and how past market behavior should guide your current market moves.
100 Years of Wall Streetby Charles R. Geisst
Item #B540-10955 $29.95 now $12.95This handsome coffee table book chronicles the amazing achievements in the world of fi nance over the last 100 years. Strik-ing black and white photos cover the changing eco-nomic landscape - from Carnegie & JP Morgan - to Michael Milken. From the

tradersworld.com • Spring 2001 53
_________________________________________________
_________________________________________________
_________________________________________________
_________________________________________________
_________________________________________________
_________________________________________________
_________________________________________________ _________________________________________________
Shipping in (x.xx) beside price _________________________
MD residents add 5% to order ________________________
Total Amount of Order _________________________
Name____________________________________________
Company_________________________________________
Address__________________________________________
City_________________________________State________
Zip ___________ Phone ____________________________
Country__________________________________________
Method of Payment: __ MC __VISA __ AMAX __ Check
Card#__________________________________Exp.______
Shipping: U.S. Orders: 1st book $4.95, each additional $1.95 International Airmail: Canada: $8.00, $4.50, Mexico: $12.00, 4.00 Europe: $19.20, $9.50, Asia $25, $$19.50
Traders Library, 9051-M Red Branch Rd, Columbia, MD 21045
Book Order Form800-272-2855 ext. B540
Fax 800-727-0003
Qty Item# Description Price
bust to the current boom cycle - it’s packed with memorable quotes, anecdotes, little known facts and incredible photos. A great gift for Wall St. buffs - at a great holiday price.
The Fourth Mega-Market, Now through 2011 NEW!by Ralph Acampora & Michael
Item #B540-11860 $24.95 now $19.95 Louis Rukeyser calls Acam-pora “one of the few observers who grasped the strength of a true mega-market.” He predicted Dow 7000, Dow 10,000 - and now this proven leader in the fi nancial world predicts a sustained run through 2011. He explains the cur-
rent bull market--and how to profi t from it--by comparing it to great bull markets of the past.
Trading Simplifi ed NEW!Using High Probability Trading Techniques to Create a Winning SystemWith Stan Kim Item #B540-11835 $64.95
Provides a step-by-step system for targeting big potential, high probability trades.Kim shares his expertise for .. 1) Selecting hot stocks, in the hottest indus-tries 2) Evaluating the market’s daily reaction to news items 3) Determining
where to enter a trade, using technical indica-tors to your trading advantage, when to place stops, how long to hold a position - and more. Plus, assess your own trading temperament to produce a consistently high-returning trading system.
The Precision Profi t Float Indicator NEW! Powerful Techniques to Exploit Price & Volumeby Steve Woods
Item #B540-11529 $69.95 now $59.95 Discover a revolutionary new technical indicator - outlined in easy to follow steps, with real-world examples. Mastering the art “Float Analysis” is a must for cutting-edge trad-ers. See why guru Martin Pring calls it an “innovative indicator ALL SERIOUS
TRADERS will want to familiarize themselves with to help determine the most effective buy and sell points for specifi c trades.”
Swing Trading with Oliver Velez - video90 min. Item #B540-11356 $99 Finally - a video workshop on Swing Trading! Comes with online manual - fea-turing everything you need to master Swing Trading
and take it to new levels of success. See why one trader says he “Bought the tape....made $700 on a short sale right off the bat using the technique. Seriously...a quality Video.”
Profi t from Legal Insider TradingInvest Today in Tomorrow’s Newsby Jonathan Moreland Item #B540-10222 $18.95 now $15
If analyzed and used prop-erly, legal “insider trading” - trading by directors and executives of their own company shares - can gen-erate huge profi ts. The founder of InsiderTrader.com tells readers where to fi nd this crucial info - and how to
use it to maximum trading advantage.
Contrarian Investingby Gallea & Patalong III
Item #B540-8028 $24.95 now $6.95Profi t big by NOT follow-ing the crowd - with con-cepts outlined in this big bestseller. Learn:Why Contrarian methods work; 5 Contrarian rules to live by; When to buy & sell - and more - now at a great price.While supplies last.
The Electronic Day TraderSuccessful Strategies for Online Tradingby Friedfertig & West
Item #B540-8966 $34.95 now $13.98
Go “right on the trading fl oor,” and see the best ways to get instant quotes and execution. Learn a simple, effective approach to understanding market dynamics and get can’t-miss trading tips and tech-niques. Plus, a complete guide to the best online
trading systems. Now - at an amazing price.
The Complete Guide to Day Trading Stocks New Nov. 2000by Jake Bernstein
Item #B540-11575 $39.95 now $31Timing systems, trend fol-lowing systems, breakout systems - and more. They’re ALL covered in Jake Bernstein’s latest work, as he turns his atten-tion to .., 1) Risk manage-ment and diversifi cation 2) Little-known nuances of order placement 3) Day
Trading the technology sector 4) Chart examples base on intra-day timeframes supported by historical back testing. Detailed enough for demanding market veter-ans - yet basic enough for newcomers - now at a great new price.
Strategies For Profi ting With Japanese Candlestick Charts Featuring 300+ pg online manual 6 hour Video Workshop and manual with Steve Nison
Item #B540-11727 $695 now $579What are Japanese Can-dlesticks - and why should traders use them? This brand new video work-shop will help you under-stand and master this powerful tool with high impact results. Steve Nison is the premiere expert on Candlesticks in the world -
and now you can benefi t from his expertise in the comfort of your own home. Filmed at a unique one-day seminar he gave for a select group of traders - you’ll fi nd discover 1) The Most Import Candle Patterns 2) Using the Power of Candles for Online Trading 3) Combining western technical indicators with CandleStick Charts for increased profi ts 4) Reducing risk with Candlestick Charts 5) Swing & Day Trading with Candlestick Charts and so much more. It’s an incredible opportu-nity to have the foremost expert guide you to trading success - now at a great savings.
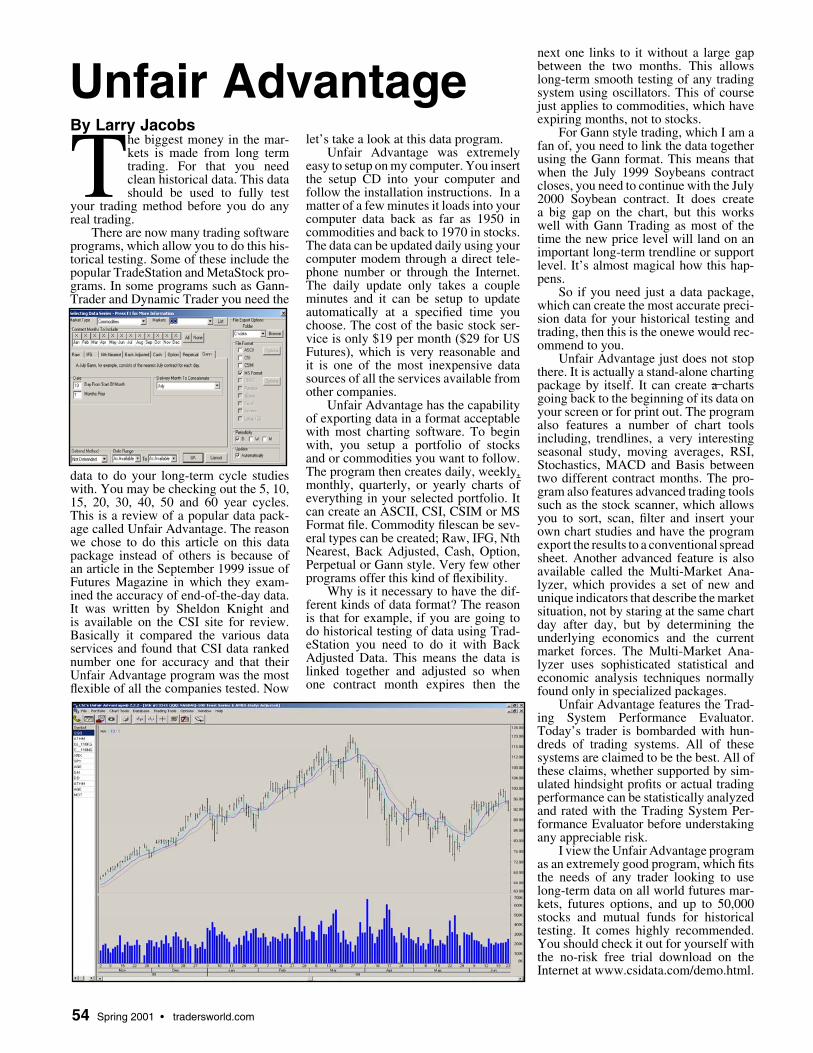
54 Spring 2001 • tradersworld.com
Unfair AdvantageBy Larry Jacobs
The biggest money in the mar-kets is made from long term trading. For that you need clean historical data. This data should be used to fully test
your trading method before you do any real trading.
There are now many trading software programs, which allow you to do this his-torical testing. Some of these include the popular TradeStation and MetaStock pro-grams. In some programs such as Gann-Trader and Dynamic Trader you need the
data to do your long-term cycle studies with. You may be checking out the 5, 10, 15, 20, 30, 40, 50 and 60 year cycles. This is a review of a popular data pack-age called Unfair Advantage. The reason we chose to do this article on this data package instead of others is because of an article in the September 1999 issue of Futures Magazine in which they exam-ined the accuracy of end-of-the-day data. It was written by Sheldon Knight and is available on the CSI site for review. Basically it compared the various data services and found that CSI data ranked number one for accuracy and that their Unfair Advantage program was the most fl exible of all the companies tested. Now
let’s take a look at this data program.Unfair Advantage was extremely
easy to setup on my computer. You insert the setup CD into your computer and follow the installation instructions. In a matter of a few minutes it loads into your computer data back as far as 1950 in commodities and back to 1970 in stocks. The data can be updated daily using your computer modem through a direct tele-phone number or through the Internet. The daily update only takes a couple minutes and it can be setup to update automatically at a specifi ed time you choose. The cost of the basic stock ser-vice is only $19 per month ($29 for US Futures), which is very reasonable and it is one of the most inexpensive data sources of all the services available from other companies.
Unfair Advantage has the capability of exporting data in a format acceptable with most charting software. To begin with, you setup a portfolio of stocks and or commodities you want to follow. The program then creates daily, weekly, monthly, quarterly, or yearly charts of everything in your selected portfolio. It can create an ASCII, CSI, CSIM or MS Format fi le. Commodity fi lescan be sev-eral types can be created; Raw, IFG, Nth Nearest, Back Adjusted, Cash, Option, Perpetual or Gann style. Very few other programs offer this kind of fl exibility.
Why is it necessary to have the dif-ferent kinds of data format? The reason is that for example, if you are going to do historical testing of data using Trad-eStation you need to do it with Back Adjusted Data. This means the data is linked together and adjusted so when one contract month expires then the
next one links to it without a large gap between the two months. This allows long-term smooth testing of any trading system using oscillators. This of course just applies to commodities, which have expiring months, not to stocks.
For Gann style trading, which I am a fan of, you need to link the data together using the Gann format. This means that when the July 1999 Soybeans contract closes, you need to continue with the July 2000 Soybean contract. It does create a big gap on the chart, but this works well with Gann Trading as most of the time the new price level will land on an important long-term trendline or support level. It’s almost magical how this hap-pens.
So if you need just a data package, which can create the most accurate preci-sion data for your historical testing and trading, then this is the onewe would rec-ommend to you.
Unfair Advantage just does not stop there. It is actually a stand-alone charting package by itself. It can create a charts going back to the beginning of its data on your screen or for print out. The program also features a number of chart tools including, trendlines, a very interesting seasonal study, moving averages, RSI, Stochastics, MACD and Basis between two different contract months. The pro-gram also features advanced trading tools such as the stock scanner, which allows you to sort, scan, fi lter and insert your own chart studies and have the program export the results to a conventional spread sheet. Another advanced feature is also available called the Multi-Market Ana-lyzer, which provides a set of new and unique indicators that describe the market situation, not by staring at the same chart day after day, but by determining the underlying economics and the current market forces. The Multi-Market Ana-lyzer uses sophisticated statistical and economic analysis techniques normally found only in specialized packages.
Unfair Advantage features the Trad-ing System Performance Evaluator. Today’s trader is bombarded with hun-dreds of trading systems. All of these systems are claimed to be the best. All of these claims, whether supported by sim-ulated hindsight profi ts or actual trading performance can be statistically analyzed and rated with the Trading System Per-formance Evaluator before understaking any appreciable risk.
I view the Unfair Advantage program as an extremely good program, which fi ts the needs of any trader looking to use long-term data on all world futures mar-kets, futures options, and up to 50,000 stocks and mutual funds for historical testing. It comes highly recommended. You should check it out for yourself with the no-risk free trial download on the Internet at www.csidata.com/demo.html.
tradersworld.com • Spring 2001 55
By Larry Jacobs
Trading chat rooms are begin-ning to be popular on the Inter-net. In this review, we looked at one of the most popular trading rooms. The room is
called Millennium-Traders. You can get a 1 week free trial to get a feel of the room by going to: www.millennium-traders.com. When you log into the room you will fi nd around 60 to 70 traders many of whom seem to know each other and two trading Room moderators by the names of, Lightning and Thunder. Both of these moderators have over 18 years of experience in trading stocks. Each of them give at least 15 to 30 trading sig-nals a day which usually result in profi ts of 1 up to 10 points each. They also get stopped out occasionally. Lightning and Thunder said the following about their trading room:
To get our trading signals, we lock onto specifi c analytics that provide the best read-ings possible for each of us, as individuals. We use total focus and concentration while we generate trading signals as moderators. We have learned the general pattern of how certain stocks move by playing them consis-tently. To get these signals we use custom-ized software specifi cally designed for each of our stock calling strategies. Each of us have specifi c buy and sell signals that we watch for in addition to, watching the gen-eral movement of the entire market. To get the maximum benefi t of this trading room, we feel that a trader should be prepared not to walk away from their computer during the given play period. In addition, the trader should have a backup plan and be prepared to contact their broker by phone or by any other fast method at any given time, in the event that they lose connection to our Trad-ing Room or should they have an unexpected failure to connect to the Internet. The trader should also have a predetermined mental stop loss prior to entering the trade. The trader should sell/cover into the run of the stock, not when it is done to be successful.
I asked several of the room traders their opinion of this trading room and this is what they had to say:
Trading Room Name: keene2This room is built for momentum traders. Absolutely the best in my opinion, and I was a member of two other rooms prior to Millennium. My trading has improved dra-matically since joining this room. I now see more clearly the over-all trend or fl ow of the market. When Thunder and Lightning are calling for a buy on several stocks, you know it’s time to go long. They even warn us when moves are “tight”, so we should take quick profi ts. I watch most of the “room calls”, and
very often enter my order on the call. I deter-mine my own exits however, and don’t wait for an exit call. A trader should use a com-puter with at least 256k of RAM. Charting and Level II is a must in my opinion. Attitude is everything. There is an air of confi dence here, even novice traders succeed because of this quality. The “mods” are thrilled when we do well, you can feel it! Before Millen-nium, fear dominated my trading day. Now? Lookout Wall Street the Storm approaches!
Trading Room Name: SpencerHaving been a member of several other rooms I feel this is, if not the premium then one of the premium rooms available to trad-ers on the Internet today. Before I joined this room I would have no real direction in my trading style instead I would look for poten-tial movers using scanners etc. Since being here I feel I have become a much improved trader and have learned to make my own calls, although they are not often as good as the room calls they are still profi table. I also have less losing trades than I did before and my losses on each trade are far less. I use the chat room for the style of calls made from the moderators and for the daily conversa-tion. The room is very light and it is nice to have fun while making money. It is also a nice feeling to not feel alone each day and to be part of a team. To my knowledge the moderators have never ignored comments or shunned away from helping traders. Instead they treat all traders in the room as if they equal, where in other rooms I was made to feel inferior at times. They also will look into calls that other traders bring to the rooms attention unless they feel it is a pump and dump style of trade they NEVER call. The calls from the room are often so good that minimal equipment is needed to trade the room. I have a 1200mhz, 2 600mhz machines and a laptop with several monitors, which are all networked. I also use a chart service and Direct Access, yet others in the room are very limited in hardware and trade through an online broker yet still are profi table. If I were to sum the room up I would say it is a very friendly service with lots of fun although we have the serious side of making money. On a more personal note I only wish I had found the room earlier as it would have saved me a long and expensive learning curve that I am yet to recover from but with the help from Thunder and Lightning’s calls I know that will be much sooner than I had anticipated. With all that said in my opinion I don’t believe that you can set a price on the information and calls the moderators provide yet if it were based on cost I feel the price of the room is worth every penny just in the training and support given to traders on a daily basis. I have seen this said on several
sites and services that they are the best for the best or built by traders for traders. In many cases I have found that not to be true. Yet in the case of Millennium-Traders this could be said in confi dence. I also fi nd it very hard to recommend a service that I am not completely sure of to friends and family. But I gladly recommend this service and feel confi dent that they too can enjoy and profi t from the calls made. I have also not seen as many home runs hit on a daily basis. Every-day the room calls several 2 point plus calls and I have often seen 5 and 10 point calls made. While stops are normally limited to one per day, that is an impressive record when making over 30+ calls per day on average.
Trading Room Name: SUSANI just LOVE this chat room and the people in there! It has helped me by having others scanning stocks that are moving. If I try to do this alone I miss out on some good trades. The more eyes you have watching the better! This room teaches the importance of using tight stops and NOT holding stocks overnight. I used to hold overnight and was always sorry when I did. It is very impor-tant to have dual monitors. I have 3 mon-itors on 1 system. 2-21” and 1-19” - The 19” for the chat room, the others for charts, level II, order book, time & sales etc. I have the charts set up on 1 minute candles for day trading. It is also important to have a dependable and fast Internet provider. I use satellite but ISDN, DSL or cable would be just fi ne. I do not like trading with just a 56k modem. Last and most important is direct trading to Island. I trade using Real Tick software and get almost instantaneous exe-cutions. You must be with a trading fi rm that offers fast executions. Seconds do count when day trading. A comment I have about this site is “I am amazed in this volatile and diffi cult market that 98% of there calls are winners. Just look at there “Daily Recap” It speaks for itself. There calls are great!
Trading Room Name: blkjkMillennium-Traders chat room provides decisive, fast-paced trading recommenda-tions by experienced moderators with an outstanding track record. I would rate them “BEST OF THE WEB”. I’ve been trading for three years but still rely on them to identify low and high points for inter-day entry and exits. Early alerts allow time to catch the real bottom. In addition, short side trades have been much more profi table for me since joining Millennium-Traders. Their recommendations give me the confi dence to “Pull the trigger”. Like most of life’s endeavors, a team effort works best. An indi-vidual in the fi nancial markets doesn’t stand a chance. I use Millennium-Traders as an extension of my own eyes and ears to iden-tify the lucrative inter-day trading opportu-nities. Chat room members also contribute. It’s a team approach, and it works well. Many other web sites make the same “Claim
Traders’ Chat Room

56 Spring 2001 • tradersworld.com
The Right Trading Accessories
to fame”, but Millennium-Traders does it best. A quick execution broker with point and click trading capabilities is a defi nite MUST. I use real time software for multiple charts and quotes, high speed internet pro-vider, multiple monitors. The site is unique, well managed by experienced moderators and produces profi table results. The service they provide now is the only service I need.
Trading Room Name: GodofMoneyI have been a member of the room for about 8 months now, and it is wonderful. It has helped me to make a lot of regular profi t, each and every month. And in fact I feel the reason I have survived the market vol-atility and been able to make great profi t over the past 8 months, has been due to the great trading calls and trading advice that I have gotten from the Millennium-Traders.com chat room. Instead of having to fi nd trading plays myself, I now have 2 experts, Thunder and Lightning, fi nd the plays, so all I have to do is execute them, this is a great aid, cuts the “burden” that is on me by at least 75%, and it’s worth way more than the monthly fee charged, to me... Plus, I’m no expert so I couldn’t/wouldn’t fi nd most of the plays on my own. I use the chat room very heavily in my trading. I rely on the “Watching For Bottom On” calls to create my on-screen list of stocks to watch, and I rely on the Consider Buy calls that follow, to get into 99% of my trades these days. I know that if Thunder or Lightning call a Watching For Bottom or Consider Buy, that stock is very likely to be a good player, thanks to their expert calls... The confi dence that comes from knowing that at least 75% of their calls will go solidly in the direction called, has made me a much better trader, more confi dent and at-ease in getting into trading plays. Many of the Chat Room mem-bers have very sophisticated day trading equipment, and I’m sure it helps them a lot, but personally, I think that concentration, speed in entering at the Consider Buy alert, a willingness to take profi t and to trade smart by always keeping Sell Stops in place, and a decision to simply follow and obey the Consider Buy and Consider Sell calls that Thunder & Lightning make, are enough to result in regular, excellent trading profi ts. I think that you have to spend money to make money. $250 a month is very cheap, when I consider the outstanding, real-time stock day trading calls that I and all other members can receive all day long, every single trading day. Thunder and Lightning are not merely “businessmen”, they are caring people who care about every member and work as hard as they can to make every call a winning one. And they succeed. This is the most profes-sional, well-run, high-quality real-time day trading service that I have ever seen, and I really feel like I would be lost without it. As far as I’m concerned, the site is excellent as it is, Thunder and Lightning meet all of my trading needs, in their calls and in how they operate the Chat Room.
If you expect to trade the markets all day long in front of a computer, then you need the right equipment. We are recommending the Premio com-puter for several reasons. First, it is
designed with the trader in mind. The Premio factory can confi gure your computer and install your trading appli-cations, so when you get the computer you can turn it on and its ready to go. The computer comes with a dual monitor output which can be upgraded to a 4 moni-tor output with just the inser-
tion of another twin monitor card. Premio stands behind their computer with tech-nical support via an 800 number and onsite service. The computer comes with a program called PC Fix which allows a technician to go into your computer with your permission and inspect it for hard-ware or software problems over the inter-net. In a recent CNET computer review, this computer was recommended over an equivalent Dell. The price of this com-puter is also hundreds of dollars less than the competition.
The Premio computer also comes with a thermostatic power supply. The
speed of the fan in the thermo-static power supply is based on the temperature inside of the computer case. The power supply fan doesn’t need to run at full speed all the time. This
type of power supply allows the fan to drop to as low as 1/10th of the speed of a normal one. The noise output then is dropped proportionally. If you are a trader sitting beside your computer all day, this thermostatic quiet power supply is the only way to go.
Since a trader is using his computer during the day to access fi nancial infor-mation on the internet, the Premio com-puter also comes with the precision
Microsoft Internet keyboard and optical mouse. It’s necessary to have a precision optical mouse when you are working with
charts. Unlike a conventional mouse, there is no ball to clog
up. The accuracy of the optical mouse is also many times better.
In my opinion the most important part of the computer is the screen. CTR screens are heavy, bulky, bad on your eyes and they do emit electrostatic radia-tion. This causes brain drain. See page 62.
One needs to switch to the TFT fl at panel mon-itors. The price of these are f i n a l l y c o m i n g down. The one we rec-ommend is the 770 TFT
Samsung monitor. It has the most advanced image scaling, 160 degree view angle, no fl icker, very little electromag-netic radiation. it has a dot pitch of .26mm which gives you an extremely sharp and clear screen chart. This is the monitor that won the awards from other reviewers like PC Magazine, CNET, etc. It’s better to skimp on your computer than it is on the screen. We tested this screen and found it to be excellent. Don’t even hesitate, just buy one, two three or four of these screens for your trading. You’ll be doing yourself a big favor. Once you have one of these screens you’ll never go back to a CRT again.
Another addition to your trading offi ce should be Full Spectrum Lighting. We recommend the Ott clamp on desk lamp. It provides light that is bright, sim-ulating natural “sun” light. The Results ... small print is easier to read, your eyes and body are less stressed and less fatigued at the end of the day. Your trading using one of these lights should improve. Using artifi cial lighting can lead to eye strain, headaches, fatigue and irrita-
bility. In the low light months of winter, it can even i n c r e a s e P M S , i n c r e a s e your appe-tite, and c a u s e depression. Y o u r i m m u n e
system needs full spectrum light to stay strong, and to keep you healthy. And if you fi nd it more diffi cult to be happy in the winter, your body is telling you it doesn’t have enough light to stimulate the brain centers responsible for mood.
For more information on all of these advanced trading products and more just go to www.tradersworld.com
tradersworld.com • Spring 2001 57
UNFAIR ADVANTAGE
For more information circle No. 39
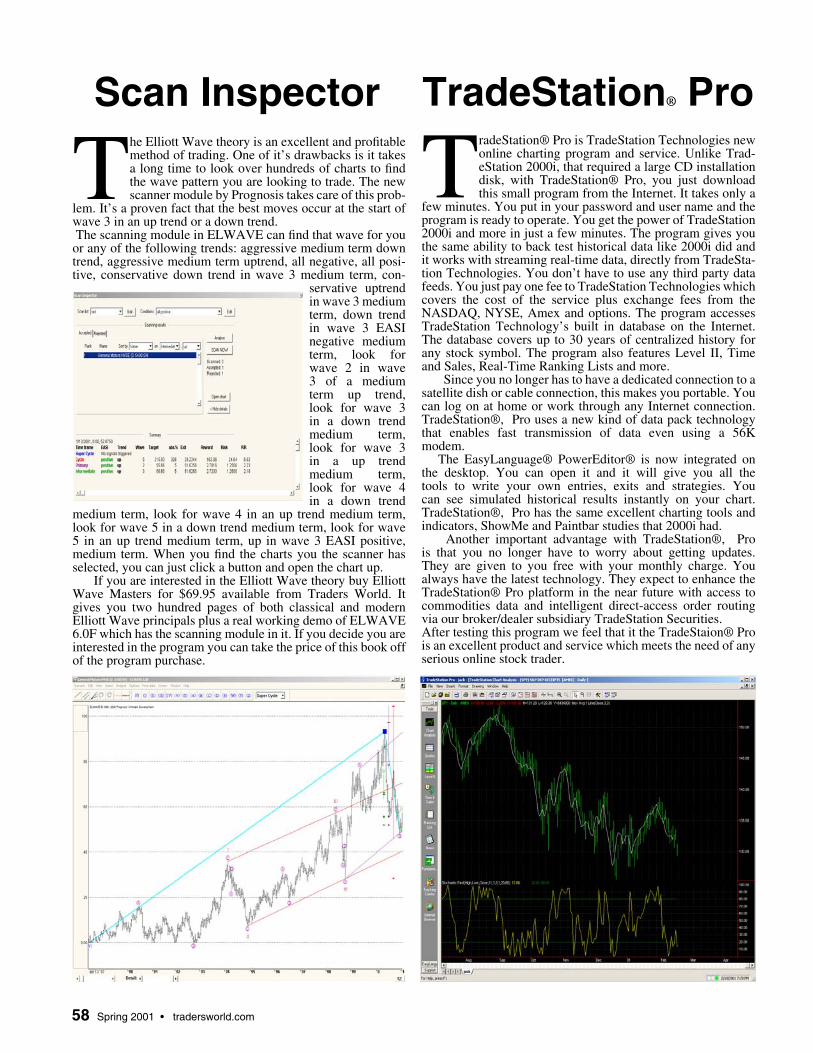
58 Spring 2001 • tradersworld.com
TradeStation® Pro is TradeStation Technologies new online charting program and service. Unlike Trad-eStation 2000i, that required a large CD installation disk, with TradeStation® Pro, you just download this small program from the Internet. It takes only a
few minutes. You put in your password and user name and the program is ready to operate. You get the power of TradeStation 2000i and more in just a few minutes. The program gives you the same ability to back test historical data like 2000i did and it works with streaming real-time data, directly from TradeSta-tion Technologies. You don’t have to use any third party data feeds. You just pay one fee to TradeStation Technologies which covers the cost of the service plus exchange fees from the NASDAQ, NYSE, Amex and options. The program accesses TradeStation Technology’s built in database on the Internet. The database covers up to 30 years of centralized history for any stock symbol. The program also features Level II, Time and Sales, Real-Time Ranking Lists and more. Since you no longer has to have a dedicated connection to a satellite dish or cable connection, this makes you portable. You can log on at home or work through any Internet connection. TradeStation®, Pro uses a new kind of data pack technology that enables fast transmission of data even using a 56K modem. The EasyLanguage® PowerEditor® is now integrated on the desktop. You can open it and it will give you all the tools to write your own entries, exits and strategies. You can see simulated historical results instantly on your chart. TradeStation®, Pro has the same excellent charting tools and indicators, ShowMe and Paintbar studies that 2000i had. Another important advantage with TradeStation®, Pro is that you no longer have to worry about getting updates. They are given to you free with your monthly charge. You always have the latest technology. They expect to enhance the TradeStation® Pro platform in the near future with access to commodities data and intelligent direct-access order routing via our broker/dealer subsidiary TradeStation Securities. After testing this program we feel that it the TradeStaion® Pro is an excellent product and service which meets the need of any serious online stock trader.
TradeStation® Pro
The Elliott Wave theory is an excellent and profi table method of trading. One of it’s drawbacks is it takes a long time to look over hundreds of charts to fi nd the wave pattern you are looking to trade. The new scanner module by Prognosis takes care of this prob-
lem. It’s a proven fact that the best moves occur at the start of wave 3 in an up trend or a down trend. The scanning module in ELWAVE can fi nd that wave for you or any of the following trends: aggressive medium term down trend, aggressive medium term uptrend, all negative, all posi-tive, conservative down trend in wave 3 medium term, con-
servative uptrend in wave 3 medium term, down trend in wave 3 EASI negative medium term, look for wave 2 in wave 3 of a medium term up trend, look for wave 3 in a down trend medium term, look for wave 3 in a up trend medium term, look for wave 4 in a down trend
medium term, look for wave 4 in an up trend medium term, look for wave 5 in a down trend medium term, look for wave 5 in an up trend medium term, up in wave 3 EASI positive, medium term. When you fi nd the charts you the scanner has selected, you can just click a button and open the chart up.
If you are interested in the Elliott Wave theory buy Elliott Wave Masters for $69.95 available from Traders World. It gives you two hundred pages of both classical and modern Elliott Wave principals plus a real working demo of ELWAVE 6.0F which has the scanning module in it. If you decide you are interested in the program you can take the price of this book off of the program purchase.
Scan Inspector

tradersworld.com • Spring 2001 59
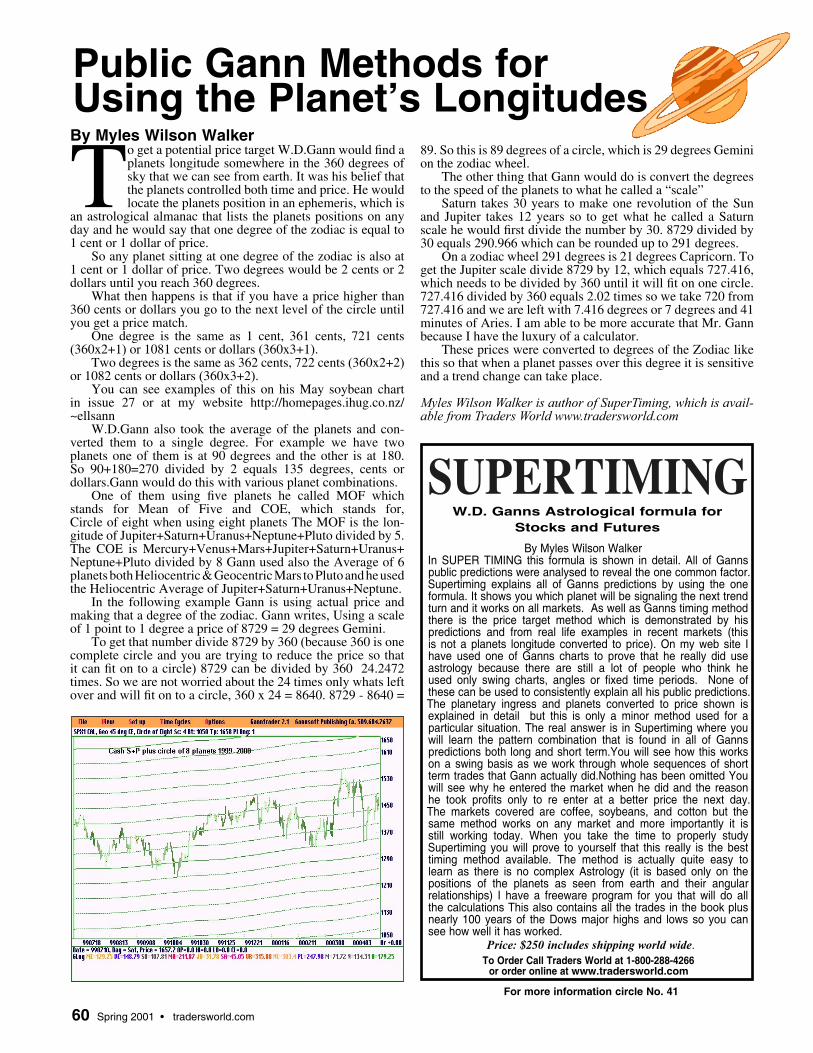
60 Spring 2001 • tradersworld.com
By Myles Wilson WalkerIn SUPER TIMING this formula is shown in detail. All of Ganns public predictions were analysed to reveal the one common factor. Supertiming explains all of Ganns predictions by using the one formula. It shows you which planet will be signaling the next trend turn and it works on all markets. As well as Ganns timing method there is the price target method which is demonstrated by his predictions and from real life examples in recent markets (this is not a planets longitude converted to price). On my web site I have used one of Ganns charts to prove that he really did use astrology because there are still a lot of people who think he used only swing charts, angles or fixed time periods. None of these can be used to consistently explain all his public predictions. The planetary ingress and planets converted to price shown is explained in detail but this is only a minor method used for a particular situation. The real answer is in Supertiming where you will learn the pattern combination that is found in all of Ganns predictions both long and short term.You will see how this works on a swing basis as we work through whole sequences of short term trades that Gann actually did.Nothing has been omitted You will see why he entered the market when he did and the reason he took profits only to re enter at a better price the next day. The markets covered are coffee, soybeans, and cotton but the same method works on any market and more importantly it is still working today. When you take the time to properly study Supertiming you will prove to yourself that this really is the best timing method available. The method is actually quite easy to learn as there is no complex Astrology (it is based only on the positions of the planets as seen from earth and their angular relationships) I have a freeware program for you that will do all the calculations This also contains all the trades in the book plus nearly 100 years of the Dows major highs and lows so you can see how well it has worked.
W.D. Ganns Astrological formula for
Stocks and Futures
SUPERTIMING
To Order Call Traders World at 1-800-288-4266 or order online at www.tradersworld.com
Price: $250 includes shipping world wide.
For more information circle No. 41
By Myles Wilson Walker
To get a potential price target W.D.Gann would fi nd a planets longitude somewhere in the 360 degrees of sky that we can see from earth. It was his belief that the planets controlled both time and price. He would locate the planets position in an ephemeris, which is
an astrological almanac that lists the planets positions on any day and he would say that one degree of the zodiac is equal to 1 cent or 1 dollar of price.
So any planet sitting at one degree of the zodiac is also at 1 cent or 1 dollar of price. Two degrees would be 2 cents or 2 dollars until you reach 360 degrees.
What then happens is that if you have a price higher than 360 cents or dollars you go to the next level of the circle until you get a price match.
One degree is the same as 1 cent, 361 cents, 721 cents (360x2+1) or 1081 cents or dollars (360x3+1).
Two degrees is the same as 362 cents, 722 cents (360x2+2) or 1082 cents or dollars (360x3+2).
You can see examples of this on his May soybean chart in issue 27 or at my website http://homepages.ihug.co.nz/~ellsann
W.D.Gann also took the average of the planets and con-verted them to a single degree. For example we have two planets one of them is at 90 degrees and the other is at 180. So 90+180=270 divided by 2 equals 135 degrees, cents or dollars.Gann would do this with various planet combinations.
One of them using fi ve planets he called MOF which stands for Mean of Five and COE, which stands for, Circle of eight when using eight planets The MOF is the lon-gitude of Jupiter+Saturn+Uranus+Neptune+Pluto divided by 5. The COE is Mercury+Venus+Mars+Jupiter+Saturn+Uranus+ Neptune+Pluto divided by 8 Gann used also the Average of 6 planets both Heliocentric & Geocentric Mars to Pluto and he used the Heliocentric Average of Jupiter+Saturn+Uranus+Neptune.
In the following example Gann is using actual price and making that a degree of the zodiac. Gann writes, Using a scale of 1 point to 1 degree a price of 8729 = 29 degrees Gemini.
To get that number divide 8729 by 360 (because 360 is one complete circle and you are trying to reduce the price so that it can fi t on to a circle) 8729 can be divided by 360 24.2472 times. So we are not worried about the 24 times only whats left over and will fi t on to a circle, 360 x 24 = 8640. 8729 - 8640 =
89. So this is 89 degrees of a circle, which is 29 degrees Gemini on the zodiac wheel.
The other thing that Gann would do is convert the degrees to the speed of the planets to what he called a “scale”
Saturn takes 30 years to make one revolution of the Sun and Jupiter takes 12 years so to get what he called a Saturn scale he would fi rst divide the number by 30. 8729 divided by 30 equals 290.966 which can be rounded up to 291 degrees.
On a zodiac wheel 291 degrees is 21 degrees Capricorn. To get the Jupiter scale divide 8729 by 12, which equals 727.416, which needs to be divided by 360 until it will fi t on one circle. 727.416 divided by 360 equals 2.02 times so we take 720 from 727.416 and we are left with 7.416 degrees or 7 degrees and 41 minutes of Aries. I am able to be more accurate that Mr. Gann because I have the luxury of a calculator.
These prices were converted to degrees of the Zodiac like this so that when a planet passes over this degree it is sensitive and a trend change can take place.
Myles Wilson Walker is author of SuperTiming, which is avail-able from Traders World www.tradersworld.com
Public Gann Methods for Using the Planet’s Longitudes
tradersworld.com • Spring 2001 61
MEMBERSHIP BENEFITS � Live Real Time Trading Room for Professional Daytraders available 24/7!
� Live, Real Time Buy, Sell, Short & Short Cover Alerts brought to you exclusively by Trading Room Moderators: LIGHTNING & THUNDER!
� Live Interactive Training for Day Traders available Tuesday and Thursday from 4:15 p.m. til 5:15 p.m. EST in the Training Room. � Live: Real Time News and Pre-Market Gapper Alerts!
� ‘Daily Recap’ newsletter subscription free from our website which includes
a transcript of Daily Calls made by LIGHTNING & THUNDER!
� IPO, Earnings and Stock Split information provided daily via our ‘Daily
Recap’ newsletter!
� ‘Shopping Mall’ for Day Traders!
Visit our Testimonial’s page and see what our Members have to say about us!
http://www.millennium-traders.comFor more information circle No. 42
MILLENNIUM-TRADERS.COM
LIVE ... Online Trading Chatroom dedicated to locating the BEST Day Trading Stock Market stocks to play and convey them to members
in ... REAL TIME !!____________________________________________________
“Where Professional Day Traders come to Trade the Market...Long or Short!!”
� One Week Free Trial! �to our ... ‘ Online Trading Chatroom ‘
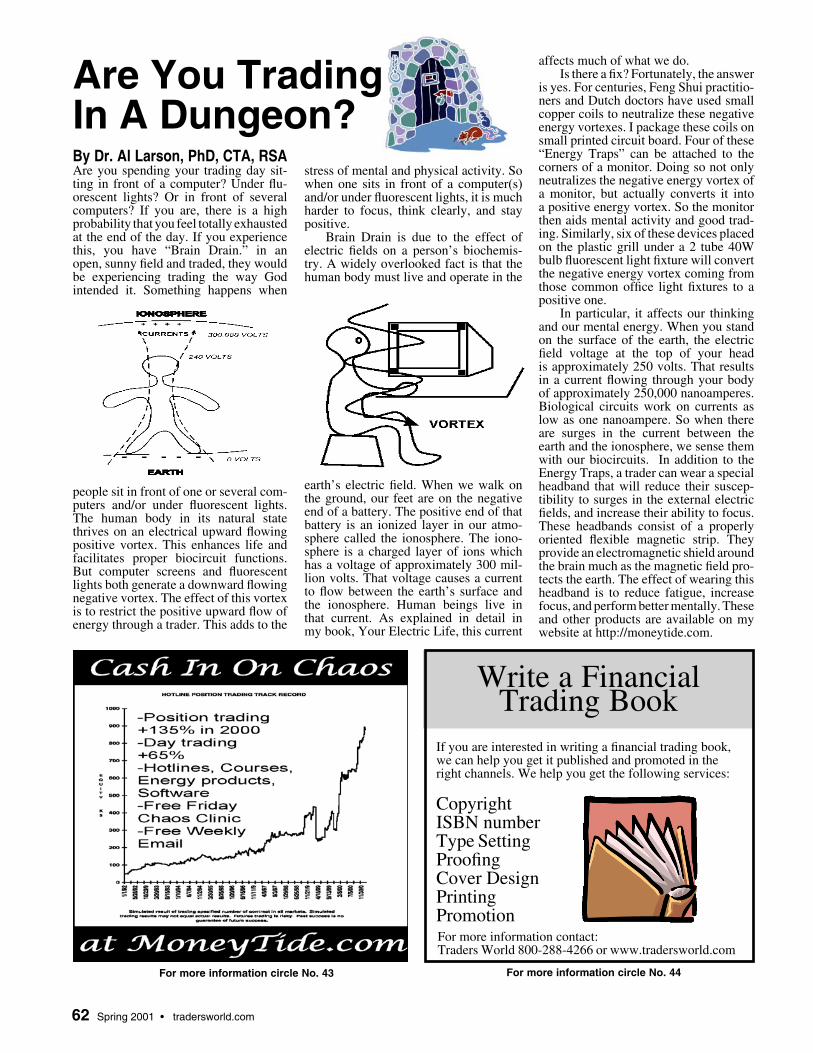
62 Spring 2001 • tradersworld.com
By Dr. Al Larson, PhD, CTA, RSAAre you spending your trading day sit-ting in front of a computer? Under fl u-orescent lights? Or in front of several computers? If you are, there is a high probability that you feel totally exhausted at the end of the day. If you experience this, you have “Brain Drain.” in an open, sunny fi eld and traded, they would be experiencing trading the way God intended it. Something happens when
people sit in front of one or several com-puters and/or under fl uorescent lights. The human body in its natural state thrives on an electrical upward fl owing positive vortex. This enhances life and facilitates proper biocircuit functions. But computer screens and fl uorescent lights both generate a downward fl owing negative vortex. The effect of this vortex is to restrict the positive upward fl ow of energy through a trader. This adds to the
stress of mental and physical activity. So when one sits in front of a computer(s) and/or under fl uorescent lights, it is much harder to focus, think clearly, and stay positive.
Brain Drain is due to the effect of electric fi elds on a person’s biochemis-try. A widely overlooked fact is that the human body must live and operate in the
earth’s electric fi eld. When we walk on the ground, our feet are on the negative end of a battery. The positive end of that battery is an ionized layer in our atmo-sphere called the ionosphere. The iono-sphere is a charged layer of ions which has a voltage of approximately 300 mil-lion volts. That voltage causes a current to fl ow between the earth’s surface and the ionosphere. Human beings live in that current. As explained in detail in my book, Your Electric Life, this current
Are You Trading In A Dungeon?
affects much of what we do.Is there a fi x? Fortunately, the answer
is yes. For centuries, Feng Shui practitio-ners and Dutch doctors have used small copper coils to neutralize these negative energy vortexes. I package these coils on small printed circuit board. Four of these “Energy Traps” can be attached to the corners of a monitor. Doing so not only neutralizes the negative energy vortex of a monitor, but actually converts it into a positive energy vortex. So the monitor then aids mental activity and good trad-ing. Similarly, six of these devices placed on the plastic grill under a 2 tube 40W bulb fl uorescent light fi xture will convert the negative energy vortex coming from those common offi ce light fi xtures to a positive one.
In particular, it affects our thinking and our mental energy. When you stand on the surface of the earth, the electric fi eld voltage at the top of your head is approximately 250 volts. That results in a current fl owing through your body of approximately 250,000 nanoamperes. Biological circuits work on currents as low as one nanoampere. So when there are surges in the current between the earth and the ionosphere, we sense them with our biocircuits. In addition to the Energy Traps, a trader can wear a special headband that will reduce their suscep-tibility to surges in the external electric fi elds, and increase their ability to focus. These headbands consist of a properly oriented fl exible magnetic strip. They provide an electromagnetic shield around the brain much as the magnetic fi eld pro-tects the earth. The effect of wearing this headband is to reduce fatigue, increase focus, and perform better mentally. These and other products are available on my website at http://moneytide.com.
If you are interested in writing a fi nancial trading book, we can help you get it published and promoted in the right channels. We help you get the following services:
CopyrightISBN numberType SettingProofi ngCover DesignPrintingPromotionFor more information contact:Traders World 800-288-4266 or www.tradersworld.com
Write a Financial Trading Book
For more information circle No. 43 For more information circle No. 44

tradersworld.com • Spring 2001 63For more information circle No. 45
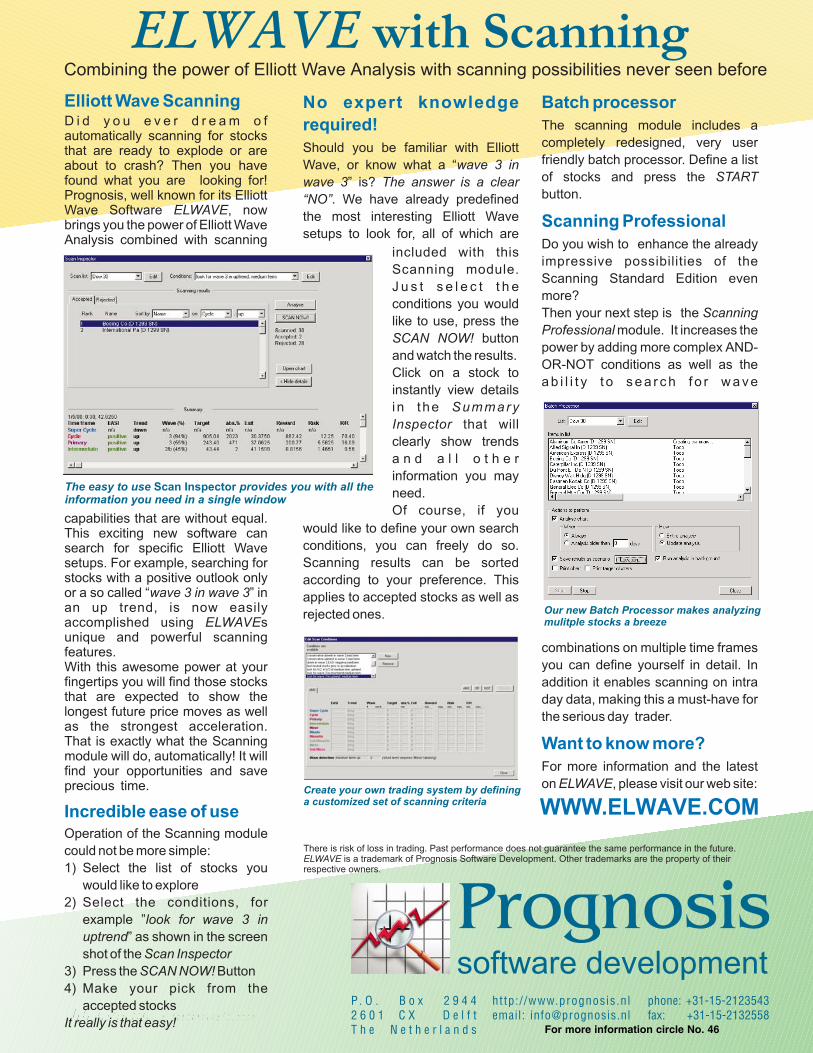
64 Spring 2001 • tradersworld.comFor more information circle No. 46


![[Murrey Jeneth] Impulsive Proposal](https://img.pdfslide.net/doc/110x75/563db8ff550346aa9a99002a/murrey-jeneth-impulsive-proposal.jpg)
