Embed Size (px)
Citation preview
The One-Dam SolutionPreliminary report to the Bureau of Reclamation on proposed reoperation
strategies for Glen Canyon and Hoover Dam under low water conditions.
July 2005
We welcome public feedback toward the development of a subsequent edition
of this report to be concluded following release of Bureau of Reclamation draft
recommendations for the reoperations of Glen Canyon and Hoover Dam.
PO Box 466 Moab, UT 84532
435.259.1063 [email protected]
Cover illustration of Humpback Chub ©Gloria Brown
from “A Naturalist’s Guide to Canyon Country” by Falcon Publishing www.falcon.com
3
“We’ve got to rethink the use of water.
But if you think it’s [the drought] going to go away, the people that think well,
we’re going to go back to a wet cycle, don’t bet on it.”
Stewart Udall, former Secretary of the Interior
December 2003
Table of ContentsSummary Page 4
Th e Coming Crisis Page 6
Flaws in the System Page 7
Th e Underground Solution Page 10
Rethinking Glen Canyon Dam Page 11
Re-examine the Colorado River Compact Page 16
Conclusion Page 18
Notes Page 19

4
SummaryLife in the Southwest depends on the Colorado River. Preserving this resource requires achieving a sustainable balance between water supply and demand. However, population growth and climate change are disrupting this equilibrium and pushing the management of this resource to its limit.
Federal laws and water projects regulating the consumption of Colorado River water do not adequately refl ect this imbalance. Current laws allocate more water to the basin states than the river actually provides. More federal dams have been built than are needed wasting at least 13 percent of the river’s fl ow annually.1 Sediment backing up behind dams represents a multi-billion-dollar management challenge that has so far been ignored. Meanwhile hundreds of millions of dollars are being invested in failed eff orts to manage environmental problems resulting from dam operations.
At the heart of these challenges lie the nation’s largest reservoirs, Lake Powell behind Glen Canyon Dam near the Utah/Arizona border and Lake Mead behind Hoover Dam on the Arizona/Nevada border. Combined they cause the loss of 10 percent of the Colorado’s annual fl ow,2 while declining surplus fl ows render the future fi lling of these reservoirs an unlikely occurrence.
Grand Canyon National Park, which lies between Glen Canyon Dam and Lake Mead, has seen its native ecosystem devastated by dam operations. Four native fi sh are now extinct, one is in jeopardy and another is of special concern. Glen Canyon Dam has trapped the sediment necessary to maintain habitat and beaches for wildlife and recreation, as well as the stabilization
of archeological sites. So far, measures to reverse the decline of these park resources as directed by the 1992 Grand Canyon Protection Act have failed.
Th e desire to prevent the further fi lling of Lake Mead with sediment played a major role in infl uencing the construction of Glen Canyon Dam. However, sediment is now reducing Lake Powell’s storage and if left unresolved will compromise the safe operation of Glen Canyon Dam, as well as Hoover Dam should Glen Canyon Dam fail.
As the Bureau of Reclamation now explores strategies to address the operations of Lake Powell and Lake Mead under low reservoir conditions, it is critical that the scope of this analysis be expanded. A far more comprehensive review must be undertaken that explores the overall relevance of these two facilities for storing and distributing scarce Colorado River water, including:
• Reducing the use of ineffi cient above-ground water storage facilities, while expanding the use of underground storage to minimize evaporation losses. Regional aquifers could provide greater storage capacity than Lake Powell and Lake Mead combined.3
• Employ Lake Mead as the principal water storage and distribution facility for water delivery to the lower basin states. Lake Powell storage is in excess of current and future needs resulting in unnecessary evaporative losses to a limited water supply.
• Employ Lake Mead as the starting point for transporting sediment around the lower Colorado River system.
5
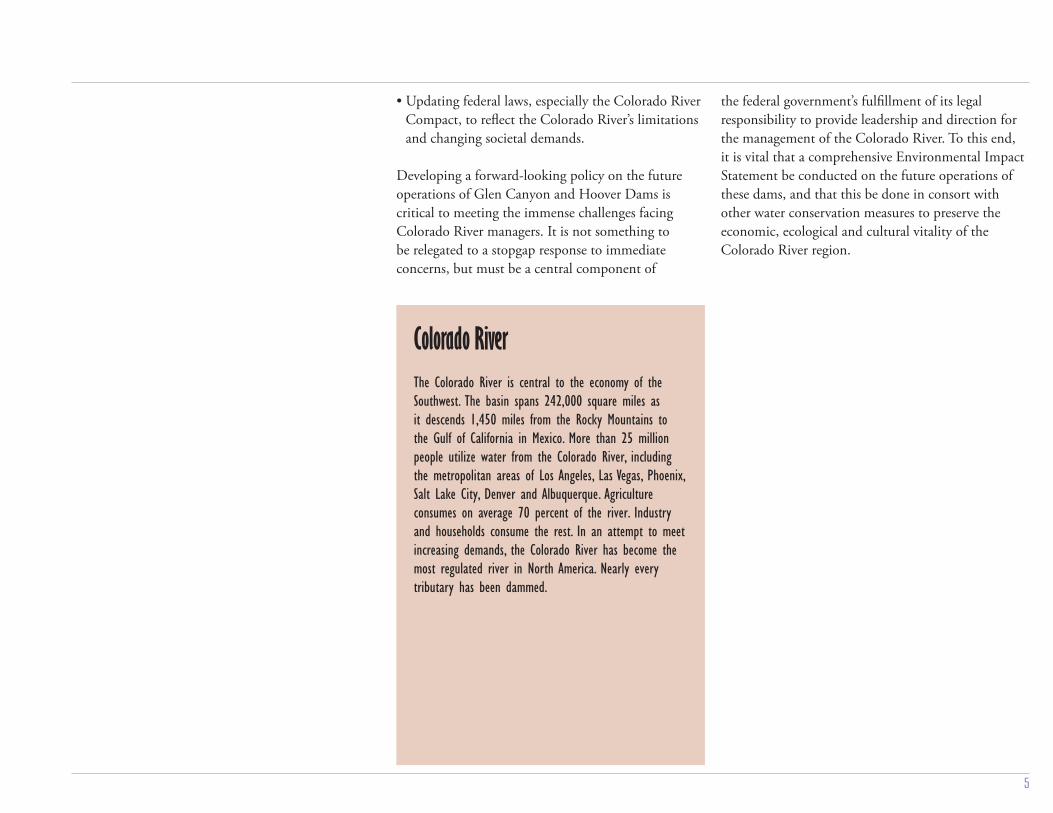
• Updating federal laws, especially the Colorado River Compact, to refl ect the Colorado River’s limitations and changing societal demands.
Developing a forward-looking policy on the future operations of Glen Canyon and Hoover Dams is critical to meeting the immense challenges facing Colorado River managers. It is not something to be relegated to a stopgap response to immediate concerns, but must be a central component of
The Colorado River is central to the economy of the Southwest. The basin spans 242,000 square miles as it descends 1,450 miles from the Rocky Mountains to the Gulf of California in Mexico. More than 25 million people utilize water from the Colorado River, including the metropolitan areas of Los Angeles, Las Vegas, Phoenix, Salt Lake City, Denver and Albuquerque. Agriculture consumes on average 70 percent of the river. Industry and households consume the rest. In an attempt to meet increasing demands, the Colorado River has become the most regulated river in North America. Nearly every tributary has been dammed.
Colorado River
the federal government’s fulfi llment of its legal responsibility to provide leadership and direction for the management of the Colorado River. To this end, it is vital that a comprehensive Environmental Impact Statement be conducted on the future operations of these dams, and that this be done in consort with other water conservation measures to preserve the economic, ecological and cultural vitality of the Colorado River region.
6
The Coming CrisisColorado River fl ows have averaged just 60 per-cent of normal since 2000. Even with the average snow-pack in the spring of 2005, reservoir levels are unlikely to reach 60 percent of full capacity this year. Th ese fl ows will barely accommodate current demands, doing little to overcome the storage defi cit created by the region’s use of nearly two gallons of water for every one gallon that nature has provided.4 Absent a dramatic change in long-term weather pat-terns, a substantial reduction in Colorado River wa-ter use will soon become a necessity.
History shows that the current drought is not un-usual. Over the past century the Colorado River ex-perienced reduced fl ows around 1900, the 1930s and 1950s.5 Moreover, the present downturn represents a minor reduction in precipitation when compared to severe droughts that occurred between 900 and 1300.6
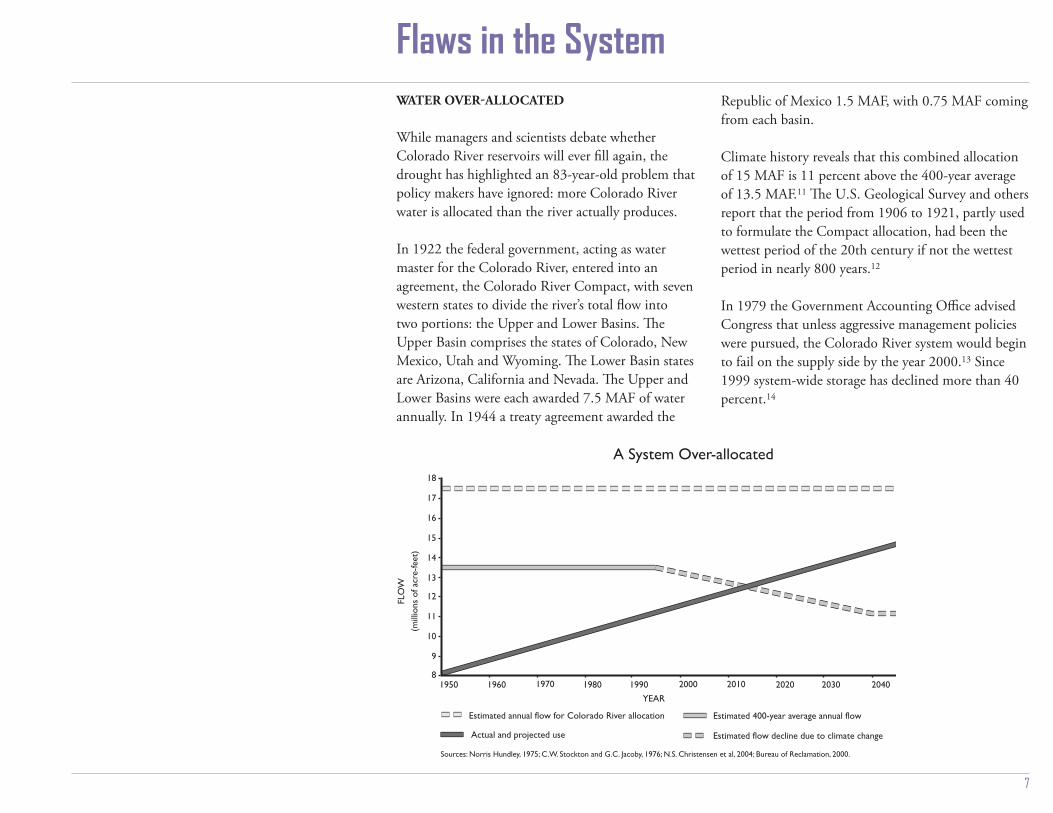
During the more recent droughts, Colorado River water users were spared serious shortages because supply still far exceeded demand. Th is is no longer the case. As water use continues to increase there will be little, if any, surplus water to be placed in storage. Th e National Academy of Sciences estimated that over the past century the Colorado River’s average annual fl ow was 14 million acre-feet (MAF) (an acre-foot equals 325,851 gallons).7 However, analysis using tree-ring data concludes the average annual fl ow of the Colorado River over the past 400 years is approximately 13.5 MAF.8 With current Colorado River water use at approximately 12.6 MAF annually and rising, it will soon become clear that reservoir storage capacity will far exceed what can be used.9
Even more alarming is the Department of Energy’s prediction that climate change will cause Colorado River fl ows to decline 14 percent by 2010, and 18 per-cent by 2040.10
While a brief period of higher fl ows may bring tempo-rary respite, permanent shortages are likely to become the norm. It is therefore essential that solutions be crafted before such shortages occur.
7
Flaws in the System
A System Over-allocated
Estimated annual flow for Colorado River allocation
Sources: Norris Hundley, 1975; C.W. Stockton and G.C. Jacoby, 1976; N.S. Christensen et al, 2004; Bureau of Reclamation, 2000.
Actual and projected use
Estimated 400-year average annual flow
Estimated flow decline due to climate change
1950 1960 1970 1980 20102000 2020 2030YEAR
12
13
14
17
16
15
11
10
9
8
FLO
W
(mill
ions
of a
cre-
feet
)
18
1990 2040
WATER OVERALLOCATED
While managers and scientists debate whether Colorado River reservoirs will ever fi ll again, the drought has highlighted an 83-year-old problem that policy makers have ignored: more Colorado River water is allocated than the river actually produces.
In 1922 the federal government, acting as water master for the Colorado River, entered into an agreement, the Colorado River Compact, with seven western states to divide the river’s total fl ow into two portions: the Upper and Lower Basins. Th e Upper Basin comprises the states of Colorado, New Mexico, Utah and Wyoming. Th e Lower Basin states are Arizona, California and Nevada. Th e Upper and Lower Basins were each awarded 7.5 MAF of water annually. In 1944 a treaty agreement awarded the
Republic of Mexico 1.5 MAF, with 0.75 MAF coming from each basin.
Climate history reveals that this combined allocation of 15 MAF is 11 percent above the 400-year average of 13.5 MAF.11 Th e U.S. Geological Survey and others report that the period from 1906 to 1921, partly used to formulate the Compact allocation, had been the wettest period of the 20th century if not the wettest period in nearly 800 years.12
In 1979 the Government Accounting Offi ce advised Congress that unless aggressive management policies were pursued, the Colorado River system would begin to fail on the supply side by the year 2000.13 Since 1999 system-wide storage has declined more than 40 percent.14
8
Department of Energy research predicts that by 2010 the Upper Basin will not be able to meet its full water delivery allocations to the Lower Basin 20 percent of the time, dropping to nearly 40 percent of the time thereafter.15 Despite these warnings, there has yet to be any substantive movement to correct the over-allocation problem.
INEFFICIENT WATER STORAGE
Th e federal government has constructed more than 40 major dams on the Colorado River and its tributaries, principally for storing and diverting water. Th ese reservoirs have a combined storage capacity equivalent to four and one-half years of the river’s average annual fl ow, but they also cause the loss of up to 13 percent of these fl ows.16
Studies show that an optimum relationship exists between the basin’s annual water fl ow and its storage capacity, since more reservoirs and canals cause more water to be lost to evaporation and seepage. Optimal water storage for the Colorado River was calculated to be about 30 MAF.17 However, this analysis could not sway the momentum toward building fewer dams.
Lake Powell and Lake Mead are the most ineffi cient components in this system. Th eir locations are known for extremely low humidity, high summer temperatures and strong winds that maximize evaporative losses. Since its completion in 1963, Lake Powell has lost approximately 21.1 MAF to the atmosphere and Lake Mead, completed 30 years prior, has lost 57.1 MAF.18
In addition, the porosity of the rock that surrounds the reservoirs compounds the water loss through
seepage. Th e problem is most pronounced at Lake Powell, where the surrounding sandstone is soft and extremely permeable resulting in 18.7 MAF being lost. At Lake Mead, where the rock is more resistant, about 1 MAF has been lost.19 It is believed that some percentage of the seepage may return as the reservoirs recede, but it is unclear how much and how soon.
Th is water is incredibly valuable. Based on recent wholesale prices for untreated Colorado River water, Lake Mead and Lake Powell annually lose on average $350 million worth of water to evaporation.20
THE LOOMING PROBLEM OF SEDIMENT
Th e Colorado River is the most sediment-laden river in the country. Prior to the construction of Glen Canyon Dam, sediment had already fi lled ten percent of Lake Mead.21 When Glen Canyon Dam was built, engineers estimated that its river outlet tubes would be compromised by sediment within 100 years, aff ecting the safe operation of the dam.22 Th e Bureau of Reclamation reiterated this in 2002.23
Hydrologists and geomorphologists warn that sediment could aff ect dam operations even sooner.24 Lake Powell’s declining level (92 feet below full pool in July 2005) has exposed more than 100 miles of sediment deposits in the tributaries fl owing into the reservoir. Th ese streams are “reworking” or re-mobilizing these deposits and advancing them towards Glen Canyon Dam.
Additionally, the side canyons and tributaries of the Colorado River contain six decades of accumulated sediment that are poised to be fl ushed into the

9
reservoir. A major fl ood, as experienced in the past, could carry this material in one large event, rapidly diminishing the operational life of the reservoir.25
Th e National Academy of Sciences estimates that 44 million tons of sediment enters Lake Powell every year, or 84 tons per minute.26 In order for Glen Canyon Dam to be sustained over time, the annual infl ow of sediment will need to be dredged and removed.
Th e Glen Canyon area is one of the most remote and rugged landscapes in North America. Developing and maintaining such a massive dredging, hauling and disposal program would be very costly. If the sediment is moved to the most environmentally responsible location, the Colorado River delta, transportation costs alone could be $2.6 billion annually.27
Sediment represents the most serious long-term problem facing the Colorado River water storage system and must no longer be ignored.
10
The Underground Solution
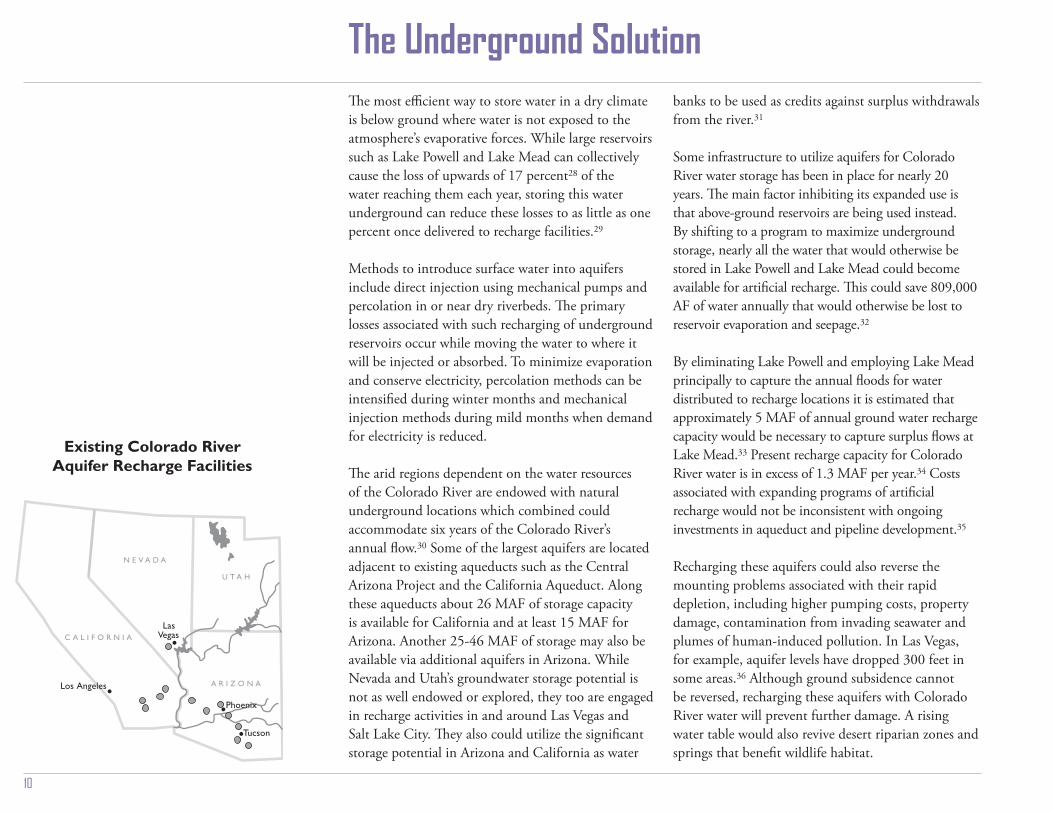
Existing Colorado RiverAquifer Recharge Facilities
N E V A D A
U T A H
A R I Z O N A
C A L I F O R N I A
Los Angeles
LasVegas
Tucson
Phoenix
Th e most effi cient way to store water in a dry climate is below ground where water is not exposed to the atmosphere’s evaporative forces. While large reservoirs such as Lake Powell and Lake Mead can collectively cause the loss of upwards of 17 percent28 of the water reaching them each year, storing this water underground can reduce these losses to as little as one percent once delivered to recharge facilities.29
Methods to introduce surface water into aquifers include direct injection using mechanical pumps and percolation in or near dry riverbeds. Th e primary losses associated with such recharging of underground reservoirs occur while moving the water to where it will be injected or absorbed. To minimize evaporation and conserve electricity, percolation methods can be intensifi ed during winter months and mechanical injection methods during mild months when demand for electricity is reduced.
Th e arid regions dependent on the water resources of the Colorado River are endowed with natural underground locations which combined could accommodate six years of the Colorado River’s annual fl ow.30 Some of the largest aquifers are located adjacent to existing aqueducts such as the Central Arizona Project and the California Aqueduct. Along these aqueducts about 26 MAF of storage capacity is available for California and at least 15 MAF for Arizona. Another 25-46 MAF of storage may also be available via additional aquifers in Arizona. While Nevada and Utah’s groundwater storage potential is not as well endowed or explored, they too are engaged in recharge activities in and around Las Vegas and Salt Lake City. Th ey also could utilize the signifi cant storage potential in Arizona and California as water
banks to be used as credits against surplus withdrawals from the river.31
Some infrastructure to utilize aquifers for Colorado River water storage has been in place for nearly 20 years. Th e main factor inhibiting its expanded use is that above-ground reservoirs are being used instead. By shifting to a program to maximize underground storage, nearly all the water that would otherwise be stored in Lake Powell and Lake Mead could become available for artifi cial recharge. Th is could save 809,000 AF of water annually that would otherwise be lost to reservoir evaporation and seepage.32
By eliminating Lake Powell and employing Lake Mead principally to capture the annual fl oods for water distributed to recharge locations it is estimated that approximately 5 MAF of annual ground water recharge capacity would be necessary to capture surplus fl ows at Lake Mead.33 Present recharge capacity for Colorado River water is in excess of 1.3 MAF per year.34 Costs associated with expanding programs of artifi cial recharge would not be inconsistent with ongoing investments in aqueduct and pipeline development.35
Recharging these aquifers could also reverse the mounting problems associated with their rapid depletion, including higher pumping costs, property damage, contamination from invading seawater and plumes of human-induced pollution. In Las Vegas, for example, aquifer levels have dropped 300 feet in some areas.36 Although ground subsidence cannot be reversed, recharging these aquifers with Colorado River water will prevent further damage. A rising water table would also revive desert riparian zones and springs that benefi t wildlife habitat.
11
While the benefi ts of expanding groundwater recharge present a strong case for evaluating the future role of storage reservoirs along the Colorado River, there is already a compelling need to examine the merits of the system’s most troublesome facility, Glen Canyon Dam.
UNNECESSARY & UNCERTAIN WATER STORAGE
Glen Canyon Dam was built to aid the Upper Basin states to deliver 8.23 MAF of water annually to the Lower Basin.37 Th e rationale was that during periods of drought, Lake Powell’s storage would allow the Upper Basin to fulfi ll this commitment without impacting its own water use.
However, a Bureau of Reclamation model demonstrated that Glen Canyon Dam’s contributions to meet these deliveries are negligible.38 Lake Mead alone would have provided all of the storage needed for the Lower Basin until recently. Not until autumn of 2004, 41 years after Glen Canyon Dam was completed, had the water stored in Lake Powell been a factor in supplementing Upper Basin water delivery to the Lower Basin.39
While it may appear that Lake Powell has for the fi rst time been fulfi lling its intended purpose, this has come at a signifi cant cost. Obtaining that 23.5 MAF (the amount in Lake Powell when the drought began in July 1999) of water in Lake Powell after 41 years resulted in 35.7 MAF being lost to evaporation and seepage. Th is combined loss represents just 40 percent effi ciency for long-term water storage.40
Additionally, the refi lling of Lake Powell will be a rare occurrence. When the reservoir began fi lling in 1963, there was less demand on available water. Th is allowed
an average surplus of 2.6 MAF annually to fl ow into Lake Powell, fi lling it in 17 years.41 Demand has since increased nearly 100 percent in the Upper Basin and is projected to average 5.4 MAF by 2020.42 Subtracting this annual projected use by the Upper Basin from the river’s average annual fl ow of 13.5 MAF, then subtracting the 8.23 MAF that Glen Canyon Dam must annually release downstream leaves no surplus to help refi ll the reservoir. Th is average annual surplus goes into the red when accounting for the Department of Energy’s anticipated declines in river fl ows due to climate change.43
REVIVING GRAND CANYON’S ECOSYSTEM
Th e river ecosystem in Grand Canyon National Park began declining as Lake Powell began to fi ll in 1963. Since then, river resources in the park have steadily deteriorated to a state of near collapse. If more eff ective measures are not taken soon, the integrity of this ecosystem will be forever compromised. Th e operation of Glen Canyon Dam has caused four of the Canyon’s eight native fi sh species to become extinct. A fi fth is headed in this direction and a sixth is now considered a species of “special concern.” Native birds, mammals, reptiles and amphibians along the river corridor have been aff ected as well.44
In an eff ort to reverse this decline, Congress passed the Grand Canyon Protection Act in 1992. In 1995 an Environmental Impact Study (EIS) established mitigation measures relating to Glen Canyon Dam’s operations.45 Since the recovery program began, and after more than $223 million has been spent, one native fi sh disappeared from the Canyon and another has declined to nearly unrecoverable levels.46
Rethinking Glen Canyon Dam
12
As outlined in a recent report to Congress by the Secretary of the Interior,47 no progress has been made toward meeting the mandate of the Grand Canyon Protection Act, the objectives of the EIS, or the recovery goals which attempt to bring the dam into compliance with the Endangered Species Act.48
In addition, the core of the National Park Service Organic Act49—“to leave [national parks] unimpaired for the enjoyment of future generations”—is being violated as resources continue to deteriorate in Grand Canyon National Park.
A major limitation of eff orts to restore Grand Canyon thus far has been the inability to deliver sediment and nutrients to the ecosystem.50 With nearly all the sediment trapped behind Glen Canyon Dam, there has been a continued decline in the food base and backwater habitat for endangered fi sh, disturbances at archeology sites and a loss of camping beaches. Resource managers have been prohibited from examining the solution that off ers the greatest chance of habitat recovery—restoring the river’s natural processes by decommissioning Glen Canyon Dam.
SEDIMENT COSTS
Water managers must develop a program to manage the sediment entering Lake Powell. As there is no feasible method to fl ush this sediment through Glen Canyon Dam, not to mention the dams downstream, sediment must be mechanically removed.
Th e overall scale of such a project in design, implementation and cost would rival any of the Colorado River water projects to date. Like Hoover
Dam, it would be an unprecedented undertaking. A range of alternatives will need to be explored, including allowing the sediment to fl ow downstream and removing it from Lake Mead.
From the standpoint of convenience, Lake Mead aff ords much easier access to the sediment than Lake Powell. Superior transport systems are already available at Lake Mead, both highway and railroad. Topographically, Lake Mead off ers a better range of disposal sites with fewer constraints should a pipeline/slurry system be preferred. Should it be deemed appropriate to transport the sediment to nature’s intended destination, the Colorado River delta, the distance from Lake Mead would be half as far as from Lake Powell.
Managers must also assess the value of the sediment toward achieving compliance with federal laws guiding endangered species recovery in Grand Canyon National Park. Sediment augmentation—moving sediment around the dam—has already been discussed as a necessary next step to reverse Glen Canyon Dam’s impacts on Grand Canyon.51 However, such augmentation approaches may not contain necessary nutrients like carbon, which is essential to rebuilding a healthy, native food web in Grand Canyon.52
UNCERTAIN POWER, FAR FROM IRREPLACEABLE
When Lake Powell is at full or near full, Glen Canyon Dam can on average generate enough power to service 389,000 homes.53 Declining reservoir storage has caused power production to drop 40 percent.54 Production could fall to zero should below normal
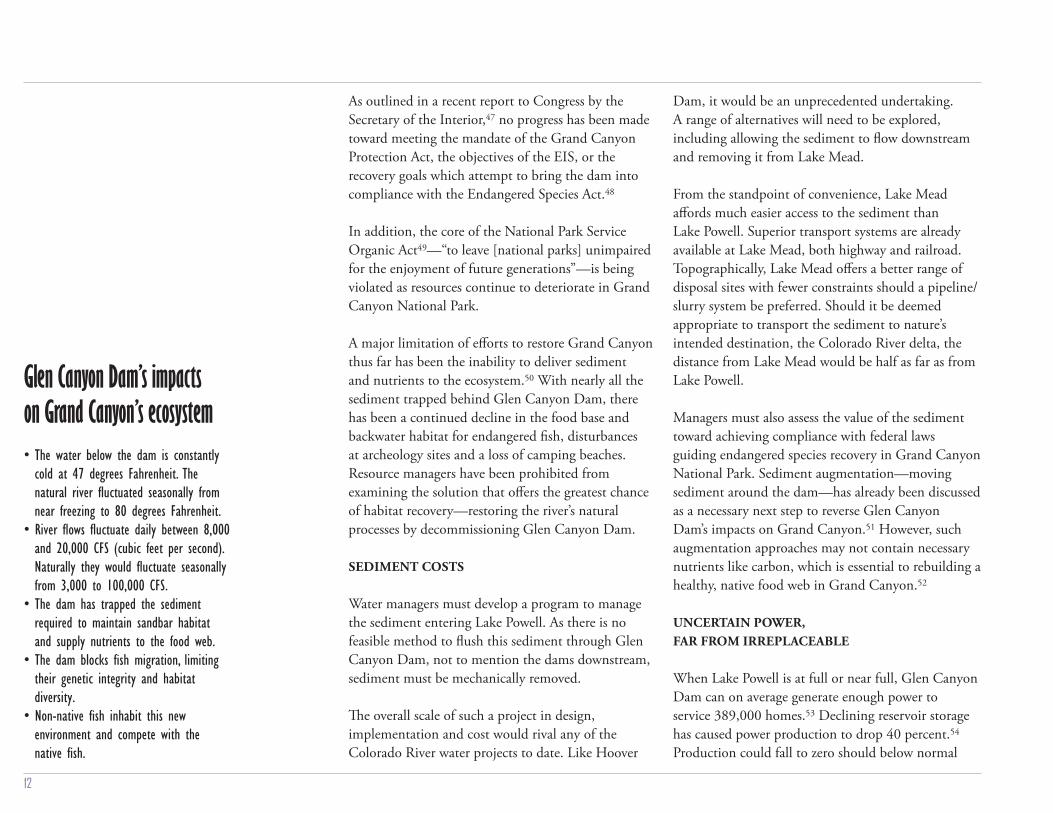
Glen Canyon Dam’s impacts on Grand Canyon’s ecosystem• The water below the dam is constantly
cold at 47 degrees Fahrenheit. The natural river fl uctuated seasonally from near freezing to 80 degrees Fahrenheit.
• River fl ows fl uctuate daily between 8,000 and 20,000 CFS (cubic feet per second). Naturally they would fl uctuate seasonally from 3,000 to 100,000 CFS.
• The dam has trapped the sediment required to maintain sandbar habitat and supply nutrients to the food web.
• The dam blocks fi sh migration, limiting their genetic integrity and habitat diversity.
• Non-native fi sh inhabit this new environment and compete with the native fi sh.
13
infl ows persist and water consumption remain unchanged.55
Glen Canyon Dam’s customers normally enjoy a 40 percent subsidy over the prevailing market rates. Now they must obtain replacement power at competitive rates.56 Substitute power is readily available and will continue to absorb Glen Canyon Dam’s shortfalls, even if power generation falls to zero.
Since 2000, declining power revenues from Glen Canyon Dam have brought repayments on federal loans for Colorado River infrastructure to a near standstill.57 While periodic high fl ows may help power production and enhance revenues for a short time,
climate change and increased water demand have rendered power generation from Glen Canyon Dam far from certain.
To the extent electricity is produced, this comes at a cost of water lost to evaporation and seepage. Th is water itself has economic value and would provide a comparable revenue stream should the dam be decommissioned. More importantly, there is no substitute for the lost water. Since scarcity of water was the driving force behind construction of Glen Canyon Dam, recovery of this water should infl uence the dam’s future.
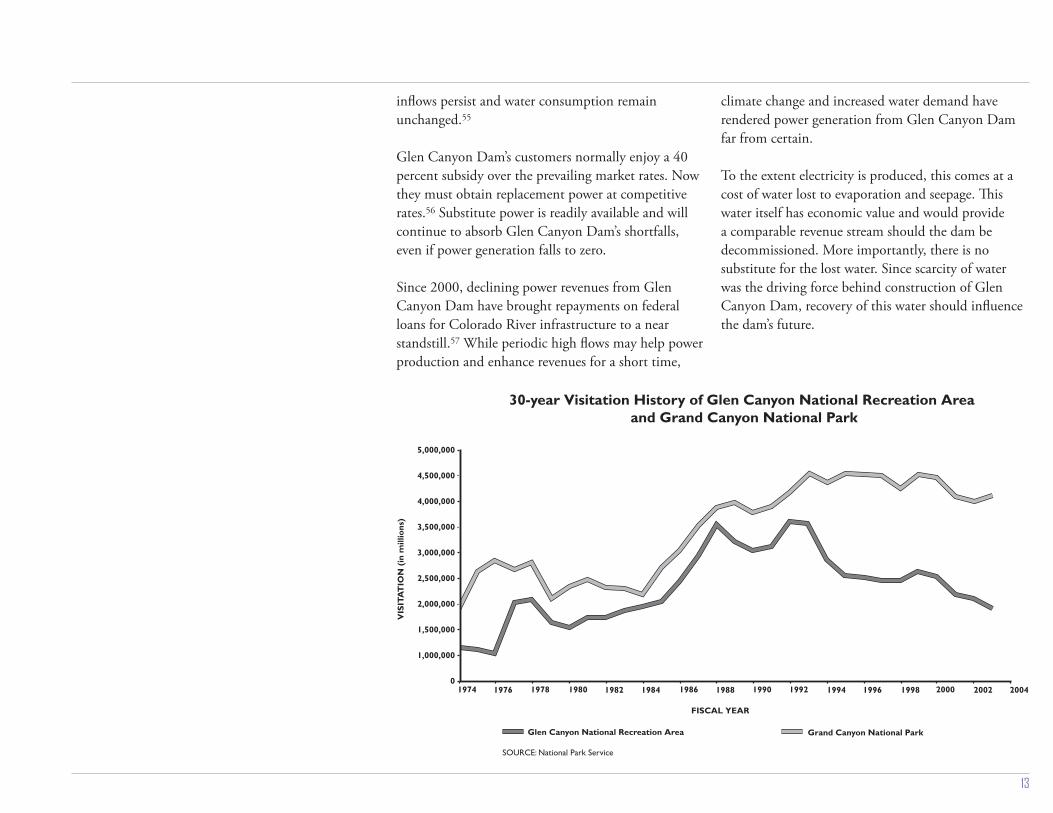
SOURCE: National Park Service
Glen Canyon National Recreation Area Grand Canyon National Park
1974 1976 1978 1980 1982 1984 1986 1988 19921990 1994 1996 1998
FISCAL YEAR
2,500,000
3,000,000
3,500,000
4,000,000
2,000,000
1,500,000
1,000,000
0
VIS
ITA
TIO
N (
in m
illio
ns)
2000 2002 2004
4,500,000
5,000,000
30-year Visitation History of Glen Canyon National Recreation Area and Grand Canyon National Park
14
TOURISM
Lake Powell and the surrounding Glen Canyon National Recreation Area contribute to a tourism economy centered at Page, Arizona. However, visitation there has declined nearly 50 percent over the past 15 years.58
Low reservoir levels restricting boater access have accelerated these declines. In November 2004, Aramark, the area concessionaire, was forced to close facilities that had previously been open year-round.59 Th e National Park Service (NPS) has invested heavily to improve facilities. Despite spending $22 million in 2004 alone,60 NPS was unable to keep boat ramps fully operational. Th ese problems will continue as lower reservoir levels likely become the norm.
A portion of the Navajo Nation shares its border with Lake Powell and contributes to the tourism industry as well. Th eir concession contractor, Antelope Point Holdings, opened a marina in 2004, but declining reservoir levels prevented the launching of boats. While modifi cations have been made, a cliff prevents the marina from operating when the reservoir is about 115 feet low, a reoccurring problem should low water levels persist. Th e Navajo Nation’s desire to construct a water pipeline from the Colorado River, however, can proceed without Lake Powell.
Recreational trout fi shing in the Colorado River below Glen Canyon Dam has experienced a decline in visitation similar to that of Lake Powell, from 52,000 angler days in 1983, to 25,000 in 1999.61
A recent survey of visitors spending the night at Page revealed that Lake Powell boating was not the only
attraction. More than 50 percent of respondents were not engaged in water recreation on Lake Powell.62 Th is is likely due to the town’s central location along a widely used tourist route between the Grand Canyon and other popular national parks, national monuments and recreation areas.
Prior to Glen Canyon Dam, the Colorado River through Glen Canyon was emerging as a tourist destination on its own. Glen Canyon was one of the most spectacular features of the American landscape. Even now, Aramark and others are attempting to attract visitors by publicizing the uncovering of Glen Canyon’s natural features at a diminishing reservoir.
Th e restoration of Glen Canyon by decommissioning Glen Canyon Dam could spawn a river recreation industry comparable to what now exists in Grand Canyon National Park. Hiking, biking and other land-based activities could also be as popular as they are elsewhere in the Canyon County of the Colorado River.
ELIMINATING CONCERNS FOR SAFETY
Glen Canyon Dam has a dangerous safety record. In 1983, snowmelt caused an emergency situation that nearly ended in dam failure. A faulty design in the dam’s spillways led to hydraulic pressure excavating bedrock and forced dam managers to abandon the spillways’ full use. Luckily, disaster was averted when infl ows subsided prior to water overtopping the dam.63
Th e Bureau of Reclamation has forecasted that if Glen Canyon Dam failed when full, a wall of water 580 feet high would enter Grand Canyon.64 A wave 68
15
feet high would overcome Hoover Dam and begin a fl ood that would subside eleven days later. Such a failure could devastate critical water distribution and transportation networks for Arizona, Nevada, Southern California and Mexico, along with the homes and businesses of tens of thousands of people.
Historically, fl ood control storage has not been a high priority for managers of the Colorado River system, requiring just 5.35 MAF annually to be available
system-wide at the beginning of each year.65 It was this low requirement that allowed the 1983 problems at Glen Canyon Dam to materialize. By eliminating Lake Powell and operating Lake Mead for effi cient ground water diversions, nearly four times the current fl ood control protection could be achieved.66
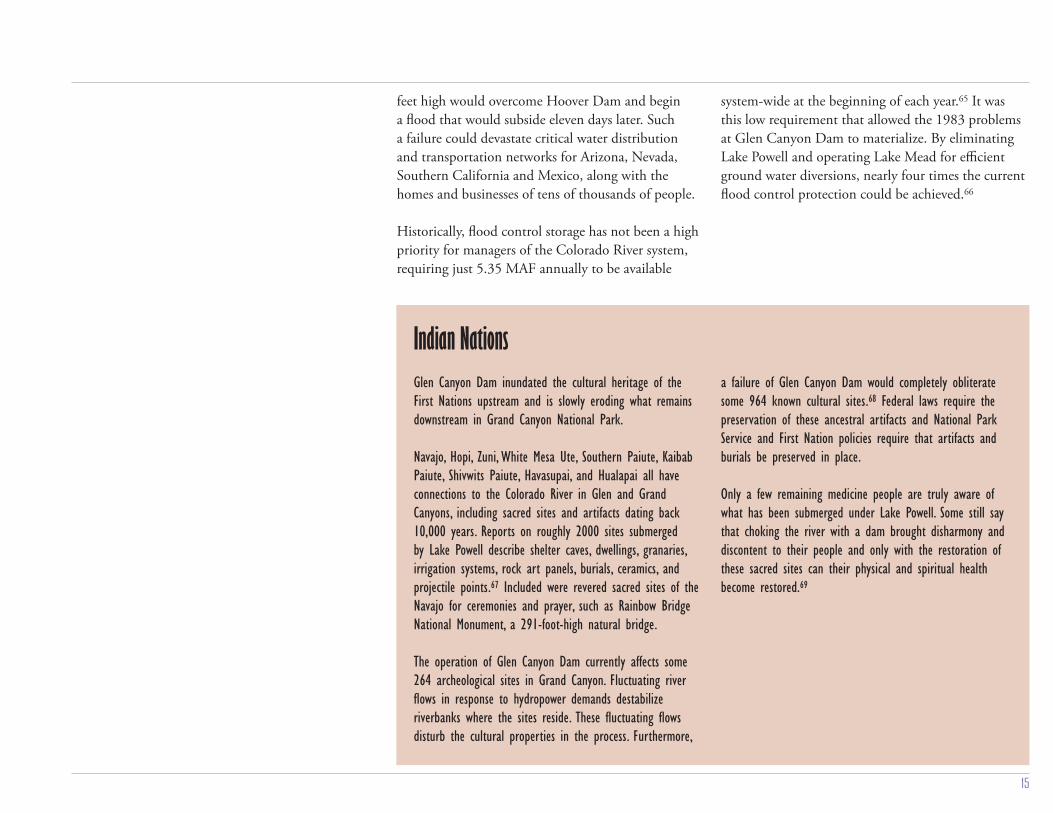
Glen Canyon Dam inundated the cultural heritage of the First Nations upstream and is slowly eroding what remains downstream in Grand Canyon National Park.
Navajo, Hopi, Zuni, White Mesa Ute, Southern Paiute, Kaibab Paiute, Shivwits Paiute, Havasupai, and Hualapai all have connections to the Colorado River in Glen and Grand Canyons, including sacred sites and artifacts dating back 10,000 years. Reports on roughly 2000 sites submerged by Lake Powell describe shelter caves, dwellings, granaries, irrigation systems, rock art panels, burials, ceramics, and projectile points.67 Included were revered sacred sites of the Navajo for ceremonies and prayer, such as Rainbow Bridge National Monument, a 291-foot-high natural bridge.
The operation of Glen Canyon Dam currently affects some 264 archeological sites in Grand Canyon. Fluctuating river fl ows in response to hydropower demands destabilize riverbanks where the sites reside. These fl uctuating fl ows disturb the cultural properties in the process. Furthermore,
a failure of Glen Canyon Dam would completely obliterate some 964 known cultural sites.68 Federal laws require the preservation of these ancestral artifacts and National Park Service and First Nation policies require that artifacts and burials be preserved in place.
Only a few remaining medicine people are truly aware of what has been submerged under Lake Powell. Some still say that choking the river with a dam brought disharmony and discontent to their people and only with the restoration of these sacred sites can their physical and spiritual health become restored.69
Indian Nations
16
Re-examine the Colorado River CompactSince the Colorado River Compact was approved in 1922 over-allocation, reduced supply and population growth have greatly altered the ability of the Compact to serve its intended purposes.
Th e goals of the Compact are “to provide for equitable division and apportionment of the use of the waters of the Colorado River System; to establish the relative importance of diff erent benefi cial uses of water; to promote interstate comity; to remove causes of present and future controversies; and to secure the expeditious agricultural and industrial development of the Colorado River basin, the storage of its waters, and the protection of life and property from fl oods.”74
Th e Compact has not achieved an “equitable division” of water for the constituency. With the river providing on average 13.5 MAF (instead of the 15 MAF allocated by the Compact), and with Mexico receiving 1.5 MAF, just 12 MAF remains for the two basins. Th e Lower Basin is guaranteed 6.75 MAF (7.5 MAF minus its 0.75 MAF contribution to Mexico). Th us, in the best of circumstances the Upper Basin could on average count on just 5.25 MAF (13.5 MAF of river fl ow minus 7.5 MAF of Lower Basin consumption minus its own 750,000 AF contribution to Mexico) or 22 percent less than the Lower Basin.
Th e Compact lacks provisions for addressing real shortages. Th e lowering of Lake Powell and present climate conditions render this an immediate possibility today, and medium- to long-term supply and demand trends suggest that this situation is not likely to improve in the future. If Lake Powell is empty there may be times when the Upper Basin may not be able to meet its 8.23 MAF obligation to the Lower Basin.
A responsible attempt to craft a new agreement that refl ects the reality of river supply must be initiated. Th is could be done by adjusting allocations annually to refl ect actual river fl ows. It is becoming more evident that the current system, which evaluates the allocation to the Upper Basin after its delivery to the Lower Basin has been satisfi ed, has needlessly delayed prudent approaches to ensure balance in the system and to meet the challenges of future shortages.
Th e Compact establishes the most important use of Colorado River water to be domestic and agricultural purposes, with other uses subservient. Th e destruction of Grand Canyon’s river ecosystem illustrates how important environmental considerations are as well. But nothing illustrates the environmental challenge more clearly than the demise of the Colorado River delta, where reduction in fl ows has caused the ecosystem to virtually disappear.75 Future discussions of allocation must therefore include environmental fl ows.
Th e decommissioning of Glen Canyon Dam and the expansion of aquifer storage systems is not only consistent with this priority, but actually better facilitates the achievement of Compact purposes. Lake Mead can capture surplus water and ensure its storage for the Lower Basin, in the reservoir and through groundwater aquifers. Furthermore, as noted in Article VIII of the Compact, only 5 MAF of storage is needed in the Lower Basin to safeguard its perfected rights. Lake Mead on its own clearly satisfi es this requirement.
Th e Compact does not provide for an equitable and timely means to reduce allocations. In order to avert major complications a basin-wide evaluation of current water use, coupled with an assessment of
17
senior-perfected water rights, needs to be conducted. With this information, a systematic plan to allocate water rights between the states, Tribes and Mexico can
be achieved, and will minimize future impacts to the economy and the environment.
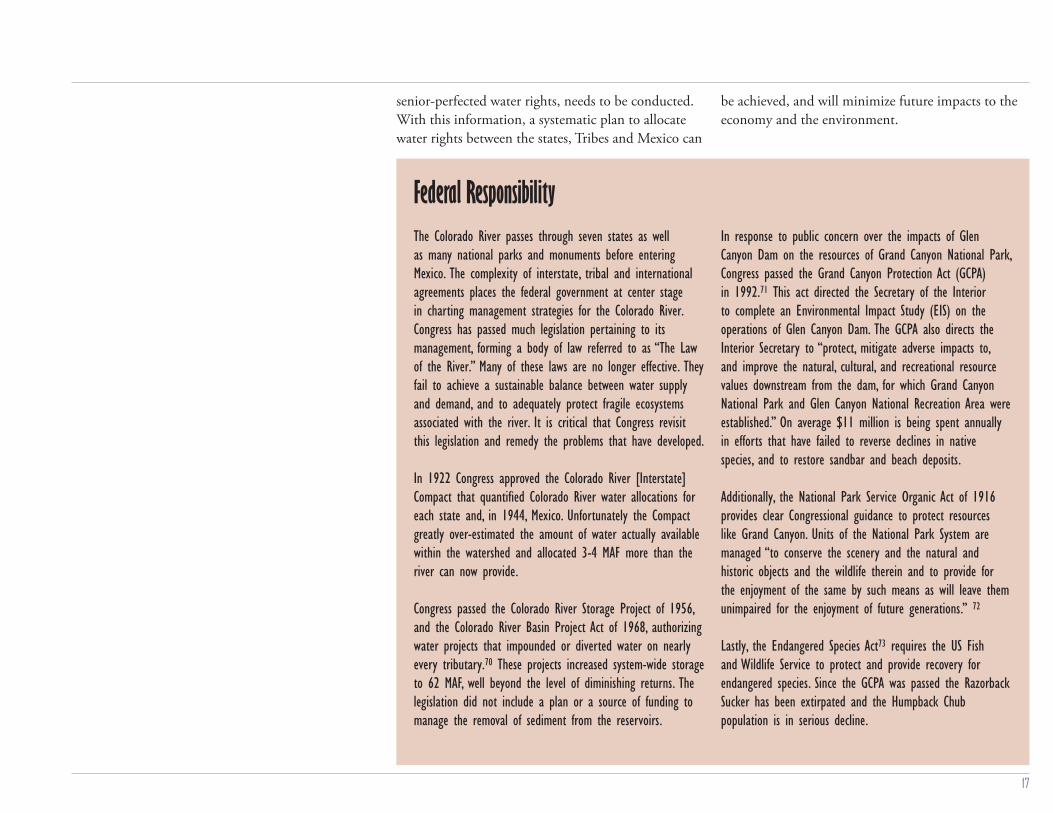
The Colorado River passes through seven states as well as many national parks and monuments before entering Mexico. The complexity of interstate, tribal and international agreements places the federal government at center stage in charting management strategies for the Colorado River. Congress has passed much legislation pertaining to its management, forming a body of law referred to as “The Law of the River.” Many of these laws are no longer effective. They fail to achieve a sustainable balance between water supply and demand, and to adequately protect fragile ecosystems associated with the river. It is critical that Congress revisit this legislation and remedy the problems that have developed.
In 1922 Congress approved the Colorado River [Interstate] Compact that quantifi ed Colorado River water allocations for each state and, in 1944, Mexico. Unfortunately the Compact greatly over-estimated the amount of water actually available within the watershed and allocated 3-4 MAF more than the river can now provide.
Congress passed the Colorado River Storage Project of 1956, and the Colorado River Basin Project Act of 1968, authorizing water projects that impounded or diverted water on nearly every tributary.70 These projects increased system-wide storage to 62 MAF, well beyond the level of diminishing returns. The legislation did not include a plan or a source of funding to manage the removal of sediment from the reservoirs.
In response to public concern over the impacts of Glen Canyon Dam on the resources of Grand Canyon National Park, Congress passed the Grand Canyon Protection Act (GCPA) in 1992.71 This act directed the Secretary of the Interior to complete an Environmental Impact Study (EIS) on the operations of Glen Canyon Dam. The GCPA also directs the Interior Secretary to “protect, mitigate adverse impacts to, and improve the natural, cultural, and recreational resource values downstream from the dam, for which Grand Canyon National Park and Glen Canyon National Recreation Area were established.” On average $11 million is being spent annually in efforts that have failed to reverse declines in native species, and to restore sandbar and beach deposits.
Additionally, the National Park Service Organic Act of 1916 provides clear Congressional guidance to protect resources like Grand Canyon. Units of the National Park System are managed “to conserve the scenery and the natural and historic objects and the wildlife therein and to provide for the enjoyment of the same by such means as will leave them unimpaired for the enjoyment of future generations.” 72
Lastly, the Endangered Species Act73 requires the US Fish and Wildlife Service to protect and provide recovery for endangered species. Since the GCPA was passed the Razorback Sucker has been extirpated and the Humpback Chub population is in serious decline.
Federal Responsibility
18
ConclusionColorado River water managers have long ignored resolving administrative and structural problems aff ecting a critical component of the Southwest’s water supply. Continued inaction will invite confl ict, forcing a response to emerge from crisis as opposed to reason. More likely than not, reactionary decisions would compound the problem, merely providing an urgent response to solve a minor detail and avoiding movement towards a comprehensive solution for the watershed.
Th e leadership in the Bureau of Reclamation has not stepped forward in this regard. As concern over the present drought intensifi ed, the agency merely stated that the reservoirs were performing as intended: delivering water in times of shortage.76 Planners must re-examine how effi cient the system really is based on the reality of increased demand and decreased supply. Th is must include how Colorado River water, whatever the amount nature chooses to provide, can be stored as effi ciently as possible.
In so doing, planners should not be impeded by the other incidental uses of Colorado River water, such as power generation and recreation. Th e prevailing need is to manage the river’s fi nite water supply as effi ciently as possible. Th ough power production and recreation have substitutes, there is no substitute for Colorado River water.
Nor are there substitutes for the ecosystems impacted by water projects on the Colorado River. Grand Canyon National Park is a core element of
our natural heritage and laws have been enacted specifi cally to ensure its protection. Nonetheless, dam operations continue to undermine the famous ecosystems of the Colorado River.
With these issues in mind, and in conjunction with a larger objective of achieving sustainable water management and ecological restoration on the Colorado River, it is recommended that future operations of Lake Powell and Lake Mead be explored in conjunction with a much broader evaluation to:
1) Pursue transfers of Lake Powell and Lake Mead storage to groundwater aquifers.
2) Develop a sustainable sediment management program for Lake Powell and Lake Mead.
3) Determine the costs and benefi ts of decommissioning Glen Canyon Dam to restore natural fl ows through Glen and Grand Canyons.
4) Identify new water allocation guidelines to refl ect the amount of water the Colorado River actually provides, how it should be distributed and what amounts are needed to protect critical habitats in Grand Canyon and elsewhere.
19
Notes1. Historic evaporation losses for Colorado River main stem reservoirs have averaged 1.8 million acre-feet (MAF) annually (not adjusted for the river’s natural evaporation), 13 percent of the river’s average annual paleoclimatic fl ow of 13.5 MAF.—Bureau of Reclamation. Upper Colorado Region: Water Operations. “Table LC-1 and UC-1.” Colorado River System Consumptive Uses and Losses Report (1971-2000).
Th e paleoclimatic stream fl ow of 13.5 MAF at the Compact Point (Lee’s Ferry, Arizona) is based on a 400-year, tree-ring database.—Stockton, C. W. and G. C. Jacoby. “Long Term Surface Water Supply and Stream Flow Trends in the Upper Colorado River Basin.” Lake Powell Research Project Bulletin No. 18 (University of California at Los Angeles: Institute of Geophysics and Planetary Physics, 1976).
A tree-ring reconstruction study completed in 2000 has proposed the long-term yield for the Colorado River is 13.2 MAF.—Hidalgo, Hugo G., Th omas C. Piechota and John A. Dracup. “Alternative Principal Components Regression Procedures for Dendrohydrologic Reconstructions.” Water Resources Research, Vol. 36, No. 11 (November, 2000), 3241-3249.2. On average, Lake Powell evaporates 516,000 acre-feet (AF) and Lake Mead evaporates 828,000 AF for a total of 1.34 MAF, 10 percent of the average annual paleoclimatic fl ow.—See: Note 1 (Bureau of Reclamation).3. Arizona has approximately 15 MAF of available groundwater storage along the Central Arizona Project at existing, direct aquifer recharge facilities.—Robson, S. G. and E. R. Banta. Ground Water Atlas of the United States. U.S. Geological Survey Atlas HA 730-C (1995), fi gures 42 and 43.Online: http://capp.water.usgs.gov/gwa/ch_c/C-text3.html—Tim Henley, Arizona Water Banking Authority. Personal communication, June 30, 2005.—Another 25-46 MAF may be available in the state when considering nearby aquifer volume minus aquifer depletion as reported by the U.S. Geological Survey Ground Water Atlas (above).
California has the potential to store 26 MAF of Colorado River water underground along the Colorado Aqueduct.—California Department of Water Resources. California’s Groundwater: Bulletin 118 (Updated in 2003 with aquifer storage capacity estimates).—Bill Hassencamp, Metropolitan Water District. Personal communication, July 18, 2005.—Mark Buehler, Coachella Valley Water District. Personal communication, July 18, 2005.4. Bureau of Reclamation. Upper Colorado Region: Water Operations. “Operations Summary and Reservoir Status.” Annual Operating Plan for the Colorado River System Reservoirs (2000–
2006).—Bureau of Reclamation. Upper Colorado Region: Water Operations. “Benefi cial Consumptive Uses and Losses.” Colorado River System Consumptive Uses and Losses Report (1971–2000). 5. Webb, Robert H., Gregory J. McCabe, Richard Hereford and Christopher Wilkowske. Climatic Fluctuations, Drought, and Flow in the Colorado River Basin. U.S. Geological Survey Fact Sheet 2004-3062 (June, 2004).6. Cook, Edward R., Connie A. Woodhouse, C. Mark Eakin, David M. Meko and David W. Stahle. “Long-Term Aridity Changes in the Western United States.” Science Vol. 306 (November 5, 2004), 1015-1018.7. Dawdy, David R. “Hydrology of Glen Canyon and Grand Canyon,” Colorado River Ecology and Dam Management: Proceedings of a Symposium May 24-25, 1990. Santa Fe, New Mexico (Washington D.C.: Academy Press, 1991), 46. 8. See: Note 1 (Stockton et al and Hidalgo et al).9. Based on the 8.25 MAF delivered at the Compact Point (Lee’s Ferry, Arizona) plus Upper Basin consumption of 4.4 MAF for a total of 12.65 MAF.—Bureau of Reclamation. Upper River Region: Water Operations. “Upper Colorado River Tributaries.” Colorado River System Consumptive Uses and Losses Report (1996-2000), 14.10. Christensen, Niklas S., Andrew Wood, Nathalie Voisin, Dennis P. Lettenmaier and Richard N. Palmer. Th e Eff ects of Climate Change on the Hydrology and Water Resources of the Colorado River Basin (2004), 1-2.11. See: Note 1 (Stockton et al and Hidalgo et al).12. See: Note 5 (Webb et al).—Gray, Stephen T., Stephen T. Jackson and Julio L. Betancourt. “Tree-Ring Reconstructions of Interannual to Decadal Scale Precipitation Variability for Northeastern Utah Since 1226 A.D.” Journal of the American Water Resources Association (August, 2004), 947-960.13. Government Accounting Offi ce. Comptroller General’s Report to the Congress. Colorado River Basin Water Problems: How to Reduce Th eir Impact CED-79-11 (1979), 1.14. See: Note 4 (Bureau of Reclamation).15. See: Note 10 (Christensen et al).16. See: Note 1 (Bureau of Reclamation).17. Langbein, Walter B. Water Yield and Reservoir Storage in the United States. U.S. Geological Survey Circular 409 (1959).18. See: Notes 1 & 2 (Bureau of Reclamation).19. Bureau of Reclamation. Upper Colorado Region: Water Operations. 24-Month Study Reports. (Lake Powell and Lake Mead bank storage columns.)Online: http://www.usbr.gov/uc/water/crsp/studies/index.html20. With wholesale prices of Colorado River water of at least $258 per acre-foot, and average annual evaporation losses of Lake Powell and Lake Mead of 0.516 and 0.828 MAF respectively (not adjust-
20
ed for the river’s natural evaporation), and results in $347 million in economic losses.—San Diego County Water Authority. Historic Water Transfer Agreement Gets Final Approval as QSA Falters. San Diego Water Authority press release (December 31, 2002).21. Average annual rate of sedimentation in Lake Mead is estimat-ed to be 102,000 AF, representing a total of 2.86 MAF deposited over the 28 years Hoover Dam operated prior to the completion of Glen Canyon Dam, or 10 percent of Lake Mead’s storage capacity.—Smith, W. O., C. P. Vetter, and G. B. Cummings. Comprehensive Survey of Sedimentation in Lake Mead, 1948-49. U.S. Geological Survey Professional Paper 295 (1960), 195 & 231.22. Schultz, Ernest R. Design Features of Glen Canyon Dam: Paper for Presentation at ASCE April, 1961 Convention. (Phoenix: Bureau of Reclamation Construction Division), 30.23. Spangler, Jerry. “Draining Powell Called a Pipe Dream.” Deseret News. Salt Lake City (June 18, 2002). 24. Dohrenwend, John C. “Rapid Progradation of the Colorado and San Juan River Deltas into Lake Powell Reservoir, July 2002 to March 2004.” Four Corners Geological Society Newsletter, April 2004. (Durango, Colorado), 4.—University of Arizona. Exposed Upper Colorado River Delta is Rapidly Eroding into Lake Powell. University of Arizona press re-lease (May 7, 2003).25. Graf, William L. Th e Colorado River: Instability and Basin Management. (Washington D.C.: Association of American Geographers, 1985), 34.—Hereford, Richard. “Valley-Fill Alluviation (ca. 1400-1880) During the Little Ice Age, Paria River Basin and Southern Colorado Plateau, U.S.A.” Geological Society of America Bulletin v. 114 (2002), 1550-1563.26. Andrews, Edmund D. “Sediment Transport in the Colorado River Basin.” Colorado River Ecology and Dam Management: Proceedings of a Symposium May 24-25, 1990 Santa Fe, New Mexico. (Washington D.C.: Academy Press, 1991), 68.27. Annual sediment of 44 million tons would require ap-proximately two million truckloads at standard loads of 22 tons per truck. Th e distance from Lake Powell’s Hite Marina to the Colorado River delta is 1,300 miles round trip, requiring a fl eet of 15,000 trucks working around the clock. At $1 per mile per truck, the total operating costs alone would be $2.6 billion annually.—Owner-Operator Independent Drivers Association. Cost Per Mile Worksheet. Online: http://www.ooida.com/trucking_tools/CPM/cost_per_mile_print.htm28. Th e average annual water fl ow entering Lake Powell since 1963 is estimated to be 10.9 MAF. When full, Lake Powell can cause the loss of 606,000 AF (1999). When the remainder of this water fl ows into Lake Mead, when it is full, another 1.23 MAF (1999) can be lost. Combined, this represents 1.84 MAF lost, or
17 percent of the 10.9 MAF infl ows.—Bureau of Reclamation. Upper Colorado Region: Water Operations. Historic Data: Lake Powell Infl ows. Online: http://www.usbr.gov/uc/crsp/GetSiteInfo—See: Note 9 (Bureau of Reclamation), 21 & 31.29. Artifi cial recharge projects in Arizona using Colorado River water have reported evaporation losses of one percent or less.—Central Arizona Project. Groundwater Recharge Projects: Operations. Online:http://www.cap-az.com/recharge/index.cfm?action=Aqua&subSection=7030. Robson, S. G. and E. R. Banta. Ground Water Atlas of the United States. U.S. Geological Survey Atlas HA 730 (1995).Online: http://capp.water.usgs.gov/gwa/gwa.html31. Th e Southern Nevada Water Authority currently has agreements to store 1.25 MAF in the state of Arizona.—Southern Nevada Water Authority. Southern Nevada Water Authority Water Resources Plan (2005), 3:19.32. Eliminating Lake Powell would save on average 414,000 AF of evaporation losses (516,000 AF of annual evaporation loss minus 102,000 AF lost (see Myers below) from river evaporation).—Myers, Tom. Water Balance of Lake Powell: An Assessment of Groundwater Seepage and Evaporation. (Salt Lake City: Glen Canyon Institute, 1999), 3.
Maintaining Lake Mead’s useable storage (not including dead pool storage) to 5 MAF (1,007 feet above sea level), the minimum required by the Colorado River Compact would reduce its average annual evaporation from 828,000 AF to approximately 433,000 AF. —Stanley, J. W. “Chapter I: Reservoir Storage.” Comprehensive Survey of Sedimentation in Lake Mead, 1948–49. U.S. Geological Survey Professional Paper 295 (1960), 87 & 90.—Langbein, W. B. “Chapter J: Water Budget.” Comprehensive Survey of Sedimentation in Lake Mead, 1948–49. U.S. Geological Survey Professional Paper 295 (1960), 97.33. Th e wettest decade of the historic record (1911–1920) had an average annual surplus of 5 MAF.—California Department of Water Resources. “Observed Natural Flow at Lee’s Ferry.” Colorado River Drought Information.Online: http://www.saltonsea.water.ca.gov/data/co_river.cfm34. Along the Central Arizona Project, existing direct recharge projects have the ability to recharge approximately 900,000 MAF.—Arizona Department of Water Resources. Permitted Projects—December 31, 2003. Online: http://www.water.az.gov/recharge/PermittedFacilities.htm—Virginia O’Connell, Arizona Water Resources Department. Personal communication, July 18, 2005.
Along the Colorado River Aqueduct in California, existing direct recharge projects have the ability to recharge 450,000 AF, and other projects are currently under construction

21
that will bring the total to 700,000 AF.—Bill Hassencamp, Metropolitan Water District. Personal communication, July 18, 2005.—Mark Buehler, Coachella Valley Water District. Personal communication, July 18, 2005.
Las Vegas Nevada has recharged as much as 32,000 AF in one year.—Las Vegas Valley Water District. Las Vegas Valley Water District 2004 Artifi cial Recharge Annual Report (2004), 3.35. Examples of ongoing planning and development for water projects include the Central Utah Project, the Animas-La Plata Project, the Colorado River Return Project, and the Navajo Water Supply Project.36. Bartolino, J. R. and W. L. Cunningham. Ground-Water Depletion Across the Nation. U.S. Geological Survey Fact Sheet 103-03, (February, 2004).37. Glen Canyon Dam only releases 8.23 MAF because the Upper Basin’s Paria River (below the dam and above the Compact Point at Lee’s Ferry, Arizona) contributes 20,000 acre-feet annually for a total of 8.5 MAF.38. Rosekrans, Spreck. Th e Eff ect of Draining Lake Powell on Water Supply and Electricity Production. (San Francisco: Environmental Defense Fund, 1997).39. Without Lake Powell the 21st century drought would have depleted Lake Mead in the fall of 2004. At that time (2004) the combined storage at Lake Mead and Lake Powell was equal to the capacity of Lake Powell when it was nearly full in July 1999 (23.5 MAF).—Bureau of Reclamation. Lower Colorado Region: Water Operations. Historic Data: Lake Mead Levels.Online: http://www.usbr.gov/lc/region/g4000/hourly/mead-elv.html—Bureau of Reclamation. Upper Colorado Region: Water Operations. Historic Data: Lake Powell Levels. Online: http://www.usbr.gov/uc/crsp/GetSiteInfo40. In 1999, Lake Powell was nearly full and stored 23.5 MAF of water. Lake Powell’s average annual evaporation is 414,000 AF (after deducting 102,000 AF for river evaporation were the dam not there) and the total after 41 years of operation is 17.0 MAF. Th e total lost to seepage at Lake Powell is 18.7 MAF, for a total of 35.7 MAF (evaporation and seepage). It has therefore required a grand total of 59.2 MAF to obtain the 23.5 MAF actually used. Th is 23.5 MAF is just 40 percent of the total.—See: Note 9 (Bureau of Reclamation), 23 & 31.—See Note 19 (Bureau of Reclamation).41. Bureau of Reclamation. Upper Colorado Region: Water Operations. Historic Data: Lake Powell Infl ow & Release. Online: http://www.usbr.gov/uc/crsp/GetSiteInfo42. Bureau of Reclamation. Lower Colorado Region Water Operations. “Colorado River Water Use Since 1906.”
Online: http://www.usbr.gov/lc/region/g4000/uses.html—Department of the Interior: Bureau of Reclamation. “Attachment K. Upper Basin Depletion Schedule.” Colorado River Surplus Criteria Final Environmental Impact Statement (2000).43. See: Note 10 (Christensen et al).44. National Park Service: Grand Canyon National Park. Endangered, threatened, and sensitive wildlife of potential occurrence along the Colorado River in Grand Canyon. Online: http://data2.itc.nps.gov/nature/documents/ACF18EB.doc45. Department of the Interior. Report to Congress: Operations of Glen Canyon Dam Pursuant to the Grand Canyon Protection Act of 1992, Water Years 1999-2001, Secretary of the Interior (May, 2002), 2-8.46. Experts believe the fourth species to be extirpated (regionally extinct) in the Grand Canyon is the Razorback Sucker.—National Park Service: Grand Canyon National Park. Grand Canyon National Park Profi le (2004), 2.
A total of $223 million has been invested in mitigating Glen Canyon Dam’s impacts on Grand Canyon.—Updike, Christopher N. and Steven P. Gloss. “Confronting Social Impediments to Adaptive Management: Lessons from the Grand Canyon Ecosystem.” Grand Canyon Monitoring and Research Center: Colorado River Ecosystem Science Symposium, (October, 2003).47. See: Note 45 (Department of the Interior), 22-27.48. U.S. Fish and Wildlife Service. Final Biological Opinion on the Operation of Glen Canyon Dam (January, 1995), 33.49. Th e National Park Service Organic Act (16 U.S.C. l 2 3, and 4), as set forth herein, consists of the Act of Aug. 25 1916 (39 Stat. 535) and amendments thereto.50. See: Note 45 (Department of the Interior).51. National Academy of Sciences: Commission on Geosciences, Environment and Resources. River Resource Management in the Grand Canyon (Washington D.C.: Academy Press, 1996), 4.—Bureau of Reclamation. Upper Colorado Regional Offi ce: Glen Canyon Dam Adaptive Management Program. Fiscal Year 2006 Budget & Work Plan (March, 2005), 19 & Worksheet 4. 52. Haden, G. Allen, Dean W. Blinn, Joseph P. Shannon, and Kevin P. Wilson. “Driftwood: An Alternative Habitat for Macroinvertebrates in a Large Desert River.” Hydrobiologia 397 (1999), 179-186.53. Based on the average annual output of Glen Canyon Dam (5,166,000 MWh), and average annual Arizona residential electricity use at 13,300 kWh per household.—Southwest Energy Effi ciency Project. Arizona: Energy Effi ciency and Energy Consumption. (Boulder, Colorado: Southwest Energy Effi ciency Project).54. Bureau of Reclamation. Drought or Opportunity: Remarks Delivered by John W. Keys, III, Commissioner, Bureau of Reclamation, Colorado River Water Users Association, 2003 Annual

22
Meeting, Las Vegas. Bureau of Reclamation press release (December 12, 2003).
Power generation for 2004 from Colorado River Storage Project dams, of which Glen Canyon is the primary contributor, dropped 40 percent from when the reservoir was near full in 1999.—Western Area Power Administration. “Salt Lake City Area/Integrated Projects: Powerplants”. Annual Report: Statistical Appendix (1999-2004).Online: http://www.wapa.gov/newsroom/pubs.htm55. See: Note 51 (National Academy of Sciences), 65.56. Western Area Power Administration. “Continued Drought Brings Many Questions.” Closed Circuit (May 28, 2004).57. From 2000-2004 repayments to the federal treasury for projects in the Colorado River Storage Project Act averaged just $6.2 million on an outstanding loan due in 2050 of $2.6 billion.—See: Note 54 (Western Area Power Administration).58. National Park Service: Public Use Statistics Offi ce. Visitation.Online: http://www2.nature.nps.gov/stats/59. Aramark Corporation. Powell Resorts & Marinas Announces Seasonal Operating Schedule. Aramark press release (October 19, 2004).60. National Park Service. $22 Million in Facility Improvement Projects Completed or Ongoing at Glen Canyon National Recreation Area. Glen Canyon National Recreation Area press release (October 4, 2004).61. Jonas, Lilian. Lake Powell Preliminary Socioeconomic Impact Analysis. (Salt Lake City: Glen Canyon Institute, 1999), 27.62. Ibid, 30.63. Carothers, Steven W. and Bryan T. Brown. Th e Colorado River through Grand Canyon: Natural History and Human Change. (Tucson: University of Arizona Press, 1991), 26-29.64. Latham, Stephen E. Glen Canyon Dam, Arizona: Dam Failure Inundation Study. (Denver: Bureau of Reclamation, 1998), 7-9.65. Bureau of Reclamation. Lower Colorado Region: Water Operations. “Flood Control Operation.” Colorado River Interim Surplus Criteria, Final Environmental Impact Statement (2000), 1:20–21.66. Operating Lake Mead at 1007 feet above sea level to reduce evaporative losses would leave on average 21 MAF of fl ood control storage, nearly four times the present 5.35 MAF system-wide requirement.—Ibid, 1:17.67. Geib, Phil R. Glen Canyon Revisited: University of Utah Anthropological Paper 119. (Salt Lake City: University of Utah Press, 1996), 1.68. Grand Canyon National Park and Northern Arizona University. 1999 Summary Report: Archeological Site Monitoring and Management along the Colorado River corridor in Grand Canyon National Park (Executive Summary).69. Luckert, Karl W. Navajo Mountain and Rainbow Bridge
Religion (Flagstaff : Museum of Northern Arizona, 1977).70. Colorado River Storage Project Act. 43 U.S.C. §§ 620-620o, April 11, 1956, as amended 1962, 1964, 1968 and 1980.
Colorado River Basin Project Act. 43 U.S.C. §§ 1501-1556, September 30, 1968, as amended 1974, 1978, 1980, 1982, 1984 and 1992.71. Reclamation Projects Authorization and Adjustment Act of 1992. Title XVIII–Grand Canyon Protection, Section 1803-1806.72. See: Note 49 (National Park Service Organic Act).73. Endangered Species Act. 7 U.S.C. 136; 16 U.S.C. 460 et seq. 1973.74. Colorado River Compact. Signed at Santa Fe, New Mexico. Ratifi ed by act of Congress December 21, 1928. 45 Stat. 1057. Congressional Record, 70th Cong. 2d Sess. At 324-325.75. Newcom, Joshua S. “Deciding About the Colorado River Delta: Rejuvenated Wetlands Raise New Issues About Where Flood Flow Should Go.” River Report, Spring 1999 (Sacramento: Water Education Foundation).76. Reese, April. “Current Colorado River Basin Dry Spell Could Be Worst in 500 Years.” Land Letter. Washington D.C. (June 24, 2004).
From the Rocky Mountains through seven states and Mexico, the Colorado River is the artery of the desert southwest. A healthy river system is essential to the ecological integrity of the Colorado Plateau just as a well managed water resource is essential to the economic health and prosperity of the river basin states that depend on Colorado River water. However, mismanagement, greed and complacency are robbing the Colorado of its ability to achieve its ecological and economic potential.
Living Rivers/Colorado Riverkeeper empowers a movement to instill a new ethic of achieving ecological restoration that is balanced with also meeting human needs. We work to:
• Restore aquatic and riparian ecosystems along the river and its delta.
• Repeal antiquated laws which are resulting in chronic ecological damage and the wasting of water resources.
• Reduce unnecessary water use and its impacts on river ecology and the economy.
• Recommend sustainable solutions to Colorado River water resource management.
• Recruit constituents to aid in achieving a healthy and sustainable Colorado River system.