Embed Size (px)
Citation preview
http://asr.sagepub.com/American Sociological Review
http://asr.sagepub.com/content/71/1/95The online version of this article can be found at:
DOI: 10.1177/000312240607100105
2006 71: 95American Sociological ReviewRoss L. Matsueda, Derek A. Kreager and David Huizinga
Deterring Delinquents: A Rational Choice Model of Theft and Violence
Published by:
http://www.sagepublications.com
On behalf of:
American Sociological Association
can be found at:American Sociological ReviewAdditional services and information for
http://asr.sagepub.com/cgi/alertsEmail Alerts:
http://asr.sagepub.com/subscriptionsSubscriptions:
http://www.sagepub.com/journalsReprints.navReprints:
http://www.sagepub.com/journalsPermissions.navPermissions:
http://asr.sagepub.com/content/71/1/95.refs.htmlCitations:
at Serials Records, University of Minnesota Libraries on January 10, 2011asr.sagepub.comDownloaded from
Rational choice theories have advanced con-siderably in the social sciences, particular-
ly in economics, political science, and law (e.g.,Morrow 1994; Posner 1998; Sunstein 1999).In sociology, especially with the popularity ofsocial capital theory, rational choice has gainedtraction as an individual-level theory of moti-vation compatible with macro-level theories of
social structure (Coleman 1990). Nevertheless,skepticism in sociology persists, in part due tomisconceptions, but more importantly due toquestions about the explanatory power of ration-al choice theories. Proponents and skeptics alikeagree that a fair assessment of the theory askswhether it has paid off empirically. Hechter andKanazawa (1997) conclude that some empiricalstudies support rational explanations (some-times unwittingly) in areas beyond marketbehavior, but that additional research is need-ed to examine rational choice theory in a vari-ety of areas of social life and forms of socialaction.
A challenging and important empirical puz-zle for rational choice theory concerns thesocial control of criminal behavior. Crime is adifficult case for rational choice theory. In thecase of street crime, behavior is typically char-acterized as irrational and suboptimal. This isin contrast to market behavior, financial deci-sions, and corporate crime, where institution-alized norms frame decision making in theterms of rationality or optimality. Indeed, themedia—and some academics—commonly por-tray street criminals as impulsive, unthinking,
Deterring DDelinquents: A RRational CChoice MModel oof TTheft aand VViolence
Ross L. Matsueda Derek A. KreagerUniversity of Washington University of Washington
David HuizingaUniversity of Colorado
This article examines criminal behavior from a rational choice perspective, the set of
behavioral principles underlying our legal institution. The authors use a subjective utility
approach and specify experiential learning models of the formation of risk perceptions
and rational choice models of theft and violence. They estimate the models using panel
data on high risk youth from the Denver Youth Survey. Using random effects Tobit models
of perceived risk and negative binomial models of counts of criminal acts, the authors
find support for a rational choice model. Perceived risk follows a Bayesian updating
model in which current risk perceptions are a function of prior risk perceptions plus new
information based on experience with crime and arrest and observations of peers. Theft
and violence are a function of the perceived risk of arrest, subjective psychic rewards
(including excitement and social status), and perceived opportunities.
AMERICAN SOCIOLOGICAL REVIEW, 22006, VVOL. 771 ((February:95–122)
#2714-ASR 71:1 filename:71105-Matsueda
Direct correspondence to Ross L. Matsueda,Department of Sociology, Box 353340, University ofWashington, Seattle, WA 98195 ([email protected]). Supported by grants from theNational Science Foundation (SES-0004323), theRoyalty Research Fund of the University ofWashington, and the Office of Juvenile Justice andDelinquency Prevention (1996-MU-FX-0017). Thefunding agencies bear no responsibility for the analy-ses and interpretations drawn here. This article is arevised version of a paper presented at the annualmeetings of the American Sociological Association,Atlanta, August 16–19, 2003. The authors thankIrving Piliavin for helping to design the rationalchoice instrument used here; and Kate Stovel, GregPogarsky, three anonymous reviewers, and the ASReditor for comments on an earlier draft.
at Serials Records, University of Minnesota Libraries on January 10, 2011asr.sagepub.comDownloaded from
and uneducated, and their behaviors as beyondthe reach of formal sanctions (e.g., Gottfredsonand Hirschi 1990). Thus, a finding that streetcrimes follow rational choice principles wouldprovide strong evidence for rational choice per-spectives.
Crime is an important arena for investigatingrational choice for another reason: Utilitarianprinciples, and their accompanying psycholog-ical assumptions, undergird our legal institution(e.g., Maestro 1973). This connection is rootedin writings of the classical school. Long ago,Bentham ([1789] 1948) argued that happinessis a composite of maximum pleasure and min-imum pain, and that the utilitarian principle—the greatest happiness for the greatestnumber—underlies morals and legislation. ForBentham, punishment by the state constitutesone of four sanctions—political, moral, physi-cal, and religious—that shape pleasures andpains. Beccaria ([1764] 1963), influenced by themoral philosophers of the Enlightenment,assumed that criminal laws reflect the terms ofa social contract, in which members of societyreceive protection of their rights to personalwelfare and private property in exchange forrelinquishing the freedom to violate the rightsof others. Those rights are protected by the statethrough deterrence, threatening potential trans-gressors with just enough punishment to out-weigh the pleasures of crime.1 Beccariaattempted to reform the unjust and brutal legalsystem of eighteenth-century Europe by devel-oping a rational system that specified laws clear-ly and a priori (so individuals have fullinformation about the consequences of theiracts), eliminated judicial discretion (so all cit-izens are equal in the eyes of the law), and madepunishments certain, swift, and no more severethen needed to deter the public from crime.
Critical legal scholars, however, challengethis view of the legal system. They see the sys-tem as an ideological justification (manifestfunction) of modern capitalist societies, whichdisguises its true essence (latent function) aslegitimizing inequitable class relations. For
example, Pashukanis ([1929] 1978:169) devel-ops a Marxist commodity exchange theory oflaw, whereby under capitalism, punishmentbecomes an exchange “in which the offender‘pays his debt’ and wherein crime becomes ‘aninvoluntarily concluded contract’” (Garland1990:113). For Garland (1990:117), “the key tounderstanding criminal law in class terms is toappreciate the ways in which particular interestsare interwoven with general ones,” such thatprotection of class interests are disguised asprotection of universal interests. As for deter-rence, he argues that “the simple fact is that nomethod of punishment has ever achieved highrates of reform or of crime control—and nomethod ever will” (Garland 1990:228). Ourpurpose is not to adjudicate between views ofthe legal system as a mechanism for achievingthe greatest happiness for the greatest number,as Bentham ([1789] 1948) and Beccaria ([1764]1963) argue, or as a tool for exercising “classterror” and mystifying class relations, asPashukanis and Garland argue. Rather, ourobjective is to examine the question of ration-al choice and deterrence, which cuts to the coreof assumptions underlying our legal institution.Do individuals act as if they are rational andrespond to incentives, as rational choice andclassical theorists assume? Or does conformi-ty lie principally outside the purview of pun-ishment and rational choice as Garland andother sociologists of law maintain?
Recent treatments of rational choice anddeterrence follow Becker’s (1968) seminal arti-cle outlining an expected utility model of crim-inal decision making (see McCarthy 2002).Becker’s model specifies that individuals willengage in crime when expected utility fromcommitting crime is greater than expected util-ity from not committing crime. The utility func-tion, in turn, is a function of two additivecomponents: (1) the utility of returns from crime(the “booty”) weighted by the objective proba-bility of getting away with it; plus (2) the util-ity of returns minus the punishment, eachweighted by the objective probability of gettingcaught and punished.
Early empirical studies of Becker’s modeluse statistical models of aggregate crime ratesand focus on deterrent effects of risk of impris-onment (measured by imprisonment per capi-ta) or risk of arrest (measured by arrests perreported crimes). Ehrlich (1973) found deterrent
96—–AMERICAN SSOCIOLOGICAL RREVIEW
#2714-ASR 71:1 filename:71105-Matsueda
1 The form of U.S. criminal laws reflects utility anddeterrence theories: rather than moralizing aboutillegal acts, the statutes stipulate, simply and dis-passionately, that whosoever engages in a certaincrime will be punished with a certain sanction.
at Serials Records, University of Minnesota Libraries on January 10, 2011asr.sagepub.comDownloaded from
effects of imprisonment but scholars criticizedhim for using simultaneous equation modelswith implausible solutions to the identificationproblem—such as assuming socioeconomic sta-tus (SES), region, and population age have noeffect on crime (Nagin 1978). More recent workhas unearthed deterrent effects using more plau-sible instrumental variables. For example,Sampson and Cohen (1988), following the workof Wilson and Boland (1978), use aggressivepolicing as an instrument for risk of arrest (arrestper reported crime). Also, Levitt (1997) uses thetiming of mayoral elections as an instrument fornumber of police per capita (see also Marvelland Moody 1994). For a review of this work, seeNagin (1998).
These tests of the deterrence hypothesisassume that actors know the objective certain-ty of arrest and imprisonment. This is perhapsthe most questionable assumption of expectedutility models. Subjective expected utility mod-els, in contrast, relax this assumption, replacingthe single known objective probability with adistribution of subjective probabilities.Subjective utility models, however, are stillrational models because the statistical mean ofthe subjective probability distribution isassumed to fall on the value of the objectiveprobability (Nagin 1998). Moreover, by speci-fying that subjective costs and returns are thekey determinants of criminal decision making,subjective expected utility models open newpuzzles and new ways of testing rational choice.In particular, we can use direct measures ofsubjective expected costs and returns and exam-ine whether they conform to rational models oftheir causes and consequences.
A crucial subjective cost of crime is the per-ceived risk of formal sanction. The importantpolicy and theoretical question is that of deter-rence: Do individuals with higher perceptionsof the risk of punishment commit fewer crimi-nal acts? Here, prior research is equivocal:Longitudinal panel studies of perceived riskand self reported delinquency find weak or non-significant deterrent effects (Paternoster 1987),whereas vignette studies of perceived risk andintentions to commit crime find significantdeterrent effects (Nagin 1998). We reassessthese results in this article using new data onhigh risk youth.
But returns to crime may be just as importantas costs. Here, a thorny issue involves specify-
ing the relevant perceived rewards of crime forindividuals located within specific structuraland cultural contexts. Obviously, pecuniaryreturns are important for monetary crimes. Butethnographic research suggests that psychicreturns, such as excitement, thrills, and statuswithin peer groups, may be even more impor-tant. Identifying the psychic rewards from ordi-nary street crimes is essential to testing a rationalchoice theory of crime. Moreover, someresearch suggests that perceived rewards dom-inate costs in criminal decision making—pre-sumably because criminals discount formalpunishment due to its long time horizon (e.g.,Carroll 1978; Piliavin et al. 1986). We revisit andreevaluate this finding here.
From both a theoretical and policy stand-point, a question as important as predictingcriminal behavior concerns the formation ofrisk perceptions: Are risk perceptions related toactual experiences of punishment (Nagin 1998)?Rational choice theory assumes that risk per-ceptions are rooted, at least to some degree, inreality. Deterrence theory and policy also makethis assumption—if actual punishments fail toincrease perceptions of risks, punitive policieswill fail (Jacob 1979). Thus, modeling the for-mation of risk perceptions, which requires aninformation theory of risk formation, gives usanother way of testing both rational choice anddeterrence theories.
FORMATION OOF RRISK PPERCEPTIONS:AN EEXPERIENTIAL LLEARNING MMODEL
BAYESIAN LEARNING
An important question in the sociology of riskand decision making concerns how individualsform their perceptions of risk (Tallman andGray 1990; Heimer 1988). This literature con-trasts a Bayesian learning process with alter-native models based on heuristics and biases(Kahneman and Tversky 1972). According to aBayesian learning model—based on Bayes’probability theorem—individuals begin with aprior subjective probability of an event, such asthe risk of arrest, based on all the informationthey have accumulated to that point. They thencollect or come into contact with new infor-mation—such as learning of a friend’s arrest orbeing arrested themselves—which they use toupdate their probability estimates. This newprobability, or “posterior probability,” is a com-
RATIONAL CCHOICE, DDETERRENCE, AAND DDELINQUENCY—–97
#2714-ASR 71:1 filename:71105-Matsueda
at Serials Records, University of Minnesota Libraries on January 10, 2011asr.sagepub.comDownloaded from
bination of the prior probability and the newinformation. Applied to the formation of per-ceived risk, we would expect that updated risksare a function of prior risk plus new informa-tion. Bayesian learning has been examined byeconomists to model consumers’ evaluationsof new products (McFadden and Train 1996), bypolitical scientists to model voting and partyaffiliation (Achen 1992), and by psychologiststo model court testimony scenarios (Winterfeldtand Edwards 1986). Moreover, Nagin (1998)suggested that this model can be applied to theformation of perceptions of the risk of arrest.Such a process is consistent with general sociallearning theories of crime (e.g., Akers 1998).
Cognitive psychologists, such as Tversky andKahneman (1974), have criticized this view oflearning. They use experimental evidence tofind that actors depart from Bayesian learningby using cognitive shortcuts or heuristic rules,which can lead to biased and distorted risk per-ceptions (Tallman and Gray 1990). For exam-ple, individuals tend to update using onlyinformation that is easily or quickly retrievedfrom memory, so that dramatic and vivid events(such as arrest) may swamp other mundanesources of information (such as experiences ofothers). Individuals also tend to anchor theirestimates on initial probabilities, rather thanupdating properly in light of new information,as when a person ignores the arrest of com-panions in forming risk perceptions.Furthermore, individuals tend to rely on stereo-types while ignoring population distributions,such as when a person overestimates the prob-ability that a mother is black when given theinformation that she is a teenage mother (for-getting that whites are disproportionately rep-resented in the population) (Heimer 1988).
In the case of certainty of sanction, individ-uals often rely on stereotypes depicted in themedia, in which criminals are caught and arrest-ed (Andenaes 1975; Parker and Grasmick 1979).Indeed, the media often manipulate this stereo-type—e.g., with television shows like Cops(2005)—which may increase deterrent effects,particularly among naïve individuals with noexperience with the criminal justice system.Research suggests that such naïve individualstend to overestimate the likelihood that theywill be arrested if they commit crimes (e.g.,Jensen 1969), a phenomenon Tittle (1980:67)terms “the shell of illusion.”
Finally, individuals fall prey to the gambler’sfallacy, which occurs when a person assumesthat a departure from what happens in the longrun will be corrected in the short run. For exam-ple, if nine coin flips in a row have come up tails,individuals might think they are “due” for acoin flip to come up heads. Consequently, indi-viduals who continuously get away with crimemay think they are “due” for an arrest, or thosewho experience a string of arrests may thinkthey are “due” to get away with crime (Pogarskyand Piquero 2003).
For our purposes, such heuristics suggest thatthe formation of perceived risks may not followa strictly Bayesian learning perspective.Individuals may begin by overestimating theirrisk of arrest, remain anchored on their baselinevalues and fail to update, or update only onvivid events such as dramatic personal experi-ences.
FORMATION OF PERCEIVED RISK OF FORMAL
SANCTION
The perceived risk of punishment for commit-ting a crime makes a good case study forBayesian updating, because it is a clearly delin-eated risk and applies to all members of socie-ty. We specify three important sources ofinformation from which individuals update theirperceptions of risk of arrest: (1) their own expe-riences with offending, including getting arrest-ed and avoiding arrest; (2) their knowledge offriends’ experiences with offending; and (3)their social structural location. Drawing on aBayesian learning perspective, we develophypotheses about each of these sources of infor-mation.
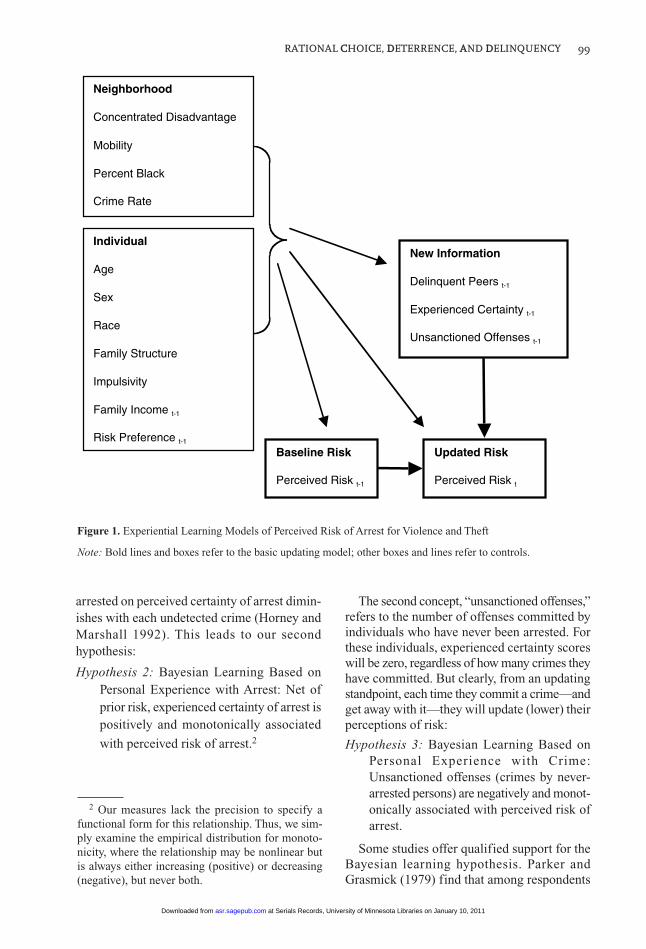
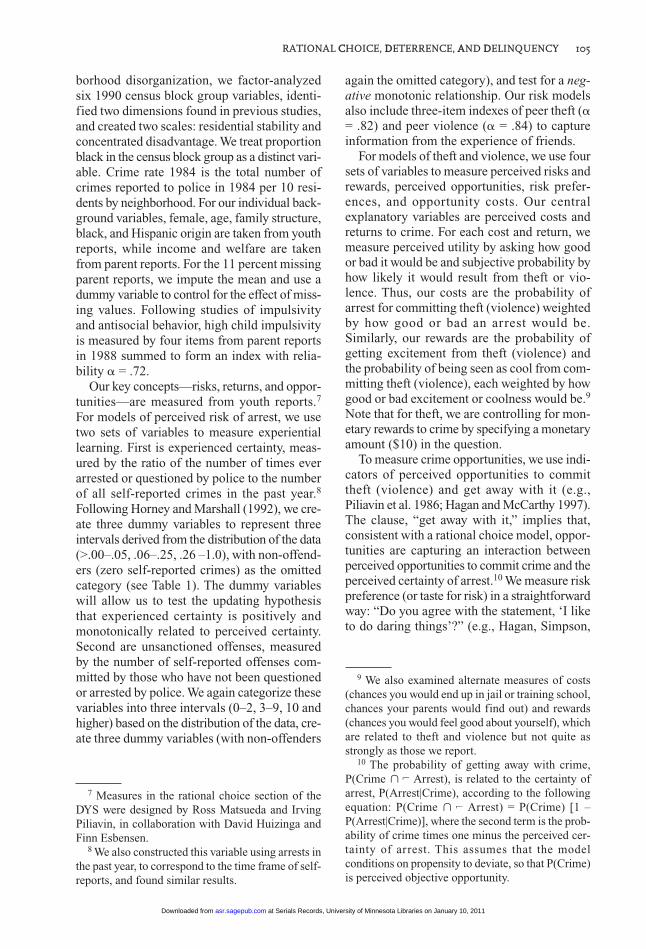
An updating model (see Figure 1, bold lines)begins with a prior or baseline estimate of per-ceived risk of punishment:
Hypothesis 1: Prior Perceived Risk: Future per-ceived risk is a positive function of priorperceived risk plus any updating.
The key source of information for perceivedrisk is an individual’s own experiences withcrime and punishment. We use two concepts tocapture these experiences. The first, “experi-enced certainty,” refers to an individual’s rate ofarrests per number of reported crimes. We usethis rate—rather than the absolute number ofarrests—because the marginal effect of getting
98—–AMERICAN SSOCIOLOGICAL RREVIEW
#2714-ASR 71:1 filename:71105-Matsueda
at Serials Records, University of Minnesota Libraries on January 10, 2011asr.sagepub.comDownloaded from
arrested on perceived certainty of arrest dimin-ishes with each undetected crime (Horney andMarshall 1992). This leads to our secondhypothesis:
Hypothesis 2: Bayesian Learning Based onPersonal Experience with Arrest: Net ofprior risk, experienced certainty of arrest ispositively and monotonically associated
with perceived risk of arrest.2
The second concept, “unsanctioned offenses,”refers to the number of offenses committed byindividuals who have never been arrested. Forthese individuals, experienced certainty scoreswill be zero, regardless of how many crimes theyhave committed. But clearly, from an updatingstandpoint, each time they commit a crime—andget away with it—they will update (lower) theirperceptions of risk:
Hypothesis 3: Bayesian Learning Based onPersonal Experience with Crime:Unsanctioned offenses (crimes by never-arrested persons) are negatively and monot-onically associated with perceived risk ofarrest.
Some studies offer qualified support for theBayesian learning hypothesis. Parker andGrasmick (1979) find that among respondents
RATIONAL CCHOICE, DDETERRENCE, AAND DDELINQUENCY—–99
#2714-ASR 71:1 filename:71105-Matsueda
Figure 1. Experiential Learning Models of Perceived Risk of Arrest for Violence and Theft
Note: Bold lines and boxes refer to the basic updating model; other boxes and lines refer to controls.
Individual
Age
Sex
Race
Family Structure
Impulsivity
Family Income t-1
Risk Preference t-1
New Information
Delinquent Peers t-1
Experienced Certainty t-1
Unsanctioned Offenses t-1
Updated Risk
Perceived Risk t
Baseline Risk
Perceived Risk t-1
Neighborhood
Concentrated Disadvantage
Mobility
Percent Black
Crime Rate
2 Our measures lack the precision to specify afunctional form for this relationship. Thus, we sim-ply examine the empirical distribution for monoto-nicity, where the relationship may be nonlinear butis always either increasing (positive) or decreasing(negative), but never both.
at Serials Records, University of Minnesota Libraries on January 10, 2011asr.sagepub.comDownloaded from
who knew of at least one burglary, experiencedcertainty is positively correlated with certainty.They also find that those with zero experiencedcertainty have higher certainty estimates, andamong those with no arrests, burglary is slight-ly negatively correlated with perceived cer-tainty. In perhaps the strongest study ofupdating, Horney and Marshall (1992) interviewincarcerated felons, compute experienced cer-tainty (arrests per offense) for a variety ofoffenses, and find significant effects on per-ceived certainty of arrest for the offense. Finally,Pogarsky, Piquero, and Paternoster (2004) findthat arrest increases future perceived certaintyamong high school students, particularly forthose with low prior estimates of certainty. Withrespect to “unsanctioned offenses,” research onthe “experiential effect” finds strong effects ofprior delinquency on risk of arrest (e.g.,Paternoster 1987). Such research, however, failsto distinguish arrested from non-arrestedgroups, and thus, unsanctioned offenses fromexperienced certainty. Our analyses make thisdistinction and test the hypothesis directly.3
We can also test the hypothesis of a “shell ofillusion,” in which naïve individuals with noexperience with offending or arrest overesti-mate the likelihood that they will be arrested ifthey commit crimes:
Hypothesis 4: Shell of Illusion: Compared toexperienced offenders (with non-zero expe-rienced certainty or unsanctioned offenses),naïve individuals overestimate the risk ofarrest.
The second source of information is frompeers. Over two decades ago, Cook (1980) the-orized that risk perceptions are based on per-sonal experiences with crime and punishmentand the experiences of a few friends. Staffordand Warr (1993) make the same point, using theterms “punishment” and “punishment avoid-ance” to refer to a person’s own punishmentexperience, and “vicarious punishment” and“vicarious punishment avoidance” to refer topeer experiences (see also Piquero and Pogarsky2002). Ideally, the hypothesis would be that
perceived risk of arrest will increase with greaterexperienced certainty of peers, and decreasewith greater peer unsanctioned offenses.Research on peer effects, however, has notdirectly examined experienced certainty ofpeers, but instead has examined the effect ofdelinquent peers on risk perceptions—and foundsignificant effects. This strategy is probably areasonable approximation, given that mostoffenses—particularly moderately seriousoffenses—go unsanctioned, and therefore, riskperceptions will decline with greater delin-quency among peers (e.g., Parker and Grasmick1979; Piquero and Pogarsky 2002; Pogarsky etal. 2004). Lacking data on experienced cer-tainty of peers, we follow this strategy:
Hypothesis 5: Bayesian Learning Based onVicarious Experience: Delinquent peersare negatively associated with perceivedrisk of arrest.
Finally, risk perceptions will be related to aperson’s location in the social structure (Douglas1986). Social structural location will affect riskperceptions directly by structuring other sourcesof information, and indirectly by affecting aperson’s own experiences as well as structuringpeer networks:
Hypothesis 6: Social Structure and PerceivedRisk: Perceived risk is shaped by locationin the social structure (e.g., race, gender,SES, family structure, residential stability).
These hypotheses will allow us to determinewhether or not individuals act like Bayesians informing risk perceptions. But, of course, evenif risk formation follows updating principles, arational choice perspective will not be sup-ported strongly unless perceived risks are relat-ed to behavior. We now turn to this centralproposition of rational choice.
RATIONAL CCHOICE, DDETERRENCE,AND DDELINQUENCY
Reduced to essentials, a rational choice modelof deterrence and crime specifies that an indi-vidual will commit crime if the utility of rewardsfrom crime (weighted by the probability ofobtaining the reward) outweighs the utility ofcosts (weighted by the probability of beingcaught):
PR U(Rewards) > PC U(Costs)
100—–AMERICAN SSOCIOLOGICAL RREVIEW
#2714-ASR 71:1 filename:71105-Matsueda
3 Lochner’s (2005) unpublished study finds sup-port for a learning model of perceived risk usingdata from the National Longitudinal Survey of Youth1997 (NLSY-97) and National Youth Survey (NYS).
at Serials Records, University of Minnesota Libraries on January 10, 2011asr.sagepub.comDownloaded from

where PR is the probability of receiving areward, PC is the probability of a cost, and U isa utility function that translates specific rewardsand costs to a common metric (e.g., Becker1968; Nagin and Pogarsky 2001). We treat theutilities as subjectively perceived by the actor.
Long ago, building on Beccaria’s ([1764]1963) ideas about crime and punishment,Jeremy Bentham ([1789] 1948) formalized andpopularized David Hume’s ([1739] 2000) con-cept of utility to refer to a calculation of pleas-ures and pains, which “point out what we oughtto do, as well as determine what we shall do.”Bentham hoped to categorize all pleasures andpains (e.g., pleasures of wealth, skill, power,expectation, and pains of enmity, malevolence,ill name, and the senses) and measure theirvalue, using attributes of intensity, duration,certainty, propinquity, fecundity, purity, andextent. Kahneman, Wakker, and Sarin (1997)term Bentham’s concept, “experienced utility,”to contrast it to “decision utility,” favored byeconomists and decision theorists. The lattereschews direct measurement of utility, arguingthat utility cannot be observed, let alone meas-ured. It opts instead to infer utility from thecharacteristics of behavioral choices, and thenuse that inferred utility to predict future behav-ior. We follow Kahneman et al. (1997), and thetradition of Bentham, and measure utility direct-ly using survey data. We use a straightforwardmeasure of how good or bad the cost or rewardwould be to the individual to indicate perceivedutility, and weight it by the probability of the costor reward. The trick is to specify, from the stand-point of the actor, the relevant costs and returnsof crime that affect criminal behavior.
PERCEIVED COSTS OF CRIME
The perceived costs of crime are well estab-lished and include formal sanctions, such asarrest, conviction, jail, or imprisonment. Formoderately serious crimes, research has focusedon the perceived certainty of arrest, perhapsthe most salient cost. Most cross-sectionalvignette (scenario) studies of perceived risk andself-reported future intention to commit crimefind consistent deterrent effects (e.g., Klepperand Nagin 1989; Nagin and Paternoster 1994).4
In contrast, most research using panel studies ofself-reported crime find modest or null effectsof perceived certainty on crime among collegestudents (see reviews by Williams and Hawkins1986; and Paternoster 1987) and serious offend-ers (e.g., Piliavin et al. 1986).5 We will use morerefined measures of both perceived risk and ofself-reported delinquency and reassess this lat-ter finding:
Hypothesis 7: Deterrence: Crime is reduced byperceptions of greater risk of formal sanc-tion weighted by perceived utility of thesanction.
In addition to the cost of arrest, there areopportunity costs to offending—that is, oppor-tunities forgone by virtue of crime. For adoles-cents and young adults, structural opportunitycosts include schooling and work (e.g., Sullivan1989; Sampson and Laub 1993). Youth who areperforming well in school and who see school-ing as an avenue to future status and pecuniaryreturns will be less likely to risk committingcrime. Similarly, youth who seek employmentwill be less likely to jeopardize their legitimateearnings by committing crime. With his socialcontrol theory of crime, Hirschi (1969) essen-tially specified opportunity costs as the mech-anism by which commitment to conventionallines of action reduced delinquency and foundthat school performance—but not employ-ment—reduced delinquency. Subsequentresearch consistently finds negative effects ofschool performance on delinquency (e.g.,Jenkins 1995; Stewart 2003). Research finds,however, that work exerts a positive effect ondelinquency during adolescence, and this effectis stronger for individuals working more than 20hours a week (e.g., Steinberg, Fegley, andDornbusch 1993; Ploeger 1997; Wright, Cullenand Williams 1997). These effects persist whencontrolling for covariates that might select youthinto jobs (Staff and Uggen 2003), but not in afixed-effects panel model (Paternoster et al.2003). This leads to the following hypothesis:
RATIONAL CCHOICE, DDETERRENCE, AAND DDELINQUENCY—–101
#2714-ASR 71:1 filename:71105-Matsueda
4 In vignette studies, respondents are given sce-narios of crime situations—where characteristics of
the scenario are randomly assigned—and asked torate the risk of arrest (independent variable) as wellas their hypothetical intention to commit the depict-ed crime (dependent variable).
5 Lochner (2005) also finds support for the deter-rence hypothesis using cross-sectional data from theNYS and longitudinal data from the NLSY-97.
at Serials Records, University of Minnesota Libraries on January 10, 2011asr.sagepub.comDownloaded from
Hypothesis 8: Opportunity Costs: Crime isreduced by opportunity costs, includingschooling and work.
PERCEIVED RETURNS TO CRIME
Returns to crime usually refer to income, whichapplies only to monetary crimes, and which istypically assumed to be confiscated upon for-mal sanction (and, therefore, modeled by replac-ing PR with 1 – PC). For most crimes, however,criminological research has identified psychicreturns as key determinants of criminal deci-sions. A long history of ethnographic researchin criminology has identified peer group statusas important in criminal decision making. Forexample, classical subcultural theories arguethat for inner-city youth blocked from attainingconventional status, crime provides an alterna-tive avenue for status in the eyes of a person’speers (e.g., Cloward and Ohlin 1960; Short andStrodtbeck 1965). More recent ethnographicresearch (e.g., Horowitz 1983; Anderson 1999)on inner-city Chicano and black youth findsthat violence and crime often is a way of attain-ing respect and honor among a person’s refer-ence group: “You do it ’cause you want to becool” (Pinderhughes 1997:134). Katz (1988)argues that “being cool” is an important elementof adolescent subcultures and a part of being “abadass,” which is associated with street crimeand violence. In his autobiographical account ofa potentially violent confrontation in which he“couldn’t resist the temptation to demandrespect,” Nathan McCall’s (1994:378) thoughtprocess captures the role of rewards and statuswithin a rational choice framework:
In a fraction of a second I calculated the possibil-ities and weighted the potential for loss and gain:He must be armed. Fistfighting went out with Afropicks and platform shoes. Even if by chance home-boy is an old-school rumbling man, I’ll win no tro-phies or awards for throwing down with him. I toldmyself, Nathan, let it ride. Walk away from this onewhile you can.
Recent ethnographic accounts of propertycrimes find that excitement and thrills are ubiq-uitous and second only to monetary returns asimportant motivators (e.g., Tunnell 1992; Frazierand Meisenhelder 1985). Jacobs (2000:29) findsthat robbers of drug dealers talk about the kicksand highs from robbery:
“It’s like an adrenaline rush,” Loony Ass Nigga pro-claimed. “Some people go bungee jumping, somepeople go sky diving, I .|.|. kick [drug] houses in.”(p. 36)
Katz (1988) argues that criminals are oftenseduced into crime by the prospect of excitementand kicks or, what he terms, “sneaky thrills.”Sneak thieves are often obsessed with “gettingover” and the “excitement and thrill” from suc-ceeding. If caught and arrested, they expressshock, subsequently treat their theft as “realcrime,” and typically end their deviant career toavoid commitment to a deviant identity. In con-trast, professional shoplifters see themselves asmembers of criminal subcultures and view theirarrest as a “cost of doing business” (Katz1988:66). Our models will draw on this litera-ture to specify psychic returns to crime, such asgetting excitement and thrills (see McCarthy andHagan 2005), being seen as cool, and feelinggood about oneself, and hypothesize that theyaffect crime:
Hypothesis 9: Psychic Returns to Crime:Criminal behavior is associated with per-ceived probability of excitement and socialstatus from crime weighted by perceivedutility of the excitement or status.
CRIMINAL OPPORTUNITIES
Even if a person has determined that the rewardsto crime outweigh the costs, that person cannotcommit a crime until an objective opportunityis not only present but also perceived. Withtheir routine activities theory, Cohen and Felson(1979) specify that criminal events occur at theintersection of motivated offenders, suitabletargets, and the absence of capable guardians.Embedded in this theory is a rational, motivat-ed actor seeking targets of theft or violencewhile avoiding detection. Indeed, Clarke andCornish (1985) specify a rational choice theo-ry of burglary in which perceived costs andbenefits lead to a state of readiness to commitburglary, which interacts with an opportunitymodel of seeking suitable targets lacking capa-ble guardians (to use the language of routineactivities). Thus, from a rational standpoint, theimportant concept is the actor’s perception ofopportunities to get away with crime, whichaffects future crimes:
102—–AMERICAN SSOCIOLOGICAL RREVIEW
#2714-ASR 71:1 filename:71105-Matsueda
at Serials Records, University of Minnesota Libraries on January 10, 2011asr.sagepub.comDownloaded from
Hypothesis 10: Criminal Opportunities: Criminalbehavior is increased by perceptions ofopportunities to get away with crime.
Research from a limited rationality perspectivesuggests that criminal behavior is associatedwith criminal opportunities and rewards, butnot costs. Perhaps criminals have short timehorizons, act on the basis of immediate oppor-tunities, and tend to discount long-term conse-quences such as formal sanction (e.g., Wilsonand Herrnstein 1985):
Hypothesis 11: Limited Rationality andDiscounting: Criminal behavior is associ-ated with perceptions of immediate crim-inal opportunities and rewards, but not byperceptions of future punishment.
Finally, deterrence theorists have traditionallyargued that instrumental crimes, such as theft,burglary, and robbery, are more susceptible torationality and deterrence than expressivecrimes, such as violence, vandalism, and dis-orderly conduct (e.g., Chambliss 1967; Zimringand Hawkins 1973). McCarthy (2002) arguesthat this distinction is blurred in reality and thatviolence is often used instrumentally to gain sta-tus (e.g., Short and Strodbeck 1965; Anderson1999), while theft can be expressive (e.g., Cohen1955). We treat this as an empirical question anddistinguish between theft and violent acts:
Hypothesis 12: Instrumental versus ExpressiveCrimes: Rational choice and deterrencehave stronger effects on theft than violence.
DATA AAND MMEASURES
THE DENVER YOUTH SURVEY
To test our models, we use data collected byHuizinga and colleagues as part of the DenverYouth Survey (DYS), a longitudinal study ofdelinquency and drug use in high risk neigh-borhoods in Denver. To identify high risk neigh-borhoods, they cluster analyzed census blockgroups based on census variables (e.g., familystructure, ethnicity, SES, housing, mobility,marital status, and age composition), identifiedeleven clusters, and selected the three mostsocially disorganized clusters. They then select-ed those block groups within each cluster thatfell within the top one-third of arrest rates basedon reports of the Denver Police Department.
The resulting sample is representative of neigh-borhoods at high risk of delinquency, wherehigh risk is defined as residing in socially dis-organized, high-crime neighborhoods.
Using vacancy and completion rates, theinvestigators selected 20,300 of 48,000 enu-merated households, drew a stratified proba-bility sample of households proportional topopulation size, and then used a screening ques-tionnaire to identify appropriately aged respon-dents (i.e., 7, 9, 11, 13 or 15 years old). Thisprocedure yielded a sample of 1,528 complet-ed interviews in the first wave, constituting acompletion rate of 85% of eligible youths (seeEsbensen and Huizinga 1990 for more details).Attrition rates were relatively low (7–9 percent)across the first five waves of data used here.Respondents age 11 years and older (at eachwave) received a youth questionnaire with ourrational choice measures. We use data from 11,13-, and 15-year-old cohorts between waves2–5, 9-year-olds between waves 3–5, and 7-year-olds between waves 4–5. The total sampleincludes 1,459 respondents and 3,298 person-years, after accounting for missing values on thedependent variables.6
This sampling strategy has three implica-tions for our analyses. First, we have adequatevariation on our key rational choice and crimevariables necessary for powerful tests of ourrational choice hypotheses. Second, we candraw inferences to the important population ofyouth residing in high risk neighborhoods, butwe must be careful to avoid generalizing to low-risk neighborhoods. Third, we expect neigh-borhood characteristics related to socialdisorganization to have less variability in oursample and less explanatory power in our mod-els.
CONCEPTS AND MEASURES
Descriptive statistics appear in Table 1; descrip-tions of our measures and concepts appear in theAppendix (Table A1). We include contextualand background variables describing the struc-tural location of individuals. To measure neigh-
RATIONAL CCHOICE, DDETERRENCE, AAND DDELINQUENCY—–103
#2714-ASR 71:1 filename:71105-Matsueda
6 We had slight (less than ten percent) missingvalues on some variables; we use a conditional meanimputation, which does not change the results appre-ciably.
at Serials Records, University of Minnesota Libraries on January 10, 2011asr.sagepub.comDownloaded from
104—–AMERICAN SSOCIOLOGICAL RREVIEW
#2714-ASR 71:1 filename:71105-Matsueda
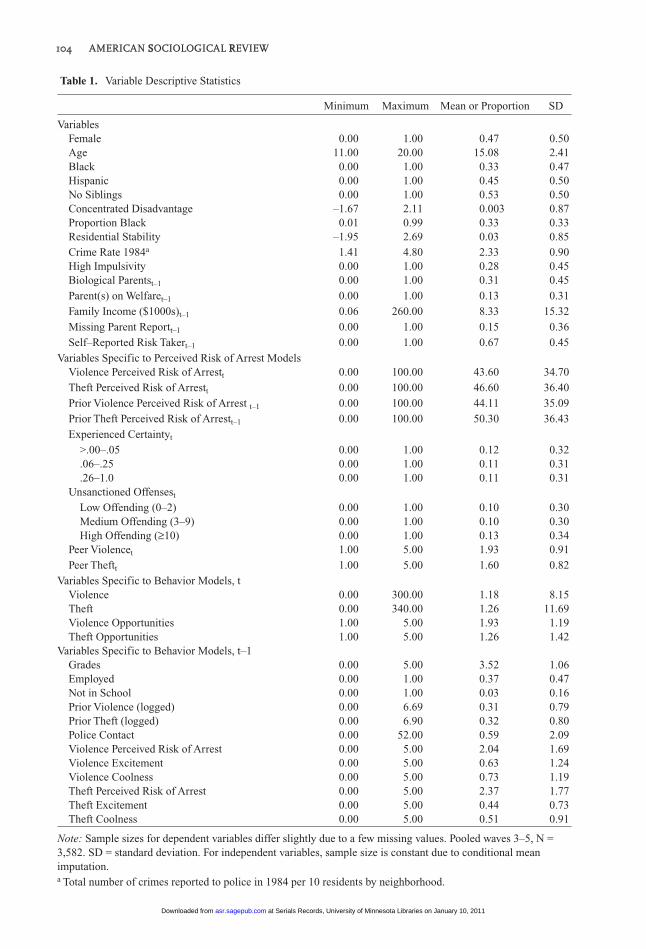
Table 1. Variable Descriptive Statistics
Minimum Maximum Mean or Proportion SD
Variables—Female 0.00 1.00 0.47 0.50—Age 11.00 20.00 15.08 2.41—Black 0.00 1.00 0.33 0.47—Hispanic 0.00 1.00 0.45 0.50—No Siblings 0.00 1.00 0.53 0.50—Concentrated Disadvantage –1.67 2.11 0.003 0.87—Proportion Black 0.01 0.99 0.33 0.33—Residential Stability –1.95 2.69 0.03 0.85—Crime Rate 1984a 1.41 4.80 2.33 0.90—High Impulsivity 0.00 1.00 0.28 0.45—Biological Parentst–1 0.00 1.00 0.31 0.45
—Parent(s) on Welfaret–1 0.00 1.00 0.13 0.31
—Family Income ($1000s)t–1 0.06 260.00 8.33 15.32
—Missing Parent Reportt–1 0.00 1.00 0.15 0.36
—Self–Reported Risk Takert–1 0.00 1.00 0.67 0.45
Variables Specific to Perceived Risk of Arrest Models—Violence Perceived Risk of Arrestt 0.00 100.00 43.60 34.70
—Theft Perceived Risk of Arrestt 0.00 100.00 46.60 36.40
—Prior Violence Perceived Risk of Arrest t–1 0.00 100.00 44.11 35.09
—Prior Theft Perceived Risk of Arrestt–1 0.00 100.00 50.30 36.43
—Experienced Certaintyt
——>.00–.05 0.00 1.00 0.12 0.32——.06–.25 0.00 1.00 0.11 0.31——.26–1.0 0.00 1.00 0.11 0.31—Unsanctioned Offensest
——Low Offending (0–2) 0.00 1.00 0.10 0.30——Medium Offending (3–9) 0.00 1.00 0.10 0.30——High Offending (≥10) 0.00 1.00 0.13 0.34—Peer Violencet 1.00 5.00 1.93 0.91
—Peer Theftt 1.00 5.00 1.60 0.82
Variables Specific to Behavior Models, t—Violence 0.00 300.00 1.18 8.15—Theft 0.00 340.00 1.26 11.69—Violence Opportunities 1.00 5.00 1.93 1.19—Theft Opportunities 1.00 5.00 1.26 1.42Variables Specific to Behavior Models, t–1—Grades 0.00 5.00 3.52 1.06—Employed 0.00 1.00 0.37 0.47—Not in School 0.00 1.00 0.03 0.16—Prior Violence (logged) 0.00 6.69 0.31 0.79—Prior Theft (logged) 0.00 6.90 0.32 0.80—Police Contact 0.00 52.00 0.59 2.09—Violence Perceived Risk of Arrest 0.00 5.00 2.04 1.69—Violence Excitement 0.00 5.00 0.63 1.24—Violence Coolness 0.00 5.00 0.73 1.19—Theft Perceived Risk of Arrest 0.00 5.00 2.37 1.77—Theft Excitement 0.00 5.00 0.44 0.73—Theft Coolness 0.00 5.00 0.51 0.91
Note: Sample sizes for dependent variables differ slightly due to a few missing values. Pooled waves 3–5, N =3,582. SD = standard deviation. For independent variables, sample size is constant due to conditional meanimputation.a Total number of crimes reported to police in 1984 per 10 residents by neighborhood.
at Serials Records, University of Minnesota Libraries on January 10, 2011asr.sagepub.comDownloaded from
borhood disorganization, we factor-analyzedsix 1990 census block group variables, identi-fied two dimensions found in previous studies,and created two scales: residential stability andconcentrated disadvantage. We treat proportionblack in the census block group as a distinct vari-able. Crime rate 1984 is the total number ofcrimes reported to police in 1984 per 10 resi-dents by neighborhood. For our individual back-ground variables, female, age, family structure,black, and Hispanic origin are taken from youthreports, while income and welfare are takenfrom parent reports. For the 11 percent missingparent reports, we impute the mean and use adummy variable to control for the effect of miss-ing values. Following studies of impulsivityand antisocial behavior, high child impulsivityis measured by four items from parent reportsin 1988 summed to form an index with relia-bility � = .72.
Our key concepts—risks, returns, and oppor-tunities—are measured from youth reports.7
For models of perceived risk of arrest, we usetwo sets of variables to measure experientiallearning. First is experienced certainty, meas-ured by the ratio of the number of times everarrested or questioned by police to the numberof all self-reported crimes in the past year.8
Following Horney and Marshall (1992), we cre-ate three dummy variables to represent threeintervals derived from the distribution of the data(>.00–.05, .06–.25, .26 –1.0), with non-offend-ers (zero self-reported crimes) as the omittedcategory (see Table 1). The dummy variableswill allow us to test the updating hypothesisthat experienced certainty is positively andmonotonically related to perceived certainty.Second are unsanctioned offenses, measuredby the number of self-reported offenses com-mitted by those who have not been questionedor arrested by police. We again categorize thesevariables into three intervals (0–2, 3–9, 10 andhigher) based on the distribution of the data, cre-ate three dummy variables (with non-offenders
again the omitted category), and test for a neg-ative monotonic relationship. Our risk modelsalso include three-item indexes of peer theft (�= .82) and peer violence (� = .84) to captureinformation from the experience of friends.
For models of theft and violence, we use foursets of variables to measure perceived risks andrewards, perceived opportunities, risk prefer-ences, and opportunity costs. Our centralexplanatory variables are perceived costs andreturns to crime. For each cost and return, wemeasure perceived utility by asking how goodor bad it would be and subjective probability byhow likely it would result from theft or vio-lence. Thus, our costs are the probability ofarrest for committing theft (violence) weightedby how good or bad an arrest would be.Similarly, our rewards are the probability ofgetting excitement from theft (violence) andthe probability of being seen as cool from com-mitting theft (violence), each weighted by howgood or bad excitement or coolness would be.9
Note that for theft, we are controlling for mon-etary rewards to crime by specifying a monetaryamount ($10) in the question.
To measure crime opportunities, we use indi-cators of perceived opportunities to committheft (violence) and get away with it (e.g.,Piliavin et al. 1986; Hagan and McCarthy 1997).The clause, “get away with it,” implies that,consistent with a rational choice model, oppor-tunities are capturing an interaction betweenperceived opportunities to commit crime and theperceived certainty of arrest.10 We measure riskpreference (or taste for risk) in a straightforwardway: “Do you agree with the statement, ‘I liketo do daring things’?” (e.g., Hagan, Simpson,
RATIONAL CCHOICE, DDETERRENCE, AAND DDELINQUENCY—–105
#2714-ASR 71:1 filename:71105-Matsueda
7 Measures in the rational choice section of theDYS were designed by Ross Matsueda and IrvingPiliavin, in collaboration with David Huizinga andFinn Esbensen.
8 We also constructed this variable using arrests inthe past year, to correspond to the time frame of self-reports, and found similar results.
9 We also examined alternate measures of costs(chances you would end up in jail or training school,chances your parents would find out) and rewards(chances you would feel good about yourself), whichare related to theft and violence but not quite asstrongly as those we report.
10 The probability of getting away with crime,P(Crime � ¬ Arrest), is related to the certainty ofarrest, P(Arrest|Crime), according to the followingequation: P(Crime � ¬ Arrest) = P(Crime) [1 –P(Arrest|Crime)], where the second term is the prob-ability of crime times one minus the perceived cer-tainty of arrest. This assumes that the modelconditions on propensity to deviate, so that P(Crime)is perceived objective opportunity.
¬
¬
at Serials Records, University of Minnesota Libraries on January 10, 2011asr.sagepub.comDownloaded from
and Gillis 1987). We use two measures of oppor-tunity costs of crime: grades (measured by self-reported grade point average) and employment(measured by a dummy variable indicatingwhether or not the youth is employed). Weinclude a dummy variable for being out ofschool (and thus, missing values on grades).
To distinguish instrumental from expressivecrimes, we estimate separate models of theft andviolence. For models of risk perceptions, ourdependent variable is the probability of beingpicked up by the police for theft (violence),measured on a probability scale ranging from0 to 100 incremented by intervals of 10. Test-retest correlations (not shown), which confoundtrue change with unreliability, show greaterchange in risk perceptions for younger cohorts(.25 for 11 year olds) than older cohorts (.45 for15 year olds), as expected. The average of about.33 probably reflects moderate true change andreasonable reliability. For example, if true sta-bility �21 were .50 and reliability �xx were .70,we would expect a test-retest correlation r21 of.35, since r21 = �21 �xx
1/2 �xx1/2 (for temporal dis-
tributions, see our ASR Online Supplement tothis article at http://www2.asanet.org/journals/asr/2005/toc049.html). For models oftheft (violence), our dependent variable is asum of seven (three) standard self-report itemssummed to provide a count of offenses for thepast year (see Appendix). We control for priortheft (violence) in all models.11
MODELS OOF BBAYESIAN LLEARNINGAND PPERCEIVED RRISK OOF AARREST
To test our Bayesian updating model of per-ceived risk of arrest, we specify a substantivemodel diagrammed in Figure 1. This modelcontrols for exogenous neighborhood variables(concentrated disadvantage, residential mobil-ity, percent black, and the crime rate in 1984)and individual characteristics (age, sex, race,family structure, impulsivity, and risk prefer-ence). It specifies perceived risk at time t as a
function of prior risk at time t–1, and then intro-duces three pieces of new information, eachmeasured at t–1, to test the updating hypothe-sis: experienced certainty, unsanctioned offens-es, and delinquent peers.
STATISTICAL MODELS: RRANDOM-EFFECTS
TOBIT MODELS
To estimate models of perceived risk of arrest,we use random-effects Tobit models with laggedregressors. Our models can be specified as fol-lows. If we let yit be our observed measure ofperceived risk of arrest for person i at time t, ourmodels take the following form:
y*it = �i + zi� + xit–1� + yit–1� + �it
�u if y*it ≥ �u
where yit = y*it if �u > y*
it > �1
�1 if y*it ≤ �1
and �i is unobserved heterogeneity, which variesacross individuals but not time, �, �, and � arecoefficients, y*
it is a latent continuous (unbound-ed) measure of perceived risk, zi is a vector oftime-invariant covariates, xit–1 is a vector oftime-varying lagged covariates, yit–1 is observedlagged perceived certainty, �it is a disturbanceterm (assumed normal with constant variance),and �u and �1 are upper and lower thresholds,respectively.
Our Tobit models address violations of threekey assumptions of the usual linear regressionmodel. First, the dependent variable, perceivedrisk, is measured in probabilities, which boundthe scales at zero and 100. Consequently, linearmodels will yield downwardly biased coefficientestimates due to floor and ceiling effects whenthe data clump at zero or 100. Therefore, we usea two-limit censored regression or Tobit model,which takes into consideration the propensity tobe censored at zero or unity (see Maddala 1983;Long 1997).12 Second, our pooled person-year
106—–AMERICAN SSOCIOLOGICAL RREVIEW
#2714-ASR 71:1 filename:71105-Matsueda
11 We logged the lagged dependent variable so thefunctional form approximates linearity (and add oneto each observed value before logging to deal withzero values). This results in stronger lagged effectsand more conservative estimates of effects of othervariables.
12 We treat the floor and ceiling effects as gener-ated by problems in the measurement scale, ratherthan generated by a true probability scale that allowsnegative values or values exceeding unity. We exam-ine the possibility that the process generating non-bounded values differs from the process generating
at Serials Records, University of Minnesota Libraries on January 10, 2011asr.sagepub.comDownloaded from

data are dependent across individuals due tounobserved heterogeneity. We use randomeffects models, which assume �i is uncorrelat-ed with zi and xit–1, to correct for such depend-ence and obtain consistent and asymptoticallyefficient estimates.13 Third, our independent(experienced certainty, and peer delinquency)and dependent variables (perceived certainty)could be reciprocally related, creating an endo-geneity problem. Therefore, we use a three-wave panel model with a lagged endogenouspredictor (prior perceived certainty), yit–1, tocontrol for stability or state dependence in ouroutcome variable, and lagged time-varyingcovariates, xit–1, to ensure that the temporalspecification of our models is consistent withour theoretical specification. Our random-effects model helps address potential bias inthe estimate of the effect of yit–1, and therefore,other effects as well, by building in equal-cor-related (regardless of lag) autocorrelated dis-turbances.
ESTIMATES OF PARAMETERS OF PERCEIVED
RISK MODELS
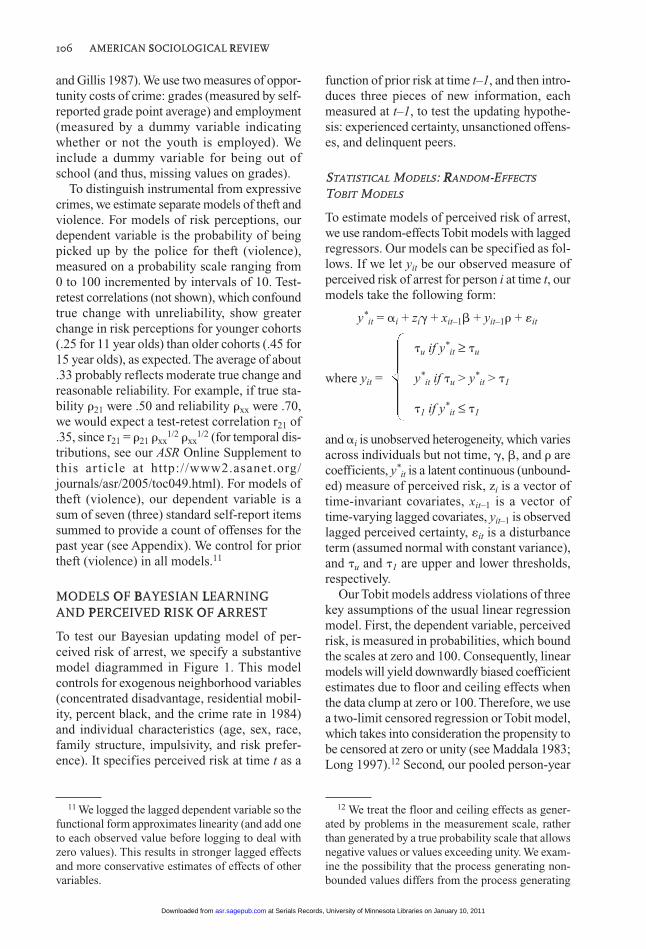
Table 2 presents estimates of our models ofexperiential learning and perceived risk of arrestfor theft and violence. Model I (columns 1 and2), our reduced-form equation, reveals thatfemales and younger respondents perceive ahigher risk of arrest for both theft and violence(lines 2 and 3). On average, females believethe chances of arrest for theft are eleven per-centage points higher than do males, and for vio-lence, seven points higher (e.g., Blackwell andEschholz 2002). Each year of age is associatedwith a decrease of four percentage points in
perceived risk for theft and one percentage pointfor violence. Youth without siblings perceive alower risk of arrest for violence; the effect isnon-significant for theft (line 4). With oneexception, our neighborhood contextual vari-ables fail to exert significant effects on cer-tainty, probably because we sampled the mostdisorganized and high crime neighborhoods.The exception is residential stability, which isassociated with lower perceived risk of arrest fortheft (line 5).
Model II (columns 3 and 4, Table 2), whichadds our lagged control variables, nearly dou-bles the pseudo-R2 for both theft and violence(compare Models I and II), and reveals two sig-nificant effects.14 First, on average, respondentswho report a preference for risk perceive a lowerrisk of getting arrested for both theft and vio-lence (line 9). Second, the one-year laggedeffects of perceived risk of arrest are substan-tial, confirming the importance of controllingfor stability or state dependence (line 10).
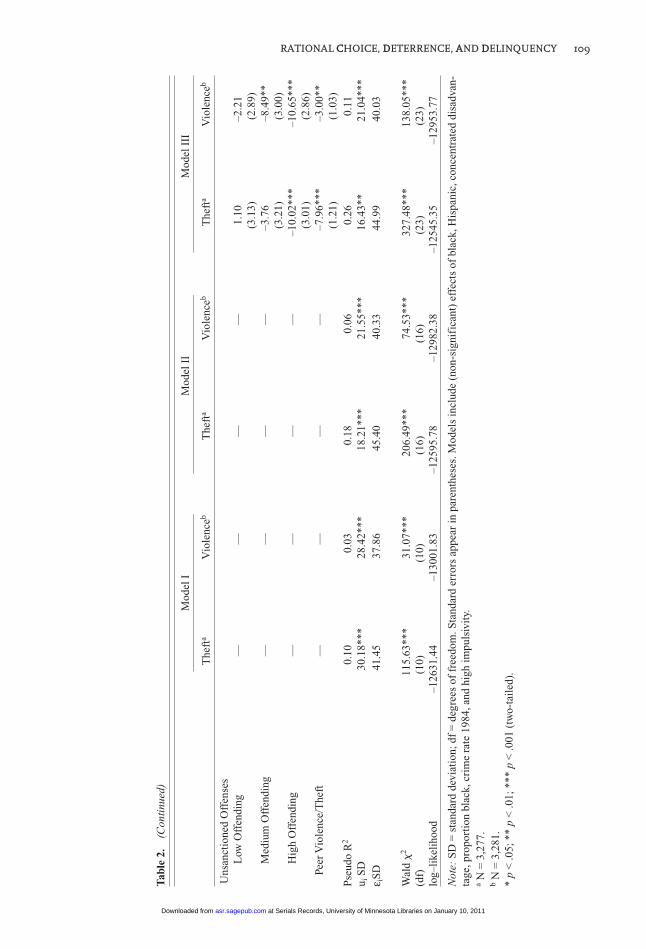
Model III (columns 5 and 6, Table 2) adds ourexperiential learning variables (nearly doublingthe pseudo-R2s, to .11 for violence, and .26 fortheft) and tests our Bayesian learning hypothe-ses. We turn first to experienced certainty (therate of arrest per offense) and find evidence forupdating: using a joint test, we reject the nullhypothesis that, net of prior perceived risk,experienced certainty has no effect on perceivedrisk for theft (�2 = 23.74; df = 3; p < .001) andviolence (�2 = 26.34; df = 3; p < .001). The sig-nificant negative coefficients (lines 11–13) sup-port the “shell of illusion” hypothesis 4, inwhich naïve individuals who have neitheroffended nor been arrested will overestimatethe certainty of arrest relative to arrested offend-ers, and not the gambler’s fallacy (in whichcoefficients would be positive).
Moreover, the three dummy variables exhib-it a monotonic relationship with certainty—that is, as hypothesized from Bayesian learning,as one moves from low experienced certainty tohigh, perceived certainty increases monotoni-cally, �1 < �2 < �3, (lines 11–13, Table 2). Thisis shown graphically in Figure 2 (compare bars
RATIONAL CCHOICE, DDETERRENCE, AAND DDELINQUENCY—–107
#2714-ASR 71:1 filename:71105-Matsueda
variation in positive probabilities using Cragg’s(1971) model (Greene 2003); see ASR OnlineSupplement to this article (http://www2.asanet.org/journals/asr/2005/toc049.html). On criticisms of theTobit model, see Raftery (2001) and Maddala (1983).
13 The Tobit model is not robust to violations ofassumptions of normally distributed and homoscedas-tic disturbances. Thus, we examine these assumptionsin sensitivity analyses (see ASR Online Supplement).We also examine the robustness of assuming �i isuncorrelated with zi and xit–1, of using yit–1 versusy*it–1 as our endogenous regressor (see Wooldridge2002), and of allowing serially correlated errors inthe presence of a lagged endogenous predictor.
14 The pseudo-R2 is the variance of the predictedconditional mean to the variance of the dependentvariable and is bounded by zero and one (Greene2002:E21–12).
at Serials Records, University of Minnesota Libraries on January 10, 2011asr.sagepub.comDownloaded from
108—–AMERICAN SSOCIOLOGICAL RREVIEW
#2714-ASR 71:1 filename:71105-Matsueda
Tab
le 2
.R
ando
m E
ffec
ts T
obit
Mod
els
of P
erce
ived
Cer
tain
ty o
f Arr
est (
Wav
es 3
–5)
Mod
el I
Mod
el I
IM
odel
III
The
fta
Vio
lenc
ebT
heft
aV
iole
nceb
The
fta
Vio
lenc
eb
Var
iabl
es—
Inte
rcep
t99
.08*
**
53.4
1***
68.1
3***
42.9
0***
71.0
3***
43.2
3***
(8.2
1)(7
.53)
(8.6
3)(7
.73)
(8.6
0)(8
.01)
—Fe
mal
e11
.18*
**6.
72 *
*9.
00**
*5.
25**
5.86
**3.
36
(2.2
9)(2
.11)
(2.0
0)(1
.94)
(1.9
9)(1
.96)
—A
ge
–3.8
9***
–1.0
4*–2
.51*
**–0
.45
–1.6
1***
0.21
(0
.44)
(0.4
0)(0
.43)
(0.3
9)(0
.43)
(0.4
1)—
No
Sib
ling
s–3
.25
–4.5
0*–2
.62
–4.5
8*–2
.92
–4.4
7*(2
.29)
(2.1
2)(2
.03)
(1.9
6)(1
.97)
(1.9
4)—
Res
iden
tial
Sta
bili
ty–3
.20*
–1.1
3 –2
.90*
–1.1
1 –2
.54
–0.9
6 (1
.60)
(1.4
8)(1
.39)
(1.3
4)(1
.34)
(1.3
3)L
agge
d V
aria
bles
, t–1
—B
iolo
gica
l Par
ents
.—.—
2.29
2.
54
0.22
1.
24
(2.2
2)(2
.11)
(2.1
7)(2
.10)
—Pa
rent
(s)
on W
elfa
re.—
.—1.
03
0.22
2.
40
0.92
(2
.95)
(2.7
2)(2
.90)
(2.7
0)—
Fam
ily I
ncom
e ($
1000
s).—
.—–0
.01
–0.0
4 0.
00
–0.0
3 (0
.06)
(0.0
6)(0
.06)
(0.0
6)—
Ris
k P
refe
renc
e.—
.—–6
.38*
*–6
.40*
* –3
.68
–4.4
1*(2
.04)
(1.8
9)(2
.02)
(1.8
9)—
Pri
or P
erce
ived
Ris
k of
Arr
est
.—.—
0.29
***
0.17
***
0.27
***
0.16
***
(0.0
4)(0
.04)
(0.0
4)(0
.04)
Var
iabl
es a
t Tim
e t
—E
xper
ienc
ed C
erta
inty
——
>.0
0–.0
5.—
.—.—
.—–1
5.73
***
–15.
46**
*(3
.46)
(3.2
7)—
—.0
6–.2
5.—
.—.—
.—–8
.42*
–1
1.56
***
(3.3
1)(3
.15)
——
.26–
1.0
.—.—
.—.—
–1.1
3 –4
.32
(3.2
3)(3
.02)
(con
tinu
ed o
n ne
xt p
age)
at Serials Records, University of Minnesota Libraries on January 10, 2011asr.sagepub.comDownloaded from
RATIONAL CCHOICE, DDETERRENCE, AAND DDELINQUENCY—–109
#2714-ASR 71:1 filename:71105-Matsueda
Tab
le 2
.(C
onti
nued
)
Mod
el I
Mod
el I
IM
odel
III
The
fta
Vio
lenc
ebT
heft
aV
iole
nceb
The
fta
Vio
lenc
eb
Uns
anct
ione
d O
ffen
ses
——
Low
Off
endi
ng.—
.—.—
.—1.
10
–2.2
1 (3
.13)
(2.8
9)—
—M
ediu
m O
ffen
ding
.—.—
.—.—
–3.7
6 –8
.49*
*(3
.21)
(3.0
0)—
—H
igh
Off
endi
ng.—
.—.—
.—–1
0.02
***
–10.
65**
*(3
.01)
(2.8
6)—
Peer
Vio
lenc
e/T
heft
.—.—
.—.—
–7.9
6***
–3
.00*
*(1
.21)
(1.0
3)P
seud
o R
20.
10
0.03
0.
18
0.06
0.
26
0.11
u i
SD
30.1
8***
28
.42*
**18
.21*
**21
.55*
**16
.43*
*21
.04*
**ε iS
D41
.45
37.8
6 45
.40
40.3
3 44
.99
40.0
3
Wal
d �
211
5.63
***
31.0
7***
206.
49**
*74
.53*
**32
7.48
***
138.
05**
*(d
f)(1
0)(1
0)(1
6)(1
6)(2
3)(2
3)lo
g–li
keli
hood
–126
31.4
4 –1
3001
.83
–125
95.7
8 –1
2982
.38
–125
45.3
5 –1
2953
.77
Not
e:S
D =
sta
ndar
d de
viat
ion;
df
= d
egre
es o
f fr
eedo
m. S
tand
ard
erro
rs a
ppea
r in
par
enth
eses
. Mod
els
incl
ude
(non
-sig
nifi
cant
) ef
fect
s of
bla
ck, H
ispa
nic,
con
cent
rate
d di
sadv
an-
tage
, pro
port
ion
blac
k, c
rim
e ra
te 1
984,
and
hig
h im
puls
ivit
y.a
N =
3,2
77.
bN
= 3
,281
.*
p<
.05;
**
p<
.01;
***
p<
.001
(tw
o-ta
iled
).
at Serials Records, University of Minnesota Libraries on January 10, 2011asr.sagepub.comDownloaded from
110—–AMERICAN SSOCIOLOGICAL RREVIEW
#2714-ASR 71:1 filename:71105-Matsueda
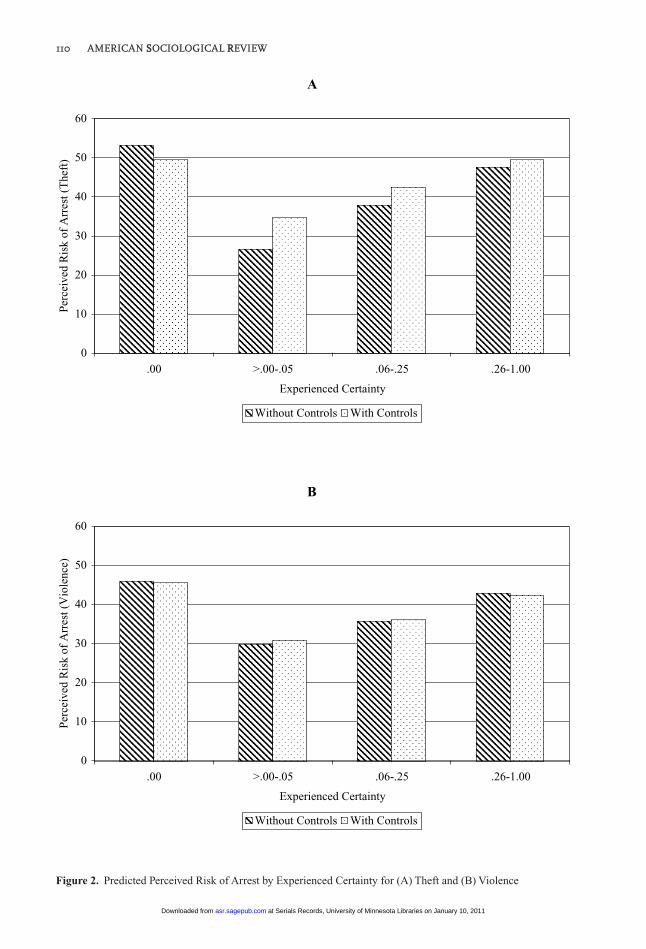
Figure 2. Predicted Perceived Risk of Arrest by Experienced Certainty for (A) Theft and (B) Violence
A
0
10
20
30
40
50
60
.00 >.00-.05 .06-.25 .26-1.00
Experienced Certainty
Per
ceiv
ed R
isk
of A
rres
t (T
heft
)
Without Controls With Controls
B
0
10
20
30
40
50
60
.00 >.00-.05 .06-.25 .26-1.00
Experienced Certainty
Per
ceiv
ed R
isk
of A
rres
t (V
iole
nce)
Without Controls With Controls
at Serials Records, University of Minnesota Libraries on January 10, 2011asr.sagepub.comDownloaded from
2–4 for both 2A and 2B), which graphs thepredicted values of perceived risk by experi-enced certainty. These differences are statisti-cally significant: a joint test rejects the nullhypothesis that the coefficients are equal (�1,= �2, = �3) for theft (�2 = 14.59; df = 2; p <.001) and violence (�2 = 10.27; df = 2; p <.001). As expected, the coefficient for the low-est experienced certainty category (>.00–.05)has the biggest negative effect: those who havegotten away with their crimes perceive the cer-tainty of arrest for violence and theft as 15points lower than naïve youth (line 11). Relativeto naïve individuals, those in the middle cate-gory (.06–.25) of experienced certainty per-ceive arrest certainty as 8 points lower for theftand 12 points lower for violence (line 12).Those in the highest experienced certainty cat-egory (.26–1.0)—the most frequently arrestedper crime—have the smallest coefficient, whichis not significantly different from naïve youth(line 13). Thus, naïve individuals most close-ly resemble the group with the highest rate ofarrests per crime (compare bars 1 and 5 inFigures 2A and 2B). This overall pattern ofresults is consistent with those of Horney andMarshall’s (1992) study of convicted felons,and it supports our hypothesis of Bayesianlearning.
We turn now to the effect of unsanctionedoffenses, which are captured with three dummyvariables representing categories of offendingfrom low to high. Our omitted category againis naïve individuals who have neither offendednor been arrested. We again find evidence forupdating: using a joint test, we reject the nullhypothesis that, net of prior perceived risk,unsanctioned offenses have no effect on per-ceived risk for theft (�2 = 12.94; df = 3; p < .01)and violence (�2 = 17.22; df = 3; p < .001). Thus,we do not find support for the hypothesis thatyouth ignore new information, and insteadanchor their estimates in initial values, or thegambler’s fallacy, in which youth believe theyare “due” for an arrest. We find support for the“shell of illusion” hypothesis for violence: Eachof the three coefficients for offending is nega-tive, indicating that naïve individuals have high-er risk perceptions than unsanctioned offenders(lines 14–16, column 6, Table 2). For theft, highand medium offending dummy variables arenegative. However, negative medium offend-
ing dummy variables and the positive lowoffending coefficient are not significant.
We find support for the Bayesian learninghypothesis that, on average, as unsanctionedoffenses increase, certainty of arrest declinesmonotonically: For both theft and violence,our coefficients decrease (become more neg-ative) as unsanctioned offenses move from lowto high, �1 > �2 > �3 (lines 14–16, Table 2). Forboth behaviors, the differences among the cat-egories are statistically significant: a joint testrejects the null hypothesis that the coefficientsare equal �1 = �2 = �3 for theft (�2 = 9.16; df= 2; p < .05) and violence (�2 = 6.28; df = 2;p < .05). Compared to naïve individuals, highoffenders (10 or more offenses) perceive therisk of arrest for violence about ten pointslower, and medium offenders (3–9 offenses)about eight points lower. Low offenders are twopoints lower, but the effect is not significant(line 14). For theft, high offenders are 10 pointslower than naïve youth (line 16), and mediumoffenders are four points lower than naïveyouth (line 15), but the latter coefficient is notsignificant. Neither is the low offending coef-ficient. Naïve youth most closely resemblelow unsanctioned offenders for both theft andviolence. Again, the overall pattern of resultsfor unsanctioned offenses is consistent with thehypothesis of Bayesian learning.
We find support for the Bayesian learninghypothesis that delinquency by peers will beassociated with lower perceptions of certain-ty of arrest. Net of personal experience vari-ables, a unit change in our delinquent peermeasure is associated with an eight percentdecrease in perceived risk of arrest for theft anda three percent decrease for violence (line 17,Table 2). Thus, information from peers is notcompletely swamped by the more vivid per-sonal experiences with crime and arrest.Finally, we find that, consistent with updating,prior perceived risk maintains a significanteffect on updated risk perceptions (line 10),even net of new information. The coefficientsdiminish only slightly between Models II andIII.
In sum, the data support a Bayesian learn-ing view of formation of perceived arrest riskand Tittle’s “shell of illusion” hypothesis. Ofcourse, evidence of such learning is impressivefor a rational choice model only if risk per-
RATIONAL CCHOICE, DDETERRENCE, AAND DDELINQUENCY—–111
#2714-ASR 71:1 filename:71105-Matsueda
at Serials Records, University of Minnesota Libraries on January 10, 2011asr.sagepub.comDownloaded from
ceptions are used in behavioral decisions—towhich we now turn.
MODELS OOF RRATIONAL CCHOICE,THEFT, AAND VVIOLENCE
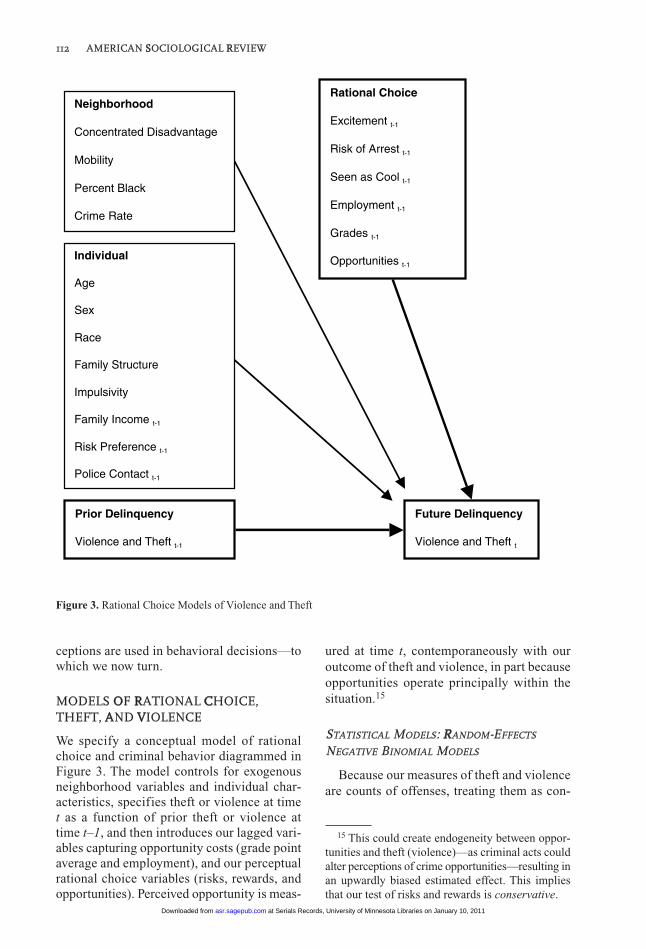
We specify a conceptual model of rationalchoice and criminal behavior diagrammed inFigure 3. The model controls for exogenousneighborhood variables and individual char-acteristics, specifies theft or violence at timet as a function of prior theft or violence attime t–1, and then introduces our lagged vari-ables capturing opportunity costs (grade pointaverage and employment), and our perceptualrational choice variables (risks, rewards, andopportunities). Perceived opportunity is meas-
ured at time t, contemporaneously with ouroutcome of theft and violence, in part becauseopportunities operate principally within thesituation.15
STATISTICAL MODELS: RRANDOM-EFFECTS
NEGATIVE BINOMIAL MODELS
Because our measures of theft and violenceare counts of offenses, treating them as con-
112—–AMERICAN SSOCIOLOGICAL RREVIEW
#2714-ASR 71:1 filename:71105-Matsueda
Figure 3. Rational Choice Models of Violence and Theft
Individual
Age
Sex
Race
Family Structure
Impulsivity
Family Income t-1
Risk Preference t-1
Police Contact t-1
Rational Choice
Excitement t-1
Risk of Arrest t-1
Seen as Cool t-1
Employment t-1
Grades t-1
Opportunities t-1
Future Delinquency
Violence and Theft t
Prior Delinquency
Violence and Theft t-1
Neighborhood
Concentrated Disadvantage
Mobility
Percent Black
Crime Rate
15 This could create endogeneity between oppor-tunities and theft (violence)—as criminal acts couldalter perceptions of crime opportunities—resulting inan upwardly biased estimated effect. This impliesthat our test of risks and rewards is conservative.
at Serials Records, University of Minnesota Libraries on January 10, 2011asr.sagepub.comDownloaded from

tinuous and using linear models can yieldinconsistent and inefficient estimates of param-eters. A better approach assumes the counts ofdelinquency are generated from a Poisson dis-tribution. We estimated a Poisson regressionmodel and, as expected, found overdisper-sion—the variance exceeded the mean countof delinquency—which, if ignored, can resultin inefficient estimates of coefficients anddownwardly biased standard errors (Long1997).16 Consequently, we turned to a negativebinomial model, which allows the rate of delin-quency to vary across individuals, and there-fore, the variance to exceed the mean. Formallikelihood ratio tests show a better fit for thenegative binomial model for both theft (�2 =13,498; df = 1; p < .001) and violence (�2 =12,082; df = 1; p < .001) (for details, see FigureS1 in our ASR Online Supplement).
In estimating our negative binomial model,we found dependence in observations acrossindividuals, which can result in inefficiencyand biased standard errors; we therefore esti-mated a random-effects negative binomialmodel. Formal likelihood ratio tests show thatthe random-effects model fit the data betterthan a pooled model (that ignores the depend-ence) for both theft (�2 = 187.52; df = 1; p <.001) and violence (�2 = 172.88; df = 1; p <.001). Therefore, we present the random effectsnegative binomial specification estimated bymaximum likelihood (Hausman, Hall, andGirliches 1984). This model allows for overdis-persion in the Poisson model with the inclusionof a parameter and then layers a randomindividual effect onto the negative binomialmodel by assuming i / (1 + i) follows a betadistribution with parameters a and b (see ASROnline Supplement). Unlike the random effectsPoisson model, this model allows the rate tovary across individuals and time (even if thexits are constant).
Our negative binomial models, like our Tobitmodels, include lagged time-varying covariatesxit–1 to ensure that the temporal specification
of our models is consistent with our theoreti-cal specif ication and include the laggedendogenous predictor (prior perceived cer-tainty) yit–1 to control for stability or statedependence in theft and violence. The randomeffects specification helps overcome potentialbias in the estimate of the effect of yit–1 (andtherefore, other estimates) by allowing forapproximately equal-correlated autocorrela-tion among disturbances (Hausman et al.1984).
ESTIMATES OF PARAMETERS OF CRIMINAL
BEHAVIOR MODELS
Table 3 presents estimates of our random-effectsnegative binomial models of theft and violence.Model I (columns 1 and 2) presents coefficientsof our exogenous control variables. As expect-ed, we find that males and high impulsive indi-viduals engage in substantially more theft andviolence (lines 2 and 8). Older youth reportslightly more violence but not more theft (line3). In our sample, compared to whites, blacksengage in substantially more violence but notmore theft, whereas Hispanics engage in slight-ly more of each (lines 4 and 5). Of our neigh-borhood variables, only the 1984 crime rateaffects theft and violence (line 7). Among ourtime-varying lagged control variables, biolog-ical parents exert a negative effect that is sig-nificant for theft but not violence (line 9), andincome is negatively associated with violencebut not theft (line 10). As expected, net of ourbackground variables, prior violence and theftexert strong lagged effects on future violenceand theft, respectively (line 12). This highlightsthe importance of controlling for state depend-ence, which helps control for unobserved het-erogeneity in our models.17
Model II (columns 3 and 4, Table 3) adds ourrational choice variables, including risk prefer-ence, opportunity costs, and perceived costsand rewards. As hypothesized, youth who liketo do daring things are substantially more like-ly to steal and fight (line 14). This is consistentwith our rational choice model, which predictsthat risk-averse youth will avoid risky behaviors
RATIONAL CCHOICE, DDETERRENCE, AAND DDELINQUENCY—–113
#2714-ASR 71:1 filename:71105-Matsueda
16 Overdispersion can arise from a variety ofsources, including unobserved heterogeneity (e.g.,omitted variables, such as genetics, early socializa-tion, or structural ties) that affect individual propen-sity to commit crime, clustering in the data (in ourcase, neighborhoods and families), positive conta-gion, and rate dependence (see McCullagh andNelder 1997; Barron 1992).
17 We are following previous research on deter-rence and crime by controlling for prior crime andarrest. We find similar results when we control forexperienced certainty and unsanctioned offenses.
at Serials Records, University of Minnesota Libraries on January 10, 2011asr.sagepub.comDownloaded from
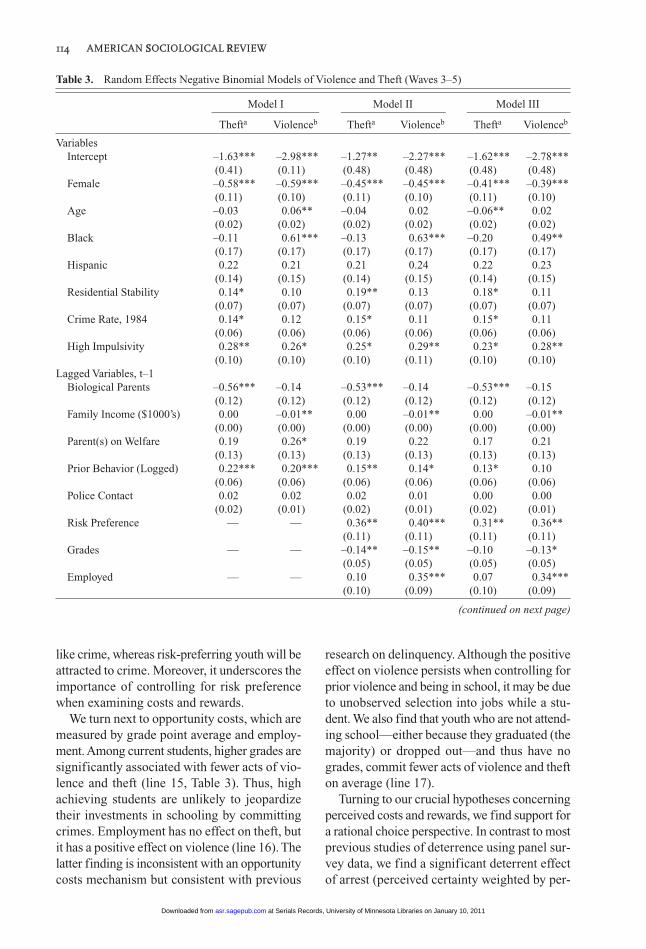
like crime, whereas risk-preferring youth will beattracted to crime. Moreover, it underscores theimportance of controlling for risk preferencewhen examining costs and rewards.
We turn next to opportunity costs, which aremeasured by grade point average and employ-ment. Among current students, higher grades aresignificantly associated with fewer acts of vio-lence and theft (line 15, Table 3). Thus, highachieving students are unlikely to jeopardizetheir investments in schooling by committingcrimes. Employment has no effect on theft, butit has a positive effect on violence (line 16). Thelatter finding is inconsistent with an opportunitycosts mechanism but consistent with previous
research on delinquency. Although the positiveeffect on violence persists when controlling forprior violence and being in school, it may be dueto unobserved selection into jobs while a stu-dent. We also find that youth who are not attend-ing school—either because they graduated (themajority) or dropped out—and thus have nogrades, commit fewer acts of violence and thefton average (line 17).
Turning to our crucial hypotheses concerningperceived costs and rewards, we find support fora rational choice perspective. In contrast to mostprevious studies of deterrence using panel sur-vey data, we find a significant deterrent effectof arrest (perceived certainty weighted by per-
114—–AMERICAN SSOCIOLOGICAL RREVIEW
#2714-ASR 71:1 filename:71105-Matsueda
Table 3. Random Effects Negative Binomial Models of Violence and Theft (Waves 3–5)
Model I Model II Model III
Thefta Violenceb Thefta Violenceb Thefta Violenceb
Variables—Intercept –1.63*** –2.98*** –1.27** –2.27*** –1.62*** –2.78***
(0.41) (0.11) (0.48) (0.48) (0.48) (0.48)—Female –0.58*** –0.59*** –0.45*** –0.45*** –0.41*** –0.39***
(0.11) (0.10) (0.11) (0.10) (0.11) (0.10)—Age –0.03 0.06** –0.04 0.02 –0.06** 0.02
(0.02) (0.02) (0.02) (0.02) (0.02) (0.02)—Black –0.11 0.61*** –0.13 0.63*** –0.20 0.49**
(0.17) (0.17) (0.17) (0.17) (0.17) (0.17)—Hispanic 0.22 0.21 0.21 0.24 0.22 0.23
(0.14) (0.15) (0.14) (0.15) (0.14) (0.15)—Residential Stability 0.14* 0.10 0.19** 0.13 0.18* 0.11
(0.07) (0.07) (0.07) (0.07) (0.07) (0.07)—Crime Rate, 1984 0.14* 0.12 0.15* 0.11 0.15* 0.11
(0.06) (0.06) (0.06) (0.06) (0.06) (0.06)—High Impulsivity 0.28** 0.26* 0.25* 0.29** 0.23* 0.28**
(0.10) (0.10) (0.10) (0.11) (0.10) (0.10)Lagged Variables, t–1—Biological Parents –0.56*** –0.14 –0.53*** –0.14 –0.53*** –0.15
(0.12) (0.12) (0.12) (0.12) (0.12) (0.12)—Family Income ($1000’s) 0.00 –0.01** 0.00 –0.01** 0.00 –0.01**
(0.00) (0.00) (0.00) (0.00) (0.00) (0.00)—Parent(s) on Welfare 0.19 0.26* 0.19 0.22 0.17 0.21
(0.13) (0.13) (0.13) (0.13) (0.13) (0.13)—Prior Behavior (Logged) 0.22*** 0.20*** 0.15** 0.14* 0.13* 0.10
(0.06) (0.06) (0.06) (0.06) (0.06) (0.06)—Police Contact 0.02 0.02 0.02 0.01 0.00 0.00
(0.02) (0.01) (0.02) (0.01) (0.02) (0.01)—Risk Preference .— .— 0.36** 0.40*** 0.31** 0.36**
(0.11) (0.11) (0.11) (0.11)—Grades .— .— –0.14** –0.15** –0.10 –0.13*
(0.05) (0.05) (0.05) (0.05)—Employed .— .— 0.10 0.35*** 0.07 0.34***
(0.10) (0.09) (0.10) (0.09)
(continued on next page)
at Serials Records, University of Minnesota Libraries on January 10, 2011asr.sagepub.comDownloaded from
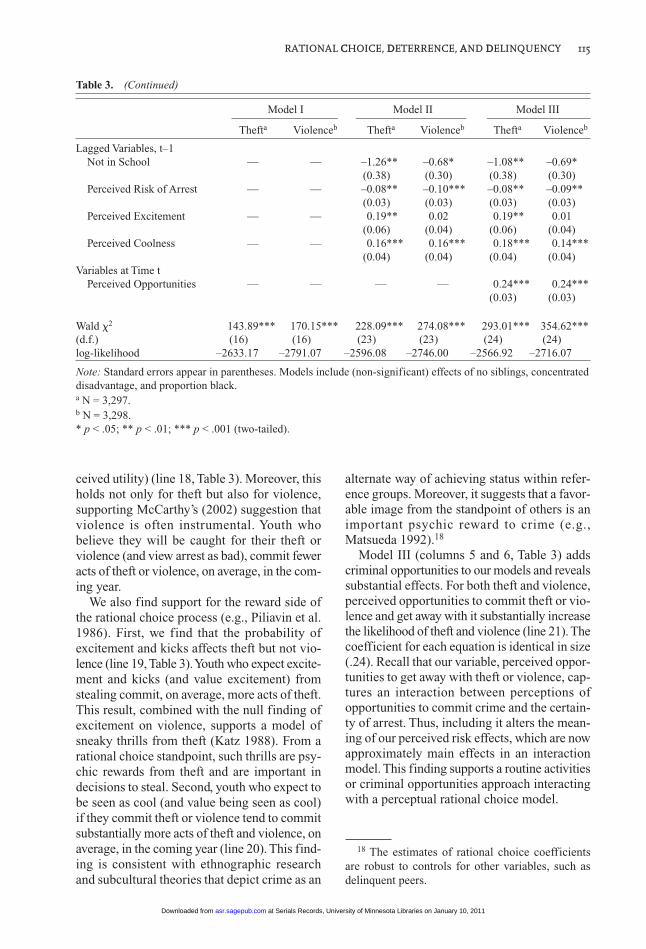
ceived utility) (line 18, Table 3). Moreover, thisholds not only for theft but also for violence,supporting McCarthy’s (2002) suggestion thatviolence is often instrumental. Youth whobelieve they will be caught for their theft orviolence (and view arrest as bad), commit feweracts of theft or violence, on average, in the com-ing year.
We also find support for the reward side ofthe rational choice process (e.g., Piliavin et al.1986). First, we find that the probability ofexcitement and kicks affects theft but not vio-lence (line 19, Table 3). Youth who expect excite-ment and kicks (and value excitement) fromstealing commit, on average, more acts of theft.This result, combined with the null finding ofexcitement on violence, supports a model ofsneaky thrills from theft (Katz 1988). From arational choice standpoint, such thrills are psy-chic rewards from theft and are important indecisions to steal. Second, youth who expect tobe seen as cool (and value being seen as cool)if they commit theft or violence tend to commitsubstantially more acts of theft and violence, onaverage, in the coming year (line 20). This find-ing is consistent with ethnographic researchand subcultural theories that depict crime as an
alternate way of achieving status within refer-ence groups. Moreover, it suggests that a favor-able image from the standpoint of others is animportant psychic reward to crime (e.g.,Matsueda 1992).18
Model III (columns 5 and 6, Table 3) addscriminal opportunities to our models and revealssubstantial effects. For both theft and violence,perceived opportunities to commit theft or vio-lence and get away with it substantially increasethe likelihood of theft and violence (line 21). Thecoefficient for each equation is identical in size(.24). Recall that our variable, perceived oppor-tunities to get away with theft or violence, cap-tures an interaction between perceptions ofopportunities to commit crime and the certain-ty of arrest. Thus, including it alters the mean-ing of our perceived risk effects, which are nowapproximately main effects in an interactionmodel. This finding supports a routine activitiesor criminal opportunities approach interactingwith a perceptual rational choice model.
RATIONAL CCHOICE, DDETERRENCE, AAND DDELINQUENCY—–115
#2714-ASR 71:1 filename:71105-Matsueda
Table 3. (Continued)
Model I Model II Model III
Thefta Violenceb Thefta Violenceb Thefta Violenceb
Lagged Variables, t–1—Not in School .— .— –1.26** –0.68* –1.08** –0.69*
(0.38) (0.30) (0.38) (0.30)—Perceived Risk of Arrest .— .— –0.08** –0.10*** –0.08** –0.09**
(0.03) (0.03) (0.03) (0.03)—Perceived Excitement .— .— 0.19** 0.02 0.19** 0.01
(0.06) (0.04) (0.06) (0.04)—Perceived Coolness .— .— 0.16*** 0.16*** 0.18*** 0.14***
(0.04) (0.04) (0.04) (0.04)Variables at Time t—Perceived Opportunities .— .— .— .— 0.24*** 0.24***
(0.03) (0.03)
Wald �2 143.89*** 170.15*** 228.09*** 274.08*** 293.01*** 354.62***(d.f.) (16) (16) (23) (23) (24) (24)log-likelihood –2633.17 –2791.07 –2596.08 –2746.00 –2566.92 –2716.07
Note: Standard errors appear in parentheses. Models include (non-significant) effects of no siblings, concentrateddisadvantage, and proportion black.a N = 3,297. b N = 3,298.* p < .05; ** p < .01; *** p < .001 (two-tailed).
18 The estimates of rational choice coefficientsare robust to controls for other variables, such asdelinquent peers.
at Serials Records, University of Minnesota Libraries on January 10, 2011asr.sagepub.comDownloaded from
Finally, we can examine the hypothesis,derived from a limited rationality model, thatcriminals discount consequences with a longertime horizon, such as formal sanction, whilefocusing on immediate criminal rewards andopportunities. Standardized coefficients showthe relative effects of perceived cost and rewardsto be comparable in magnitude.19 For theft, thestandardized coefficients for excitement (.15),certainty (–.13), and coolness (.18) are similarin absolute value. For violence, the correspon-ding coefficients for certainty (–.14) and cool-ness (.17) are similar, while excitement has noeffect. Thus, we fail to find support for the dis-counting hypothesis, and instead we find sup-port for both sides of a rational choicemodel—costs and returns.
DISCUSSION
Our results support a Bayesian learning modelof perceived risk formation, a rational choicemodel of criminal behavior, and a deterrencehypothesis of perceived risk of arrest. Previousresearch on deterrence using surveys of per-ceived risk has yielded disparate findings.Cross-sectional studies of self-reported crimefound small deterrent effects, but these studieswere criticized because the temporal orderingof crime and perceived certainty contradictedtheir causal ordering. Panel studies, using laggedeffects to resolve this problem, generally foundno deterrent effects. Our results contrast sharplywith these prior panel studies. We use (1) morerefined measures of certainty of arrest based ona probability scale, (2) a large sample of youthin high risk neighborhoods that insures ade-quate variation in the models’ variables, and(3) appropriate random effects negative bino-mial estimators that overcome bias and ineffi-ciency. Interestingly, cross-sectional vignettestudies, which use criminal intentions as theoutcome variable (to address issues of causalorder), find consistent deterrent effects of per-ceived risk. While it may be tempting to dismissthe vignette results because of a potentialdemand effect—respondents who rate a crime
scenario as certain of arrest probably under-state their intentions to commit the crime—ourpanel models of self-reports provide similarresults. Future research on perceived risk usingboth self-report outcomes and behavioral inten-tions is needed to unravel these processes.
Our results are robust to violations of statis-tical assumptions in our models (see ASR OnlineSupplement). Nevertheless, at least four caveatsare in order. First, the DYS study sampled highrisk disorganized neighborhoods, and we havebeen careful not to generalize to low risk neigh-borhoods. We can speculate, however, that if ourmodels can be generalized, such neighborhoodshave lower rates of delinquency, in part, becausethe young residents have fewer delinquent peers,think arrest will follow crime due to the shell ofillusion, and do not see crime as a way of gain-ing excitement or being cool. Second, althoughwe discuss cognitive heuristics to illustrate howlearning risk perceptions might depart fromBayesian learning, we have not formally testedfor heuristics. This would require calibratingour respondents’ estimates against a true stan-dard so we could test for objective bias in updat-ing estimates. Indeed, our estimates are notsufficiently calibrated to rule out cognitiveheuristics in our risk estimates—we can onlyrule out the extreme hypothesis that they elim-inate a Bayesian form of updating entirely. Third,although our models use strong measures ofcosts and returns to crime based on ethnographicresearch, they have not exhausted all possibleincentives. For example, we have controlled forthe monetary return to crime by specifying ahypothetical amount in our rewards and costsmeasures, but have not examined variation inmonetary returns. Fourth, we have relied on aone-year lagged effect of perceived costs andreturns to crime, which may have understatedtheir effects. The pertinent incentives are thoseperceived at the time a criminal opportunitypresents itself, and these may have changedsince the measurement in the previous wave(Piliavin et al. 1986).
Our principal finding that criminal acts ofviolence and theft conform to a rational choicemodel may surprise sociologists skeptical ofrational choice theories for being reductionist,for being relatively simple models laden withheavy assumptions, and for threatening to usurpthe traditional domain of the discipline. We sug-gest that rational choice and institutional theo-
116—–AMERICAN SSOCIOLOGICAL RREVIEW
#2714-ASR 71:1 filename:71105-Matsueda
19 Our standardized negative binomial coefficientsare exp(�ksk) – 1, where �k is the k-th coefficient andsk is the standard deviation of the k-th independentvariable (Long 1997).
at Serials Records, University of Minnesota Libraries on January 10, 2011asr.sagepub.comDownloaded from
ries can be complementary. In fact, in mostinstitutional analyses, it may be prudent to beginwith an individual-level rational actor model, asa parsimonious point of departure, before iden-tifying the limitations of such a model and mov-ing to complicate matters with more nuancedconcepts of structure, preference, and organi-zation (e.g., Weber [1921/1922] 1978). Ourresults, while based on an individual-level modelof action, do not eschew the role of broaderinstitutions and groups in decision making. Wefind that the educational institution, by incul-cating commitments among students, providesan important opportunity cost for offending.Moreover, we find the legal institution, with itsdispassionate threats of punitive sanctions, to bean intimate part of criminal decisions throughyouths’ perceptions of the risk of sanction.Perceived risk, in turn, is formed in part byinformation gleaned from informal peer groups,as well as direct experience with the legal sys-tem. We also find that social status withingroups, as indicated by the importance of beingseen as cool, is a key component of decisionsto offend. Thus, institutional arrangementsunderlie the parameters of our rational choicemodel.
Finally, our results have some indirect impli-cations for public policy. Although we find a sig-nificant deterrent effect of perceived risk oncrime, the effect is modest in size. In a model(not reported) that disentangles perceived riskof arrest from the value (severity) of arrest andexcludes opportunities, we find that a ten-pointincrease in perceived risk (on a 0–100 proba-bility scale in which mean risk is 46.5 for theftand 43.6 for violence) is associated with a threepercent reduction in the expected number ofthefts and a five percent reduction in the expect-ed number of violent acts.20 The correspondingeffects for rewards are larger: A ten-pointdecrease in the probability of “being seen ascool” is associated with a six percent reductionin theft and a seven percent reduction in vio-lence. For excitement, the effect is a six percentreduction (for theft). Our finding that perceived
risk of punishment has a small but significanteffect is consistent with rational choice (andsocial learning) models of individual behavior,the utilitarian assumptions underlying our crim-inal justice system, and therefore, the legitima-cy of using some minimal level of the threat ofpunishment imposed by the state.
But given that the United States has one ofthe highest arrest and imprisonment rates amongWestern nations, increasing the perceived prob-ability of arrest by 0.1 would likely involve dra-conian steps by the criminal justice system.This implies that policies for increasing theobjective probability of punishment, by them-selves, may be of limited value for reducingthe crime rate substantially (Cullen et al. 2002).Indeed, the modest explained variance in ourmodels of theft (seven percent) and violence(nine percent) suggests that other processes,such as socialization and embeddedness in insti-tutions, may dwarf the effects of punishment andsuggest more efficient policy interventions.21
Our results suggest equally promisingavenues for intervention: school programs toteach peer groups that crime is not cool; insti-tutional programs to increase opportunity coststo crime by enhancing human capital; and recre-ational programs to provide outlets for youthwith strong preferences for risk and excitement(for promising leads, see Elliott, Hamburg, andWilliams 1998). Furthermore, our finding thatdelinquents learn they can get away with crime(and each undetected offense further reducestheir estimates of the risk of arrest) underscoresthe importance of early interventions, occur-ring before delinquent careers develop and riskestimates decline. Perhaps educational programsteaching youth that the actual long run risk ofdetection over a criminal career is actually highmay be worth pursuing.
Given the modest effects of the perceivedthreat of punishment, it is troubling that “gettough on crime” policies, such as sentencingguidelines, “three strikes and you’re out” laws,and mandatory minimum sentences have gainedsuch traction at the outset of the 21st century.
RATIONAL CCHOICE, DDETERRENCE, AAND DDELINQUENCY—–117
#2714-ASR 71:1 filename:71105-Matsueda
20 Note that our sample of 1,472 individuals com-mitted 3,321 acts of violence and 3,307 acts of theft(per year). Therefore, increasing the probability ofarrest by 0.1 would be expected to “save” 156 actsof violence and 109 acts of theft in a year.
21 We are using a pseudo-R2 based on the likeli-hood ratio test statistic: R2 = 1 – (L�/L�)2/n, where L�
is the maximum of the likelihood function for anintercept-only null model and L� is that for thehypothesized model (see Long 1997).
at Serials Records, University of Minnesota Libraries on January 10, 2011asr.sagepub.comDownloaded from
This is particularly ironic given that Beccaria’s([1764] 1963) proposed system of justice basedon utilitarian ideas emphasized curtailing theseverity of punishments and using them only asa last resort.
Sociological analyses suggest that the ration-ale for punishment has less to do with deterrenceand more to do with larger political processesendemic to U.S. capitalism, particularly in latemodernity. For example, Garland (2001) com-pares the United States to England and despairsthat, in late modernity, a culture of risk man-agement (backed by economic rationality), cen-tralized state power (which has shifted decisionmaking away from criminal justice practition-ers to politicians), and a shift from welfare(rehabilitation and prevention) to penal orien-tations has led to policies of severe punishment,increasing surveillance, and determinate sen-tencing. Garland’s conclusions about late moder-nity rest on commonalities betweencontemporary United States and England. Incontrast, Whitman (2003) holds constant latemodernity by contrasting contemporary UnitedStates with France and Germany. He concludesthat the confluence of a strong state (in whichbureaucrats are free to interpret—soften—thelaw to fit individual circumstances) (see Rosettand Cressey 1976) and memories of the brutalpunishments doled out to the lower classes dur-ing the “reign of terror” led to mild punish-ments (mercy) for all offenders in France andGermany. This “leveling up” of treatment toapproximate that of aristocrats is absent in theUnited States because of its weak state andbecause U.S. citizens lack a shared history ofbrutality. The result is a shift from the judicialto the legislative, whereby mechanical punish-ments are subject to political processes in whichparties clamor to appear tough on crime.
Policies of getting tough on crime alwaysresonate well in the U.S. political arena.However, such resonance is often based more onideology than empirical research on punitivepractices, such as evaluations of California’sThree Strikes laws that show at best small gen-eral deterrent effects (e.g., Zimring, Hawkins,
and Kamin 2001), and our findings of modestdeterrent effects of perceived certainty of arrest.The finding of some deterrent effect, howevermodest, is not surprising, given the need forthe appearance of legitimacy in the legal systemto maintain the consent of the governed. Whatis surprising, however, is the persistence ofincreasingly harsh punitive crime policies inthe United States in the face of this growingbody of research.
Ross L. Matsueda is Professor of Sociology at theUniversity of Washington and is a Visiting Scholar atthe University of Wisconsin-Madison. His researchinterests center on the sociology of crime, law, anddeviance, social psychology, and methods. His cur-rent projects include the Seattle Neighborhoods andCrime Project (with Robert Crutchfield, Avery Guest,and Kevin Drakulich), which is a study of neighbor-hood organization, codes of the street, and spatialdynamics of violence in Seattle neighborhoods; LifeCourse Trajectories of Drug Use and Crime (withKreager, Huizinga, and Elena Erosheva); and siblingmodels of child behavior problems (with LingxinHao).
Derek A. Kreager is a Ph.D. candidate in theDepartment of Sociology at the University ofWashington. His research interests include crime,the life course, deterrence, and social network analy-sis. His dissertation explores the links between peernetworks and adolescent violence. His recent workincludes “Strangers in the Halls: Isolation andDelinquency in School Networks” Social Forces83(2004):351–90.
David Huizinga is Senior Research Associate in theInstitute for Behavioral Science at the University ofColorado. He is principal investigator of the DenverYouth Survey, now in its 19th year, and has been co-principal and principal investigator of the NationalYouth Survey, now in its 29th year. Both are longitu-dinal studies of problem and successful behaviorsover the life course that focus on delinquency, vio-lence, drug use, victimization, and mental health.He has also recently been the principal investigatorof two comparative studies (with Karl Schumann)investigating the effect of the transition from schoolto work and the effect of juvenile justice processingon subsequent criminal behavior in Germany and theUnited States.
118—–AMERICAN SSOCIOLOGICAL RREVIEW
#2714-ASR 71:1 filename:71105-Matsueda
at Serials Records, University of Minnesota Libraries on January 10, 2011asr.sagepub.comDownloaded from
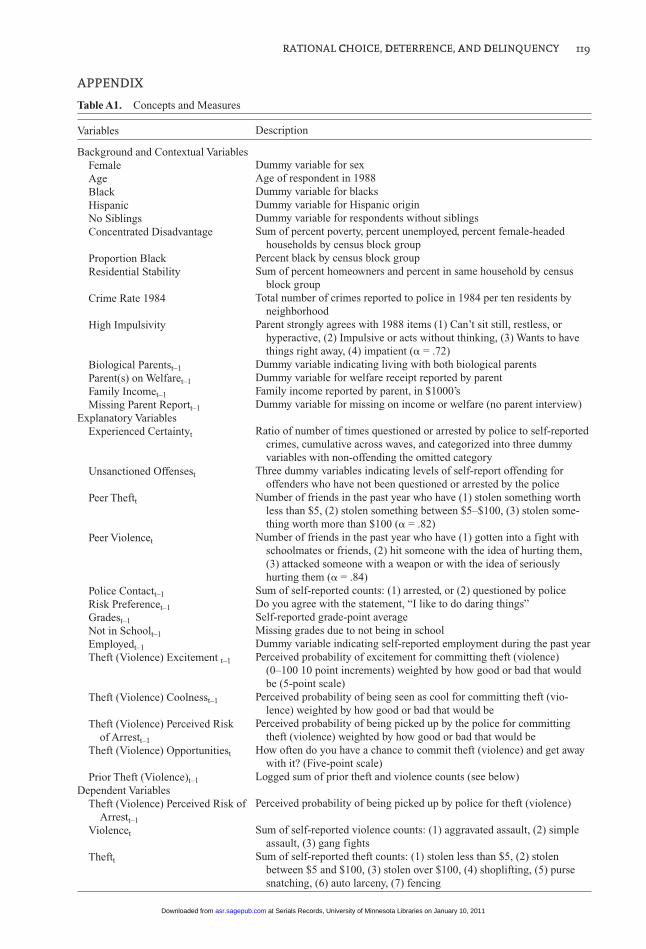
RATIONAL CCHOICE, DDETERRENCE, AAND DDELINQUENCY—–119
#2714-ASR 71:1 filename:71105-Matsueda
APPENDIX
Table A1.—Concepts and Measures
Variables
Background and Contextual Variables—Female—Age—Black—Hispanic—No Siblings—Concentrated Disadvantage
—Proportion Black—Residential Stability
—Crime Rate 1984
—High Impulsivity
—Biological Parentst–1
—Parent(s) on Welfaret–1
—Family Incomet–1
—Missing Parent Reportt–1
Explanatory Variables—Experienced Certaintyt
—Unsanctioned Offensest
—Peer Theftt
—Peer Violencet
—Police Contactt–1
—Risk Preferencet–1
—Gradest–1
—Not in Schoolt–1
—Employedt–1
—Theft (Violence) Excitement t–1
—Theft (Violence) Coolnesst–1
—Theft (Violence) Perceived Risk ——of Arrestt–1
—Theft (Violence) Opportunitiest
—Prior Theft (Violence)t–1
Dependent Variables—Theft (Violence) Perceived Risk of ——Arrestt–1
—Violencet
—Theftt
Description
XDummy variable for sexAge of respondent in 1988Dummy variable for blacksDummy variable for Hispanic originDummy variable for respondents without siblingsSum of percent poverty, percent unemployed, percent female-headed
households by census block groupPercent black by census block groupSum of percent homeowners and percent in same household by census
block groupTotal number of crimes reported to police in 1984 per ten residents by
neighborhoodParent strongly agrees with 1988 items (1) Can’t sit still, restless, or
hyperactive, (2) Impulsive or acts without thinking, (3) Wants to havethings right away, (4) impatient (� = .72)
Dummy variable indicating living with both biological parentsDummy variable for welfare receipt reported by parentFamily income reported by parent, in $1000’sDummy variable for missing on income or welfare (no parent interview)
Ratio of number of times questioned or arrested by police to self-reportedcrimes, cumulative across waves, and categorized into three dummyvariables with non-offending the omitted category
Three dummy variables indicating levels of self-report offending foroffenders who have not been questioned or arrested by the police
Number of friends in the past year who have (1) stolen something worthless than $5, (2) stolen something between $5–$100, (3) stolen some-thing worth more than $100 (� = .82)
Number of friends in the past year who have (1) gotten into a fight withschoolmates or friends, (2) hit someone with the idea of hurting them,(3) attacked someone with a weapon or with the idea of seriouslyhurting them (� = .84)
Sum of self-reported counts: (1) arrested, or (2) questioned by policeDo you agree with the statement, “I like to do daring things”Self-reported grade-point averageMissing grades due to not being in schoolDummy variable indicating self-reported employment during the past yearPerceived probability of excitement for committing theft (violence)
(0–100 10 point increments) weighted by how good or bad that wouldbe (5-point scale)
Perceived probability of being seen as cool for committing theft (vio-lence) weighted by how good or bad that would be
Perceived probability of being picked up by the police for committingtheft (violence) weighted by how good or bad that would be
How often do you have a chance to commit theft (violence) and get awaywith it? (Five-point scale)
Logged sum of prior theft and violence counts (see below)
Perceived probability of being picked up by police for theft (violence)
Sum of self-reported violence counts: (1) aggravated assault, (2) simpleassault, (3) gang fights
Sum of self-reported theft counts: (1) stolen less than $5, (2) stolenbetween $5 and $100, (3) stolen over $100, (4) shoplifting, (5) pursesnatching, (6) auto larceny, (7) fencing
at Serials Records, University of Minnesota Libraries on January 10, 2011asr.sagepub.comDownloaded from
REFERENCES
Achen, Christopher H. 1992. “Social Psychology,Demographic Variables, and Linear Regression:Breaking the Iron Triangle in Voting Research.”Political Behavior 14:195–211.
Akers, Ronald L. 1998. Social Learning and SocialStructure. Boston, MA: Northeastern University.
Andenaes, Johannes. 1975. “General PreventionRevisited: Research and Policy Implications.”Journal of Criminal Law and Criminology66:338–65.
Anderson, Elijah. 1999. Code of the Street: Decency,Violence and the Moral Life of the Inner City.New York: W. W. Norton.
Barron, David N. 1992. “The Analysis of CountData: Overdispersion and Autocorrelation.” Pp.179–220 in Sociological Methodology, vol. 22,edited by P. V. Marsden. Cambridge, MA:Blackwell Publishers.
Beccaria, Cesare. [1764] 1963. On Crimes andPunishments. Indianapolis, IN: Bobbs-Merrill.
Becker, Gary S. 1968. “Crime and Punishment: AnEconomic Approach.” Journal of PoliticalEconomy 76:169–217.
Bentham, Jeremy. [1789] 1948. An Introduction to thePrinciple of Morals and Legislations. Oxford, UK:Blackwell.
Blackwell, Brenda Sims and Sarah Eschholz. 2002.“Sex Differences in Rational Choice: TraditionalTests and New Directions.” Pp. 109–36 in RationalChoice and Criminal Behavior: Recent Researchand Future Challenges, edited by A. R. Piqueroand S. G. Tibbetts. New York: Routledge.
Carroll, J. S. 1978. “A Psychological Approach toDeterrence: The Evaluation of CrimeOpportunities.” Journal of Personality and SocialPsychology 36:1512–20.
Chambliss, William J. 1967. “Types of Deviance andthe Effectiveness of Legal Sanctions.” WisconsinLaw Review Summer:703–19.
Clarke, Ronald V. and Derek B. Cornish. 1985.“Modeling Offenders’ Decisions: A Frameworkfor Research and Policy.” Pp. 147–85 in Crime andJustice: An Annual Review of Research, Volume 6,edited by N. Morris and M. Tonry. Chicago, IL:University of Chicago Press.
Cloward, Richard A. and Lloyd E. Ohlin. 1960.Delinquency and Opportunity. New York: FreePress.
Cohen, Albert K. 1955. Delinquent Boys. New York:Free Press.
Cohen, Lawrence E. and Marcus Felson. 1979.“Social Change and Crime Rate Trends: A RoutineActivity Approach.” American Sociological Review44:588–608.
Coleman, James S. 1990. Foundations of SocialTheory. Cambridge, MA: Harvard.
Cook, Philip. 1980. “Research in Criminal
Deterrence: Laying the Groundwork for the SecondDecade.” Pp. 211–68 in Crime and Justice: AnAnnual Review of Research, vol. 2, edited by N.Morris and M. Tonry. Chicago, IL: University ofChicago Press.
Cragg, John G. 1971. “Some Statistical Models forLimited Dependent Variables with Application tothe Demand for Durable Goods.” Econometrica39:829–44.
Cullen, Francis T., Travis C. Pratt, Sharon LevranMiceli, and Melissa M. Moon. 2002. “DangerousLiaison? Rational Choice Theory as the Basis forCorrectional Intervention.” Pp. 279–97 in RationalChoice and Criminal Behavior, edited by A. R.Piquero and S. G. Tibbetts. New York: Routledge.
Douglas, Mary. 1986. How Institutions Think.Syracuse, NY: Syracuse University Press.
Ehrlich, Isaac. 1973. “Participation in IllegitimateActivities: A Theoretical and EmpiricalInvestigation.” Journal of Political Economy81:521–65.
Elliott, Delbert S., Beatrix Hamburg, and Kirk R.Williams, eds. 1998. Violence in American Schools.New York: Cambridge University Press.
Esbensen, Finn-Aage and David Huizinga. 1990.“Community Structure and Drug Use: From aSocial Disorganization Perspective.” JusticeQuarterly 7:691–709.
Frazier, Charles E. and Thomas Meisenhelder. 1985.“Exploratory Notes on Criminality and EmotionalAmbivalence.” Qualitative Sociology 8:266–284.
Garland, David. 1990. Punishment and ModernSociety. Chicago, IL: University of Chicago.
———. 2001. The Culture of Control. Chicago, IL:University of Chicago.
Greene, William H. 2002. LIMDEP Version 8.0Reference Guide. Plainview, NY: EconometricSoftware, Inc.
———. 2003. Econometric Analysis. Upper SaddleRiver, NJ: Prentice Hall.
Gottfredson, Michael R. and Travis Hirschi. 1990. AGeneral Theory of Crime. Stanford, CA: StanfordUniversity Press.
Hagan, John and Bill McCarthy. 1997. Mean Streets:Youth Crime and Homelessness. New York:Cambridge University Press.
Hagan, John, John Simpson, and A. R. Gillis. 1987.“Class in the Household: A Power-Control Theoryof Gender and Delinquency.” American Journal ofSociology 92:788–816.
Hausman, Jerry, Bronwyn Hall, and Zvi Griliches.1984. “Econometric Models for Count Data withan Application to the Patents—R & DRelationship.” Econometrica 52:909–38.
Hechter, Michael and Satoshi Kanazawa. 1997.“Sociological Rational Choice Theory.” AnnualReview of Sociology 23:191–214.
Heimer, Carol A. 1988. “Social-Structure,
120—–AMERICAN SSOCIOLOGICAL RREVIEW
#2714-ASR 71:1 filename:71105-Matsueda
at Serials Records, University of Minnesota Libraries on January 10, 2011asr.sagepub.comDownloaded from
Psychology, and the Estimation of Risk.” AnnualReview of Sociology 14:491–519.
Hirschi, Travis. 1969. Causes of Delinquency.Berkeley, CA: University of California Press.
Horney, Julie and Ineke H. Marshall. 1992. “RiskPerceptions Among Serious Offenders: The Roleof Crime and Punishment.” Criminology30:575–94.
Horowitz, Ruth. 1983. Honor and the AmericanDream. New Brunswick, NJ: Rutgers UniversityPress.
Hume, David. [1739] 2000. A Treatise of HumanNature, edited by David Fate Norton and Mary J.Norton. Oxford, UK: Oxford University Press.
Jacob, Herbert. 1979. “Rationality and Criminality.”Social Science Quarterly 59:584–5.
Jacobs, Bruce A. 2000. Robbing Drug Dealers. NewYork: Aldine.
Jenkins, Patricia H. 1995. “School Delinquency andSchool Commitment.” Sociology of Education68(3):221–39.
Jensen, Gary. 1969. “Crime Doesn’t Pay: Correlatesof a Shared Misunderstanding.” Social Problems17:189–201.
Kahneman, Daniel and Amos Tversky. 1972.“Subjective Probability: A Judgment ofRepresentativeness.” Cognitive Psychology3:430–54.
Kahneman, Daniel, Peter P. Wakker, and RakeshSarin. 1997. “Back to Bentham? Explorations ofExperienced Utility.” The Quarterly Journal ofEconomics 112:375–405.
Katz, Jack. 1988. Seductions of Crime: Moral andSensual Attractions in Doing Evil. New York: BasicBooks, Inc.
Klepper, Steven and Daniel S. Nagin. 1989. “TheDeterrent Effect of Perceived Certainty andSeverity of Punishment Revisited.” Criminology27:721–46.
Langley, John, producer. [1988] 2005. Cops.Television series. Los Angeles, CA: FoxBroadcasting Company.
Levitt, Steven. 1997. “Using Electoral Cycles inPolice Hiring to Estimate the Effect of Police onCrime.” American Economic Review 87:270–90.
Lochner, Lance. 2005. “Individual Perceptions ofthe Criminal Justice System.” Working Paper No.9474, National Bureau of Economic Research,Cambridge, MA.
Long, Scott. 1997. Regression Models for Categoricaland Limited Dependent Variables. Thousand Oaks,CA: Sage.
Maddala, G. S. 1983. Limited-Dependent andQualitative Variables in Econometrics. Cambridge,UK: Cambridge University Press.
Maestro, Marcello T. 1973. Cesare Beccaria and theOrigins of Penal Reform. Philadelphia, PA: TempleUniversity.
Marvell, Thomas and Carlisle Moody. 1994. “Prison
Population Growth and Crime Reduction.” Journalof Quantitative Criminology 10:109–40.
Matsueda, Ross L. 1992. “Reflected Appraisals,Parental Labeling, and Delinquent Behavior:Specifying a Symbolic Interactionist Theory.”American Journal of Sociology 97:1577–1611.
McCall, Nathan. 1994. Makes Me Wanna Holler.New York: Vintage.
McCarthy, Bill. 2002. “New Economics ofSociological Criminology.” Annual Review ofSociology 28:417–42.
McCarthy, Bill and John Hagan. 2005. “Danger,Deterrence, and the Decision to Offend.” SocialForces 83:1065–96.
McCullagh, P. and J. A. Nelder. 1997. GeneralizedLinear Models. 2d ed. London, UK: Chapman &Hall.
McFadden, Daniel L. and Kenneth E. Train. 1996.“Consumers’ Evaluation of New Products:Learning from Self and Others.” Journal ofPolitical Economy 104:683–703.
Morrow, James D. 1994. Game Theory for PoliticalScientists. Princeton, NJ: Princeton University.
Nagin, Daniel S. 1978. “General Deterrence: AReview of the Empirical Evidence.” Pp. 95–139 inDeterrence and Incapacitation: Estimating theEffects of Criminal Sanction on Crime Rates, edit-ed by A. Blumstein, J. Cohen, and D. Nagin.Washington, DC: National Academy Press.
———. 1998. “Criminal Deterrence Research at theOutset of the Twenty-First Century.” Crime andJustice: A Review of Research 23:1–42.
Nagin, Daniel S. and Raymond Paternoster. 1994.“Personal Capital and Social Control: TheDeterrence Implications of Individual Differencesin Criminal Offending.” Criminology 32:581–606.
Nagin, Daniel S. and Greg Pogarsky. 2001.“Integrating Celerity, Impulsivity, and ExtralegalSanction Threats into a Model of GeneralDeterrence: Theory and Evidence.” Criminology39:865–92.
Parker, Jerry and Harold G. Grasmick. 1979.“Linking Actual and Perceived Certainty ofPunishment: An Exploratory Study of an UntestedProposition in Deterrence Theory.” Criminology17:365–79.
Pashukanis, Evgeny B. [1929] 1978. Law andMarxism: A General Theory, edited by ChrisArthur. London, UK: Ink Links.
Paternoster, Raymond. 1987. “The Deterrence Effectof the Perceived Certainty and Severity ofPunishment: A Review of the Evidence andIssues.” Justice Quarterly 4:173–217.
Paternoster, Raymond, Shawn Bushway, RobertBrame, and Robert Apel. 2003. “The Effect ofTeenage Employment on Delinquency andProblem Behaviors.” Social Forces 82:297–335.
Piliavin, Irving, Rosemary Gartner, Craig Thornton,and Ross L. Matsueda. 1986. “Crime, Deterrence,
RATIONAL CCHOICE, DDETERRENCE, AAND DDELINQUENCY—–121
#2714-ASR 71:1 filename:71105-Matsueda
at Serials Records, University of Minnesota Libraries on January 10, 2011asr.sagepub.comDownloaded from
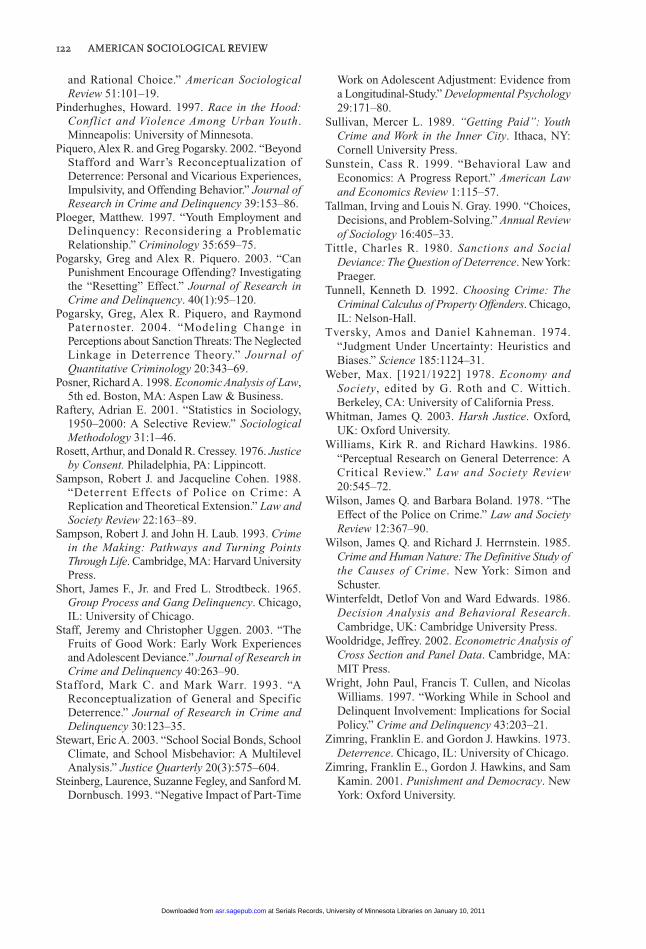
and Rational Choice.” American SociologicalReview 51:101–19.
Pinderhughes, Howard. 1997. Race in the Hood:Conflict and Violence Among Urban Youth.Minneapolis: University of Minnesota.
Piquero, Alex R. and Greg Pogarsky. 2002. “BeyondStafford and Warr’s Reconceptualization ofDeterrence: Personal and Vicarious Experiences,Impulsivity, and Offending Behavior.” Journal ofResearch in Crime and Delinquency 39:153–86.
Ploeger, Matthew. 1997. “Youth Employment andDelinquency: Reconsidering a ProblematicRelationship.” Criminology 35:659–75.
Pogarsky, Greg and Alex R. Piquero. 2003. “CanPunishment Encourage Offending? Investigatingthe “Resetting” Effect.” Journal of Research inCrime and Delinquency. 40(1):95–120.
Pogarsky, Greg, Alex R. Piquero, and RaymondPaternoster. 2004. “Modeling Change inPerceptions about Sanction Threats: The NeglectedLinkage in Deterrence Theory.” Journal ofQuantitative Criminology 20:343–69.
Posner, Richard A. 1998. Economic Analysis of Law,5th ed. Boston, MA: Aspen Law & Business.
Raftery, Adrian E. 2001. “Statistics in Sociology,1950–2000: A Selective Review.” SociologicalMethodology 31:1–46.
Rosett, Arthur, and Donald R. Cressey. 1976. Justiceby Consent. Philadelphia, PA: Lippincott.
Sampson, Robert J. and Jacqueline Cohen. 1988.“Deterrent Effects of Police on Crime: AReplication and Theoretical Extension.” Law andSociety Review 22:163–89.
Sampson, Robert J. and John H. Laub. 1993. Crimein the Making: Pathways and Turning PointsThrough Life. Cambridge, MA: Harvard UniversityPress.
Short, James F., Jr. and Fred L. Strodtbeck. 1965.Group Process and Gang Delinquency. Chicago,IL: University of Chicago.
Staff, Jeremy and Christopher Uggen. 2003. “TheFruits of Good Work: Early Work Experiencesand Adolescent Deviance.” Journal of Research inCrime and Delinquency 40:263–90.
Stafford, Mark C. and Mark Warr. 1993. “AReconceptualization of General and SpecificDeterrence.” Journal of Research in Crime andDelinquency 30:123–35.
Stewart, Eric A. 2003. “School Social Bonds, SchoolClimate, and School Misbehavior: A MultilevelAnalysis.” Justice Quarterly 20(3):575–604.
Steinberg, Laurence, Suzanne Fegley, and Sanford M.Dornbusch. 1993. “Negative Impact of Part-Time
Work on Adolescent Adjustment: Evidence froma Longitudinal-Study.” Developmental Psychology29:171–80.
Sullivan, Mercer L. 1989. “Getting Paid”: YouthCrime and Work in the Inner City. Ithaca, NY:Cornell University Press.
Sunstein, Cass R. 1999. “Behavioral Law andEconomics: A Progress Report.” American Lawand Economics Review 1:115–57.
Tallman, Irving and Louis N. Gray. 1990. “Choices,Decisions, and Problem-Solving.” Annual Reviewof Sociology 16:405–33.
Tittle, Charles R. 1980. Sanctions and SocialDeviance: The Question of Deterrence. New York:Praeger.
Tunnell, Kenneth D. 1992. Choosing Crime: TheCriminal Calculus of Property Offenders. Chicago,IL: Nelson-Hall.
Tversky, Amos and Daniel Kahneman. 1974.“Judgment Under Uncertainty: Heuristics andBiases.” Science 185:1124–31.
Weber, Max. [1921/1922] 1978. Economy andSociety, edited by G. Roth and C. Wittich.Berkeley, CA: University of California Press.
Whitman, James Q. 2003. Harsh Justice. Oxford,UK: Oxford University.
Williams, Kirk R. and Richard Hawkins. 1986.“Perceptual Research on General Deterrence: ACritical Review.” Law and Society Review20:545–72.
Wilson, James Q. and Barbara Boland. 1978. “TheEffect of the Police on Crime.” Law and SocietyReview 12:367–90.
Wilson, James Q. and Richard J. Herrnstein. 1985.Crime and Human Nature: The Definitive Study ofthe Causes of Crime. New York: Simon andSchuster.
Winterfeldt, Detlof Von and Ward Edwards. 1986.Decision Analysis and Behavioral Research.Cambridge, UK: Cambridge University Press.
Wooldridge, Jeffrey. 2002. Econometric Analysis ofCross Section and Panel Data. Cambridge, MA:MIT Press.
Wright, John Paul, Francis T. Cullen, and NicolasWilliams. 1997. “Working While in School andDelinquent Involvement: Implications for SocialPolicy.” Crime and Delinquency 43:203–21.
Zimring, Franklin E. and Gordon J. Hawkins. 1973.Deterrence. Chicago, IL: University of Chicago.
Zimring, Franklin E., Gordon J. Hawkins, and SamKamin. 2001. Punishment and Democracy. NewYork: Oxford University.
122—–AMERICAN SSOCIOLOGICAL RREVIEW
#2714-ASR 71:1 filename:71105-Matsueda
at Serials Records, University of Minnesota Libraries on January 10, 2011asr.sagepub.comDownloaded from