Embed Size (px)
Citation preview
The Operations Excellence audit sheet Erlend Alfnes, Heidi Dreyer, and Jan Ola Strandhagen
Department of Production and Quality Engineering, Norwegian
University of Science and Technology, NTNU, Norway
WWW homepage: http://www.produksjonslogistikk.no
Abstract. This paper presents an Operations Excellence (OE) audit sheet that
enables companies to get a quick assessment of their operations performance.
The sheet is based on well known assessment schemes within lean
manufacturing developed by Godson, Kobayashi, and Schonberger. These
three schemes are combined and enhanced in the audit sheet, which defines 15
areas of operations excellence. The audit sheet is a powerful tool to assess the
current state and to plan the future state of enterprise operations. It has been
successfully applied in several enterprise reengineering projects to provide
decision-makers with sufficient input to identify improvement targets and
revise the current operations strategy. The use of the audit sheet is
demonstrated in two case examples from Norwegian industry, and some
insights are given regarding the sheet’s applicability for different types of
manufacturing processes.
1 Introduction
Searching for and learning from “best practices” has been a topic for both industry
and academia for decades. A lot of effort has been put into identifying “best practices” to support companies achieve superior performance. However, the piece-
mal application of best practices which are common in many enterprises - limited to specific parts or functional areas and with conflicting objectives - often lead to
inefficiencies and disappointing results [6]. Assessment schemes such as the Baldrige award, the European Foundation for
Quality Management, and other business excellence approaches [3] ҏ are powerful tools to achieve coherence between strategy and best practice programs. However, in
the area of manufacturing operations, such tools are rather few and limited to the assessment of lean performance. The purpose of this paper is to analyse the most
well-known assessment schemes within lean manufacturing, and to propose a more generic Operations Excellence (OE) audit scheme that enables enterprises to get
a quick assessment of their manufacturing operations performance.
130 Erlend Alfnes, Heidi Dreyer and Jan Ola Strandhagen
The paper is structured as follows. First, the link to the lean paradigm and how this influences the generality of the OE audit sheet is discussed. Next, three lean
assessments schemes are analysed and a set of key factors to assess operations excellence is proposed. Subsequently, the use of the OE audit sheet is demonstrated
in two case examples. Finally, the paper is concluded with some insights about the sheet’s applicability for different types of manufacturing processes.
2 Point of departure – lean manufacturing
The OE audit sheet aims to be a generic and neutral tool to assess operations
excellence for all types of manufacturing. However, the audit sheet is based on tools developed within the lean paradigm, tools that equalise operations excellence and
lean performance. The major reason for this limited, and rather biased point of departure, is the significant role of lean concepts for improving and describing
manufacturing operations. The lean manufacturing approach developed at Toyota provides a set of
concepts, methods, and techniques that are more detailed and interrelated than any other approach available, and has led to significant improvements during the last two
decades. To quote Godson [4] “A revolution in operations has occurred over the last fifteen years as a result of world competition and the implementation of best
practices. This revolution is largely based on the Toyota Production System (TPS), and the concepts from this system have spread from Toyota to the rest of the world”.
Lean concepts (such as 5S, SMED, TPM, and so on) are therefore essential building blocks for enterprises that aims to develop best-in-class operations. (See Bicheno
[2] ҏfor a comprehensive overview of lean concepts and techniques). Lean concepts were developed for repetitive manufacturing of automobiles. The
lean vision of excellent operations therefore refers to the type of repetitive operations found in batch or line production. The lean vision of operation excellence can be
described by the following quotation from Kobayashi [5]. “In the level five factory .… the entire factory has become a single line with zero
internal inventory. The plant uses quick changeover technology and runs a fully
mixed production schedule, leading to ultimate adaptability”.
This vision of the excellent enterprise, as a single line that can produce a mixed
set of products, is clearly most suited for batch or line type of operations. Lean manufacturing requires standardised work and minimum variation, and is most
suited for standard products with minor customizations, or customisation that involves choosing from a set of predefined options, and for markets with relatively
stable demand. (See Suri [11] for a discussion about the suitability of lean concepts for high variety operations). All lean concepts is therefore not applicable for job shop
type of operations (which typically compete on customisation and high level of craft work), or continuous processing type of operations (which typically compete on
efficiency and resource utilisation). The audit sheet aims to provide a generic definition of operations excellence.
However, the lean roots of the audit sheet make the 15 areas most suitable to
The Operations Excellence audit sheet
131
describe excellence for batch or line type of operations. For other types of operations, it might be necessary to add other areas of excellence, and it might not be
possible to achieve the defined excellence objectives in all 15 areas. Furthermore, no enterprise can be excellent in every dimension, trade-offs has to be made. The audit
sheet is therefore a useful tool to assess the gap between operations capability and operations strategy, and to prioritize the targets for improvements.
3 Critical areas for operations excellence
The OE audit sheet is based on the well-known assessment schemes developed by
Godson [4], Kobayashi [5], and Schonberger [7] for lean manufacturing. The major areas of excellence and the related factors/principles in these three approaches are
presented below.
3.1 A comparison of audit schemes for manufacturing excellence
Godson has developed the Rapid Plant Assessment (RPA) tool to assess the state of
an operation based on a brief plant tour. The RPA tool focuses on visual cues and key data generally available, and enables visitors and managers to assess the
operations performance of the plant. The two other schemes are not only assessment tools, but are also guides for implementing lean manufacturing. Kobayashi’s scheme
is classic Japanese, concentrating on shop floor management. Schonberger’s goes wider in bringing in customers, benchmarking and perhaps a more western view of
employees. As a generalisation, Godson’s scheme covers the major aspects of plant floor operations, but lacks the assessment of “borderline” factors (such as order
management performance) that may have dramatic influence on manufacturing performance. The strongest aspects of Kobayashi’s scheme are related to
management at the workplace and waste or muda. The strongest aspects of Schonberger’s scheme are the links with the customer, on worker involvement in
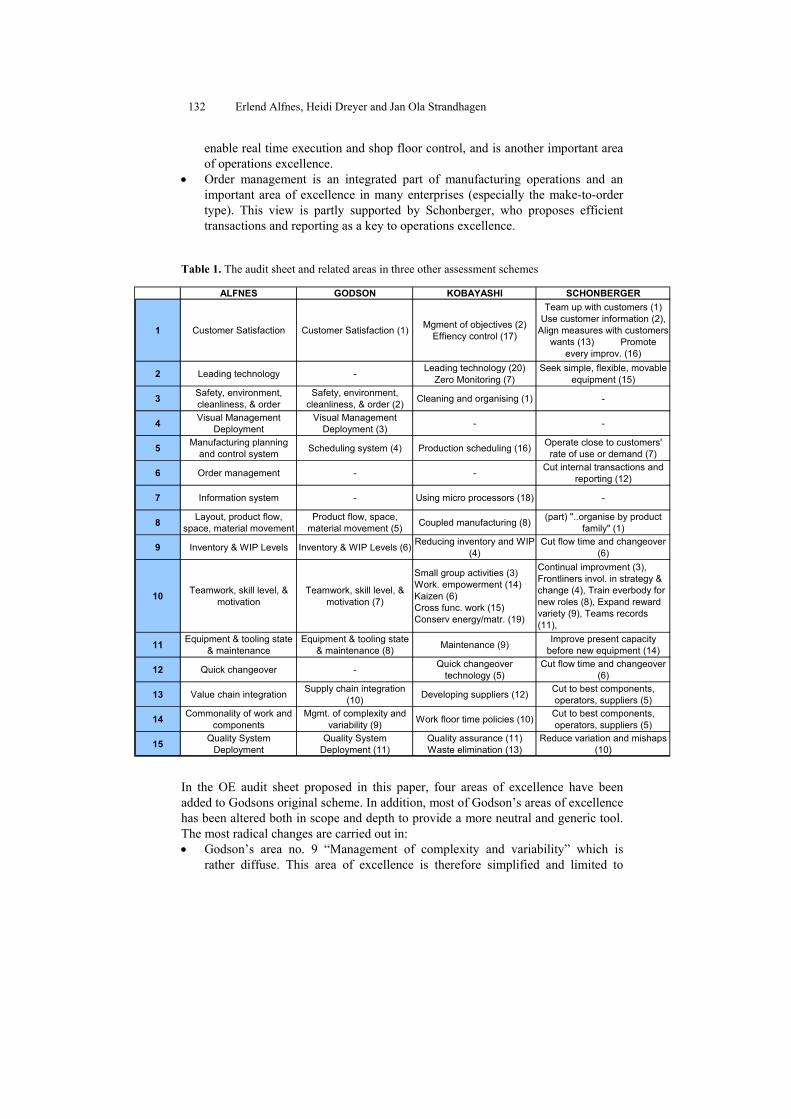
continuous improvement, on design, and simplicity of process. The OE audit sheet and the related factors/principles in each of the three evaluation
schemes are given in Table 1. For each scheme, the number of the principle is shown in brackets. The detailed rating systems are not given, and the reader is referred to
the original schemes for details. Table 1 shows the major areas in the proposed audit sheet and the related
factors/principles in Godson’s, Kobayashi’s, and Schonberger’s schemes. Godson’s RPA tool is the most modern and coherent of these schemes. However, Kobayashi,
and Schonberger propose some crucial areas of excellence that should be added: x Both Kobayashi and Schonberger propose technology and quick changeover as
two important keys to operations excellence. Leading process technology provides efficiency and processing capability. Quick changeover enables
enterprises to produce small series of products and still maintain a high level of equipment utilisation.
x Kobyashi proposes information technology (micro processors) as a key to operations excellence. The use of information technology in manufacturing can
132 Erlend Alfnes, Heidi Dreyer and Jan Ola Strandhagen
enable real time execution and shop floor control, and is another important area of operations excellence.
x Order management is an integrated part of manufacturing operations and an important area of excellence in many enterprises (especially the make-to-order
type). This view is partly supported by Schonberger, who proposes efficient transactions and reporting as a key to operations excellence.
Table 1. The audit sheet and related areas in three other assessment schemes
In the OE audit sheet proposed in this paper, four areas of excellence have been
added to Godsons original scheme. In addition, most of Godson’s areas of excellence has been altered both in scope and depth to provide a more neutral and generic tool.
The most radical changes are carried out in: x Godson’s area no. 9 “Management of complexity and variability” which is
rather diffuse. This area of excellence is therefore simplified and limited to
ALFNES GODSON KOBAYASHI SCHONBERGER
1 Customer Satisfaction Customer Satisfaction (1) Mgment of objectives (2) Effiency control (17)
Team up with customers (1) Use customer information (2),
Align measures with customers wants (13) Promote
every improv. (16)
2 Leading technology -Leading technology (20)
Zero Monitoring (7) Seek simple, flexible, movable
equipment (15)
3Safety, environment, cleanliness, & order
Safety, environment, cleanliness, & order (2) Cleaning and organising (1) -
4Visual Management
DeploymentVisual Management
Deployment (3) - -
5 Manufacturing planning and control system Scheduling system (4) Production scheduling (16)
Operate close to customers' rate of use or demand (7)
6 Order management - -Cut internal transactions and
reporting (12)
7 Information system - Using micro processors (18) -
8Layout, product flow,
space, material movementProduct flow, space,
material movement (5) Coupled manufacturing (8)(part) "..organise by product
family" (1)
9 Inventory & WIP Levels Inventory & WIP Levels (6)Reducing inventory and WIP
(4)Cut flow time and changeover
(6)
10Teamwork, skill level, &
motivationTeamwork, skill level, &
motivation (7)
Small group activities (3) Work. empowerment (14) Kaizen (6) Cross func. work (15) Conserv energy/matr. (19)
Continual improvment (3), Frontliners invol. in strategy & change (4), Train everbody for new roles (8), Expand reward variety (9), Teams records (11),
11Equipment & tooling state
& maintenanceEquipment & tooling state
& maintenance (8) Maintenance (9)Improve present capacity
before new equipment (14)
12 Quick changeover -Quick changeover
technology (5)Cut flow time and changeover
(6)
13 Value chain integrationSupply chain integration
(10) Developing suppliers (12)Cut to best components, operators, suppliers (5)
14Commonality of work and
componentsMgmt. of complexity and
variability (9) Work floor time policies (10)Cut to best components, operators, suppliers (5)
15Quality System
DeploymentQuality System
Deployment (11)Quality assurance (11) Waste elimination (13)
Reduce variation and mishaps (10)
The Operations Excellence audit sheet
133
“Commonality of work and components”, which is a key lean success factor according to Spear and Bowen [10].
x Manufacturing planning and control, where “pull” control systems are defined as a characteristic of operations excellence in the original schemes. This is not
necessarily true. Excellence is achieved (regardless of system type) when the manufacturing planning and control system enables an enterprise to efficiently
satisfy customer demand. What should be regarded as the proper type of system depends on the particular manufacturing environment.
3.2 A definition of each area of excellence
This section provides a definition of each area of excellence in the OE audit sheet.
For a more extensive description that also includes the major factors to assess within each area, see Alfnes [1]. The list aims to be generic and cover all important areas of
operations excellence for a manufacturing enterprise, but of course it still does not include everything. A first practical exercise is therefore to evaluate the list, ensuring
people understand it all, and add to it other areas that are needed for a particular enterprise.
1 Customer satisfaction: From no measurement and understanding of customer
satisfaction to fully displayed ratings and interactive, cross-functional involvement
at all levels.
In the best enterprises, customer information and understanding is mutually shared by marketing and operations. Workers in such enterprises clearly know who their
customers are – both internal and external – and make customer satisfaction their primary goal. Customers are served individually and rapidly, and experiences that
their need for personalisation, high quality, and efficient deliveries are satisfied.
2 Leading technology: From low awareness to full awareness and utilisation of
leading technology to provide a competitive advantage
In the best enterprises, the use of leading manufacturing technology provides a competitive leverage. Manufacturing technology is the set of skills, know-how, and
devices that a particular enterprise has acquired during the development of manufacturing processes and enhancement activities. Technology does not improve
simply by the introduction of new equipment. In the best enterprises, manufacturing technology enables the enterprise to do the right things exceptionally well (low costs,
high quality, quick response etc.), and all investments and improvements are in line with the overall operations strategy.
3 Safety, environment, cleanliness and order: From untidy to 100% organised,
100% of the time
In a clean and orderly enterprise, parts are easy to find, inventory is easy to estimate,
and products move safely and efficiently. Everything is labelled and everything is in place. The facility is safe, clean, orderly and well lit. The air quality is good and the
noise levels are low.
134 Erlend Alfnes, Heidi Dreyer and Jan Ola Strandhagen
4 Visual management deployment: From informal, infrequent, and fragmented, to
100% updated and 100% visualised information about objectives, status and
performance. The best enterprises are able to gain all operating information and control without
having to go off the shop floor. Tools that provide visual cues and directions are readily apparent to guide workers to appropriate locations and tasks. Organisational
boundaries are clearly labelled, and interaction between operations areas is supported by visual tools such as Kanban. The status of the total operations can be viewed from
a central control room, a status board or a computer screen.
5 Manufacturing planning and control system: From poor delivery performance
often with high inventory, to excellent performance in delivery, quality, cost, and
schedules being achieved 100% of the time
The best enterprises use a MPC system that integrates and simplifies planning and
control at long, intermediate, and short term level. Most enterprises have some form of long term and intermediate term planning system. However, the best enterprises
have adapted the MPC system to their particular resource and demand situation, and they also uses efficient execution systems to control final assembly, sub-assemblies,
components and supply. Regardless of the system type (pull systems, push systems, or push-pull systems, [11] җ, the best manufacturing execution systems are easy and
effortless to use. Furthermore, they provide rapid and smooth flows through predetermined or flexible routings, and enables enterprises to satisfy demand with
sufficient utilisation rates.
6 Order management: From functionally oriented, manual, and cumbersome, to
customer-oriented, responsive, and automated order management
The order management cycle typically consist of 10 steps, some of which may overlap: order planning, order generation, cost estimating and pricing, order receipt
and entry, order selection and prioritisation, scheduling, fulfilment, billings, returns and claims, and post sales service [8]. The best enterprises have reorganised and
streamlined their order management, and are able to provide a single point of contact and immediate response to customers. All types of work that does not require human
judgement or intuition are automated by information technology.
7 Information system: From low awareness of the potential of IT to 100%
computer integrated and enabled manufacturing.
The best enterprises use information systems that integrate equipment and sub-systems, are user-friendly, and easy to adapt to new requirements. IT is used to
automate all tasks that do not need human intervention, and to support all types of routine decisions-making in operations. In other, less successful enterprises,
manufacturing based computer systems are very complex and difficult to change. Furthermore, sub-systems are added over time, and, as a result, systems cannot
communicate well with another.
8 Layout, product flow, space use & material movement means: From functional
to 100% interconnected and flow-oriented layout

The Operations Excellence audit sheet
135
The best enterprises have interconnected and rapid flows through operations. Space is used efficiently. Materials and products are moved only once, over as short
distance as possible, in efficient containers. Production materials are stored at each operations area, not in separate inventory storage areas. Tools and set-up equipment
are kept near the machines. The enterprise is laid out in product-oriented operations areas or lines, rather than in “shops” dedicated to a particular type of machines. The
flow follows unidirectional and predetermined routes between operations areas, and is controlled by planning boards, replenishment boards, or inventory levels.
9 Levels of inventory and work-in-progress: From no recognition of the waste of
overproduction to mixed model production with low inventory and high customer
service.
Internal operations seldom require high inventories, so the observable number of any component part is a good measure of operations performance. The best enterprises
have minimum work-in-process and can respond instantly to the many demands of the customers. If necessary, the enterprise can run fully mixed custom orders without
slowing down, and freely adjust its mix in response to the needs of the customers. Such enterprises have no overproduction and only produce what the customers want.
10 Team work, skill levels and motivation: From strict hierarchy to a highly
empowered, flexible and team based organisation
In the best enterprises, people consistently focus on the enterprise’s goals for
productivity and quality, and knows their jobs well. Workers are not only caretakers of equipment, but craftspeople involved in improving the overall process. The work-
organisation is segmented in closed-loop, collocated, multifunctional, cross-trained teams responsible for a product-focused operations area, and empowered to make
necessary decisions. The flexibility is further enhanced through education, training programmes, and job rotation that enables the enterprise to deploy its employ to any
position at will.
11 Condition and maintenance of equipment and tools: From no maintenance, or
expert maintenance, to full participative TPM
In the best enterprises, equipment is clean and well maintained, and the total equipment efficiency is greater than 90 percent. A thorough program for
participative maintenance control is used to repair vital equipment before it breaks down.
12 Quick changeover: From belief that the way to reduce total set up time is via
increased batch size to full SMED
The best enterprises have developed their quick changeover technology to the point
where it is economically viable to have very frequent changeovers. This enables the enterprise to produce small volumes of a large variety of goods while still
maintaining the competitive advantages of single-product mass production. According to Kobayashi [5], it is possible to shorten changeover time to less than 10
minutes in almost any enterprise. The Single Minute Exchange Of Die (SMED) methodology developed by Shingo [9], or investments in flexible equipment can
136 Erlend Alfnes, Heidi Dreyer and Jan Ola Strandhagen
contribute to reduce set-up times. The best enterprises are capable of Single Minute (or less) Exchange of Die and one piece flow.
13 Value chain integration: From adversarial, guarded to full partnership with
information sharing and value chain co-operation.
The best enterprises keep costs low and quality high by working closely with a
relatively small numbers of dedicated and supportive partners. The best partnerships aim at zero receiving inspection, and delivery directly to the point of use. Packaging
and part orientation are designed to reduce waste. Delivery is based on Kanban or Vendor Managed Inventory. Communication and information transfer is based on
EDI or XML. Both sides work toward schedule stability, the customer to not change his mind at the last moment, the supplier to provide reliable delivery. Order
management operations are streamlined and automated.
14 Commonality of routines, equipment and components: From complex, varied,
and unspecified, to simple and 100% standardised operations.
In the best enterprises, every activity is simplified, specified, and standardised in order to reduce variability and complexity. Every operator follow a well defined
sequence of steps for a particular job, and it is instantly clear when they deviate from specification. By commonality in designs, materials, sizes, capacities, machines,
tooling, and operating procedures, the best enterprises are able to standardise the jobs so they can be performed efficiently by multiple operators, and to use the same types
of parts in the manufacture of different products. The result is repetitiveness and economic of scales, less quality errors, and flexibility to handle variable demand.
15 Quality system deployment: From supervisors being responsible for inspections
to total quality management based on process control, prevention, operator
responsibility and failsafing
The best enterprises are always striving to improve quality and productivity. Employees are proud of their quality programme, and the commitment to continuous
improvement is highly visible. Procedures and measurements are developed for processes and products. Workers are organised in quality improvement teams, and
use problems solving tools and techniques to improve operations. Statistical quality control methods are being used. The final inspection is done automatically, and the
abnormality rate (including scrap, rework, and special adjustments) is less than 0.1 percent, despite a stringent final inspection.
4 How to use the audit sheet
The OE audit sheet defines the meaning of excellence in fifteen areas that have
a major impact on operations performance (costs, quality, time, precision, and so on), The purpose is to assist a team of managers and consultants to:
x Perform an audit of the state of a manufacturing enterprise. x Judge the operations performance of a manufacturing enterprise.
x Prioritize the targets of opportunity for improvements

The Operations Excellence audit sheet
137
The rating should be based on the experiences and observations of the team members, and supported by performance measures and enterprise descriptions. The
result of the audit is a short report, assessing the operations performance and suggesting improvement initiatives.
4.1 The audit sheet
The team should use the audit sheet to rate operations performance. Figure 1 shows a
audit sheet populated to assess a high-volume manufacturer of aluminium components. The example enterprise (enterprise A) is described in the next section.
Fig. 1. The audit sheet – the assessment of a high-volume manufacturer of aluminium
components
The OE audit sheet in Figure 1 supports management in the assessment of operations
performance. Each of the 15 areas should be rated on a scale from “poor” (1) to “excellent” (5) to “best in class” (6). Best in class is meant literately. Only one
enterprise in each industry, worldwide, deserves this rating. The enterprises total score on the audit sheet, and the current performance ratings gives an fairly accurate
assessment of the enterprise capability. This kind of assessment is particular useful because the 15 areas highlight broad areas of strengths and weaknesses. Areas with
low ratings are instantly visible opportunities for improvements and should be the
Ratings Poor Below
Average AverageAbove
Average ExcellentBest in Class
No Measure Score 1 2 3 4 5 6 Scores
1 Customer Satisfaction x 3
2 Leading technology x 4
3Safety, environment, cleanliness, & order x 4
4Visual Management
Deployment x 4
5Manufacturing planning and
control system x 2
6 Order management x 2
7 Information system x 3
8Layout, product flow, space,
material movement x 4
9 Inventory & WIP Levels x 2
10Teamwork, skill level, &
motivation x 4
11Equipment & tooling state &
maintenance x 4
12 Quick changeover x 2
13 Value chain integration x 2
14Commonality of work and
components x 3
15 Quality System Deployment x 5
Totals 0 5 3 6 1 0 48
138 Erlend Alfnes, Heidi Dreyer and Jan Ola Strandhagen
first steps on a company’s journey to operations excellence. The total score of all areas will fall between 15 (poor in all areas) and 90 (the best in the world in all
areas), with an average score of 45. The rating should be based on the definitions of excellence that was proposed in the previous chapter.
Many companies have made considerable efforts in certain areas, however, no company is yet to be excellent in all areas. Trade-offs has to be made. The analysis
carried out through the audit is an input to the overall operations strategy development, and should result in a path of improvement for a particular enterprise.
Improvement initiatives should be formulated that improves capabilities in one or several of the 15 areas of excellence (5S, TPM, TQM, SMED, CIM, Visual
management, and so on). The authors have carried out a range of enterprise reengineering projects in the
Norwegian manufacturing industry. The OE audit sheet has been applied in several of these projects as a tool to assess current state and to plan the future state of
enterprise operations. Two of these cases are presented below.
4.2 Enterprise A - a high-volume manufacturer of aluminium components
Enterprise A is a manufacturer of aluminium components to the automotive industry. The enterprise produces 5 – 6 million units per year with a product range of
approx. 100 products. The products are made-to-stock on 4 lines, and produced in batches that vary between 2000 and 12000 units. The production is highly automated
and capital intensive. The current and future profile is illustrated in Figure 2. Enterprise A has an average performance in areas such as cleanliness and order,
visual management, layout and flow team work, and commonality of work, and has been extremely successful in quality deployment. Their process technology is very
efficient, but dedicated to certain products, and with set-up times that range from one – four hours. The inventory levels are therefore high, and there is a potential to
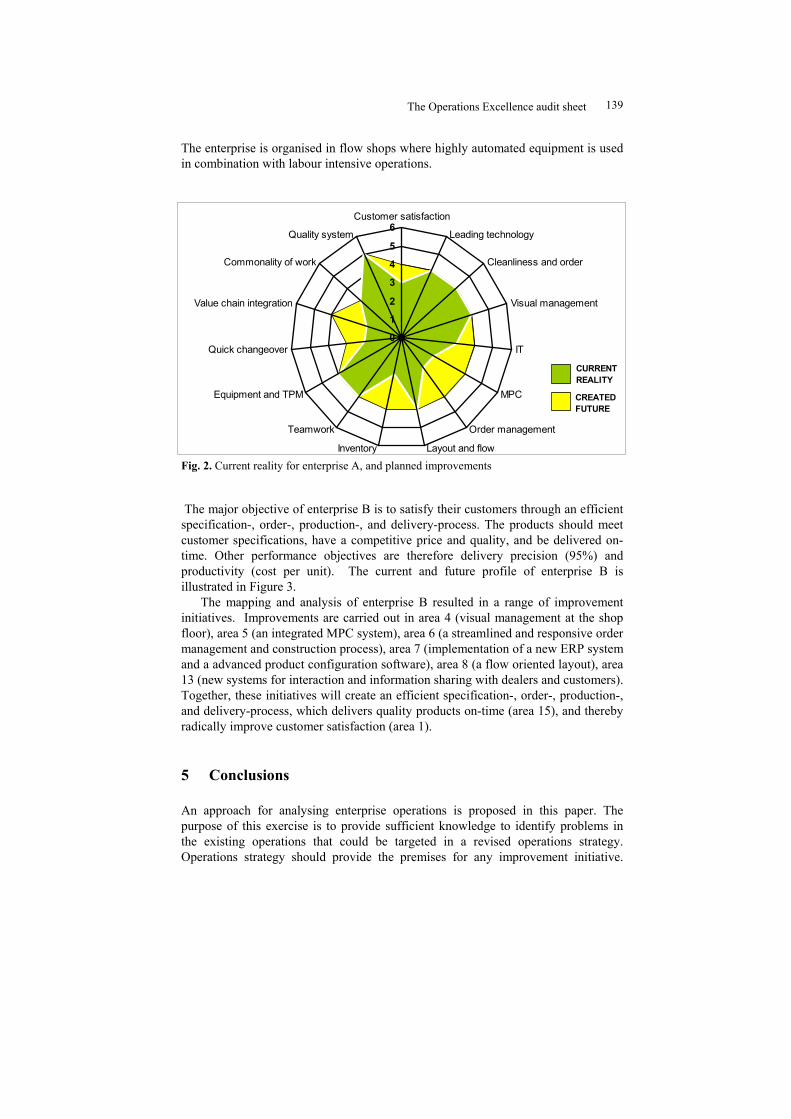
improve equipment utilisation. The major objective for Enterprise A is to maximise its yield. Other important
performance objectives are equipment utilisation (OEE to exceed 70%), productivity (cost per unit), and delivery precision (more than 96%).
The mapping and analysis of the enterprise resulted in a range of improvement initiatives. Improvements initiatives are carried out in area 5 (to develop an
integrated MPC system), area 6 (to reengineer and streamline the order management process), and area 13 (to develop a closer collaboration and information sharing with
key suppliers in the value chain). Together, these initiatives will improve equipment utilisation and inventory levels through an optimised production schedule.
4.3 Enterprise B – a manufacturer of highly customised staircases
Enterprise B is a manufacturer of wooden staircases to the European market. The enterprise produces approx. 6000 staircases per year, and each stair is constructed on
individual customer specifications (make-to-order manufacturing). The product structure is relatively complex and consists of 100 – 200 customised components.
The Operations Excellence audit sheet
139
The enterprise is organised in flow shops where highly automated equipment is used in combination with labour intensive operations.
Fig. 2. Current reality for enterprise A, and planned improvements
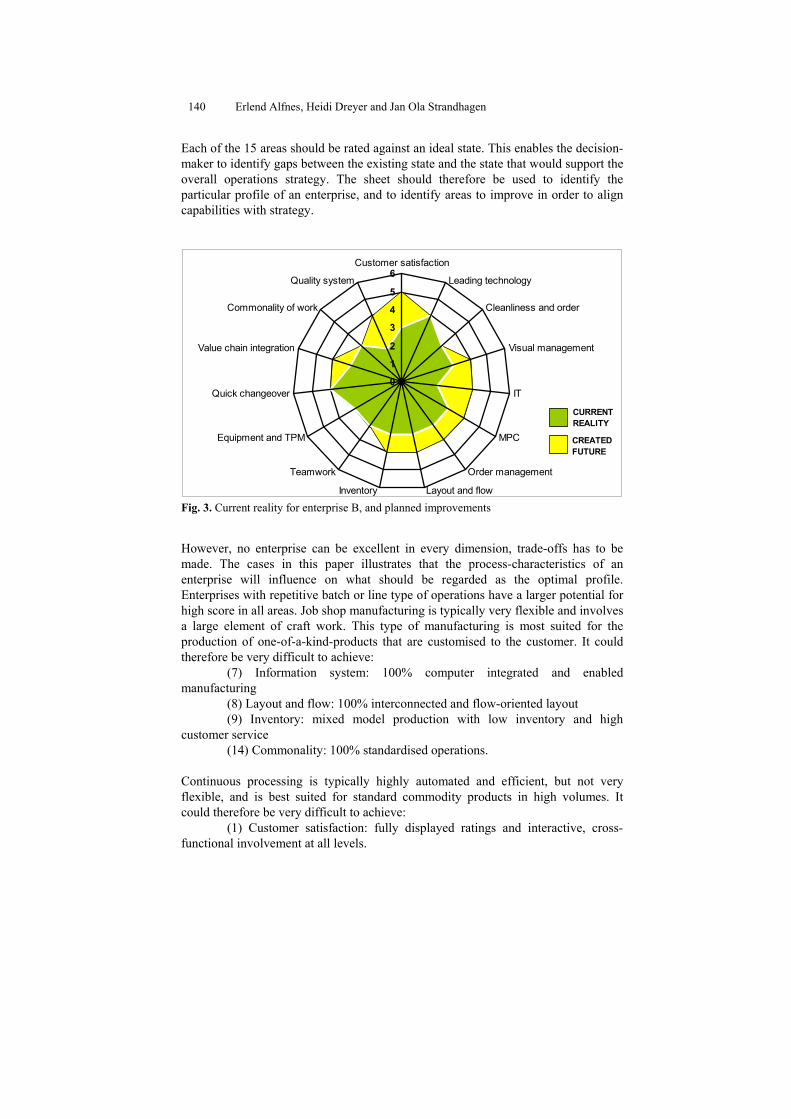
The major objective of enterprise B is to satisfy their customers through an efficient specification-, order-, production-, and delivery-process. The products should meet
customer specifications, have a competitive price and quality, and be delivered on-time. Other performance objectives are therefore delivery precision (95%) and
productivity (cost per unit). The current and future profile of enterprise B is illustrated in Figure 3.
The mapping and analysis of enterprise B resulted in a range of improvement initiatives. Improvements are carried out in area 4 (visual management at the shop
floor), area 5 (an integrated MPC system), area 6 (a streamlined and responsive order management and construction process), area 7 (implementation of a new ERP system
and a advanced product configuration software), area 8 (a flow oriented layout), area 13 (new systems for interaction and information sharing with dealers and customers).
Together, these initiatives will create an efficient specification-, order-, production-, and delivery-process, which delivers quality products on-time (area 15), and thereby
radically improve customer satisfaction (area 1).
5 Conclusions
An approach for analysing enterprise operations is proposed in this paper. The purpose of this exercise is to provide sufficient knowledge to identify problems in
the existing operations that could be targeted in a revised operations strategy. Operations strategy should provide the premises for any improvement initiative.
0
1
2
3
4
5
6Customer satisfaction
Leading technology
Cleanliness and order
Visual management
IT
MPC
Order management
Layout and flowInventory
Teamwork
Equipment and TPM
Quick changeover
Value chain integration
Commonality of work
Quality system
CURRENT REALITY
CREATED FUTURE
140 Erlend Alfnes, Heidi Dreyer and Jan Ola Strandhagen
Each of the 15 areas should be rated against an ideal state. This enables the decision-maker to identify gaps between the existing state and the state that would support the
overall operations strategy. The sheet should therefore be used to identify the particular profile of an enterprise, and to identify areas to improve in order to align capabilities with strategy.
Fig. 3. Current reality for enterprise B, and planned improvements
However, no enterprise can be excellent in every dimension, trade-offs has to be made. The cases in this paper illustrates that the process-characteristics of an
enterprise will influence on what should be regarded as the optimal profile. Enterprises with repetitive batch or line type of operations have a larger potential for
high score in all areas. Job shop manufacturing is typically very flexible and involves a large element of craft work. This type of manufacturing is most suited for the
production of one-of-a-kind-products that are customised to the customer. It could therefore be very difficult to achieve:
(7) Information system: 100% computer integrated and enabled manufacturing
(8) Layout and flow: 100% interconnected and flow-oriented layout (9) Inventory: mixed model production with low inventory and high
customer service (14) Commonality: 100% standardised operations.
Continuous processing is typically highly automated and efficient, but not very
flexible, and is best suited for standard commodity products in high volumes. It could therefore be very difficult to achieve:
(1) Customer satisfaction: fully displayed ratings and interactive, cross-functional involvement at all levels.
0
1
2
3
4
5
6Customer satisfaction
Leading technology
Cleanliness and order
Visual management
IT
MPC
Order management
Layout and flowInventory
Teamwork
Equipment and TPM
Quick changeover
Value chain integration
Commonality of work
Quality system
CURRENT REALITY
CREATED FUTURE

The Operations Excellence audit sheet
141
(9) Inventory: mixed model production with low inventory and high customer service
(12) Quick changeover: full SMED
It is also important to notice that some areas generally have a higher potential for improvement. For example, management often focus too much on shop floor
activities, and underestimate the impact of poor office processes. Many manufacturing enterprises can achieve large improvements by addressing their order
management process. The author’s experience from several projects is that in addition to order management, the potential for improvement is especially high in (5)
manufacturing planning and control, (8) layout and flow, and (9) inventory. These observations are also supported by Goodson’s [4] dataset, which shows that these
three areas consistently receive the lowest ratings.
References
1. Alfnes, E. (2005). Enterprise reengineering: A strategic framework and
methodology. Faculty of Engineering Science and Technology, Department of
Production and Quality Engineering. Trondheim, Norwegian University of Science and Technology, NTNU. Doctoral thesis, 2005:153.
2. Bicheno, J. (2000) The lean toolbox. PICSIE Books, Buckingham.
3. Fagerhaug, T. (1999) A new improvement oriented method and model for self-
assessment for business excellence. Dr. thesis no. 127, NTNU report 99018.
4. Goodson, R.E. (2002) Read a plant: fast. Harvard Business Review, May,
pp. 105-113.
5. Kobayashi, I. (1990) Twenty keys to workplace improvement. Productivity Press,
Cambridge.
6. Rummler, G.A., Brache, A.P. (1995) Improving performance: How to manage the
white space on the organisation chart, Jossey-Bass Publishers, San Fransico.
7. Schonberger, R. J. (1996) World Class Manufacturing: The next decade, building
power, strength and value. The Free Press, New York.
8. Shapiro, B., Rangan, K., Sviokla, J. (1992) Staple yourself to an order. Harvard
Business Review, July-August, pp. 113-122.
9. Shingo, S. (1985) A revolution in manufacturing: the SMED system, Productivity Press, Cambridge, Mass.
10. Spear, S., Bowen, H.K. (1999) Decoding the DNA of the Toyota Production
System. Harvard Business Review. September-October, pp.97-106.
11. Suri, R. (2002) Quick response Manufacturing: A competitive strategy for the
21st Century. Proceedings of the 2002 POLCA Implementation workshop.