Embed Size (px)
Citation preview
The optimisation of protocols for the extraction of nuclear DNA from animal
bone forPCR.
By
Samantha Ogden BSc (Hons.)
Submitted in partial thifilment of the requirements for the degree of Masters by
Research awarded by the Department of Forensic and Investigative Science,
University of Central Lancashire.
April 2003

DECLARATION
I declare that while registered as a candidate for the degree for which submission is
made. I have not been registered as a candidate for another award of the CNAA or of
the University. No material contained in this thesis has been used for any other
submission for an academic award.

ACKNOWLEDGEMENTS
I would like to thank my supervisor Lee Chatfield who believed in me even
when I didn't. Ashley Matchett for helping me finish what I had started and my
family for the support emotionally and sometimes financially.
Also I would like to thank Michelle Whittaker who ran around finding me
equipment, solutions and anything else that would make life easier for me. And last
but not least everyone in the postgraduate research office for tea, cakes and listening
to me rant and rave when all was not going well.

ABSTRACT
The general aims of this research were to find an effective method for
extracting DNA from bone and to use this methodology to create Randomly
Amplified Polymorphic DNA- Polymerase Chain Reaction (RAPD-PCR) profiles of
different species. A modified Chelex method was selected as the preferred extraction
procedure and RAPD-PCR profiles were created for several species using a number of
different primers. Individuality between closely related species was also achieved.
This research could go on to help in the archaeological field with identifj'ing
unknown bone fragments.
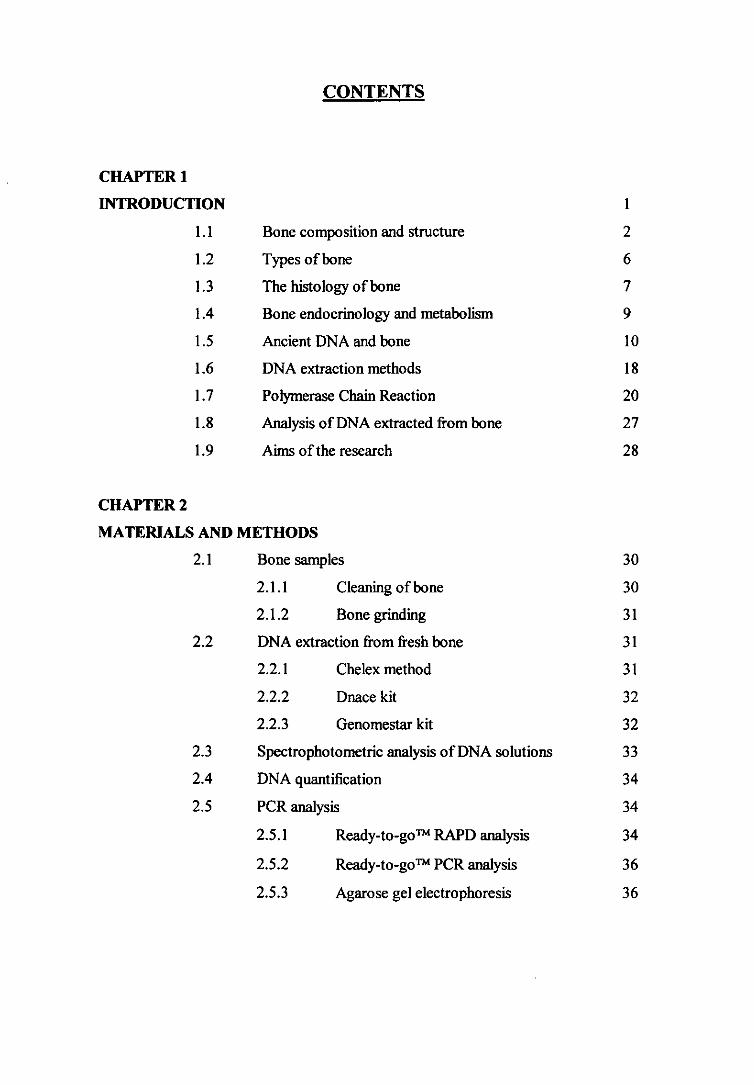
CONTENTS
: : 'j a u iii INTRODUCTION I
1.1 Bone composition and structure 2
1.2 Types ofbone 6
1.3 The histology of bone 7
1.4 Bone endocrinology and metabolism 9
1.5 Ancient DNA and bone 10
1.6 DNA extraction methods 18
1.7 Polymerase Chain Reaction 20
1.8 Analysis of DNA extracted from bone 27
1.9 Aims of the research 28
CHAPTER 2
MATERIALS AND METHODS
2.1 Bone samples 30
2.1.1 Cleaning ofbone 30
2.1.2 Bone grinding 31
2.2 DNA extraction from fresh bone 31
2.2.1 Chelex method 31
2.2.2 Dnace kit 32
2.2.3 Genomestar kit 32
2.3 Spectrophotometric analysis of DNA solutions 33
2.4 DNA quantification 34
2.5 PCR analysis 34
2.5.1 Ready-to-goTm RAPD analysis 34
2.5.2 Ready-to-goTm PCR analysis 36
2.5.3 Agarose gel electrophoresis 36

\
CHAPTER 3
RESULTS
39
3.1 Extraction of DNA from bone
39
3.2 PCR amplification of DNA samples
45
3.3 Comparison Ready-to-go ® RAPD PCR with
49
Ready-to-go PCR®.
3.4 Comparison of DNA samples from different species
53
3.5 Further RAPD-PCR analysis
62
CHAPTER 4
DISCUSSION
67
75

TABLE OF TABLES
Table 1 Summary of bone cell type, location and function 8
Table 2 Examples of specimens from which DNA has been successfully
extracted and amplified. 14
Table 3 Favourable conditions leading to aDNA preservation in archaeological
material. 17
Table 2.1 Bone sample used for analysis. 30
Table 2.2 Nucleotide sequences for all primers used during PCR reactions. 35
Table 2.3 Represents the sizes of X HUt dill molecular weight marker DNA
fragments. 37
Table 3.1 Effect of incubation time on yield of DNA using a modified Chelex
extraction method. 41
Table 3.2 Represents incubation times of samples and amount loaded on to gel.
42
Table 3.3 Represents the positions of samples visualised in Figure 3.7. 55
Table 3.5 Different fragment sizes of PCR amplicons of different species
visualised in Figure 3.8.1. 59
Table 3.6 Different fragment sizes of PCR amplicons of different species
visualised in Figure 3.8.2. 61
Table 4.1 Different stages at which a sample can be contaminated and
precautions to be taken. 68
Table 4.2 Different species and primers used to create RAPD-PCR pmfiles 73

TABLE OF FIGURES
Figure 1 Structure of collagen helix
Figure 2 A left tibia (shin bone) sectioned to show the key elements of the gross anatomy of a long bone (White, 2000). 5
Figure 3 Gross and microscopic structure of bone (White, 2000). 8
Figure 4 Schematic diagram of the structure of DNA (Stryer, 1995). 11
Figure 5 Model representing a 3-dimensional structure of DNA (Stryer, 1995). 12
Figure 6 The PCR cycle (adapted from Watson et aL, 1992). 23
Figure 7 The polymerase Chain Reaction (Reproduced from Watson et aL, 1992) 24
Figure 8 Representation of the formation of amplicons in RAPD-PCR. 26
Figure 2.1 Fragment sizes of 100 bp ladder. 38
Figure 3.1 Agarose gel electrophoresis of DNA samples prepared by the modified chelex extraction method 42
Figure 3.2 Visualisation of DNA obtained by three different extration methods by agarose gel eleetrophoresis. 44
Figure 3.3 Visualisation of RAPD-PCR amplicons from DNA extracted using three different extractions methods. 46
Figure 3.4 Effects of detergent during extraction on the PCR reaction. 48
Figure 3.5 The differences between Ready-to-go PCR beads and Ready-to-go RAPD-PCR. 50
Figure 3.6 Agarose gel electrophoresis of PCR amplicons produced using different dilutions of Herring sperm DNA. 52
Figure 3.7 Visualisation of PCR products amplified using several different factors including difièrent primers, species, amounts of DNA and treatments.
54
Figure 3.8.1 Visualisation of PCR products amplified using primer 3. 58
Figure 3.8.2 Visualisation of PCR products amplified using primer 4 60
Figure 3.9.1 Reproduction of RAPD-PCR species profiles using primer 2. 63

Figure 3.9.2 Reproduction of RAPD-PCR species profiles using primer 3. 64
Figure 3.9.3 Reproduction of RAPD-PCR species profiles using primer 4 65
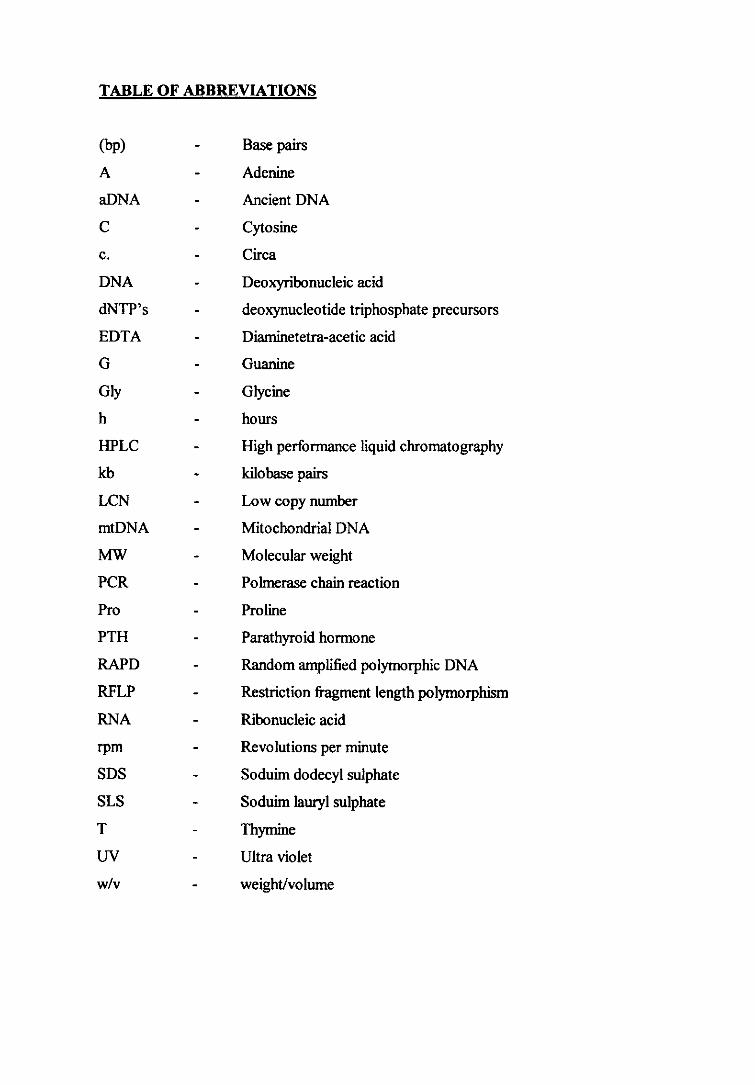
TABLE OF ABBREVIATIONS
(bp) - Basepairs
A - Adenine
aDNA - Ancient DNA
C - Cytosine
C. - Circa
DNA - Deoxyribonucleic acid
dNTP 's - deoxynucleotide triphosphate precursors
EDTA - Diaminetetra-acetic acid
G - Guanine
Gly - Glycine
h - hours
HPLC - High performance liquid chromatography
Id, - kilobase pairs
LCN - Low copy number
mtDNA - Mitochondrial DNA
MW - Molecular weight
PCR - Polmerase chain reaction
Pro - Proline
PTH - Parathyroid hormone
RAPD - Random amplified polymorphic DNA
RFLP - Restriction fragment length polymorphism
RNA - Ribonucleic acid
rpm - Revolutions per minute
SDS - Soduim dodecyl sulphate
SLS - Soduim lauryl sulphate
T - Thymine
UV - Ultra violet
w/v - weightivolume

1. INTRODUCTION
Bone is one of the most durable components of the body and is often all that is
left to study of ancient remains. As with other tissues, bone contains significant
quantities of DNA and, given its durability and the sensitivity of current techniques
for genetic analysis, it is now commonly used in the genetic investigation of human
remains in the fields of archaeology and forensic science. Although this thesis is
concerned primarily with the extraction and analysis of DNA from animal bones, it is
worthwhile beginning this introduction by describing the properties and structure of
mammalian bones, since this information underpins an understanding of how bone
can be preserved, and of the experimental strategies employed in extracting DNA
from these sources.
All vertebrates have similar skeletal structures and body plans. Mammals and
birds and, to a lesser degree, reptiles and amphibians, have similar overall skeletal
plans, which stem from a common evolutionary ancestry (O'Connor, 2000). The
diflerences in their skeletons and bones provide clear examples of adaptations to
particular lifr styles and selective pressures. Rather than attempt to describe a wide
range of skeletal forms of little direct relevance to this thesis, I will discuss general
aspects of mammalian bones with reference to the more ftmiliar human skeletal
systent
The hwnan adult skeleton contains 206 named bones, most of which are paired
on the left and right sides of the body. Unpaired bones include the 22 bones present in
the skull, of which 8 form the cranium and 14 bones the face. The bones of our
skeleton are grouped into two principal divisions; 80 bones comprise the axial
skeleton and 126 bones the appendicular skeleton. The axial skeleton forms the
longitudinal part of the skeleton, which contains the skull, vertebral column and the
bony thorax. The 126 bones that make up the appendicular skeleton include those of
the limbs and the pectoral and pelvic girdles, which attach the limbs to the axial
skeleton (White, 2000).
The skeleton contributes to the general body shape and form as well as
performing several other important functions. Its framework provides support for the
body and protection for the brain by means of the skull; the vertebrae surround the
spinal colunm and the rib cage, which protects the organs of the thoracic cavity.
Skeletal muscles are attached to the bones by tendons, which use the bones as levers

to thcilitate mechanical movement. Bones also serve as a reservoir for minerals such
as calcium and phosphate. The bulk of blood cell formation, or haematopoiesis, takes
place in the red bone marrow of certain bones, such as the ribs and long limb bones
(Schultz, 1997).
The skeleton is thus a multiflinctional system, and the above functions are
reflected in the properties of the bones from which it is constructed (Steele and
Bramblett, 1997).
1.1 BONE COMPOSITION AND STRUCTURE
Living bone is made up of three main components: a complex protein matrix that
forms a structural scaffold, a mineral phase that stiffens and supports the scaffolding
and a ground substance made up of other organic compounds (Schultz, 1997).
Half of the dry weight of normal fresh bone is made up of the mineral phase and
the remainder of the weight is made up of the organic fraction (ground substance and
protein matrix) and water. These proportions can vary slightly in different hard
tissues. Up to 95 % of the organic fraction of bone is made up of the protein collagen,
which is also found in tendons and connective tissue. Collagen is unusual in that it
contains high proportions of the amino acid glycine (Gly) and hydroxyproline, which
is a hydroxylated derivative of proline (Pro) due to a repeating tripeptide sequence,
Gly-X-Pro or Gly-X-hydroxyproline, where X represents any amino acid. These
elements are crucial to its three-dimensional structure and characteristic properties.
The high proportions of these amino acids means that collagen is incapable of
forming a-helices and a-pleated sheets, and instead the polypeptides intertwine to
form a unique left-handed triple helix. The molecule also has very few side chains so
collagen polypeptides can be tightly packed together and can bond with each other by
hydrogen bonds at regular intervals (O'Connor, 2000). This is represented in figure 1.
2

a)
b)
c)
im -'0 IL -a'; 73 Fig 1: a) This depicts the sequence of a representative portion of a single strand of the
collagen triple helix.
b) This figure is a cross section of c) which in turn shows a model of the collagen
triple helix, with each colour representing a different strand. The a carbon atom of
glycine residue is represented by G. (Reproduced from Stryer, 1995).
ki

The mineral phase is mainly hydroxyapatite, which has the general formula
Caio(PO4)6.(OH)2. This formula is a generalised representation of the mineral phase as
some of its elements can be replaced by others. For instance, Ca 24 may be replaced by
Sr, 2+ or Pb2t C032 can replace POt and F can be replaced by OW. Other ions,
in particular metal ions, can attach themselves to the surface of the hydroxyapatite
crystals by absorption. This process can occur in living tissue as well as in dead
material, it is, therefore, hard to tell whether these chemical substitutions reflect life
chemistry or burial conditions (O'Connor, 2000).
There are two main types of bone tissue: compact and cancellous. Compact
bone is the solid, dense material that forms the surface layers of mature bones. At
joint ends this compact bone is covered by cartilage, to produce a smooth surface with
no blood vessel canals: this is subchondral bone. The second main type of bone tissue
is cancellous bone, which is a spongy porous material that is mainly found at the ends
of long bones, in short bones and sandwiched within flat bones where it forms an
internal support system. The main difference between these two types of bone tissue
is their porosity (White, 2000).
The general structure of long bones can be divided into the tubular diaphysis, the
epiphysis and the metaphysis (Figure 2). The tubular diaphysis or shaft constitutes the
long axis of the bone. it is constructed of a relatively thick collar of compact bone that
surrounds a central medullary or marrow cavity. In adults, the medullary cavity
contains fat (yellow marrow) and is termed the yellow bone marrow cavity. Bone
marrow is found in the medullary cavity of the bone and the pore spaces of cancellous
bone. At birth this is a red bone marrow that produces red and white blood cells but as
an adult active red marrow is only found in certain bones and the rest becomes
inactive yellow marrow (Schultz, 1997).
The epiphyses form the ends of the bone; in most bones they are more rounded
and expansive than the diaphysis. Compact bone forms the exterior of the epiphyses
whereas the interior is made of cancellous bone. The joint surface is covered with a
thin layer of articular cartilage that cushions the opposing bone ends during joint
movement and absorbs stress. Between the diaphysis and each epiphysis in adult long
bones lies the metaphysis. Here there is a structure called the epiphyseal line, which is
what remains of the ephiphyseal plate. The plate is a disc like region of hyaline
cartilage that grows during childhood to lengthen the bone.
4
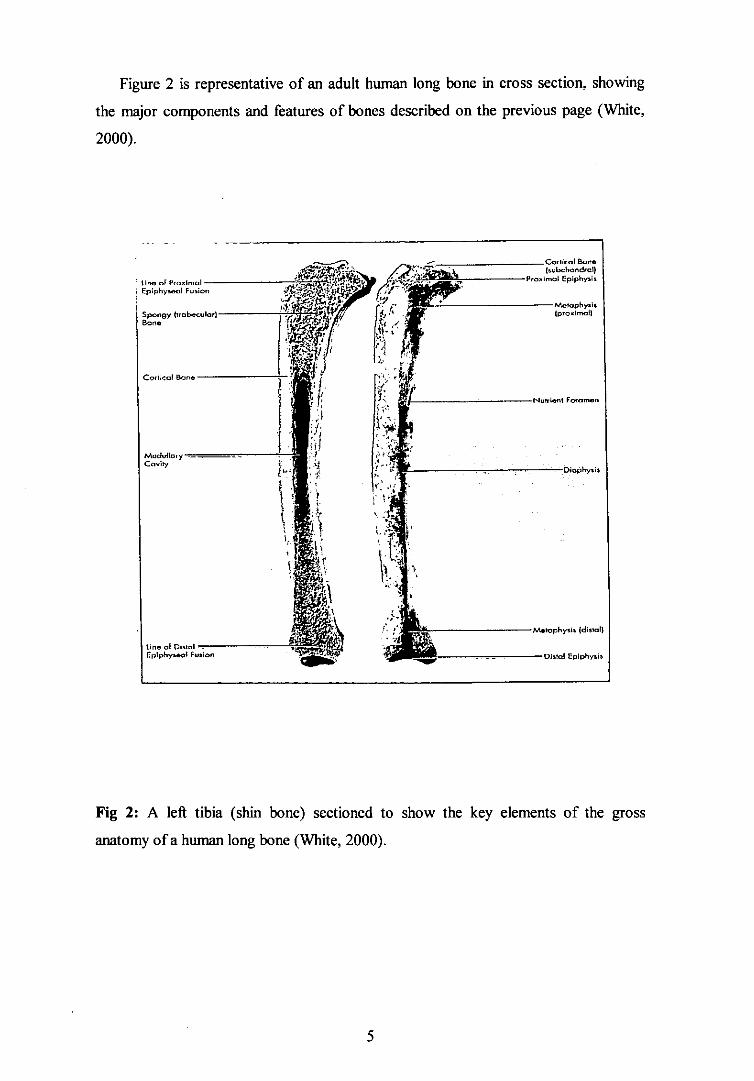
Figure 2 is representative of an adult human long bone in cross section, showing
the major components and features of bones described on the previous page (White,
2000).
Fig 2: A left tibia (shin bone) sectioned to show the key elements of the gross
anatomy of a human long bone (White, 2000).
5
Both the internal and external bone surfaces are associated with membranes.
The outer surthce of the diaphysis is covered and protected by a white, double-layered
membrane called the periosteunt The inner surface layer of the membrane is made up
of osteoblasts and the outer is composed of blood and lymphatic vessels and nerves.
The hmer surface of the bone is covered by the endosteum, which is similar in
structure to the periosteum, and is also made up of osteoblasts (Schultz, 1997).
Short, irregular and flat bones share the same basic structure. These types of
bone are not cylindrical and so they have no shaft or ephiphysis. They contain small
amounts of bone marrow, but no clear rnedullary cavity is present (Schultz, 1997).
1.2 TYPES OF BONE
The bones of a mammalian skeleton can be grouped into a few basic shapes.
Long bones, as described previously, are tubular in shape with expanded joint ends
and have a greater length than they have width. These bones are usually slightly
curved; this curvature absorbs the stress of mechanical forces, such as the body's
weight, and evenly distributes it and to prevent bones snapping. These bones are
predominantly limb bones and those contained in the hands and feet. Despite the
obvious diftèrences in shape of these different types of bone, their histology is
remarkably similar (White, 2000).
Short bones are cuboid in shape, i.e. they are nearly equal in length and width.
They are made up of cancellous bone that is covered in a thin layer of compact bone.
This kind of bone is found in the wrists and ankles (Schultz, 1997).
Flat bones are generally thin and are composed of two nearly parallel plates of
compact bone which sandwich a layer of cancellous bone. These bones give
considerable protection and include the cranial bones, breastbone and ribs (White,
2000).
Irregular bones are complex in shape and therefore cannot be grouped into any
of the other categories. They vary in the amount of compact and cancellous bone they
contain and include some of the facial bones and the vertebrae of the back (Schultz,
1997).
Finally, the sesamoid bones develop in certain tendons usually near joints
where there is considerable friction, tension and physical stress, such as palms and
soles. The bones are typically only a few millimetres in diameter with the one

exception of the kneecaps (patellae). Theft basic function is to protect tendons from
excessive wear and tear as they move over the bony surface (Gunn, 1992).
1.3 THE HISTOLOGY OF BONE
Mineralised bone is formed by secretion of hydroxyapatite crystals upon and
within the framework of collagen fibrils. This framework of collagen fibrils and
hydroxyapatite is an amorphous substance described as osteoid, which is secreted by
specialised bone cells called osteoblasts (Schultz, 1997). Once the hydroxyapatite
crystals have been deposited, the osteoid becomes calcified and is converted to solid
bone. Some of the osteoblasts may become incorporated into the matrix during this
process and functionally become osteocytes. Figure 3 illustrates the Haversian system
of compact bone and its composition. The Harversian system provides nutrients for
osteocytes, and avenues for intercellular communication and repair. Cancellous bone
lacks these Haversian systems as it gets nutrients from the blood vessels in the
surrounding marrow spaces.
In the Haversian system osteocytes are enclosed in voids called lacunae. The
lacunae are interconnected by a branching and interdigitating network of fine
channels (canaliculi). The canaliculi are also connected at intervals to blood vessels,
and this, as a whole comprises the Haversian system. The Haversian system transmits
the blood vessels and nerves that support the cells within the bone, since compact
bone is too dense to be nourished by surface blood vessels (Steele and Bramblett,
1997).
There are three difièrent types of bone cells (Table 1). Osteoblasts synthesise
and secrete osteoid, which then becomes mineralised to produce bone. Also found in
bone are osteocytes, of which there are two types, osteoblastic osteocytes that are
involved with conservation of bone tissue and osteolytic osteocytes that deal with
disintegration of hard tissues (bone dissolution). These cells are essential in order to
maintain the bone tissue. Finally, giant multi-nucleated cells called osteoclasts are
responsible for the reabsorption of bone tissue. This places them into a group of cells
which practice phagocytosis. Theft primary functions are the remodelling of bone
during growth and repair but are also active in destructive processes (Schultz, 1997).
Table 1 contains a summary of each bone cell type and theft functions.
'I

Fig 3: Gross and microscopic structure of bone (White, 2000).
Cell type Location and origin Function
Osteoblasts Stem from connective Responsible for tissue cells. synthesising and
Mainly concentrated just depositing the organic beneath the periosteum. substances of bone.
i Conservation of bone i Osteoblastic tissue if they die / Principally an osteoblast surrounding matrix
Osteocytes caught in the niineralised disintegrates. matrix.
ii Osteolytic Lie in flat holes called ii Bone dissolution. lacunae.
Osteoclasts Stem from stromal cells. Reabsorption of bone Found in Howship's tissue.
lacunae.
Table 1: Summary of bone cell type, location and thnction. (Information taken from
Schultz, 1997).

1.4 BONE ENDOCRINOLOGY AND METABOLISM
Approximately 1.5% of the body's dry weight is calcium.
Calcium metabolism in the plasma plays a vital role in blood coagulation, cardiac and
skeletal muscle contraction and nerve function. This mineral's concentration is very
important to its function and is maintained in equilibrium in difibrent parts of the
body. Despite the fact that the level of calcium is balanced, it is constantly replaced
through turnover in the skeleton. There is a complete turnover each year in infants and
approximately an 18% yearly turnover in adults, due to constant resorption and
reformation of bone tissues (Steele and Bramblett, 1997).
Vitamin D promotes the active transport of calcium and phosphate in the body
as well as the absorption of calcium by the gastrointestinal tract. It is a fat-soluble
vitamin and its production in the skin involves the reaction of ultraviolet light with
certain pro-vitamins. If there is a deficiency of vitamin D then this can lead to rickets
in the young and osteomalacia in adults. Calcium ion concentration in body fluids is
partly controlled by the parathyroid. Parathyroid hormone (PTH) acts directly on
bones to mobilise calcium ions, so if the parathyroid glands are not active then this
may halt osteoclast activity and therefore cause calcium levels in the body to drop. On
the other hand, if the parathyroid glands are overactive, osteoclastic absorption may
outweigh osteoblastic deposition thus causing the bones to weaken. This can result in
multiple fractures, decalcification, giant-cell tumours and cysts (Chancy, 1997).
In contrast, the hormone calcitonin decreases osteoclast activity and reduces
calcium and phosphate levels in the blood. This hormone may protect bones in
females from excess calcium loss during pregnancy and lactation and is present at
higher levels in young individuals. A 30 % decrease in calcium ions in the body
produces immediate problems, as the central nervous system and peripheral nerves
begin to spontaneously discharge producing tetonic contractions of skeletal muscle,
which may be fital. If the body's levels of calcium are too high, depressed reflexes
and a sluggish central nervous system result. Slightly elevated levels would lead to
kidney stones as the kidneys increase the concentration of calcium in the urine.
Highly elevated levels could lead to more serious conditions, such as renal failure
(Litwack and Schmidt, 1997).

Fig 4: Schematic diagram of the structure of DNA. The sugar phosphate backbone is
represented in black where circles represent phosphate groups, and pentangles the five
carbon deoxyribose sugar residues. Each base has a different colour, yellow for A,
blue for T, red for C and green for U (Stryer, 1995).
11

Fig 5: This is a model representing a 3-dimensional structure of DNA. The sugar
phosphate backbone is shown in dark colours and the bases in light colours (Stryer,
1995).
12

Nucleases are enzymes that act specifically on DNA and they break the 5'-3'
phosphodiester bonds that link nucleotides together. In living tissue these nucleases
are used in nucleotide metabolism in degradative pathways, but in dead tissue these
destructive enzymes can hinder retrieval and analysis of ancient DNA samples (Hoss
etal., 1996 [21).
DNA will start to be degraded by endogenous nucleases soon after death.
Under some circumstances, such as rapid desiccation, low temperature or high salt
concentrations, these nucleases are inactivated or theft action impaired, thus halting or
slowing the degradation. Nucleascs are enzymes and so are susceptible to certain
conditions; low temperatures decrease their activity as they work at an optimum
temperature around body temperature. High salt concentrations cause proteins to
precipitate out causing inactivation; a lack of moisture also causes inactivation
because an aqueous environment is essential to theft function (Hofreiter et aL, 2001).
If nuclease inactivation occurs before all the nucleic acids have been converted to
mononucleotides then slower chemical processes may then begin to take effect and
degrade the DNA (Hofreiter et aL, 2001).
Oxidation and direct or indirect background radiation will affect and modif'
the nitrogenous bases and the sugar phosphate backbone. Deamination, depurination
and other hydrolytic processes lead to destabilisation of DNA structure and single and
double strand breaks in DNA (Richards and Sykes, 1995).
There is evidence that DNA is preserved longer in bones than in soft tissues.
This indication comes from research carried out using DNA taken from moa soft
tissues and bones around 3350 years old (Cooper et aL, 1992). The bone samples
yielded DNA, from which was amplified a 438 base pair (bp) fragment, but the DNA
from the soft tissue gave poor amplification and only fragments of around 150 bp
were produced. This suggests that under similar conditions DNA may survive better
in bone than in soft tissues (Cooper et aL, 1992). Ancient DNA (aDNA) from humans
was first recovered in 1985 from a human femur carbon dated at 5,450 years old
(Hagelberg and Sykes, 1989). Since then it has been extracted from skins of giant
ground sloths up to 13,000 years old (Paabo et al., 1989), 7000 year old human brain
tissue (Paabo et aL, 1988), bone fragments from Pompeii up to 1,940 years old
(Cipollaro et aL, 1999) and bone fragments from the extinct large ifightless bird the
moa up to 3,750 years old (Cooper et aL, 1992). There are many more examples from
which DNA has been successfully extracted, and these are featured in Table 2.
13

DNA source Maximum age Reference
Mummified hunian tissue —600 years l-landt ci al., 1996
Human skeletons from the Terp of
Wijnaldum
1,800 years Colson ci aL, 1996
Bone fragments from Pompeii 1,940 years Cipollaro ci aL, 1999
Bone fragments from the extinct moa 3,750 years Cooper ci aL, 1992
Human femur 5,450 years Hagelberg and Sykes,
1989
Human brain tissue 7,000 years Paabo ci aL, 1988
Extinct wild aurochs (B. primigerneis) 12,000 years Bailey ci aL, 1996
Skins of the Giant ground sloth 13,000 years Hoss ci aL, 1996 [1]
Saber toothed cat fossils 14,000 years Janczewski ci aL, 1992
Alaskan member of the horse family (Equus
hermionus)
25,000 years Hoss and Paabo, 1993
Ice age brown bear 42,000 years Leonard ci aL, 1999
Insects entombed in amber 120-135 million
years
Cano ci aL, 1993
Table 2: Examples of specimens from which DNA has been successfully extracted
and amplified. The approximate ages of samples is also listed.
14

Ancient DNA of this age is invariably highly damaged and degraded (Paabo ci
aL, 1989) due to post-mortem degradative processes.
Burial conditions of bodies are of great significance for the recovery of
ampliflable DNA. Buried corpses are subjected to a range of chemical and physical
agents, which bring about chemical changes in the tissues of the body, which in turn
greatly influence the degree of preservation of tissues (O'Connor, 2000).
Decomposition starts to take place soon after death has occurred (Vass, 2001). The
first step of this process is autolysis or self-digestion, whereby the cells of the body
become deprived of oxygen. Carbon dioxide builds up and toxic waste accumulates,
which begins poisoning the cells. Cellular enzymes then begin to break down the cell
from the inside out, which leads to cellular lysis. This process starts in enzyme-rich
organs such as the liver and also in high water content tissues like the brain, and
continues to spread throughout the body.
Once enough cells have burst open and released their contents, putrefaction
begins to take effect. This process is the destruction of tissues by biotic agents such as
bacteria and fungi. Their action results in the catabolism of tissues into gases, liquids
and simple molecules. One of the common species of bacteria identified in
putrefaction is Clostridium but there are many other species, depending on local and
individual conditions.
Vass (2001) initiated research to determine whether microbes could be used
to estimate more accurately post-mortem interval. He isolated many species, even
from the very early stages of decomposition, including Staphylococcus, Candida,
Bacillus and Streptococcus sp. The previously mentioned species do not include the
putrefactive bacteria, such as Clostridium. Pathogenic organisms such as Serratia spp,
Klebsiella spp, Proteus spp and Salmonella spp were also isolated. There were also
environmental microorganisms such as Agrobacterium and varieties of thngi. With all
these different species he found it impossible, due to the sheer weight in numbers and
species diversity, to identif' clear trends in succession.
When the corpse has no nutritional value and the remaining tissue, usually
skin, has become dehydrated or desiccated, the stage of mummification is reached.
This usually occurs in dry heat areas such as deserts, or areas of low humidity such as
the Artic circle. M well as all these processes, bone goes through yet another complex
process called diagenesis. Diagenesis alters the proportions of collagen and
hydroxyapatite. Collagen is particularly susceptible in well oxygenated, moist and
15

slightly alkaline burial environments. Solubility of bone minerals will depend on the
amount of ions already in solution in the surrounding environment (Hagelberg and
Clegg, 1991).
It may well be that the age of the samples reflects the amount of damage but
research has shown that age is not such an issue as the burial conditions influencing
the state of preservation (Hagelberg and Clegg, 1991 and Burger et aL, 1999). DNA
extracted from skeletal remains recovered from Abingdon abbey showed that the
older medieval samples produced longer amplified products than the much younger
civil war specimen (I-Iagelberg and Clegg, 1991). These bodies were buried in
diflèrent parts of the graveyard where the amount of acid in the soil and drainage of
the soil was different. Temperature is also an important factor, and specimens found
in cold climates such as artic and subantartic regions, seem to yield DNA that has less
damage to its bases and is therefore better preserved (Ross et aL, 1996, Lindahl, 1993
and Hofreiter et aL, 2001). This information is consistent with the fact that a decrease
in temperature of 20°C is expected to result in a 10 to 25 fold reduction in the rate of
enzymatic reactions such as exonuclease digestion. Freezing, as in the case of
permafrost, would farther reduce the decay rate, and may halt it completely (Ross et
aL, 1996). Theoretical estimates from biochemical research predict that hilly hydrated
DNA could survive for tens of thousands of years, particularly if preserved at low
Jemperatures (Lindahl, 1993). The factors, and their effects on the preservation of
DNA are summarised in Table 3.
16

FACTOR
COMMENTS
Absence of microorganisms Microbial degradation of DNA is prevented.
Absence of UV radiation and isotopes Only the surthce of sample is affected by UV irradiation.
Aridity Hydrolytic and oxidative damage is reduced under dry conditions.
DNA adsorption to mineral surfaces such as DNA molecules are stabilised by binding to - mineral surfaces. uyuruxyapaute
Rapid inhumation after death
Hard and dry tissue samples
Low temperatures
Neutral or slightly alkaline pH value
Infestation by microorganisms is accelerated by the formation of gas and the breakdown of soft tissue structures.
Hard and dry tissues prevent physical and chemical reactions. Bones and teeth protect organic residues against chemical reactions and microbial infestation.
Low temperatures decrease the rate of most chemical reactions and inhibit the growth of microorganisms.
As environmental pH decreases, both DNA and its surrounding material (bone or teeth) will be degraded or destroyed.
Phenolic geopolymers prevent aerobic activity of microbes.
Samples should be stored at least as cold as ambient temperature where they were excavated. For longer-term storage, the use of a -20°C freezer is highly recommended.
Presence of chelating humic and flulvic acids
Storage of samples at low temperatures
Table 3: Favourable conditions leading to aDNA preservation in archaeological
material. Machugh et aL (2000), which was modified from Burger et aL (1999).
17

1.6 DNA EXTRACTION METhODS
The extraction of DNA from bone has been achieved using a number of
different methods. The favoured method of the early part of the last decade seems to
have been the phenol/chloroform method (Hagelberg and Clegg, 1991; Handt et aL,
1996; Bailey, 1996 and Colson, 1997). This method usually involves incubation of the
material in a lysis buffer followed by extraction with phenol and chloroform. The
lysis buffer can contain a number of different components including ethylene
diaminetetra-acetic acid (EDTA), sodium dodecyl sulphate (SDS) and proteinase K.
These substances are used to break open the cells and cleave proteins bound to the
DNA contained within the chromosomes (Butler, 2001). Proteinase K may also
inactivate nucleases present in the biological sample and EDTA, as a chelating agent
binds cations required for nuclease action. The phenol precipitates the protein material
and cellular debris, leaving DNA in solution. Chloroform prevents trace amounts of
phenol remaining in the aqueous phase, where it would result in chemical damage to
the DNA. Some of the chemicals, like SDS, phenol and proteinase K, used in the lysis
buffer are potent inhibitors of the polymerase chain reaction (PCR) and so will cause
major problems in farther analysis (PCR techniques and applications workshop), if
not subsequently removed.
To combat this, some researchers have taken to using farther purification
steps such as ethanol precipitation (Fisher, 1993). DNA is insoluble in ethanol, and
precipitates out, facilitating its recovery by centrifligation (usually in the presence of a
carrier such as glycogen or a salting agent such as sodium acetate). Another method is
by the use of silica columns (Richards and Sykes, 1995 and Greenwood et aL, 2001).
Silica-based methods have been used quite successfally (Ross and Paabo, 1993;
Cipollaro et aL, 1999 and Handt et aL, 1994), and recent comparisons by Yang and
co-workers (1998) question the relative effectiveness of the phenol/chloroform stage
of the extraction process. They combined elements from the methods of Hagelberg
and Clegg, (1991) and Ross and Paabo, (1993) to produce a method eliminating the
phenol/chloroform stage for a more effective extraction. Although organic extraction
works well for high molecular weight DNA retrieval, it is time consuming, as it
requires numerous sample transfers, and is less effective with small amounts of DNA.
There are a number of other methods that have also been used which steer
away from the more hazardous reagents; for example, sodium acetate precipitation
18

(Cattaneo et aL, 1995), Chelex (Walsh et aL, 1991), water elution (Petrishchev et aL,
1993) and various manufactured kits. Sodium acetate precipitation works along the
same vein as ethanol precipitation. This method also requires a lysis buffer; the
sodium acetate then separates the DNA from the proteins, which is then precipitated
out using isopropanol. Chelex® is an ion-exchange resin, which is added in
suspension to the sample. It is composed of styrene divinylbenzene co-polymers,
which contain paired iminoacetate ions (Walsh et aL, 1991). These act as chelating
groups that bind polyvalent metal ions such as magnesium and by doing this the
nucleases that break down DNA are inactivated, as they require divalent cations as
cofactors for their activity. Boiling with chelex, as well as denaturing DNA, disrupts
the cell membrane and denatures the cell's proteins. Centrifügation pellets the beads
and then the supernatant is ready for extraction (Butler, 2001). This method is very
quick and can be carried out in a single microflige tube, which reduces the risk of
cross contamination. Some researchers have insisted on decaldil'ing bone material
before use (Greenwood et aL, 2001) but ongoing research has indicated that
decalcification is not required and actually reduces the DNA yield by half (Hagelberg
and Clegg, 1991 and Fisher et aL, 1993).
Even the most efficient methods of extraction can fail if a poor sample is used,
so careful choices have to be made with respect to the procedures that are chosen for
the samples. There are various methods that can be applied to assess the suitability of
a bone sample, but the most obvious one is examine its condition. If, after excavation,
the bones are dense rather than brittle and the surface is undamaged then they are
generally well preserved. If, on the other hand, they are damp and the surface is pitted
and rubs off when handled, then the preservation is regarded as poor (Hagelberg a aL, 1991).
Well-preserved bone always shows the presence of osteocytes under
microscopic examination (Richards and Sykes, 1995). This method involves using a
portion of a transverse slice of bone that has been embedded in epoxy resin, mounted
and polished on one side. An optical microscope using reflected light and around
400x magnification is then used to examine the polished side for the presence of
osteocytes. Mother method that could be used is analysis of the racemization of
certain amino acids, such as aspartic acid, alanine and leucine, by high performance
liquid chromatography (HPLC) (Poinar a aL, 1996). During the active metabolic
19

process L-amino acids undergo racemization to D-amino acids, which are optical
isomers, to a point where they are present in equal amounts. The rate at which this
process occurs differs depending on the amino acid, the presence of water,
temperature and chelation of metal ions, all things that affect the depurination of
DNA. Poinar and co-workers (1996) used this correlation to determine the amount of
DNA degradation and found that for aspartic acid a DIL ratio exceeding 0.08, the
sample did not produce any amplifiable DNA.
The prevention of contamination is an integral part of retrieving viable results.
Ancient human material presents more of a problem than animal bones, as modem
DNA could contaminate the samples and give false readings whereas with ancient
animal material if they are distinct from, but related to the present species, they are
considered authentic (Hofreiter et al., 2001). Precautions need to be taken with every
stage from excavation to laboratory to preparation. Gloves need to be used to handle
the samples at all times, and protective clothing should also be used.
1.7 POLYMERASE CHAIN REACTION
The Polymerase Chain Reaction (PCR) has made a huge impact on molecular
biology. Most of the studies mentioned in the previous sections have used this
revolutionary technique to analyse DNA. Since Kary Mullis devised this method in
the mid 1980's, the process of analysing particular gene sequences has become
simpler and quicker. In order to study a target gene before PCR was developed, one
had to resort to lengthy techniques such as cloning and hybridisation. Cloning would
require taking a DNA fragment and inserting it into a vector. It would then be
introduced into a host cell in order to replicate the target sequence. PCR has enabled
scientists to produce an enormous number of copies of a specific sequence in just a
few hours. Since only a small amount of DNA, less than a microgram, is needed, PCR
has revolutionised the work on ancient material (Hofreiter et aL, 2001).
The reaction requires several components; firstly, a small amount of template
DNA, denatured to single stranded form, is needed. Two flanking oligonucleotide
primers, which are small sequences of DNA that will bind to the separated single
strands of the template DNA, are also required. These primers are usually between
15-30 nucleotides in length and are designed in pairs. The 0 + C content of these
primers must be known, and there must be similar 0 + C ratios between pairs. The
PTO
pairs must also lack homology in order to prevent self-annealing or the possibility of
dimerisation. The actual sequence of the primers dictates the temperature of annealing
(IM) which can be estimated using the equation TM = 2(A+T) + 4(G+C) (Stryer,
1995).
The enzyme DNA polymerase that is responsible for DNA synthesis requires
the primers in order to initiate synthesis. DNA polymerase can only add
deoxyribonucleotides to the 3' terminus of a DNA strand, and cannot initiate DNA
synthesis de novo. The primers hybridS to the template DNA strand to provide these
starting points for the enzyme. It also needs the four deoxynucleotide triphosphate
precursors (dNTP's) to synthesise the new DNA strand. The first DNA polymerase
used in this protocol was DNA polymerase I (DNA poll) from Escherlchia coil, as
this was a well-characterised enzyme and its gene (polA) had been cloned, thus
facilitating the large-scale production of the enzyme. However, this enzyme is
sensitive to heat, and the denaturation step of the PCR procedure inactivated the
enzyme, requiring the replenishment of the DNA polymerase at each round. Scientists
discovered that the bacterium The rm us aquaticus, which lives in hot springs at
temperatures above 75 °C, has a DNA polymerase (Taq polymerase) with an optimal
temperature of 72 °C and which is reasonably stable at 94 °C (Watson et aL, 1992).
ManuThcturers have modified and marketed various forms of this enzyme. Taq
polymerase has 5'-3' exonuclease activity and an optimum temperature of 72 °C.
Aniplitaq® is a recombinant form of Taq polymerase which has a temperature range
of 70-80 °C, and both are patented by the Cetus corporation. The derivative Stoffel
fragment, unlike Taq polymerase, has no 5'-3' exonuclease activity but a higher
thermo stability.
As well as these above components, the reaction also requires MgCl2 at a
concentration of between 1-2 mM to act as a buffer and as a co-factor for most DNA
polymerases. The precise concentration of MgCl2 is essential for an efficient reaction.
If the concentration is too low, it will produce a low PCR yield but, on the other hand,
if it is too high, it can lead to non-specific products. The final volume of the reaction
can vary between 25-100 gil and may be overlaid with 50 gil of mineral oil to stop the
contents from evaporating (Watson et aL, 1992).
The reaction itself is a cycle; the first stage is the denaturation step where the
reaction mixture is heated to a temperature around 94 °C for 5 minutes, which
21

separates the double stranded template DNA into two strands. The temperature then
drops to between 30-65 °C so that the primers can anneal to the complementary target
sequence. The temperature then rises again to about 72 °C, which is the optimal
temperature for Taq DNA polymerase so DNA synthesis can proceed. This stage
takes about 5 minutes and then the temperature is increased back up to 94 °C again so
the newly synthesised strands denature for the next cycle. This cycle is represented in
Figure 6, and its effects in Figure 7.
The reaction takes place in a thermocycler, which is preprogrammed to carry
out as many cycles as required at the specified temperatures. The cycle can be
repeated as many as 30 to 60 times and produces an optimal number of a theoretical
maximum of 2 n double stranded DNA molecules, where n is the number of the cycles.
PA

Sample is denatured to separate DNA strands
(94 °C for about 5 mins)
Primers anneal to DNA strands (30-65 °C for about 30
sees)
DNA strands are denatured to separate them (94 °C for 30 sees)
DNA polymerase synthesises new strand (65-75 °C for2-5 mins)
Fig 6: The PCR cycle (adapted from Watson ci aL, 1992)
23

AmpliFication of target sequence
Original target double-stranded DNA
3'
a)
- -------- Separate strands
and anneal primers
-, - 3'.
(b) Prirnor 2L. - Primer 1
5'
Extend primers
(CI5' ________________________ 3' —a
Complementary_, Complementary
primer 2 toprimorl
I Separate strands
3 and anneal primers
(d) - New primers -
5' 3'
Extend primers
able-length/
—a
Unit-length strands
Separate strands and anneal primers
CanpAcmentary-'- 3'
'y' Complementary tànrimer 2 - ---'r-"m to primer I
11 5' • —
Extend primers
5.
s -'---'-"--'-" 3'
5' -5' d%n%,aef%#%.a..%a. 3'
• Desfrad fragments (ariblè-lcngth strands not shown)
And so on
Fig 7: The Polymerase Chain Reaction (Reproduced from Watson et aL, 1992)
24

Randomly amplified polymorphic DNA - PCR (RAPD-PCR) is an alternative
PCR technique which, as it suggests, amplifies DNA sequences using random-binding
primers. With conventional PCR some knowledge of a particular sequence to be
amplified, as well as that of the primers required is needed. RAPD-PCR requires no
prior knowledge to carry out the reaction. The primers are typically 7-15 bases in
length and are non-specific in that they bind to complementary sequences, which are
effectively located at random on the template DNA. If the primers form matched
pairs, as shown in Figure 8, then an amplicon is produced. These amplicons are of
various sizes and therefore generate an informative fingerprint pattern, which is
indicative of the species being analysed (Lee and Chang, 1994). This is due to
different regions in the genome that are complementary to the primers and will diflër
in location and relative positive in the genomes of different species.
These fragments, when examined on an agarose gel using electrophoresis, will
produce a fingerprint that is species-specific. There are a number of different primers
that can be used and, although they will all produce a diflérent fingerprint, they will
still be indicative of the DNA of the species being tested.
Other methods have been used which produce species fingerprints do not use
RAPD-PCR. A method based on antigen-antibody reactions has been used but it
could not distinguish between closely related species like wild boar and pig, cattle and
buffalo or sheep and goat (Koh et aL, 1998). Mother method used for species
fingerprinting is polymerase chain reaction-restriction fragment length polymorphism
(PCR-RFLP). This technique uses primers specific for the cytochrome b gene,
amplifies the products using PCR and then uses 2 restriction enzymes to digest the
amplified fragments. Research using this method has been carried out on fragments of
bone taken from the site Head-smashed-in buffalo jump, located in southwest Alberta,
Canada (Newman et aL, 2000).
25

5' 3'
5
3 , '
5 ' 3' f\r\J
3' 5'
5 5 ' 3'
' 3'
f\f\ 5'
5' 1'
5 ' 3'
3 '
' I
5'
5' 3' "VV
3 ' 5'
Fig 8: Representation of the formation of amplicons in RAPD-PCR
The diagram above shows that amplicons can only be produced if the primers anneal
to the 3' end of the DNA strand and are facing each other on opposite strands with a
space between them that is 5 kiobases (kb) long [1]. If they anneal on the same strand
[2] or on separate strands but facing away from each other [3] then they will not
produce an amplicon.
RAPD-PCR could be used to identii3' the species from which bone fragments
originate in archaeological investigations where the bone that cannot be
1
2
3
MR

morphologically identified. This type of PCR can also be useful when testing food
samples. For example when expensive meats are fraudulently replaced with cheaper
ones and visual differences are not evident, then this method has been used to identii'
the species (Koh et al., 1997). Mother use could be detecting the illegal trafficking of
endangered species products like powdered rhino horn for instance (Wetton ci aL,
2002, Koh ci aL, 1997 and Lee and Chang, 1994).
The PCR reaction is very sensitive and if there is any contamination with
recent DNA material that is not damaged, then it is more likely to amplify the recent
material rather than the ancient. At every stage of the procedure protective clothing
must be worn. A dedicated PCR workstation is also useful and this must be kept
separate from areas for clean up and extraction procedures to avoid cross
contamination. DNAse® is also a good tool for removing trace amounts of DNA as
well as UV irradiation to cross-link DNA remnants. The PCR reaction has also got a
number of inhibitors as well as the ionic detergents mentioned earlier, silica particles
from extraction methods can affect the reaction, so extreme care must be taken when
transferring DNA samples into the reaction. Organic inhibitors could also be co-
extracted for example tannins, humic and fUlvic acid and maillard products which not
be removed during the process. All these things can be used for troubleshooting and
possible clean-up methods (Machugh, 2000).
1.8 ANALYSIS OF DNA EXTRACTED FROM BONE
Extraction of DNA from ancient bone samples has been put to use in
numerous different ways. DNA analysis has been used for species-level identification
when bone remains cannot be morphologically distinguished (Barnes ci aL, 2000 and
Loreille ci aL, 1997). Bone fragments have also been analysed and using various
methods species-specific fingerprints have been produced for use in identification
(Lee and Chang, 1994 and Newman ci aL, 2002). This application is central to the
subject of this thesis and will be discussed in more detail later.
Researchers have analysed the phylogeny of extinct species and studied the
relationship with extant species (Cooper et aL, 1992, Greenwood et aL, 2001, Hoss ci
27

aL, 1996 [1] and Janczewski et aL, 1992). This also leads to the analysis of genetic
variation within and between populations of the same species (Cooper, 2000).
The identification of victims found in mass graves (Boles et aL, 1995;
Primorac et aL, 1996), correlates with work in gender identification of infants and
small children's remains when morphology cannot be used (Colson et aL, 1997;
Faerman et aL, 1995). The identification of skeletons found to be those of the
Romanov family has used these techniques and mitochondrial DNA (mtDNA) (Gill et
aL, 1994).
DNA analysis of bones has major forensic implications and has been used in
criminal cases to aid the identification of murder victims (Lee et aL, 1991).
The retrieval of DNA from ancient human samples (llandt et aL, 1996, Hoss
et aL, 1996 [2] and Meyer et aL, 2000) has been successifilly achieved and this
knowledge can then contribute to research into the ancestry of different races
(Stoneking, 1995).
DNA has been extracted from ancient wheat seeds and has been used in
taxonomic identification to asses quality of possible bread making of wheat grown at
an Early Bronze Age site in Greece (Brown, 1999).
There has been some investigation into how environmental factors affect the
preservation of DNA (Burger et aL, 1999) and bone diagenesis studies have been
carried out on skeletons found in a house in Pompeii (CipoBaro et aL, 1999).
Researchers have also spent time trying to improve the methods used by
comparing extraction methods to determine theft effectiveness (Cattaneo et aL, 1997),
and comparing extractions taken from bone and soft tissues (Lassen et aL, 1994). All
this research into dfflèrent areas will aid further studies and improve techniques.
1.9 AIMS OF THE RESEARCH
There were a number of difibrent aims to this research project. Given the lack
of expertise within the laboratory regarding analysis of DNA from archaeological
samples, an initial aim was to find a reliable method of extracting DNA from bone.
Subsequently, this DNA would be used in the RAPD-PCR reactions to produce
RAPD profiles of a range of species to create a library of profiles so that unknown
samples could be compared and identified.
28

The applications of this research would mainly of value in the field of
archaeology, where unknown bone fragments are often recovered. Although
anthropologists are experienced in identifj,'ing human bones, even in fragmentary
states, small fragments often present problems in objective identification, and if
suspected to be non-human in origin, then further difficulties are presented in
determining the animal species, given the wide range of potential species. For
example, this University recently acquired the contents of some votary urns, which
are used to carry cremated remains. These urns can invariably contain animal remains
as well as human, and so with this test we might be able to determine the origin of the
contents, which could lead to an insight into diet, general communal practices and
lifestyles of these people.
A molecular approach, based on RAPD-PCR methodology, could be used as a
quick and convenient initial test to determine their species origin. Further methods
could then be used to confirm these initial results like PCR-RFLP (Newman et aL,
2000) or antigen-antibody reactions (Koh et aL, 1997). One challenge of the approach
would be to see if it could distinguish between species that are closely related, such as
pig and wild boar.
If successful in this regard, the method might also be used to possibly identib'
diftërent strains or breed of species, along the lines of related work carried out by
Cooper, 2000 in analysing genetic variations between populations of the southern
brown bandicoot (Isoodon obesulus).

2. MATERIALS AND METhODS
2.1 BONE SAMPLES
Bone samples were collected from a number of different sources (See Table 2)
Specks Origin
Ages of samples
Pig (Sits scrofa) Preston abattoir, Preston hours after slaughter
Bovine (Bos bubalis) Brindle brothers butchers, Bamber Bridge hours after slaughter
Lamb (Ovis aries) Brindle brothers butchers, Bamber Bridge hours after slaughter
Rabbit (Or)ctolagus Courtesy of David Pepper, N. Wales c. 20 years
cuniculus)
Dog (Canisfainiliaris) The Veterinary centre, Blackburn 2 months
Roe Deer (Capreolus The Farm centre, Blackburn hours after slaughter
capreolus)
Wild boar (Sus scrofa) The Farm centre, Blackburn hours after slaughter
Unknown long bone Garden, Penwortham, Preston c. 20 years
Unknown scapula Garden, Penwortharn, Preston c. 20 years
Table 2.1: Bone samples used for analysis
All fresh samples were stored at —80 °C, after being ground to a fine powder
using a freezer mill (Glen Creston Ltd, model 6750). The bone samples were then stored
in sterile vessels at —20 CC. Old samples were stored in plastic bags until cleaning. After
grinding they were stored at —20 °C. The dog samples were extracted teeth, which after
grinding were stored in the same manner as the bone samples.
2.1.1 CLEANING OF BONE
Old bone material was cleaned first using a soft brush and a scalpel to remove any
dirt or soil debris. A large metal file was then used to remove to top layer of the bone;
rough sandpaper was also used for the bits the larger file was too big for. Throughout this
30

whole procedure lab coat, glasses and a dust mask were worn to prevent inhalation of
dust. The file was sterilised using isopropanol after each use. The bone was wrapped in
paper and then fragmented using a hammer. The pieces were then placed on foil to
provide a reflective surthee and exposed to UV light for 20 minutes using a UV hood
(Scie pbs GLE-UVSC). The dog teeth were cleaned by using a scalpel to remove plaque
and dirt and were then soaked overnight in 5% Chloros.
2.1.2 BONE GRINDING
Fresh bone samples were cut into small pieces using a tenon saw. They were then
weighed and placed into sterile tubes with impacters. The bone material was ground into
a fine powder using a freezer mill (Glen Creston Ltd 6750) under liquid nitrogen on a
setting of I cycle for 2 minutes at the rate of 10 impacts per second. Old bone samples
were treated in the same way except they were wrapped in clean, sterile paper and then
fragmented using a hammer rather than by sawing.
2.2 DNA EXTRACTION FROM FRESH BONE
2.2.1 CHELEX METHOD
This method was adapted from the DNA extraction protocols handbook published
by Perkin Elmer Biosystems. 0.1 g of the bone powder was placed into an autoclaved
microcentrifuge tube (1.5 ml) with 200 j.tl of 5% Chelex 100 8. The sample was incubated
in a water bath at 56 °C for two hours and then removed and vortexed thoroughly at high
speed for 10 seconds. The microcentriflige tube lid was then pierced, to prevent pressure
build up, with a steriised needle before placing the tube in a boiling water bath for an
incubation period of 8 minutes. The sample was vortexed again for 10 seconds and
centrifuged in a microcentrifbge (MSE Micro centaur) for 2 minutes at 13,000 rpm. The
supernatant was removed and placed in a fresh 1.5 ml microfhge tube; the sample was
now ready for DNA quantification and PCR amplification. The remainder of the sample
was stored at either 2 to 6 CC or —15 to —25 °C. Frozen samples were thawed at room
31
temperature, vortexed and centrifuged for 2 minutes using a microcentriflige before
undertaking subsequent analysis.
2.2.2 ONAce KIT (Bioline, London)
0.1 g of bone powder was placed into an autoclaved microcentriftige tube and to it
was added I ml of Lysis buflèr (manufucturer's recipe) and 200 jxl of Bone lysis
enhancer (manufacturer's recipe). If the Lysis buffer contained any precipitate, it was
incubated at 50 °C until it had completely dissolved. The tube and contents were then
incubated in a water bath with occasional agitation at 50 - 60 °C for 15 - 20 hours. The
sample was then placed in the microcentrifl.ige and centrifuged at full speed for 2 minutes
after which the supernatant was transferred to a fresh 1.5 ml microfUge tube. After
thoroughly vortexing the Carrier suspension (manufacturer's recipe), 15 j.il was added to
the microcentrifi.ige tube and vortexed again. The sample was then left to incubate at
room temperature for 5 minutes before centrifuging at 10,000 rpm briefly to form a
pellet. The supernatant was carefully discarded to leave a pellet, which was then
resuspended in I ml of Wash buffer. The sample was centrifuged again briefly at 10,000
rpm briefly and the supernatant discarded; the Wash buffer (made up according to
manufacturer's instructions) was then added and the process was repeated twice. Finally,
it was centrifuged and the residual Wash buffer removed. The pellet was dried using an
incubator, then resuspended in 80 jsl of Elution buffer D (manufhcturer's recipe) and
incubated at 60 °C for 5 minutes in a water bath in order to elute the DNA. It was then
centrifuged for 2 minutes at 13,000 rpm and the supernatant was removed. Care was
taken to avoid transferring any carrier particles when using a Gilson pipette.
2.2.3 GENOMESTAR KIT (Bybaid,)
Using a 1.5 ml microcentrifuge tube, 600 J.Ll of Buffer I (manuficturer's recipe)
was added to 0.1 g of bone powder in the tube and then incubated in a water bath at 68 °C
32

for 5-10 minutes. The suspension was deproteinised by adding 450 Al of chloroform
whilst mixing to form an emulsion, and was then centrifuged at 10,000 rpm for 2
minutes. The upper phase was transferred to a sterile 1.5 ml microcentrifüge tube and 450
gl of distilled water and 50 gI of Buffer 2 (manufacturer's recipe) were added. After
gently mixing by inversion, the sample was then centrifuged at 10,000 rpm for 2 minutes
to pellet the precipitated DNA. This was then resuspended using 0.3 ml of Buffer 3
(manufacturer's recipe) and 375 gI of 96 % ethanol, and mixed by inversion. The sample
was centrifuged at 10,000 rpm for 10 minutes and the supernatant was discarded. The
pellet was then rinsed with 70 % ethanol, and the DNA dissolved in 100 gl of TE buffer.
2.3 SPECTROPHOTOMETRIC ANALYSIS OFDNA SOLUTIONS
Absorbance readings were taken of the different samples at 230 nm, 260 nm and
280 rim to determine carbohydrate, nucleic acid and protein concentrations respectively.
All samples were placed in 0.5 ml quartz cuvettes and, using a water standard, the
UV/Vis spectrophotometer (Ultraspec XLKB Biochmm) was set to a reference zero
before each reading. The samples were prepared by taking 20 gl of DNA solution and
diluting with 380 j.xl of water to create a 1 in 20 dilution. If the absorbance readings were
above 1.0 then further dilutions were required. All results were recorded in order to
calculate concentrations and yield. Results were calculated using the equations;
A2w of 1.0 = 50 gg/ml of double stranded DNA
A260 of 1.0 = 40 gglml of single stranded DNA
The Chelex method of DNA extraction produces single stranded DNA due to the
denaturation step of this process and therefore the second equation was used, for samples
produced by this method.
"3

2.4 DNA OUANTIFICATION
A 0.8 % agarose gel was used to quantify the sample DNA by comparing
brightness of bands with those containing a known quantity of DNA. Sheared Hening
sperm DNA was used for the standard and a series of dilutions were produced from a
stock solution of 10 mg/mI. These dilutions were loaded on to the gel with 2 jil of
tracking dye (0.25 % bromophenol blue, 0.25 % xylene cyanol FF and 40 % (w/v)
sucrose in water), to make a total of2O jil, in descending order and 18 gl of sample DNA
was also loaded with 2 uI of tracking dye. The get was then placed in an electrophoresis
tank in TAE buffer (0.04 M Tris-acetate, 0.001 M EDTA [pFI 8]) and electrophoresed at
50 mA for approximately 3 hours. It was then placed into an ethiduim bromide solution
(0.5 xg/ml) to stain for 10 minutes before placing in the UV image analyser (UVP Bio-
docit image analyser) to photograph. Comparison of the standard bands and the sample
band were made in order to assess the amount of DNA present, so the amount included in
PCR reactions could be determined. The results taken from the spectrophotometry
analysis were also used to quantify the amount of DNA present. This is not an accurate
method for the determination of absolute DNA content values as inevitably the
supernatant will contain other components including protein, carbohydrate and also RNA.
2.5 PCR ANALYSIS
2.5.1 Ready-To-GoTh RAPD Analysis (Amersham Phannacia Biotech, Little
Cha riton)
Extreme care was taken with this procedure to prevent DNA contamination but
due to the lack of facilities available at the time of the research the precautions that were
most suitable were put in to place. The extraction and PCR processes were separated by
placing the different areas at opposing ends of the room or canying out the procedures at
diflèrent times with thorough cleaning and UV irradiation in between. Sterile filter
pipette tips were always used to prevent cross contamination from stock solutions. A
RAPD analysis bead (AmpliTaq® DNA polymerase and Stoffel fragment, 0.4 mM of
34

2.5.2 Ready-To-GC PCR Analysis (Amersham Pharmacia Biotech, Little Charlton)
Extreme care was taken with this procedure to prevent DNA contamination and
fresh sterile filter pipette tips were always used to prevent cross contamination from stock
solutions. A Ready-to-go PCR analysis bead ((1.5 units of Taq DNA polymerase, 200
MM of each dNTP in a 25 p1 reaction, Bovine Serum Albumin (2.5 jig), and buffer [1.5
mM M902, 50 mM KCI and 10 mM Tris-HCI, (pH 9.0) in a 25 p1 volume]) was placed
in a 0.2 ml PCR tube making sure the bead sits at the bottom. 25 ppmol of a single pair of
primers (5 pI) was then added to the tube, followed by a quantified amount of template
DNA between 5 and 50 ng and then distilled water to a final volume of 25 g1• The
primers used were the same as those for RAPD (Table 2.2).
The contents of the tube were then mixed by vortexing and then centriftiged, in
the microcentriftige using adapters, for I sec at 13,000 rpm to collect the contents at the
bottom of the tube. The reaction mixture was then overlaid with 50 p1 of mineral oil and
the tube then placed in the thermocycler (Applied Biosystems GeneampTM 2700). The
thermocycler was set to cycle at 95 °C for 5 minutes followed by 45 cycles at 95 °C for 1
minute, 36 °C for I minute and 72 °C for 2 minutes then to hold the samples at 4 °C. All
reactions had a positive and negative control. The positive control used was 2 p1 of E.
coil Cia DNA and the negative control replaced DNA with double distilled and sterile
water.
Reactions were prepared in a UV hood (Scie plas GLE-UVSC) and equipment
was irradiated for 20 minutes.
2.5.3 Agarose Gel Electrophoresis
The amplicons produced were then analysed using a 2% agarose gel in TAB
buffer. A 100 base pair ladder was used as a marker, loading 3 p1 of ladder and 2 p1 of
tracking dye. For each of the amplified samples 10 pl were loaded with 2 p1 of tracking
dye. The gel was then electrophoresed at 50 mA for about 3 hours or until the tracking
dye was around 3 cm away from the bottom of the gel. The gel was then removed from
36

the tank and then placed in a separate tank containing ethiduim bromide (0.5 jig/mI) and
left for about 10 minutes. The gel was placed in a UV image analyser to visualise the
bands and photograph the gel.
Fragment Size (kb)
A 23.13
B 9.42
C 6.56
D 4.36
E 2.32
F 2.02
0 0.56
Table 23: Represents the sizes of X Hindlil molecular weight marker DNA fragments.
This table was used to size the fragments of RAPD fragments of the different species
using a standard curve using tan molecular weight (in kb) versus distance (mm)
(Sanger et al. 1982).
1

Base Pairs ONAMass (ng)
I -1,517 45
1.200 35
1,000 95
-900 27
-600 24
-700 21
-600 16
5001517 97
-400 38
300 29
200 25
-100 48
Fig 2.1: Represents the sizes of fragments of 100 bp ladder used in the reproduction of
gels (Figures 3.9.1, 3.92 and 3.9.3). Fragments were sized again using a standard curve
using tan molecular weight (in kb) versus distance (mm).
38

RESULTS
3.1 Extraction of DNA from bone
At the start of this project, there was no expertise in our laboratory in the
extraction of DNA from bone, and so it was necessary to spend some time and effort
in identil'ing a protocol suitable for this purpose. It was decided to begin by applying
simple methods to fresh bone samples, and to then test the suitability of these methods
for more ancient animal bones.
The Chelex extraction method, as described in the DNA extraction protocols
handbook from Perkin Elmer Biosystems (materials and methods section 2.2.1), was
selected for initial trials. This method was applied to small (2 mm diameter) samples
of fresh animal bone, but no DNA from these sources could be detected after agarose
gel electrophoresis and ethiduim bromide staining. The Chelex extraction method
involved the suspension of the bone sample in an extraction buffer, and despite
increasing incubation times (overnight); no DNA could be recovered using this
approach. Controls using tissue samples (muscle tissue) also gave poor results, and so
it was considered that the procedure could be improved by breaking up the bone
sample using mechanical methods.
Use of a Potter's homogeniser to disrupt bone marrow samples removed from
fresh bone material Ihiled to produce detectable quantities of DNA and, in any case,
this approach would not have been applicable to complete or ancient bone samples,
where marrow could not be obtained. It was therefore decided to grind bone samples
to a fine powder using a freezer mill. This apparatus, (model 6750, manufactured by
Glen Creston Ltd), grinds solid bone or dental samples by impaction in sterile
containers under liquid nitrogen. Samples frozen under these conditions are brittle and
easily powdered by impaction. A fine bone powder was produced by this process,
which was then used in subsequent extraction methods. All methods described below
employed this approach.
However, initial attempts to extract DNA from the powdered bone samples
using the published Chelex extraction method failed to yield detectable amounts of
DNA. The extraction procedure was therefore modified to include a detergent in the
buffer during the incubation of the sample at 56 °C, since it was reasoned that this
should fücilitate cellular lysis and release of DNA. The non-ionic detergent Triton X-
39
100 at a concentration of I % in the incubation buffer was successflul in this respect,
and amounts of DNA were produced that were easily observed on agarose gels, giving
our first success in extracting DNA from bone.
It was then decided to refine the modified procedure further, through a
comparison of Triton X- 100 with the ionic detergent sodium lauryl sulphate (SLS),
and by establishing the optimal incubation time with detergent for cellular lysis and
DNA recovery. Extraction experiments were thus performed using multiple identical
samples of fresh bone incubated with buffer containing either a I % Triton X-100
solution or a I % SLS solution. These samples were used for extraction of DNA over
a range of incubation times that ranged from I to 18 hours (overnight). As controls,
duplicates were set up without incubation. DNA was extracted from these samples as
described in section 2.1, and 16 iii of the final solution was subjected to
electrophoresis. In addition, the absorbances of the final solutions were determined at
wavelengths of 230, 260, and 280 nm to determine whether carbohydrate or protein
were present as contaminants in the samples.
This was undertaken to detennine the purity of the samples that were being
extracted; if the 230 nm and 280 nm values were high, then this would indicate that
samples were respectively contaminated with carbohydrates and proteins. The biggest
concern was that the protein fraction could include enzymes that might degrade the
DNA in solution.
By comparing the results of agarose gel images (Figure 3.1) and the
absorbance readings (Table 3.1) it was determined that an incubation time of 2 hours
using the detergent SLS optimised the amount of DNA yielded by the extraction
process. Incubation of samples for longer periods did not increase significantly the
yield of DNA. There was also present cellular RNA, which is evident, as it appears
below the 0.56 kb X Hin dill fragment. The table also shows that the samples were
pure as the amount of protein present is relatively small. The protein contamination in
the samples increases as the DNA yield increases. These values are typical of the
results obtained throughout the project.
40

Table 3.1: Effect of incubation time on yield of DNA using a modified Chelex
extraction method.
Incubation
time (hrs) A0 A260 A290
Conc. of
DNA
(.sg/ml)
Conc. of
protein
(.sgImI)
Yield
(xgI0.1 g
of bone)
0 0.103 0.045 0.044 36 34 2.88
0.588 0.231 0.162 184.8 75.5 14.8
2 0.840 0.362 0.212 289.6 53.5 23.17
4 0.664 0.304 0.257 243.2 167.4 19.46
18+ 0.896 0.342 0.306 273.6 214.4 21.89
The figures presented are an average of three experiments. The method
incorporated SLS in the incubation buffer. Calculations for the DNA and protein
concentrations were taken from Boyer (2000).
41

23.13 kb
9.42 kb
6.56 kb
4.36 kb
2.32 kb
2.02kb
0.56 kb
Figure 3.1: Agarose gel electrophoresis of DNA samples prepared by the
modified Chelex extraction method.
1 2 3 4 5 6 7 8 9 10 11 12 13 14
DNA extracted from pig bone using the SLS modified Chelex method.
Samples visualised in the above agarose gel (lanes 2 - 14) were incubated for various
times in the presence of SLS. Their incubation times, and the amounts of the DNA
sample loaded on to the gel are indicated in the table below.
Lane 1 contains MW marker DNA (X Hin dIll)
Table 3.2: Represents incubation times of samples and amount loaded on to gel.
Lane 1 2 3 4 5 6 7 8 9 10 11 12 13 14
Incubation
time(h) 0 0 1 1 1 2 2 2 4 4 4 18+ 18+ 18+
Volume
of DNA
solution 20 20 2 10 20 2 10 20 2 10 20 2 10 20
loaded on
to gel (jsl)
42

The next step taken was to investigate other extraction methods to compare
their efficiency and yield with the modified Chelex method. Two manufactured kits
were chosen; DNAce (Bioline, London) and Genomestar (Hybaid). Both methods,
described in sections 2.2.2 and 2.2.3, were followed according to the manufacturers'
instruction using 0.1 g of bone powder produced using the freezer mill.
The DNAce kit used a lysis buffer to split open the cells to release the DNA,
which then attached itself to the carrier suspension. This then was centrifuged to
produce a pellet, which was washed to remove any impurities, and an elution buffer
was added to the pellet to remove it from the carrier suspension. The supernatant (60
jil) was placed in a fresh 1.5 ml microfuge tube and was then ready for analysis.
The Genomestar kit uses a different lysis buffer and the lysate is de-
proteinised using chloroform. The manufacturer does not describe the composition of
these buffers. DNA was precipitated out using a second buffer and then re-suspended
using a third buffer. Ethanol was then used to precipitate the DNA to remove any
impurities from the mixture and centrifUged to produce a DNA pellet, which was
finally resuspended in TE buffer.
Samples from each of the different methods were quantified using known
standards and electrophoresed on an agarose gel and visualised using ethiduim
bromide. The results are shown in Figure 3.2.
43

Figure 3.2: Visualisation of DNA obtained by three different extraction methods,
by agarose gel electrophoresis.
1 2 3 4 5 6 7 8 9 10 11
Lanes 1 —7 include the following amounts of Herring sperm DNA for quantification:
Lanel. 2gg LaneS. 0.1 jig
Lane 2. 1 jig Lane 6. 0.05 jig
Lane 3. 0.5 jig Lane 7. 0.01 jig
Lane 4. 0.2 jig
DNA extracted from fresh pig bone is shown in the remaining lanes
Lane 8. DNA extracted by modified Chelex, using SLS.
Lane 9. DNA extracted by DNAce kit.
Lane 10. DNA extracted by Genomestar kit.
Lane 11. DNA extracted by Genomestar kit.
ME

From Figure 3.2 it was concluded that both the DNAce kit, represented by
lane 9, and the Genomestar kit, represented by lanes 10 and 11, extracted around 0.5
.tg DNA from 0. Ig of bone. The original method for the Genomestar kit produced a
final volume of over 1.5 ml; in order to overcome this problem the amounts stated in
the original method were split between two tubes. The contents from each extraction
were electrophoresed. It was also evident from the results that the Genomestar kit also
extracted significant amounts of RNA, as shown by the bright band at the bottom of
the DNA band in lane numbers lOand 11.
Although both of the manufactured kits were efficient in the extraction of
DNA, the Genomestar kit extracted RNA with DNA. Given our preliminary
experiences with the three methods, it was decided to proceed with the Chelex method
on the grounds of cost, convenience and the ability to modil, the procedure.
3.2 PCR amplification of DNA samples
Quantification gels (Figure 3.3) were used to estimate the amount of DNA in
samples for use in PCR reactions. For the Ready-to-go ® RAPD-PCR kit, the
recommended amounts of DNA used for the reaction were between 5 and 50 ng.
Following the method described in Section 2.5.1 for RAPD-PCR, samples from all
three extraction methods were used in the reaction and in this experiment primer set I
was used. The RAPD kit provided a choice of short random primers for use.
Nucleotide sequences of these primers are detailed in Table 2.2. The DNA used for
these experiments was taken from extracted samples using the Chelex method and the
samples extracted with the DNAce and Genomestar kits.
45

Figure 3.3: Visualisation of RAPD-PCR amplicons from DNA extracted usin2
three different extraction methods.
1 2 3 4 5 6 7 8 9 10 11
2.32kb
2.02 kb
0.56kb
Primer 2 was used for these experiments and DNA was extracted from fresh pig bone.
Lane 1 is the positive control (E. coli) supplied with the RAPD-PCR analysis kit and
Lane 2 contains the negative control.
Lanes 3 - 7 were samples extracted using the modified Chelex method using SLS.
Lane 8 was amplified from DNA extracted using the DNAce kit and Lane 9 used
extracted DNA using the Genomestar kit.
Herring sperm DNA in lane 10 was used as a second standard.
Lane 11 contains MW marker A Hin WE
S.
EM

Lanes 6 and 9 show very clear amplicons at approximately 1.02 kb and 0.79
kb. These amplicons are also evident in lane 8. In all three of these lanes there is also
evidence of a number of amplicons, which range between 0.36 kb and 0.51 kb in size
but because they are so close together it is impossible to determine how many
amplicons there are. There also evidence of a further band present in lane 9, of about
0.18 kb.
The Herring sperm DNA (lane 10) did not produce a banding pattern at first.
This was found to be a result of the sample not being adequately sheared to smaller
fragments. The reason for its use as a second standard was so that we had a sample of
a larger eukaryotic genome, as this was what we would be mainly dealing with, as
opposed to a prokaryotic genome such as that of E. coil which was provided with the
kit as a reference DNA sample.
DNA extracted from bone by the modified Chelex procedure (lanes 3 - 7)
failed to yield reproducible results. Only lane 6 revealed any amplicons after PCR
amplification, even though DNA was present in each sample. This result led to the
conclusion that the PCR reaction was being in some way inhibited.
The first step to find the cause was to take different elements of the method
and change them to see if the results of the PCR improved. The first change was to
remake the 5 % Chelex solution; this was done in order to eliminate it as a problem.
The next modification that was tried was the use of the extraction method with and
without detergent. Figure 3.4 below shows results obtained using samples extracted
with and without the use of detergent. Those samples with detergent produced no
amplicons whereas the samples produced without the detergent removed produced a
banding pattern, even though the image was slightly blurred. Blurring resulted from
electrophoresing samples at a high voltage: lower voltages and longer times for
electrophoresis subsequently produced tighter, more distinct amplicons.
47

2.32 kb
2.02 kb
Fiiire 3.4: Effects of detergent during extraction on the PCR reaction.
1 2 3 4 5 6 7 8
The experiment shows the effect of detergent (SLS) during extraction from fresh pig
bone on the PCR reaction.
Lane 2 is the positive control (K coli) supplied with RAPD-PCR analysis kit and lane
3 is the negative control.
Lanes 4 and 6 contain samples extracted without using SLS detergent during
incubation.
Lanes 5 and 7 contain samples that were extracted including SLS in the incubation
period.
Lane 8 contained Herring sperm DNA to use as a second standard.
ME

The fragment sizes found in the negative control sample (lane 3) are 1.04 kb,
0.74 kb and 0.49 kb. All these fragments sizes are very similar to those from Figure
3.3 representing pig DNA using primer 2, and are interpreted as being characteristic
of amplicons produced from pig DNA using these primers. Although lanes 4 and 6 are
blurred, it is still evident from Figure 3.4 that the banding pattern is the same as that
of the negative sample. Therefore it was believed that the negative sample was
contaminated with the DNA under analysis.
The conclusion from this experiment was that the detergent included during
the incubation period of the extraction process was inhibiting the PCR reaction.
Therefore because of this result it was decided that the Chelex method should omit the
detergent from the process (c.f. pg 39).
3.3 Comparison of Ready-to-go® RAPD-PCR with Ready-to-go PCR®
Amersham Pharmacia produce two PCR kits: the Ready-to-go RAPD kit and
the simpler Ready-to-go PCR product. Since the latter was cheaper, it was decided to
compare the two kits for use in these experiments; using the E. coli positive control
supplied with the kits we used both PCR reactions in order to compare them. Figure
3.5 shows results from both kits with theE. coil control DNA.
49

Figure 3.5: The differences between Ready-to-go PCR beads and Ready-to-go RAPD-PCR.
1 2 3
This experiment was to compare the two different PCR beads in an attempt to decide
which was best for use in this research. Lane 1 contains a negative control. Lane 2
contains E. coli DNA amplified using the Ready-to-go ® PCR beads and Jane 3
contains E. coli DNA amplified using the Ready-to-go ® RAPD-PCR beads.
50
Contamination was again present in the negative sample shown by lane
1. It was also apparent that the number of amplicons produced using the Ready-to-go ®
PCR beads (lane 2) was less than the number of amplicons produced by the Ready-to-
go® RAPD-PCR beads (lane 3). The reason attributed to extra amplicons was an
ingredient contained in the RAPD bead that was missing from the PCR bead, which
was Stoffel fragment. It was preferable to have more amplicons present for species
identification as it makes the process more precise.
The possibility of multiplexing with the slightly cheaper kit was then explored.
Multiplexing is a technique whereby a number of different primers are used in the
reaction in order that more regions can be copied simultaneously. This was done to
increase the number of amplicons produced, which would then increase the
discrimination of the test. In order for this reaction to work successfully the primers
involved need to be compatible. To be compatible the primers need to have similar
annealing temperatures and also excessive regions of complementarities to avoid
primer-dimers, where they bind to each other and not the template DNA (Butler,
2001).
Unfortunately this attempt thiled to show any viable results as there was no
clear distinction between bands they all blurred together. Therefore the decision was
made to stick with the Ready-to-go RAPD-PCR beads as it produced a much wide-
ranging profile pattern.
A dilution experiment was then set up to determine which concentration of
Herring sperm DNA would produce the best profile pattern so it could be used as a
control after being cut with the restriction enzyme. Figure 3.6 shows the different
dilutions used and which is best in the PCR reaction.
51

0.56 kb
2.32 kb
2.02 kb
Figure 3.6: Agarose gel electrophoresis of PCR amplicons produced using
different dilutions of Herrinu sperm DNA.
1 2 3 4 5 6 7
The experiment was to determine what dilution of 10mg/mi solution of Herring sperm
DNA is required to produce viable amplicons during RAPD-PCR. Lane 2 is the
positive control (K coli) supplied with RAPD-PCR analysis kit and lane 3 is the
negative control. Lane 1 contains MW marker DNA (X Hin dill)
Lanes 4-7 contains different concentrations of Herring sperm DNA:
Lane 4: 1 g4Ll solution.
Lane 5: 100 ng/pi solution
Lane 6: 10 ng/j.tl solution.
Lane 7: 1 ng/p.i solution.
52

The dilution that produced the best profile pattern was between 10 ng4tl and 1
ng4tl of DNA this was shown in lanes 5 and 6. Contaminating DNA is present in the
negative sample with a fragment size of 0.77 kb.
3.4 Comparisons of DNA samples from different species
Alter the control dilution concentration was determined we went on to grind
more samples of bone from different species to compare profile patterns for individual
species. The first sample used for comparison with original pig bone was bovine.
Each different bone sample was extracted using the chelex method and then some of
the samples were treated with ethanol in order to precipitate the DNA in an attempt to
clean up the samples by removing any impurities. This approach was used to see if
this made a difference in the amplicons and their resolution. Each of the differently
treated samples were put in the PCR reaction using both 2 pA of template DNA and 5
pA of template DNA and also using each of the four different primers. This experiment
is represented by the figure 3.7; it was an attempt to study several different factors at
the same time.
53

Figure 3.7: Visualisation of PCR products amplified using several different
factors includin2 different primers, species, amounts of DNA and treatments.
1 2 3 4 5 6 7 8 9 10 11 12 13 14 15 16 17 18
In this experiment a number of different factors were used in PCR amplification in
order to compare results. These different factors included two different species,
different primers, different amounts of template DNA and whether the template DNA
was treated with or without ethanol precipitation. Table 3.3 explains what each
sample is in the different lanes.
54

Table 3.3: Represents the positions of samples visualised in Fi2ure 3.7.
Species Amount of Primer Ethanol DNA precipitation
I E.coli 141 I -
2 Negative 0 1 - control
3 Pig(sus 2 gl I - scrofa)
4 Pig(sus 241 I + scrofa)_______________
5 Pig (sus 5isl 2 - scrofa)_______________
6 Pig(sus 5ptl 2 +
scrofa)_______________ 7 Pig(sus 2xI 3 -
scrofa)_______________ 8 Pig (sus 2ixI 3 +
scrofa)________________ 9 Pig(sus 5tI 4 -
scrofa)________________ 10 Pig(sus 5J.sI 4 +
scrofa)________________ 11 Bovine 241 1 -
(Bos bubalis) 12 Bovine 2sI I +
(Bos bubalis) 13 Bovine 5xl 2 -
_________ (Bos bubalis) 14 Bovine 5sl 2 +
(Bos bubalis) 15 Bovine 2x1 3 -
(Bos bubalis) 16 Bovine 2is1 3 +
_________ (Bos bubalis) 17 Bovine 5,_fl 4 -
(Bos bubalis) 18 Bovine 5 gl 4 +
(Bos bubalis)
55

The bovine DNA showed the best results but the use of ethanol precipitation
was inconsistent in this case. All the different primers were used and it was concluded
that primers 3 & 4 seemed the best candidates for the experiments using all the
different species, as they were the ones that showed viable results.
All the different species that had been gathered were ground using the freezer
mill and extracted again using the modified Chelex method. Each sample was then
quantified using the UV- Vis spectrophotometer because it seemed a more convenient
way of quantifj,'ing the DNA rather than an estimation using the agarose gel method.
Table 3.4 shows the results from spectrophotometric analysis, from which we then
calculated the yield as in previous experiments.
These were results were used to calculate amount of DNA needed to put into
the PCR reaction to produce viable results. Primers 3 & 4 were used for comparison.
Figures 3.8 and 3.9 represent the different species used and the two different primers
used for comparison.
i;i

Table 3.4: Yields of DNA obtained from different species extracted using the
modified Chelex method.
Species Dilution
factor
A230 A260 A280 Cond'
(jtml)
Yield
(ig/0.1 g
of bone)
Pig lOOx 0.442 0.224 0.161 896 358.4
Bovine 50x 0.525 0.286 0.209 572 205.9
Lamb 20x 0.642 0.242 0.169 193.6 69.7
Rabbit 20x 0.400 0.070 0.043 56 17.9
Roe deer 50x 0.611 0.188 0.136 376 142.9
Wild boar 50x 0.557 0.258 0.179 516 206.4
Dog 20x 0.403 0.072 0.046 57.6 23
Unknown
long bone
lOOx 0.503 0.241 0.192 964 173.5
Unknown
scapula
SOx 0.137 0.022 0.018 44 13.2
This table lists the yields of DNA obtained from the different species being analysed
extracted using the modified chelex method.
57

3 kb
2 kb
1 kb
0.56 kb
Figure 3.8.1: Visualisation of PCR products amplified usin2 primer 3.
1 2 3 4 5 •6 7 8 9 10 11 12 13 14
The figure represents a RAPD-PCR profile of a number of different species using
primer 3. Lane 3 is the positive control (K coli) supplied with RAPD-PCR analysis
kit and lane 4 is the negative control.
Lanes 5-13 were the different species used:
Lane 5: Pig Lane 10: Wild boar
Lane 6: Cow Lane 11: Dog
Lane 7: Lamb Lane 12: Unknown long bone
Lane 8: Rabbit Lane 13: Unknown scapula
Lane 9: Roe deer
Lanes 1 & 14 contain 1kb ladders and lane 2 contains MW marker DNA (A Hin dill).

Table 3.5: Different fravnent sizes of PCR amplicons of different species
visualised in Figure 3.8.1.
Species Fragment size (kb)
Pig 0.48, 0.81
Cow 0.25, 0.62
Lamb No amplicons present
Rabbit 0.69
Roe deer No amplicons present
Wild boar 0.58
Dog No amplicons present
Unknown long bone No amplicons present
Unknown scapula 0.25, 0.51
Represents the amplicons present on the gel for each species and theft sizes.
Contamination was present in the negative sample and the band was 0.53 kb in size.
This size does not correspond with any of the other species fragment sizes present on
the gel.
59
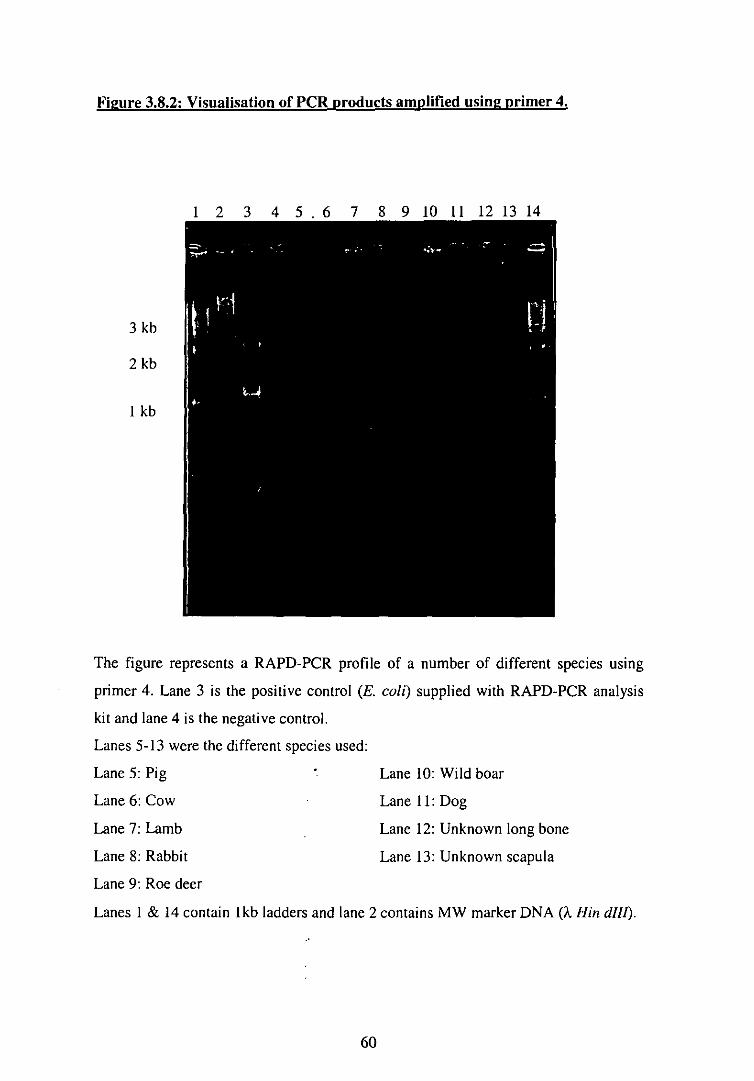
1 kb
3 kh
2 kb
Figure 3.8.2: Visualisation of PCR products amplified using primer 4.
1 2 3 4 5 6 7 R 9 10 II 12 13 14
The figure represents a RAPD-PCR profile of a number of different species using
primer 4. Lane 3 is the positive control (E. coli) supplied with RAPD-PCR analysis
kit and lane 4 is the negative control.
Lanes 5-13 were the different species used:
Lane 5: Pig Lane 10: Wild boar
Lane 6: Cow Lane 11: Dog
Lane 7: Lamb Lane 12: Unknown long bone
Lane 8: Rabbit Lane 13: Unknown scapula
Lane 9: Roe deer
Lanes 1 & 14 contain 1kb ladders and lane 2 contains MW marker DNA (X Hin dill).
ME

Table 3.6: Different fragment sizes of PCR amplicons of different species
visualised in Figure 3.8.2.
Species Fragment size (kb)
Pig 0.45
Cow 0.16
Lamb No amplicons present
Rabbit 0.51, 1.26, 1.38
Roe deer No amplicons present
Wild boar No amplicons present
Dog No amplicons present
Unknown long bone No amplicons present
Unknown scapula 0.14, 0.20, 0.92
Represents the amplicons present for each species and their sizes on the gel image
(Figure 3.8.2).
61
This gel does not have any contaminating DNA present, as well as this there
was no presence of a profile for roe deer and the unknown long bone DNA. There is
slight smearing and the possibility of DNA but no profiles for lamb, wild boar and
dog. This smearing was not evident in the primer 3 experiment.
From these results it is evident from the profiles that they are different,
unfortunately we were unable to veril' what animal the unknown samples were from
our results, only that they were not any of the samples that produced profiles.
3.5 Further RAPD-PCR analysis.
The results obtained in this section were obtained through collaboration with
my colleague Ashley Matchett. It was decided to repeat and expand the RAPD-PCR
profiles of the different species using primers 2,3 and 4. The objective was to obtain a
wider range of RAPD-PCR profiles with a view to comparing these with previous
results. The amplified samples were examined as before on 2 % agarose gels by
electrophoresis, but with a 100 bp ladder as molecular weight markers for more
accurate estimation of amplicon size. The use of these molecular weight markers
facilitated the measurement of the sizes of small fragments. The results are depicted in
figures 3.9.1, 3.9.2 and 3.9.3. The control used was a negative extraction control,
where at the extraction stage no bone powder was added in order to trace
contamination.
62

1000 bp
500 bp
Figure 3.9.1: Reproduction of RAPD-PCR species profiles using primer 2.
1 2 34 5678 9
The figure represents a RAPD-PCR profile of a number of different species using
primer 2. Lane 9 is a negative extraction control.
Lanes 2 - 8 were the different species used:
Lane 2: Unknown long bone Lane 6: Roe deer
Lane 3: Unknown scapula Lane 7: Dog
Lane 4: Wild boar Lane 8: Lamb
Lane 5: Pig
Lane 1 contains 100 bp ladder as a molecular weight marker.
r%]

1000 bp
500 bp
'DhII;!
Figure 3.9.2: Reproduction of RAPD-PCR species profiles using primer 3.
1 2 3 4 5 6 7 8 9
The figure represents a RAPD-PCR profile of a number of different species using
primer 3. Lane 9 is a negative extraction control.
Lanes 2 - 8 were the different species used:
Lane 2: Unknown long bone Lane 6: Roe deer
Lane 3: Unknown scapula Lane 7: Dog
Lane 4: Wild boar Lane 8: Lamb
LaneS: Pig
Lane 1 contains 100 bp ladder as a molecular weight marker.
64

1000 bp
h1IIsI7
100 bp
Figure 3.9.3: Reproduction of RAPD-PCR species profiles using primer 4.
1 2 3 4 5 6 7 8 9
The figure represents a RAPD-PCR profile of a number of different species using
primer 3. Lane 9 is a negative extraction control.
Lanes 2 - 8 were the different species used:
Lane 2: Unknown long bone Lane 6: Roe deer
Lane 3: Unknown scapula Lane 7: Dog
Lane 4: Wild boar . Lane 8: Lamb
Lane 5: Pig
Lane I contains 100 bp ladder as a molecular weight marker.
65

Figures 3.9.1, 3.9.2 and 3.9.3 showed an increased number of bands compared
to the previous gels shown in figures 3.8.1 and 3.8.2. The unknown samples that were
analysed show no similarity to any of the other species profiles on the gel and are they
themselves individual concluding that they came from different species. None of gels
(Figures 3.9.1, 3.9.2 and 3.9.3) show evidence of a profile from Roe deer, which
agrees with the result from the earlier gel (Figures 3.8.1 and 3.8.2). The profile
created for the dog sample on each of the reproduced gels contained fewer bands than
the other species. The profiles of the wild boar and pig are both similar but have
enough differences to be able to distinguish between them. The extraction controls of
each gel seem to be contaminated.

4 DISCUSSION
The general aims of this research were to find an effective method for
extracting DNA from bone and to use this methodology to create RAPD-PCR profiles
of different species. The initial aim was to find an appropriate extraction method, and
the first technique tried involved the use of Chelex resin. At the start of the project,
we were concerned primarily with establishing this method in the laboratory for bone
samples. In response to the initial lack of success, the inclusion of detergent in the
extraction process, and the application of a freezer mill, was tried. Although detergent
increased the yield of DNA, residual amounts of detergent interfered with subsequent
PCR amplification. This was evident from results of the experiments with and without
detergent at the incubation stage of the extraction process (Figure 3.4).
However, the use of the freezer mill to grind the produced good results. The
next step after gaining these results was to look at the incubation time for samples in
extraction buffer; we reduced the amount of time given by the Perkin Elmer handbook
to see if the yield was affected. The results indicated that 2 hours was sufficient time
to gain a suitable yield. Different manuffictured kits were used for comparisons and to
check suitability but although they were effective the decision was made to stick with
Chelex method, as it was more adaptable.
The next stage was to carry out PCR analysis of the DNA solutions extracted
from bone samples. RAPD-PCR was used as it was a completely random reaction and
no primer design was required, enabling us to complete more research in the allotted
time. Researchers including Lee et aL (1994) and Koh et aL (1998) have used this
method to distinguish different species. Lee a aL (1994) had also used bone
fragments and so it was decided this was an appropriate route to take. This method of
PCR was, like any other, very sensitive. Contamination of the negative was apparent.
Table 4.1 represents different precautions that can be taken to avoid contamination
issues.
67

Contamination sources Precautions taken
Handling sample Gloves to be used while handling any
sample.
Contamination of sample during Wear protective clothing e.g. lab coat,
extraction. glasses, gloves, etc.
Keep extraction area completely separate
from PCR area.
Make sure reagents are changed regularly
and new tips for every stage of reaction.
Positive and negative extraction controls.
Contamination of sample during PCR. Wear protective clothing e.g. lab coat,
glasses, gloves, etc.
Keep PCR area completely separate from
extraction area.
Make sure reagents are changed regularly
and new tips for every stage of reaction.
Positive and negative PCR controls.
Dedicated equipment for the PCR
process.
Daily irradiation of equipment by UV
light.
Table 4.1: The table shows diflèrent stages of the process at which a sample can be
contaminated and precaution that can be taken to avoid it happening. This is an
integral part of dealing with ancient DNA samples as many contain low copy number
(LCN) DNA and so will be out-competed with by recent contaminating DNA.
Information taken from Handt et aL (1994).
68

The precautions described in Table 4.1 were taken, with the exception that,
due to lack of space, we were unable to put a lot of distance between each working
area, although all PCR reactions took place in a UV hood, which was irradiated after
each use. With the experience I have gained through this research more stringent
controls would be put in place especially if dealing with ancient remains. In order to
control the process properly a human RAPD-PCR profile would need to be done for
extraction controls but also to help distinguish between bone fragments.
However, research into Ready-to-gotm RAPD analysis beads has revealed that
bands and/or smears in negative control are normal with RAPD analysis (Williams et
al. 1990). These bands are thought to arise from small amounts of DNA
contamination purified with the polymerases, and these are not apparent if there is
sufficient template DNA from the sample under test to out-compete the contaminating
DNA that may be present. This observation fits with our experience in these
experiments, as bands equivalent to those seen in the negative controls are not
observed when template DNA of good quality is added to the PCR reaction.
The results in Figure 3.6 support the idea of the negative controls showing
bands due small amounts of DNA contamination in the polymerases. Lane 4
contained a 1 j.tg4tl solution of herring sperm DNA and showed no bands, leading to
the belief that at this concentration there was too much template DNA which
overloaded the DNA polymerase and therefore was unable to amphuij. Lanes 5 and 6
produced identical bands therefore a concentration of between 100 ng4tl and 10 ng/l
was sufficient to produce a species profile. Lane 7 had only a 1 ng4.tl of DNA solution
and although there are bands, they do match any of the bands in lanes 5 and 6. This
lead to the belief that there is insufficient template DNA to amplify so any extraneous
contaminating DNA has been amplified in its place.
The experiment to compare the Ready-To-Gotm RAPD Analysis kit and the
Ready-To-GC PCR Analysis kit confirmed that the action of both Stofiël fragment
and Amplitaq® DNA polymerase contained in the RAPD analysis kit, as opposed to
just Taq DNA polymerase alone, produced smaller amplicons, thus permitting greater
distinction between species. The Stofi'el fragment itself is more specific and efficient
during the PCR reaction (Varadaraj and Skinner, 1994) than Amplitaq ® DNA
polymerase but the combination of the two works better than simply Taq DNA
polymerase. It was therefore decided to forego the possibility of multiplexing using
Me

the Ready-to-go system and multiple primer pairs, and to use the RAPD products
solely.
When choosing the species to be included in this project for analysis, choices
were primarily governed by the availability of the different animals. However, given
the potential application of this approach to archaeological excavations in the UK, it
was important to select species indigenous to these islands. 4 out of the 9 samples of
bone were fresh and so there was no need to cheek the suitability of the bones and the
condition they were in. The rabbit samples supplied from an excavation in North
Wales were in good condition and had no pitting and the surface was not soft and
brittle. Researchers have shown that bones have to be in a suitable condition or the
likeliness of extracting good quality DNA is poor (Hagelberg et aL 1991 and Haynes
et aL 2002). With the two unknown bone samples, the scapula was in good condition
whereas the long bone was pitted near the diaphysis and was slightly softer. The
condition of these two bones were thought to have played an integral part in whether
the DNA extracted from the samples was viable for PCR amplification as initially the
unknown long bone produced no results (Figures 3.8.1 and 3.8.2). Further research
showed that in fict profiles could be produced from DNA extracted from this sample
(Figures 3.9.1, 3.9.2 and 3.9.3). CarefUl choice of sample is still needed in order to
reduce the probability of failure due to poor quality DNA.
The unknown long bone as described previously was not in excellent
condition, also when the sample was extracted the supernatant was discoloured, being
orange/brown in appearance. This colouration could be due to humic and fUlvic acids
in the soil leaching into the sample and these substances are known PCR inhibitors,
which could have contributed to the initial lack of results (Burger et aL 1999, Paabo et
al. 1989, Paabo, 1989 and Hagelberg et aL 1991).
The final amplified products of each species obtained using the two different
primers pairs 3 and 4 were electrophoresed on a 2 % agarose gel but not all samples
produced a RAPD profile. The four bone samples that consistently showed no results
after electrophoresis were lamb, roe deer, dog and the unknown long bone (Figures
3.8.1 and 3.8.2). The dog sample was the only sample that was teeth not bone; there
were very few numbers of teeth and they were very small in size so it was thought
that there was possilly that not enough DNA extracted or it was highly fragmented
and unable to amplify. The fl.irther RAPD-PCR analysis showed that a profile was
achievable from both dog, Iamb and as mentioned previously the unknown long bone
thl

but roe deer sample still produced no results (Figures 3.9.1, 3.9.2 and 3.9.3). It is
unclear why the roe deer samples did not produce any viable results.
Mother problem could have been that, because this method makes use of
random primers, the annealing temperature is slightly lower at 35-39 °C compared to
50-55 °C during amplification (Bowditch a al., 1994). This lower temperature then
allows for non-specific binding to the DNA, which then may result in amplified
products not being reproducible (Hadrys et al., 1992 and Ellsworth et aL, 1993).
Despite this several researchers have shown that if special care is taken and a
standardised protocol is followed then reproducible bands are achievable (Hadiys et
aL, 1992, Bowditch et aL, 1994, and Rothuizen and Van Wolferen, 1994). Any non-
reproducible bands tend to be flint and can be dismissed as genetic markers (Hadrys
et al., 1992).
In collaboration with my colleague Ashley Matchett the final species proffles
were repeated using primers pain 2, 3 and 4. These repeated results (Figures 3.9.1,
3.9.2 and 3.9.3) showed profiles with higher numbers of bands, which made them
easily distinguishable from the others. Although the previous results (Figures 3.8 and
3.9) showed differences in the number and sizes of amplicons for each species, the
greater number of bands in the later sets of results provided far greater discrimination.
The Roe deer sample again produced no results but the dog and unknown scapula that
had previously shown no results now produced profiles. Wild boar and pig profiles,
although diflrent, still shared at least two bands of the same size, so it could be seen
they are closely related but are still different. This test then is better than the method
chosen by Koh a aL, 1997, as it cannot distinguish between these closely related
species. It also provides an indication that the method may be suitable for
distinguishing between different breeds of domestic animals, and possibility that is
worth investigating given the prevalence of remains from domestic breeds at
archaeological sites.
The samples of unknown origin produced RAPD profiles (Figures 3.9.1, 3.9.2
and 3.9.3). These profiles differed from each other, showing that the bones were from
two different species, but since these two profiles did not match those of the known,
the species origin of these bones remains unknown. However, it can be concluded that
"a'

they do not belong to a pig, wild boar, dog or lamb. The fragment sizes of each profile
using the different primers are represented in Table 4.2.
The extraction controls were contaminated but as this phenomenon is well
documented (Williams ci aL 1990) and the bands were not apparent in sample lanes
on gels, this is not considered a major problem in interpreting results. Results, in the
form of the sizes of amplicons produced for each species and bone are presented in
Table 4.2 as a summary.
72

Species Primer 2 Primer 3 Primer 4
(fragment sizes in (fragment sizes in (fragment sizes in
kb) kb) kb)
Wild boar 0.92, 0.85, 0.74, 0.95, 0.89, 0.62, 0.50, 0.44, 0.37,
0.55, 0.50, 0.44, 0.56, 0.42, 0.37, 0.31, 0.24, 0.16
0.38, 0.32 0.26
Pig 1.30, 1.21, 0.95, 0.89, 0.80, 0.62, 0.98, 0.95, 0.82,
0.82, 0.74, 0.59, 0.43, 0.38, 0.26 0.62, 0.50, 0.49,
0.54, 0.44, 0.40, 0.44, 0.37, 0.31
0.32
Roe deer No profile No profile No profile
Dog 0.78, 0.70, 0.36 1.17, 0.47 0.49, 0.44, 0.29
Lamb 1.41, 0.97, 0.79, 0.60, 0.52, 0.30 0.99, 0.65, 0.62,
0.70, 0.67, 0.43, 0.50, 0.48, 0.44,
0.36, 0.28 0.40
Unknown long bone 0.82, 0.69, 0.40, 0.70, 0.54, 0.24 0.88, 0.67, 0.59,
0.29, 0.19 0.51, 0.30, 0.16
Unknown scapula 0.60, 0.50 1.02, 0.43 1.00, 0.96, 0.86,
0.72, 0.62, 0.52,
0.49, 0.43, 0.38,
0.05
Extraction control 1.15, 0.92, 0.67, 0.73, 0.24, 0.08 1.52, 0.99, 0.65,
0.54 0.48, 0.37, 0.16
Table 4.2: The table shows the diflërent species and primers used to create the
RAPD-PCR profiles.
73

This research indicates that this is a possible method for the initial species
identification of bone fragments found at archaeological sites. It would be essential to
create as wide a library of profiles as possible, covering all relevant indigenous
species, in order that the method could be used a presumptive test to help identifr
most unknown samples. It has shown that the method can distinguish between closely
related species where some methods have filled (Koh et at, 1997).
Other methods could be used to confirm the results of the RAPD-PCR
procedure and to veri' species identification. For instance, PCR-RFLP using primers
specific for the cytochrome b gene (Newman ci at, 2000 and Wetton ci at, 2002)
have been used in this respect and mitochondrial DNA (mt DNA) sequencing has
been used by a number of researchers where a primer is designed to copy a specified
region for a particular species (Barnes et at, 2000, Colgan ci at, 2001, Cooper ci at,
1992, Green wood et at, 2001, Hoss ci at, 1996 [1], Janczewski et aL, 1992 and
Loreille ci aL, 1997).
Not only could RAPD-PCR identilS' unknown species, but it may also be used
to identif' diflèrent genetic variations within species (Cooper, 2000) or possibly even
different breeds.
RAPD-PCR could also be used not only for bone fragments but possibly
ancient plant remains, in order to identif3' species and study theft distribution across
different continents and civilisations. Work carried out in this area, but using different
PCR methods, has been conducted by researchers like Brown, (1999). Again, RAPD-
PCR could be used as a quick initial that would lead to further in depth analysis.
There is a lot of scope for this research to be taken further, and a database of
difibrent species using the diflërent primers should be set up as a reference tool for
other researchers. This should include samples from breeds of domestic species as
well as wild and domestic species indigenous to the UK.
74

Aktipis, S. (1997). DNA I: Structure and conformation. In Devlin, T. M. (ed.). In
Textbook of biochemistry with clinical correlations. (4th edition). New York, Wiley-
Liss, mc, pg 564-618.
AmpFeSTR® SGM plus"4. PCR Amplification kit: Users manual. Perkin Elmer
Biosystems (2002).
Bailey, J. F., Richards, M. B., Macaulay, V. A., Colson, I. B., James I. 1., Bradley, D.
G., Hedges, R. E. M. and Sykes, B. C. (1996). Ancient DNA suggests a recent
expansion of European cattle from a diverse wild progenitor species. Proceedings of
the Royal Society of London Series B. Biological Sciences. 23: 1467-1473.
Barnes, I., Young, J. P. W. and Dobney, K. M. (2000). DNA-based Identification of
goose species from two archaeological sites in Lincoinshire. Journal of
Archaeological Science. 7: 91400.
Boles, T. C., Snow, C. C. and Stover, E. (1995). Forensic DNA testing on skeletal
remains from mass graves: A pilot project in Guatemala. Journal of Forensic
Sciences. 40: 349-355.
Bowditch, B. M., Aibright, D. 0., Williams, J. K. and Braun, M. J. (1994). Use of
randomly amplified polymorphic DNA markers in comparative genetic studies.
Methods in Enzymology. 4: 294-309.
Boyer, R. (2000). Modern experimental Biochemistry. (3"' edition). San Francisco.
Benjamin/Cummings.
Brown, T. A (1999). How ancient DNA may help in understanding the origin and
spread of agriculture. Proceedings of the Royal Society of London Series B. : 89-
98.
75

Butler, J. M. (2001). Forensic DNA typing: Biology and technology behind STR
markers. London. Academic Press.
Burger, J., Hummel, S., Herrmann, B. and Henke, W. (1999) DNA preservation: A
microsatellite-DNA study on ancient skeletal remains. Electrophoresis. 20: 1722-
1728.
Cano, R. J., Poinar, H. N., Pieniazek, N. J., Acra, A., and Poinar, G. 0. (1993).
Amplification and sequencing of DNA from a 120-135-million-year-old weevil.
Nature. : 536-538.
Cattaneo, C., Smillie, D.M., (ielsthorpe, K. Piccinini, A., Gelsthorpe, A. R. and
Sokol, R. J. (1995). A simple method for extracting DNA from old skeletal material.
Forensic Science InternationaL 74: 167-174
Cattaneo, C., Craig, 0. E., James, N. T. and Sokol, R. J. (1997). Comparison of Three
DNA extraction methods on bone and blood stains up to 43 years old and
amplification of three different gene sequences. Journal of Forensic Science. 42(6):
1126-1135.
Chaney, S. G. (1997). Principles of nutrition II: micronutrients. In Devlin, T. M. (ed.).
In Textbook of biochemis try with clinical correlations. (4th edition). New York,
Wiley-Liss, mc, pg
Cipollaro, M., Di Bemardo, G., Forte, A., Galano, G., De Masi, L., Galderisi, U.,
Guarino, F. M., Angelini, F. and Cascino, A. (1999). Histological analysis and ancient
DNA amplification of Human bone remains found in Caius Julius Polybuis house in
Pompeii. Croatian Medical JournaL 40(3): 392-397.
Colgan, S., O'Brien, L., Maher, M., Shilton, N., McDonnell, K. and Ward, S. (2001).
Development of a DNA-based assay for species identification in meat and bone meal.
Food Research InternationaL 40: 392-397.
76

Colson, I. B., Richards, M. B., Bailey, J. F., Sykes, B. C. and Hedges, R. E. M.
(1997). DNA analysis of seven human skeletons excavated from the Terp of
Wijnaldum. Journal of Archaeology Science. 4: 911-917.
Cooper, A. Mourer-Chauvire, C., Chambers, G. K., Von Hacseler, A., Wilson, A. C.
and Paabo, S. (1992). Independent origins of New Zealand moas and kiwis.
Proceedings of the NationalAcademy of Science USA. $2: 8741-8744.
Cooper, M. L. (2000). Random amplified polymorphic DNA analysis of southern
brown bandicoot (Isoodon obesulus) populations in Western Australia reveals genetic
diflérentiation related to environmental variables. Molecular Ecology. 2: 469-479.
Decorte, R. and Cassiman, J-J. (1993). Forensic medicine and the Polymerase Chain
Reaction technique. Journal of Medical Genetics. 30: 625-633.
Ellsworth, D. L., Rittenhouse, K. D. and Honeycutt, R. L. (1993). Artifäctual
variation in random amplified polymorphic DNA banding patterns. Biotechniques. 14:
2 14-2 17.
Faerman, M., Fion, D., Kahila, 0., Greenblatt, C. L., Smith, P. and Oppenheim, A.
(1995). Sex identification of archaeological human remains based on amplification of
the X and Y amelogenin alleles. Gene. 1.67: 327-332.
Fisher, D. L., Holland, M. M., Mitchell, L., Sledzik, P. 5., Webb Wilcox, A.,
Wadhams, M. and Weedn, V. W. (1993). Extraction, evaluation and amplification of
DNA from decalcified and unclecalcified United States Civil war bone. Journal of
Forensic Sciences. 38: 60-68.
Gill, P., Ivanov, P. L., Kimpton, C., Piercy, R., Benson, N., Tally, G., Evett, I.,
Hagelberg, E. and Sullivan K. (1994). Identification of the remains of the Romanov
family by DNA analysis. Nature Genetics. : 130-135.
77

Greenwood, A. D., Castresana, J., Feldmaier-Fuchs, G. and Paabo, S. (2001). A
molecular phylogeny of two extinct sloths. Molecular Phylogenetics and Evolution.
.11(1): 94-103.
Gunn, C. (1992). Bones and joints: A guide for students. (2" edition). London,
Longman group Ltd.
Hadrys, H., Balick M. and Schierwater, B. (1992). Applications of random amplified
polymorphic DNA (RAPD) in molecular ecology. Molecular Ecology. 1: 55-63.
Hagelberg, E. and Sykes, B. (1989). Ancient bone DNA amplified. Nature. 342: 485.
Hagelberg, E. and Clegg, J.B. (1991). Isolation and characterization of DNA from
archaeological bone. Proceedings of the Royal Society of London B. 244: 45-50.
Hagelberg, B., Bell, L. S., Allen, T., Boyde, A., Jones, S. J. and Clegg, J. B. (1991).
Analysis of ancient bone DNA: techniques and applications. Philosophical
Transactions of the Royal Society of London B. 33: 399-407.
Handt, 0., HOss, M., Krings, M. and PaAbo, S. (1994). Ancient DNA: methodological
challenges. Experentia. : 524-529.
Handt, 0., Krings, M., Ward, R. H. and PaAbo, S. (1996). The retrieval of ancient
human DNA sequences. American Journal of Human Genetics. : 368-376.
Haynes, S., Searle, J. B., Bretman, A. and Dobney, K. M. (2002). Bone preservation
and ancient DNA: The application of screening methods for predicting DNA survival.
Journal ofArchaeological Science. 29: 585-592.
Hofreiter, M., Serre, D., Poinar, H. N., Kuch, M. and Paabo, S. (2001). Ancient DNA.
Nature Genetics. 2: 353-359.
Hoss, M. and Pflbo, S. (1993). DNA extraction from Pleistocene bones by a silica-
based purification. Nucleic Acids Research. 21(6): 3913-3914.
78

Hoss, M., [1] Dilhing, A., Currant, A. and PaAbo, S. (1996). Molecular phylogeny of
the extinct ground sloth Mylodon darwiniL Proceedings of the National Academy of
Science USA. 93: 181-185.
Hoss, M., [2] Jarunga, J., Zastawny, T. H., Dizdaroglu, M. and Paabo, S. (1996).
DNA damage and DNA sequence retrieval from ancient tissues. Nucleic Acids
Research. 24(7): 1304-1307.
Janczewski, D. N., Yuhki, N., Gilbert, D. A., Jefferson, G. T. and O'Brien, S. J.
(1992). Molecular phylogenetic inference from saber-toothed cat fossils of Rancho La
Brea. Proceedings of the NationalAcademy of Science USA. $: 9769-9773.
Kalmár, T., Bachrati, C. Z., Marcsik, A. and Rasko, I. (2000). A simple and efficient
method for PCR ampliflable DNA extraction from ancient bones. Nucleic Acids
Research. 28 (12): E67-e67.
Koh, M. C., Lini, C. H., Chua, S. B., Chew, S. T. and Phang, S. T. W. (1998).
Random Amplified Polymorphic DNA (RAPD) fingerprints for identification of red
meat animal species. Meat Science. 4 (3/4): 275-285.
Lassen, C., Hummel, S. and Herrmann, B. (1994). Comparison of DNA extraction
and amplification from ancient human bone and mummified soft tissue. International
Journal of Legal Medicine. 107: 152-155.
Lee, J. C-I. and Chang, J-G. (1994). Random Amplified Polymorphic DNA
polymerase chain reaction (RAPD PCR) fingerprints in forensic species identification.
Forensic Science InternationaL 67: 103-107.
Lee, H. C., Ruano, G., Pagliaro, E. M., Berka, IC M. and Gaensslen, R. B. (1991).
DNA analysis in human bone and other specimens of forensic interest: PCR typing
and testing. Journal of the Forensic Science Society. fl (2): 213-216.
79

Leonard, J. A., Wayne, R. K. and Cooper, A. (1999). Population genetics of Ice Age
brown bears. Proceedings of the National Academy of Science USA. 22 (4): 1651-
1654.
Lindahl, T. (1993). Instability and decay of the primary structure of DNA. Nature.
362: 709-715.
Litwack, G. and Schmidt, T. G. (1997). Biochemistry of hormones I: polypeptide
hormones. In Devlin, T. M. (ed.). In Textbook of biochemistry with clinical
correlations. (4 th edition). New York, Wiley-Liss, mc, pg.
Loreille, 0., Vigne, J-D., Hardy, C., Callou, C., Treinen-Claustre, F., Dennebouy, N.
and Monnerot, M. (1997). First distinction of sheep and goat archaeological bones by
means of their fossil mtDNA. Journal ofArchaeological Science. 24: 33-37.
Machugh, D. E., Edwards, C. J., Bailey, J. F., Bancroft, D. R. and Bradley, D. G.
(2000). The extraction and analysis of ancient DNA from bone and teeth: a survey of
current methodologies. Ancient Biomolecules. a: 81-102.
Meyer, E., Wiese, M., Bruchhaus, H., Classen, M. and Klein, A. (2000). Extraction
and amplification of authentic DNA from ancient human remains. Forensic Science
internationaL 113: 87-90.
Newman, M. E., Parboosingh, J. S., Bridge, P.J. and Ceri, H. (2002). Identification of
archaeological animal bone by PCRIDNA analysis. Journal of Archaeological
Science. 9: 77-84.
O'Connor, T. (2000). The archaeology of animal bones. Stroud, Gloucestershire,
Sutton Publishing Ltd.
O'Rourke, D. H. Hayes, M. G. and Carlyle, S. W. (2000). Ancient DNA studies in
physical anthropology. Annual Review ofAnthropology. 22: 2 17-242.

PaAbo, S., Gifford, J. A. and Wilson, A. C. (1988). Mitochondrial DNA sequences
from a 7000-year old brain. Nucleic Acids Research. Th (20): 9775-9787.
PaAbo, S., Higuchi, R. G. and Wilson, A. C. (1989). Ancient DNA and the
Polymerase Chain Reaction. The Journal of Biological Chemistry. 264 (17): 9709-
97 12.
PaAbo, S. (1989). Ancient DNA: Extraction, characterization, molecular cloning, and
enzymatic amplification. Proceedings of the National Academy of Science USA. $:
1939-1943.
Partis, L., Croan, D., Guo, Z., Clark, R., Coidham, T. and Murby, J. (2000).
Evaluation of a DNA fingerprinting method for determining the species origin of
meats. Meat Science. 54: 369-376.
Petrishchev, V. N., Kutueva, A. B. and Rychkov, Y. G. (1993). A simple and efficient
method for the extraction of DNA from excavated bones for subsequent amplification
by the Polymerase Chain Reaction. Genetika. 2 (4): 690-693.
Poinar, H. N., Höss, M., Bat, J. L. and PaAbo, S. (1996). Amino acid racemization
and the preservation of ancient DNA. Science. 222: 864-866.
Prado, V. F., Castro, A. K. F., Oliveira, C. L., Souza, K. T. and Pena, S. D. J. (1997).
Extraction of DNA from human skeletal remains: practical applications in forensic
science. Genetic Analysis: Biomolecular Engineering. 14: 41-44.
Primorac, D., Andelinovic, S., Deflnis-Gojanovic, M., Drmic, I., Rezic, B., Baden, M.
M., Kennedy, M. A., Schanfleld, M. S., Skakel, S. B. and Lee, H. C. (1996).
Identification of war victims from mass graves in Croatia, Bosnia, and Herzegovina
by use of standard forensic methods and DNA typing. Journal of Forensic Science. 41.
(5)i. 891-894.
Richards, M. B. and Sykes B. C. (1995). Authenticating DNA extracted from ancient
skeletal remains. Journal ofArchaeological Science. 22: 291-299.
81

Rothuizen, J. and Van Wolferen, M. (1994). Randomly amplified DNA
polymorphisms in dogs are reproducible and display Mendelian transmission. Animal
Genetics. : 13-18.
Sanger, F., Coulson, A. It, Hong, G. F., Hill, D. F. and Peterson, G.B. (1982).
Nucleotide sequence of bacteriophage X DNA. Journal of Molecular Biology. j2:
729-773.
Schnee-Griese, J. and Linder, S. (1994). DNA extraction for PCR: phenol/chloroform
vs. Chelex - A comparative study.
Schultz, M. (1997). Microscopic structure of bone. In Haugland, W. D. and Sorg, M.
H (eds.). In Forensic taphonomy: The post-mortem fate of human remains. USA,
CRC press, ppl87-l99.
Steele, D. G. and Bramblett, C. A. (1997). Bone biology. In The anatomy and biology
of the human skeleton. Texas, A & M uni press, pplO-I9.
Stone, A. C. and Stoneking, M. (1993). Ancient DNA from a Pre-Columbian
Amerindian population. Journal of Physical Anthropology. 92: 463-471.
Stoneking, M. (1995). Ancient DNA: How do you know when you have it and what
can you do with it? . American Journal of Human Genetics. 57: 1259-1262.
Stryer, L. (1995). Biochemistry. Fourth Edition. Edited by W H Freeman and
Company. New York.
Varadaraj, K. and Skinner, D.M. (1994). Denaturants or cosolvents improve the
specificity of PCR amplification of a G + C rich DNA using genetically engineered
DNA polymerases. Gene. 1.4: 1-5.
82

Vass, A. A. (2001). Beyond the grave - understanding human decomposition.
Microbiology today. : 190-192.
Walsh, P. S., Metzger, D. A. and Higuchi, R. (1991). Chelex® 100 as a medium for
simple extraction of DNA for PCR-based typing from forensic material.
Biotechniques. IQ (4): 506-513.
Watson, J. D., Witkowski, J., Oilman, M. and Zoller, M. (1992). Recombinant DNA.
Second Edition. Edited by W H Freeman and Company. New York. Chapter 6, 79-98.
Wetton, J. H., Tsang, C. S. F., Roney, C. A. and Spriggs, A. C. (2002). An extremely
sensitive species-specific ARMS PCR test for the presence of tiger bone DNA.
Forensic Science InternationaL 126: 137-144.
White, T. D. (2000). Bone Biology in Human Osteology. San Diego, Academic press,
ppl S-34.
Williams, J. G. K., Kubelik, A. It, Livak, K. J., Ralaiski, J. A. and Tingey, S. V.
(1990). DNA polymorphisms amplified by arbitraiy primers are useful as genetic
markers. Nucleic Acids Research 18 (22): 6531-6535.
Yang, D. Y., Eng, B., Waye, J. S., Dudar, J. C. and Saunders, S. R. (1998). Technical
note: Improved DNA extraction from ancient bones using silica-based spin columns.
American Journal of PhysicalAnthropology. j: 539-543.
83