Embed Size (px)
Citation preview

ODV/Aug2000 1
The Optimised Deprival Value Methodology and the Objectives of Utility Sector Reform in New Zealand 1
Geoff Bertram Victoria University of Wellington
Abstract
The key problems with ODV are conceptual. “Deprival” is not a cost concept and cannot be used for ratebase purposes without circularity. In practical terms “ODV pricing” means the highest level of monopolistic rent extraction from consumers that could be theoretically possible in a fully contestable market. That is, it represents an attempt to estimate the limit price under contestability. However, in the presence of large irreversible entry costs with highly specific assets, the relevance of contestability theory is unclear. In a competitive market situation, where there should be no need for price regulation, ODV is one of the quantitative techniques which the management of an incumbent firm might use to evaluate the firm’s exposure to competitive new entry. This was its original purpose in the hands of accounting theorists such as Baxter.
The economic “value of capital” is simply the DCF of expected earnings from an asset, and this determines deprival value. Under monopoly, this means that the value of capital depends on the constraints subject to which the firm pursues its objective of profit maximisation over time. The two relevant constraints are: the demand curve, and the regulatory threshold if any. The value of capital in the above sense has two components: opportunity cost (disposal value) plus the value of any barriers to entry that enable the firm to recover more than a competitive rate of return on the opportunity cost of its sunk investments. Under competition with nonlumpy assets, opportunity cost is the sole component of value. Under pure natural monopoly with lumpy assets, opportunity cost is generally a very small part of the value and the capitalized rents associated with the barriers to entry allowed by the regulator become crucial.
The regulator’s problem is to choose the optimal level of constraint on the firm’s profits, from which will follow the economic value of the firm’s assets. The traditional solution is to define a breakeven threshold that is consistent with the financial viability of the firm on a goingforward basis.
A regulator which allows the ratebase to rise above the originalcost standard is legitimating a transfer of wealth from consumers to the monopolist. There may be economic justifications for such transfers but if so they need to be spelt out.
The New Zealand Government has allowed upward revaluation of ratebases from historic cost to ODRC in electricity lines businesses with no compensatory adjustment in favour of consumers. By doing so it has increased the deprival value of those network utilities by a wealth transfer from consumers. The resulting opportunities for rentseeking and capital gain have been important drivers on the behaviour of these and other utility sectors. A return to conventional regulatory policy would mean either a writedown of asset values of sunk investments from their ODV levels, with a rebate of excess charges obtained over the past decade; or a onceforall lumpsum payment to consumers equal to the present value of asset revaluations taken to date. This would be simply a reversal of a prior expropriation of consumers’ wealth by utility owners. Such retrospective reappropriation of
1 This paper is part of my programme of research while on leave from Victoria University. An earlier version was presented to the annual conference of the New Zealand association of economists in July 2000.

ODV/Aug2000 2
transferred wealth is a necessary part of the design of a subgameperfect lighthanded regulatory regime.
Going forward, a pricecap regime with continual “optimisation” of a regulatory ratebase is inconsistent with financial sustainability because “WACC on ODV” does not provide, ex ante, grounds for an investor to expect to recover the competitive cost of capital committed except in the special case where expected technical progress is zero. With technical progress expected, the accelerated economic depreciation of the asset value due to ratebase optimisation must be compensated for by an ex ante premium on either the allowed ratebase or the allowed rate of return if investment is to proceed at optimal levels. Without a premium equal to the option value of deferring investment, the regulated monopolist will underinvest due to the option value of deferrdeferring investment decisions.
The ODV methodology as applied to date in New Zealand has simultaneously transferred large windfalls to the owners of monopoly utilities on their sunk investments, while incentivising them to underinvest in future – effectively the worst of both worlds from the point of view of optimal regulation.
1. Introduction
Governmentdriven restructuring of New Zealand’s utility industries has now been underway for a decade. Two important components of the reform package have been the institutional separation of natural monopoly operations from activities which are considered to be workably competitive or contestable; and the official legitimation of a particular asset valuation methodology known as “Optimised Deprival Value”, which has come close to becoming the new de facto ratebase for utility regulation in both New Zealand and Australia 2 .
Use of the ODV valuation procedure began in 1991 in the electricity sector when the stateowned electricity monopoly, Electricity Corporation of New Zealand, divested its transmission arm to a new stateowned corporation, TransPower. The book value of the new entity was set at ODV and transmission charges were fixed accordingly at a level probably two to three times higher than would have resulted from use of an historiccost ratebase. 3 This use of a replacementcost ratebase pricing methodology to secure a windfall gain for the Government from its electricity lines business set a precedent for subsequent profittaking by other utility operators in both the public and private sectors, as formerlystateowned utility businesses were corporatised and often privatized, and their prices deregulated.
Subsequently the use of ODV asset valuations for purposes of information disclosure was made mandatory for electricity lines businesses 4 and the resulting valuations were used by Government officials as the denominator on which rates of return were estimated for the purpose of determining whether excess (monopoly) profits were being captured by these naturalmonopoly businesses. Other utility sectors – in
2 See Commerce Commission 2002 Chapter 6 and Chapter 8 pp.7073. 3 Bertram et al 1991 Chapter 9; Gale and McWha 2000. 4 Electricity Industry (Information Disclosure) Regulations 1994.

ODV/Aug2000 3
particular gas pipelines, airports, and ports – have moved towards use of replacement cost asset valuations for pricing purposes, following the example set by electricity.
“Deprival value” is a concept from insurance. It means the amount of compensation that an asset owner would have to receive to leave them indifferent to loss of the asset. For a utility operator, such indifference would be assured by being able to continue to provide the existing market with an equivalent flow of services, using the most economically efficient technology for the purpose and a corresponding inventory of capital assets with the same remaining life as the actual assets. Hence the ODV valuation methodology begins by identifying an optimal inventory of assets, valued at their current cost and then notionally depreciated to match the remaining life of the existing assets.
Provided that a final price based on the resulting ratebase is not greater than the market will bear, this optimized depreciated replacement cost (ODRC) is entered as a asset value. If the price of services provided by any asset cannot be sustained at this level, then the expected maximum sustainable cashflow is discounted to a present value (the “economic value” of the relevant asset, EV) and this figure is substituted for the ODRC.
The economic interpretation of the resulting valuation of a utility’s fixed assets is not at all clear, and neither Australian nor New Zealand policymakers or regulators have yet set out a principled justification for the optimizedreplacementcost approach. Some of the difficulty lies in the procedures used to calculate the valuation, and some at the basic conceptual level.
The procedure of estimating an ODV valuation requires the exercise of subjective judgement on a wide range of issues. In some of these areas, in the case of electricity lines businesses, key judgements have been made by policymakers and imposed on the industry by an increasingly detailed and prescriptive “handbooks”. Examples are the use of a “brownfields” rather than “greenfields” hypothetical scenario for deciding what services the notional replacement assets should provide and how far the optimization process should go; the exclusion of land easements that are required for erection and operation of power lines; and the production of a detailed price list to place values on individual items of equipment for the purpose of information disclosure. In other areas the consultants hired by utility firms to produce ODV valuations are largely free to use their own judgement – for example, in estimating remaining asset lives and hence the extent of depreciation that is assumed, in notionally reconfiguring various network segments, and in refraining from optimisation in areas where it might or might not be justified.
Both the structural separation of natural monopoly lines businesses and the 1994 information disclosure regulations were ostensibly motivated by the desire of Government to achieve transparency over the issue of whether market power has been misused (or more specifically, misused to an extent which could justify the reimposition of price regulation).

ODV/Aug2000 4
Such misuse of market power could potentially take two main forms: crosssubsidies financed from the profits of a network business to give competitive advantage to a verticallyintegrated retail affiliate, with the aim of excluding competitors from the downstream market; and the taking of excess profits by the lines business itself. Both such abuses of market power should be able to be identified, and hence sanctioned (so the official story went), if a rigorous information disclosure regime was in place which would force networks to reveal details of their physical and financial performance.
New Zealand’s decision to rely in the first instance on information disclosure rather than traditional price regulation was never well explained on the public record, although some theoretical debate no doubt took place within Government and industry circles. Public statements explaining “lighthanded regulation” usually concentrated on listing the alleged deficiencies of alternative forms of regulation, rather than on demonstrating the workability of the lighthanded regime. Typical of the claims in official documents of the earlymid 1990s are the following:
Information disclosure is the alternative to price control which has the least distortionary effect on the use of resources by firms … Potential competitors can use the information to ensure that they are given access to essential facilities … at reasonable prices. 5
[The Electricity Information Disclosure Regulations are aimed] to make transparent the performance of electricity businesses with market power, and to facilitate negotiations by customers with these businesses and recourse to the provisions of the Commerce Act. 6
Information disclosure is the alternative to price control which has the least distortionary effect on the use of resources by the firm… Potential competitors can use the information to ensure that they are given access to essential facilities … at reasonable prices. 7
If the conditions for access being required by the [facility] owner are too onerous (and are anticompetitive in intent) than an appropriately structured information disclosure regime will provide sufficient information to enable the discriminated party to take action under the Commerce Act… 8
5 Officials Coordinating Committee, Review of the Regulation of the Natural Gas Industry: Report to the State Sector CommitteeMarch 1991, p.5.
6 Ministry of Commerce, Discussion Paper on Proposed Amendments to the Electricity (Information Disclosure) Regulations 1994, October 1996, p.i.
7 Officials Coordinating Committee 1991 p.5. 8 Officials Coordinating Committee 1991 p.25 paragraph 73.

ODV/Aug2000 5
Both the Industrial Organisation literature and experience in other regulatory jurisdictions 9 clearly identify four central problems which a lighthanded regime of this sort would have had to overcome if it was to be effective in its ostensible goals:
• Under monopolistic or oligopolistic conditions there are strong theoretical reasons for predicting that information disclosure facilitates collusion, rather than competition, primarily by enabling industry insiders to identify defectors from industrywide monopolistic practices. Disclosure and benchmarking, in other words, have potentially anticompetitive connotations 10 , and information disclosure alone is therefore likely to prove insufficient to achieve efficient or equitable outcomes.
• Vigilant public scrutiny and reliable analysis of disclosed information by customers of a monopoly utility may be necessary, but they are certainly far from sufficient, to incentivise the utility to refrain from excessive profittaking. Even where aggrieved parties can accumulate clear evidence that they have been exploited, this is of no avail if there is no reliable and costeffective institutional avenue for exercising countervailing power against incumbent monopolies. The taking of monopoly profits is not illegal under New Zealand law 11 . Public odium, leading possibly to direct political intervention, appears to be the only potential mechanism for sanctioning monopolistic behaviour. The effectiveness of that mechanism is now being tested in the context of official inquiries into electricity and telecommunications.
• Data is always theoryladen, and the interpretation of data has to take place within some theoretical framework. Disclosure guidelines and handbooks have been necessary to determine what lines companies have to disclose. Analysis of the resulting flood of material has been constrained accordingly to the particular questions which officials considered important (as well as by the ingenuity with which professional accountants have sought to restrict the information content of company disclosures).
• The effectiveness of information disclosure as a mechanism for inducing monopolies to act with restraint depends heavily on the credibility of sanctions that might be applied. In the New Zealand case the backstop has been a poorly specified threat of regulatory intervention if excess profits are brazenly disclosed. The credibility of that threat has faded in the face of observed official tolerance of
9 A lucid and entertaining discussion of the origins of “sunshine regulation” is in Foster (1992) Chapters 1 and 7.
10 A review of the issue will be found in Martin (1998), who suggests in relation to Denmark’s disclosure regime that ”there may be elements of industry capture behind the transparency approach” (p.106 fn 3) and notes that “the ability of rivals to identify and punish an individual defector is an important element in maintaining tacit collusion” (p.106 fn 2). The strong pressure exerted on electricity trusts in New Zealand to conform to the “commercial” behaviour of privatised lines companies may be explicable along these lines. Some relevant research from experimental economics is surveyed in Holt (1995).
11 This was established by the Privy Council decision in Telecom v Clear Communications, and reemphasized by the Court of Appeal in Vector Ltd (Formerly Mercury Energy Ltd) v.Transpower New Zealand Ltd, CA32/99, judgement issued 31 August 1999. See especially paragraph 64 which notes that “there is no control under s36 [of the Commerce Act 1986] over monopoly rents, the Privy Council seeing their elimination in the short term as being within the province of Part IV”.

ODV/Aug2000 6
high profits and rising asset values. The essential problem here is one of time inconsistency: Government may find it convenient ex ante to promise retaliation for monopolistic profittaking, but after the event its incentives are to back down in the face of industry lobbying and the politically difficult prospect of expropriating newlywon private property rights.
In the remainder of this paper I shall focus on the question of whether the disclosed profits of electricity lines companies in the past decade have been excessive, and on the relevance of the ODV methodology to this issue.
2. Framing the Question
2.1 Background
New Zealand does not have a strong tradition of concern with monopoly profits. As Pickford has noted, such profits are basically a transfer of wealth from consumers to the monopolist, and 12
the Commerce Commission … has taken the view that distributional changes generally do not affect social welfare and, therefore, that such changes can usually be ignored
Official policy statements on regulatory goals in New Zealand often make passing reference to excess profittaking, but focus primarily on the socalled “efficiency” issues which clearly dominate official thinking. 13 There is, to my knowledge, no clear statement to be found anywhere on the public record in New Zealand as to what the Government would regard as “excessive profit”. The usual criteria used by regulators in overseas jurisdictions to identify monopoly profits are either not accepted by the New Zealand Government, or not understood by those officials involved in evaluating the performance of natural monopoly firms.
The implicit benchmark for monopoly profittaking is “WACC on ODV”, which means “WACC on ODRC with rare exceptions”. Provided that a firm is recovering not more than its estimated weighted average cost of capital on a ratebase measured by which whichever is the lesser of aggregate willingnesstopay or ODRC , it will escape any sanction from the New Zealand Government. The switch to this new rule took place abruptly and with very little public debate between 1990 and 1993 and the full implications, although obvious to various commentators at the time 14 , have apparently still not been generally understood in official circles.
Prior to the adoption of the “WACC on ODV” benchmark, price regulation in New Zealand was carried out by the Commerce Commission using the familiar rateof
12 Pickford (1997) p.15. 13 The traditional textbook complaint that monopoly causes a static deadweight loss (Harberger
triangles) is seldom encountered in official discussion of electricity in New Zealand. Equally there is virtually no public attention given to potential economywide spillovers from unnecessarily high prices for infrastructure services.
14 Including Bertram, Demspter, Gale and Terry (1991) Chapter 9.

ODV/Aug2000 7
return regulatory model refined over a century of experience in the USA. (The last decision under that model was Decision 266 in 1992, regulating wholesale delivered gas prices.) The procedure used was to estimate a permitted total revenue per year which would be sufficient to cover all efficient operating costs plus a return of and on the historic book value of capital prudently committed.
Following the switch in policy regime, the ceiling on allowable asset value was changed from historic cost to optimised depreciated replacement cost, subject only to a possible willingnesstopay constraint. For most New Zealand network owners this meant a radical oneoff increase in their allowed ratebase. In turn, this meant that levels of profit which would have been unthinkable, and which would have been clearly recognised as monopoly rents under the old regime, were now legitimate. The “capital costs” associated with the existing allocation of real resources had been re rated for the benefit of shareholders and at the expense of consumers.
The debate surrounding the policy switch in New Zealand was extraordinarily limited and illinformed, if the public record is a fair indication. 15 It does not appear that either officials or consultants had much familiarity with the extensive literature on ratebase determination, nor any understanding of the requirements for making an orderly transition from one ratebase methodology to another. In particular it is ironic that New Zealand so readily adopted the replacementcost approach which had been the bane of US regulatory proceedings from the 1898 Smyth v Ames decision of the Supreme Court through to the 1944 Hope Natural Gas decision.
US experience during that halfcentury showed that the entire concept of “fair value” in which replacement (or reproduction) cost played a pivotal role was fraught with problems, including in particular the windfall gains to companies which were able to revalue their ratebases upwards in real terms and thus gain windfalls on top of their (virtually riskfree) regulated earnings on the previous ratebase. 16 Foster’s discussion of the Hope case is worth quoting: 17
That case showed up the shortcomings of Smyth v Ames … Among the many interesting details of this 1944 case, two are worth mentioning here. First, a substantial proportion of the original investment had been expensed inasmuch as customers had paid for it through charges as it was incurred. Thus, to reflect this in the value of the gas field, as had been done, was blatant double accounting to the disadvantage of the customer. Secondly, a huge part of the net present value of the monopoly was the present value of its gas, and since this natural gas could not be reproduced, and had no original cost, its value depended on current market values for gas. The monopoly’s net present value could then vary annually depending on market demand and the discovery of new gas reserves elsewhere. The Supreme Court was forced into a recognition that the shareholders had done extremely well out of the company even on its old basis and that anything approaching the increase in net present value that the company
15 See Gale and McWha (2000). 16 For historical descriptions of the fairvalue fiasco see Kahn (1988) pp.3541; Wilcox (1966)
Chapter 13 especially pp.312325; Foster (1992) Chapter 6 pp.187197; Bonbright et al (1988).
17 Foster (1994) p.190.
ODV/Aug2000 8
P B
E
Q1
was asking the regulator to recognize would lead to returns that might be judged extortionate.
2.2 Some Simple Regulatory Theory
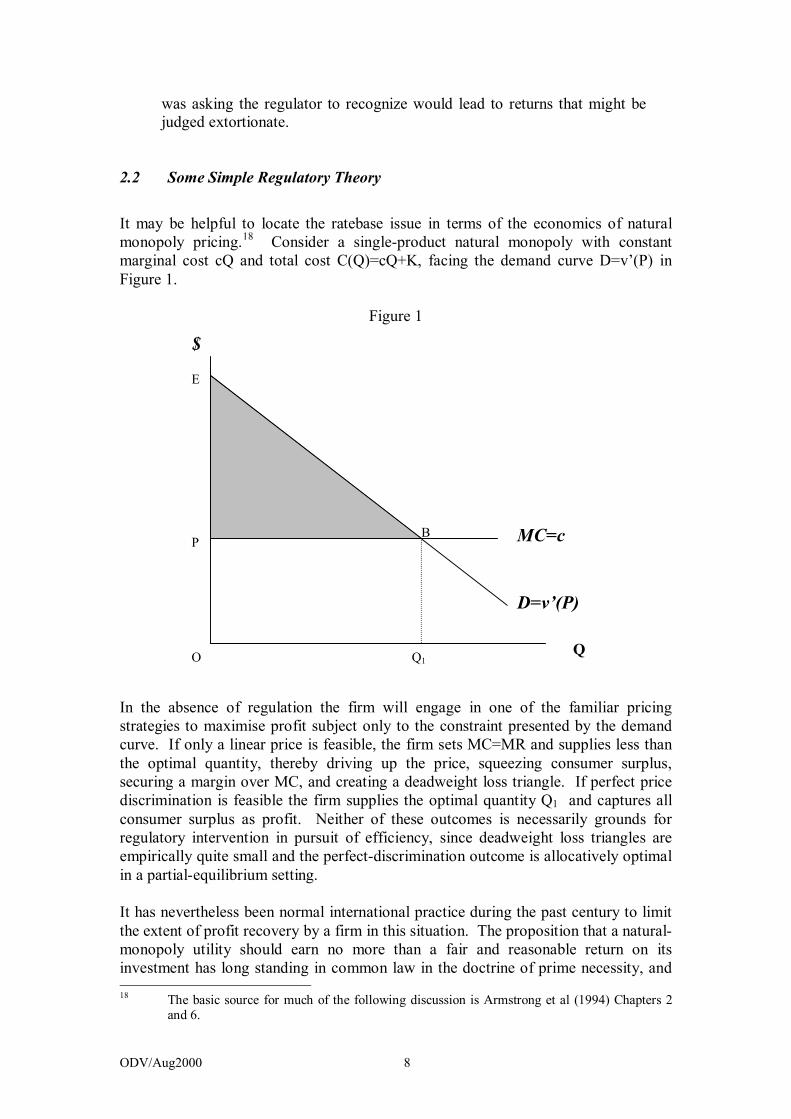
It may be helpful to locate the ratebase issue in terms of the economics of natural monopoly pricing. 18 Consider a singleproduct natural monopoly with constant marginal cost cQ and total cost C(Q)=cQ+K, facing the demand curve D=v’(P) in Figure 1.
Figure 1
In the absence of regulation the firm will engage in one of the familiar pricing strategies to maximise profit subject only to the constraint presented by the demand curve. If only a linear price is feasible, the firm sets MC=MR and supplies less than the optimal quantity, thereby driving up the price, squeezing consumer surplus, securing a margin over MC, and creating a deadweight loss triangle. If perfect price discrimination is feasible the firm supplies the optimal quantity Q1 and captures all consumer surplus as profit. Neither of these outcomes is necessarily grounds for regulatory intervention in pursuit of efficiency, since deadweight loss triangles are empirically quite small and the perfectdiscrimination outcome is allocatively optimal in a partialequilibrium setting.
It has nevertheless been normal international practice during the past century to limit the extent of profit recovery by a firm in this situation. The proposition that a natural monopoly utility should earn no more than a fair and reasonable return on its investment has long standing in common law in the doctrine of prime necessity, and 18 The basic source for much of the following discussion is Armstrong et al (1994) Chapters 2
and 6.
D=v’(P)
$
Q
MC=c
O
ODV/Aug2000 9
has been fundamental to most regulatory systems. Prime arguments for limiting the firm’s profit generally boil down to three:
(i) the economywide (generalequilibrium) effects of driving up the cost of infrastructural services and shifting the distribution of income and wealth towards utility shareholders;
(ii) the economic redundancy, from an allocative point of view, of any return on investment above that available in the competitive capital market, together with the observation that a key function of competitive markets is to prevent prices to the consumer from rising above the minimum consistent with sustainability of supply; and
(iii) “profit envy” 19 a general dislike of monopoly profittaking on equity or ethical grounds.
Outside New Zealand, protection of consumers against extortion by monopolies is widely considered one of the tasks of the state. Littlechild, for example, listed five criteria for assessing UK regulatory regimes: 20
(i) protection against monopoly (ii) encouragement of efficiency and innovation (iii) minimization of the burden of regulation (iv) promotion of competition (v) proceeds from privatization and prospects for the firm
Just as his first criterion was protection for consumers against profittaking, so his review of policy options rejected the idea of having no explicit regulation. Armstrong et al simply note as selfevident that “Option 1 [no regulation] was dropped from consideration for obvious reasons”. 21
A normal goal for regulators in both theory and practice is therefore to maximise consumer surplus subject to allowing the monopolist to recover sufficient revenue to break even (i.e. to secure a fair return on investment). In the simple model of Figure 1 this is best done in a twostep process, comprising marginal cost pricing on top of a fixed charge.
The shortrun allocative optimum is achieved by charging the marginalcost price P, in which case output in Figure 1 is OQ1, the firm receives revenue OPBQ1=cQ, and consumer surplus v(P) is EBP. This revenue would suffice only to cover the firm’s shortrun variable costs, leaving it with a loss equal to its fixed costs K.
The regulator therefore makes an estimate of K by some means and allows the firm to recover a corresponding amount of revenue, shown as A in Figure 2, by means of a
19 The expression comes from Foster (1992). 20 Littlechild (1983) reported in Armstrong et al (1994) p.167. 21 Armstrong et al (1994) p.167.

ODV/Aug2000 10
fixed charge, such that the resulting lumpsum transfer of income from consumers to the firm is just sufficient to secure the latter a normal rate of profit. 22
22 The rationale for this twopart arrangement was developed by Coase (1946).

ODV/Aug2000 11
P B
E
Q1
Figure 2
Armstrong et al 23 formulate the regulator’s problem in terms that take for granted that the regulator has a mandate to protect consumers to the greatest extent consistent with sustainability for the firm. 24 The regulator seeks to maximise the sum of consumer surplus and firm’s profit, subject to the constraint that the firm must break even:
Where R(Q(P)) is the revenue from the variable (perunit) price P C(Q(P)) = cQ+K is the firm’s total cost including normal profit A is the fixed charge allowed v(P) is consumer surplus if no fixed charge is levied α is the weight on profits in the regulator’s welfare
function, with 0<α≤1. 25
The optimal solution to this problem is to set P=c and A=K. To implement this solution the regulator must estimate K. For this purpose a ratebase (asset valuation),
23 (1994) pp.1620. 24 In New Zealand official statements much is made of the desire to see the sort of outcomes that
competitive markets provide. Prominent among those outcomes in the theory is restraint on supernormal profittaking at consumers’ expense. Hence Littlechild’s point that in the absence of competition, the regulator should seek to impose comparable restraints on profit taking.
25 Relevant to New Zealand is Armstrong et al’s point (1994 p.17) that α could represent the proportion of profits that are retained in the country as distinct from paid to overseas owners.
D=v’(P)
$
Q
MC=c
O
A
Maximise W = v(P)− A+ α [ A+ R(Q(P))− C(Q(P))]
s.t. A + R(Q(P))− C(Q(P)) ≥ 0

ODV/Aug2000 12
as depreciation methodology, and a normal rate of return must be specified. This leads directly to the traditional “rate of return regulation” procedures.
It is important to note the relationship between the above discussion and the RPIX pricecap (actually revenuecap) arrangement designed by Littlechild for the UK and now proposed to be introduced to New Zealand. In the context of a twopart tariff such as that shown in Figure 2, and commonly found in New Zealand lines charges, the effect of an RPIX cap is to progressively reduce the size of A over time if marginal cost does not change; or to reduce both A and P if productivity gains reduce marginal cost. To set the starting value of the revenue cap the regulator must have at least some idea of c and K, for otherwise there would be the twin risks of
(a) setting the initial cap too tightly and thus rendering the firm’s operation unsustainable on a goingforward basis; or
(b) setting A>K and thus allowing the firm to recover monopoly profits, which would violate the regulator’s mandate to protect consumers’ interests.
Thus it is a mistake to think of pricecap regulation as a substitute for rateofreturn regulation. On the contrary, a pricecap regulator has to start from a rateofreturn exercise, whether implicit or explicit, and the success of pricecap regulation is to be evaluated largely on the familiar rateofreturn criteria. Armstrong et al point out: 26
Littlechild … acknowledges that ‘rate of return considerations are necessarily implicit in setting and resetting X’. Shareholders would be unwilling to invest in sunk assets if they expect to earn rates of return that are below the cost of capital, while allocative efficiency and the extraction of rents require that the rate of return equals the cost of capital. It is important to estimate both cost of capital … and the asset base on which this return is earned.
2.3 The Sunk Cost Problem
A perennial source of confusion in ratebase determination is the treatment of sunk costs. In economic terms the issue is straightforward: “sunk investment costs are prominent among the ‘byegones’ that ought to be ignored in price making”. 27 The only authoritative objective measure of the market value of an alreadyexisting fixed asset is its opportunity cost or net realisable value – that is, the sum for which it could be sold if removed from its current use. Where an asset represents a sunk cost and has no alternative use, it does not have any market value (opportunity cost) that might impose on the owner of the asset some real sacrifice in making it available for its actual use. As Coase put it 28
If there is no other job on which the equipment could be used, the cost of using the machine (if we exclude depreciation through use) will be nil. It
26 Armstrong et al (1994) p.183. 27 Kahn (1988) p.39. 28 Coase (1938) reprinted in Buchanan, J.M. and Thirlby, G.F. (eds) L.S.E. Essays on Cost,
Weidenfeld and Nicholson, London, 1973).
ODV/Aug2000 13
is not therefore possible to say whether any allowance should be made for the use of the capital; this depends on the facts of the case.
Kahn concurs: “capital irretrievably sunk in an enterprise has a lower opportunity cost than incremental capital”. 29 If an asset has zero transfer earnings then any return which it yields to its owner is a rent. The issue of what level of rent is "fair and reasonable" cannot be resolved by any appeal to cost of service, because the economic surplus whose distribution is at issue is a rent, not a cost. In a costplus pricing equation, rents belong in the "plus", not in the "cost".
In valuing sunkcost assets for ratebase purposes, therefore, a regulator driven solely by neoclassical economic principles would assign a zero value (or a scrap value) to any asset without an alternative use. The reason why regulators virtually never do this is that there are important conventions and incentives surrounding the institution of private property which cannot be breached without having adverse effects on both current behaviour and future investment by entrepreneurs.
To persuade private investors voluntarily to commit capital to a network utility, the regulator must provide them with some reasonable certainty of being able to secure a return of and on their capital over time, at rates that are competitive with those offered by alternative investment opportunities. A regulator which retrospectively revalues assets down to opportunity cost after their costs have been sunk, and which lowers the allowed revenue accordingly, will clearly develop a reputation which deters further investment in the sector. The sustainability requirement for the sector, if it is to be able to continue to attract finance capital for replacement and development purposes, is basically that at the time each investment is made, there must be a clear expectation by all parties that the investors will recover a fair return on the sums of money committed at the time the investment is made. This requires in turn a de facto regulatory bargain that outlaws the downward revaluation of assets relative to depreciated historic cost – in other words, investors are given security against expropriation, but at the same time the regulator implicitly underwrites the investment once it has been certified as “prudent” 30 .
Incentive compatibility, in other words, means that historic cost (in the US, the original cost of prudentlyundertaken investments) is the lowest regulatory ratebase consistent with sustainability, if the rate of return allowed is set at the competitive cost of capital.
The originalcost approach accordingly became dominant in the USA because it avoided expropriation of investors while securing goingforward financial sustainability for the sector at minimum cost to consumers. This is a powerful combination of virtues which make original cost the logical benchmark path for the ratebase.
29 Kahn (1988) p.43 fn55. 30 The problem which this poses for regulators in relation to “stranded assets”, such as nuclear
power stations, and network assets which become redundant following deregulation of previouslymonopolised markets, has been the subject of a lively US literature focusing on “deregulatory takings”. Cf Kahn (1988) p.xxviii; Baumol and Sidak (1995); Sidak and Spulber (1997); Rossie (1998); Hovenkam (1999).

ODV/Aug2000 14
Switching (as New Zealand has done) to an acrosstheboard replacementcost methodology, including revaluation of sunk assets, will cause the ratebase to deviate above or below the originalcost benchmark depending on whether replacement costs have risen or fallen relative to original cost. Kahn 31 notes that the US Supreme Court original adopted the “fair value” standard in Smith v Ames at a time when replacement cost was below historic cost, so that the effect of departing from historic cost was to favour consumers (effectively expropriating some investor wealth by the benchmark of original cost). In New Zealand in the 1990s as in the UK in the 1980s, replacement values lie far above depreciated historic cost, and a revaluation of sunkcost assets to ODRC involves expropriation of consumer wealth for the benefit of utility shareholders, relative to the historiccost benchmark.
It is important to emphasize that there is no economicefficiency case for such revaluation, and that the various justifications offered in recent New Zealand and Australian discussions are spurious. In particular,
(i) There is no incentive effect on new or replacement investment arising from allowing windfall rents on alreadysunk investments. The crucial incentive requirement is that all new capital expenditure is rolled into the ratebase at actual prudent cost so that a competitive return can at all times be reasonably expected on a goingforward basis.
(ii) There is no need to build up cash reserves (a sinking fund) out of current revenues to pay for future replacements. Not only is this a misunderstanding of the nature of economic depreciation; it is quickly refuted in practice by the observation that New Zealand utilities pricing under ODV are not building up dedicated sinking funds to finance asset replacement. On the contrary, the additional annual cash flows secured from price increases, following asset revaluation to ODV, are treated as profits available for distribution to shareholders.
(iii) There is nothing more “economically correct” about ODRC as a valuation for sunkcost assets than there is about historic cost. A choice between these alternative ratebase formulae is an arbitrary one from the viewpoint of static economic efficiency. In terms of dynamic efficiency there is no clear a priori basis for regarding either as generally superior. In terms of the regulator’s objective function set out above, there is generally a strong equitybased presumption in favour of original cost.
To sum up it is worth quoting at some length from the treatment of this issue in Armstrong et al 32 :
If shareholders and debtholders are to be willing to finance new investment, they must expect to earn the cost of capital. This is assured if the price for the output from the new assets is set so that the present value of the cash flows attributable to the new assets is equal to the present value
31 Kahn (1988) p.39. 32 (1994) pp.186187.
ODV/Aug2000 15
of future capital expenditure. While it is clear theoretically what should happen for new investment, the more difficult problem is to set prices for the outputs produced with the existing assets. This turns out to be equivalent to the problem of determining the ‘value’ of the firm’s capital. If the existing assets were transferable to other activities without cost, then the coceptual problem, of determining their value would be simple. The existing assets would have to earn the cost of capital and should be valued at replacement cost…. If this was not the case, the assets would be costlessly transferred to other activities, and no firm would want to replace them. At the other extreme is the case where all existing assets are sunk so that the opportunity cots of using them in their presernt activitiy is zero. Then … a regulator whose objective is to maximise shortrun welfare would want to ensure that prices are set to cover future avoidable costs only, since capital is already sunk. This implies an asset valuation of zero. There are great problems with both of these solutions. Most of the assets of the [UK] utilities are sunk, and market values were lower than replacement costs at privatisation and have remained lower since then. Valuation at replacement cost at review time would generate large price increase and windfall gains for shareholders at the expense of consumers. On the other hand, attributing a zero value to the existing assets would make the windfall gains go in the opposite direction, and so shareholders would be reluctant to finance future sunk investments…..
… [A]t some future date all assets will have been created since privatization; since new assets earn the cost of capital, asset value will then equal replacement cost (if expectations are realised). Over time we should expect, other things being equal, to observe accounting rates of return earned by utilities that rise toward the cost of capital….. In the meantime the regulator needs to determine a valuation of the existing assets that is positive but below replacement cost.
… Using market values makes some sense because shareholders need to be convinced that they will not be expropriated at review time…. To avoid circularity, some base period market value has to be chosen and some form of indexation adopted…. [C]apital valuation is a crucial input into setting prices… but there is a heavy burden on the regulator and there are few operational principles.
2.4 The Unsustainability of ODVBased PricingUnder Technical Progress
A supposed virtue of ODRC and ODV, much touted in New Zealand and Australian official discourse, is the optimisation procedure which continually (at each three yearly review) forces asset valuations to track current bestpractice replacement costs. This procedure is certainly useful in the situation where ODRC valuations are being used by management within competitive firms to monitor their competitiveness and exposure to new entrants. It is, however, potentially lethal when imported into a ratebasesetting procedure in any regulated industry characterised by large sunk costs.
ODV/Aug2000 16
The reason, in a nutshell, is that it loads an incalculable risk of technical progress onto any investor at the time when new investment in a regulated utility occurs.
Consider the position of an investor committing $100 million today to install fixed electricity distribution assets with no alternative use, under an ODV ratebase with threeyearly review. For the first three years the full competitive return on the original investment is earned. Suppose however that in the interim there is technical progress which reduces the replacementcost value of the assets. Then regardless of the fact that the investor has committed financially to the $100 million asset, the ratebase will be written down by the amount of technological progress and the allowable revenue stream from year three onwards will therefore fall below that required to yield a normal return on the original investment. The investor, in other words, faces expropriation of wealth by the regulator. Foreseeing this, a rational investor will be unwilling to commit to the $100 million investment, and the sector runs the risk of underinvestment as a result.
As Small and Ergas remark in a recent paper, “many common forms of regulation aim to prevent firms from securing economic rents but do not provide insurance against losses” 33 . They state the essential issue as follows:
We know from the real options literature that the firm will not invest unless two conditions are met. First, the project must be expected to cover its costs; this is the standard NPV criterion. Secondly, it must not be the case that the firm expects to profit from delaying the investment. The value of the option to delay investment … is the difference between the expected value of the firm if it invests now, and the expected value if it defers the investment decision until next period.
Although Small and Ergas do not explicitly extend their analysis to a discussion of ODVbased regulation, they do show that the premium over the WACC that the rational investor will require as an incentive to invest now rather than later is equivalent to the anticipated economic depreciation of the asset once installed – which will include the effects of downward revaluation of the regulatory ratebase to match technological progress. The same point – that “economic depreciation” rather than the usual accounting depreciation must be built into a regulatory pricing formula if an ODRC ratebase is to be used – is made by Meikle. 34
Thus in order to secure financial sustainability of the regulated industry under ODV, a premium over the WACC will be required equal to the rate of technical progress expected by investors. If ODV is implemented in tandem with a CPIX price cap, then the X term would have to be set smaller than the expected rate at which operating costs can fall, in order to compensate for the anticipated accelerated depreciation of the asset base.
If the rate of return is to be restrained to the WACC, then a regulatory bargain will be required which insures the investor against ratebase erosion due to technical change – in other words, the ODV procedure must be replaced de facto by the originalcost
33 Small and Ergas (1999) p.2. The classic statement of the issue is Pindyck and Dixit (1994). 34

ODV/Aug2000 17
standard. The unsustainability of strict ODV pricing when the rate of return is constrained to the WACC, in contrast to the sustainability of historiccost or original cost pricing, is well illustrated by Gale and McWha. 35
3. Political Economy
In contrast to official positions which focus almost exclusively on a narrow concept of static efficiency, consumers and the media have consistently been concerned with allegations of excess profittaking by natural monopolies under the New Zealand regime.
A good recent example of the disjunction between public concerns and official policy is the gap between the Labour Party’s preelection policy statement of October 1999 36 promising an inquiry into electricity lines pricing to establish “whether there is a need to regulate distribution and transmission companies, and the robustness of the valuation and efficiency benchmarks needed to undertake any such regulation” and the terms of reference under which the Caygill inquiry subsequently reported 37 , which make no reference to equity or distribution issues and focus on a narrow concept of economic efficiency. The inquiry report offers no analysis of the profitability issue apart from a claim that the socalled “Rate of Return on Investment” (ROI) figures disclosed by the lines companies “do not provide helpful information about underlying profitability” and that there is “a lack of reliable and consistent information by which customers can judge distribution company performance”. 38 (The Inquiry team made little apparent effort to remedy this alleged lack of helpful information.)
The Inquiry’s dissatisfaction with the ROI measure and the data disclosed to date seem to imply rejection of the theoretical model which was originally used to frame the disclosure regulations. That model drew on the literature from rateofreturn regulation to argue that excess profits can be measured as any disclosed rate of return on the funds actually (and prudently) committed by the owners of a firm that exceeds the Weighted Average Cost of Capital for the industry being analysed. The ROI and its predecessor the Accounting Rate of Profit (ARP) were carefully and explicitly designed for the purpose of identifying monopolistic profits. The consultants who drew up the formula said as much: 39
The financial variables used in deriving the ARP have been carefully developed to come as close as possible to producing an accounting measure calculated from the financial statements prepared by utilities type businesses, which is comparable with financial WACC estimates.
… Of the three financial performance measures [required by the Regulations] ARP is the one which is most focused on monitoring
35 (2000) Figure 3. 36 New Zealand Labour Party (1999) p.8.
37 Ministerial Inquiry into the Electricity Industry (2000). 38 Inquiry into the Electricity Industry (2000) p.15 paragraph 75. 39 Ernst and Young (1994) p.3.

ODV/Aug2000 18
monopoly behaviour…. Disclosed ARPs in excess of the general view on appropriate WACCs should be subject to close scrutiny by customers.
For the 1996 March year Mercury Energy (now Vector) disclosed an ARP of 29.24%, attracting media comment to the effect that the Minister of Energy might step in. No action from Government followed, however. With this message taken on board, Orion disclosed an ARP of 31% for 1997, and Tasman Energy 28%. Eastland Energy then disclosed an ARP of 91% for the 1998 March year, still without attracting retribution. In the same year Otago Power recorded 46%, Electricity Ashburton 33.5%, WEL Energy 27.9% and Powerco 21.5%. 40
The following year Buller Electricity headed the field with an ROI of 96.46%, followed by Westpower with 51.83%, The Power Company with 47.7%, and Central Electric with 25.02%. Again neither media nor official comment focused on the interpretation to be placed upon rates of return of this magnitude. The credibility of the regulatory backstop had fallen substantially by 1999.
Since the data lying behind these disclosed rates of return are all on the public record, the best way to frame the question whether lines companies have made excessive profits would seem to be to proceed with the recommended close scrutiny of the industrywide pattern of sharp oneyear “blips” in the ARPs (ROIs) recorded by individual companies.
Accordingly, the next section of the paper examines the formula used to calculate the ARP/ROI and explores the relationship between a high oneoff ARP and the Internal Rate of Return on an investment project. The subsequent section relates the discussion to the New Zealand disclosed data for electricity.
4. Income, Wealth, and Accounting
Hicks, in the 1930s, enshrined in economic theory the recognition that real income for any period has two components: the flow of purchases that an individual or firm is able to finance during the period, plus the change in real wealth between the beginning and end of the period. 41 In the case of the firm, this is identically equal to revenues net of outlays for the period, plus holding gains on the firm’s assets (that is, any change in the value of the assets with which the firm entered the period, and which it still holds at the end). If the opening and closing value of assets held is correctly measured, then depreciation (the fall in the asset’s value due to retention and use through the period) is simply subsumed into the wider calculation of holding gains as measured by the revaluation of the asset base.
The real gross pretax income secured by the firm for any period is therefore
40 Ministry of Commerce, Electricity Information Disclosure Statistics 1999, Wellington, November 1999, p.7. See also Inquiry into the Electricity Industry Report to the Minister of Energy, June 2000 Table 3 p.14, which reproduces most of these figures but gives a lower figure for Buller Electricity.
41 Hicks (1941) pp.172 and 179. This income concept provided the basis for current cost accounting as it was developed by Edwards and Bell (1961). For other references on the Hicksian concept of income see Harcourt and Parker (1969).

ODV/Aug2000 19
Where Y is real income after tax and interest payments R is revenue for the period C is operating costs excluding depreciation Abeginning is the real value of assets at the start of the period Aend is the real value at the end of the period of those assets held since
the beginning of the period
To convert this to a rate of return we simply divide by some measure of the firm’s initial or current asset base. To determine whether the realised rate of profit is “excessive” we then compare our result with some benchmark standard of a “normal” or “competitive” rate of profit calculated on a consistent basis. This can be done on either a pretax or a posttax basis; the latter calculation (which is used for the ROI in the New Zealand disclosure regime) brings in various accounting complexities which need not detain us here. 42
An obvious corrollory of a writeup of asset values is that the denominator for conventional accountants’ calculations of the annual rate of return on capital is inflated accordingly. Two ratios familiar in standard accounting practice, and prescribed for disclosure by the 1994 Regulations, are the Return on Funds or Return on Assets, calculated as EBIT divided by Average Total Funds Employed 43 ; and the Return on Equity, calculated as Net Profit After Tax divided by Average Total Equity. Both of these ratios however make no allowance for any real income which accrues to shareholders by virtue of asset revaluations. They reflect simply the annual flow of operating surplus for a given year divided by the stock of assets as recorded in the company books for that year.
Under the Electricity (Information Disclosure) Regulations 1994 and 1999, the denominator for calculating these ratios is the average of the opening and closing book values disclosed for the year, with the result that for all years following that in which any revaluation of assets is entered onto the books, the effect is to lower the apparent profitability of the operation by increasing the denominator. This procedure is in accordance with “generally accepted accounting practice” in New Zealand, which highlights (not for the first time) the existence of a continuing gulf between accountancy practice and economic theory.
In recognition of this problem, a third ratio is therefore required to be disclosed, namely the “Accounting Rate of Profit” (ARP), renamed in 1999 the “Return on Investment” (ROI). The numerator of this ratio is operating surplus adjusted for depreciation differentials between book value and ODV, minus income tax, plus revaluations. The denominator is Average Total Funds Employed (with fixed assets entered at ODV rather than book value, and excluding average works under
42 Those interested are referred to the Information Disclosure Guidelines issued by the Ministry for Economic Development (formerly Ministry of Commerce).
43 EBIT is adjusted for amortised goodwill, subvention payments, and any differential in depreciation allowances between book value and ODV based depreciation. Average Total Funds Employed is the average of yearbeginning and yearend fixed assets (at book value) and working capital.
Y = R− C + (A end − A beginning ) = Operating Surplus + Revaluations

ODV/Aug2000 20
construction) minus half of any asset revaluation during the year. Thus revaluation is included in both numerator (as accrued income) and denominator (as a negative item reflecting the fact that this component of asset value did not arise from any actual real sacrifice by the owner of the assets).
The ARP or ROI is a relevant measure to use for the purpose of economic evaluation of profitability over a period, and particularly as the means of identifying returns higher than the Weighted Average Cost of Capital, which would tend to indicate the taking of monopoly profits unless an alternative explanation is readily forthcoming.
However, the way in which the ARP/ROI ratios have been published and interpreted in New Zealand tends to obscure a very important feature of the ROI in a context where assets are being progressively revalued. This is that a revaluation is a oncefor all step change in the stock value of assets, which is sustainable provided only if there has been a matching step increase in the present value of anticipated free cashflows from the business, due either to cost reductions which are expected not to be passed through to customers, or to price increases, or both. A high oneyear value for ROI is indicative of a permanent, not a transient, increase in the return on the original investment over the life of the assets concerned, and an analytical focus on singleyear disclosed results runs the risk of losing the plot.
Under New Zealand’s form of lighthanded regulation, an electricity distribution company undertaking a onceforall revaluation of its assets will need to show an aboveWACC “ROI” rate of return for only a single year, and the public scrutiny and opprobrium which are hypothetically the key enforcement mechanism must then be capable of retrospectively reversing the revaluation and producing a negative ROI in a subsequent year, if the company concerned is not to be confirmed in its permanent enjoyment of a higher revenue stream thereafter. Once a revaluation has been beddedin, the yearbyyear ROI record will return to a low (generally WACC related) figure.
To clarify the economics of the revaluation process, consider a company which is purchased in Year 0 for $1 million as a going concern with all required fixed assets already in place. From the point of view of the new owner, the investment against which subsequent returns are appropriately to be evaluated is $1 million, and the subsequent performance of the project can best be captured by calculating the Internal Rate of Return on the initial investment, and comparing this with the purchaser’s cost of funds. Suppose that at the time of the ownership transfer the current annual earnings before interest and tax are $100,000 per year.
For simplicity, assume that the assets are nondepreciating so that operating surplus and EBIT are the same. The assets have an estimated replacement cost of $3 million, but this is of notional interest only since the assets are nondepreciating and so will never need replacement. We assume also that inflation is zero so that all figures are in real terms.
Suppose now that the firm is a natural monopoly and that its prices are capped by a regulator on a costplus basis as follows. For each year, an annual “revenue requirement” is calculated which is sufficient to cover anticipated operating costs plus a surplus sufficient to yield a pretax return of 10% on capital (with capital measured

ODV/Aug2000 21
as the book value of assets at the beginning of the year). Suppose that the new owner operates the firm for ten years and then onsells it for the book value of its assets.
The internal rate of return on this project hinges critically on the stance of the relevant regulator. Two possible scenarios make this clear. In the first, the regulator operates in the fashion familiar from US practice, allowing the firm a capital ratebase equal to the real original prudent acquisition cost of the assets – in this case $1 million. The project then yields the stream of cash flows shown in Column 2 of Table 1 below, the Internal Rate of Return on which is 10%.
Now change the regulatory environment, to one which allows the firm to revalue its assets at any time provided only that such revaluation does not carry the book value above an audited estimate of the replacement cost of the assets. The same costplus pricing formula is applied to determine allowed revenue and hence price. The result is to allow the firm to revalue its assets onceforall at any time (here we assume it does so in year 3), transforming the investment project into the stream of costs and benefits shown in Column 5 of Table 1, with an Internal Rate of Return of 25.1%.
Table 1
Year UStype regulator NZtype regulator Ratebase Cash stream ROI % Ratebase Cash stream ROI % $000 $000 $000 $000
0 1,000 1,000 0 1,000 1000 0 1 1,000 100 10 1,000 100 10 2 1,000 100 10 1,000 100 10 3 1,000 100 10 3,000 100 210 4 1,000 100 10 3,000 300 10 5 1,000 100 10 3,000 300 10 6 1,000 100 10 3,000 300 10 7 1,000 100 10 3,000 300 10 8 1,000 100 10 3,000 300 10 9 1,000 100 10 3,000 300 10 10 1,000 1,100 3,000 3,300
IRR 10.0% 25.1%
It can be seen that in both cases the firm records a yearbyyear return on investment of 10% with one sole exception: the 210% recorded for year 3 when the revaluation is taken onto the books. This oneoff blip in ROI is actually an increase of 150% in the Internal Rate of Return on the investor’s initial financial commitment, based on a permanent price increase for customers sufficient to yield an additional $200,000 of revenue per year from year 3 onwards.
To interpret the ROI of 210% in year 3 as though it were merely a oneyear aberration in income flows would be clearly wrong. The blip is a oneoff wealth increase for the firm’s owner and a permanent, not temporary, price increase for customers relative to the price that would prevail under UStype regulation which allows recovery of WACC only on the acquisition cost (“prudently incurred investment”) of assets. A

ODV/Aug2000 22
UKtype regulator using RPIX starting from year 0 would produce the same result as the US regulator if inflation is zero and X is set to zero (reflecting in the regulator’s behaviour our assumptions of no changes in costs and revenues over the period). 44 Then the market value of the firm as a going concern remains at $1 million and the “Market to Asset Ratio” (MAR) 45 is onethird – that is, the replacement cost of the assets is three times the market value of the firm.
In both the USA and the UK, the regulatory regimes embody the view that unrequited transfers of wealth from customers to monopoly firms are undesirable on grounds of equity and/or economic efficiency. Those jurisdictions seek to hold revenues to the minimum consistent with sustaining the firm as a viable commercial operation on a goingforward basis, with the owners recovering a marketrelated return on and of the capital they have actually (and prudently) committed. The regulatory objective is to maximise consumer surplus, subject to a requiredrevenue constraint.
The New Zealand approach to regulation, in contrast, has a narrow focus on issues of “economic efficiency” 46 , which translates to official tolerance of wealth transfers that in other jurisdictions would be outlawed as unfair monopolistic profittaking. The absence of any regulatory restraint on asset revaluation in year 3 in Table 1 is the essential distinguishing feature of this case.
An important point from Table 1 is that the Internal Rate of Return over the entire period gives a better picture of the actual profitability of the investment than do the yearbyyear ratios. Use of the IRR has the great virtue of enabling the analyst to evaluate the profitability of a venture over a period of several years rather than focusing on the singleyear ratios disclosed by lines companies under the regulations.
44 (RPIX) regulation sets the firm’s output price with no (necessary) reference to its asset base. In this regulatory approach the price starts at its historical level, and evolves through time according to an escalator specified by the regulator. With a marketdetermined WACC being applied by financial analysts, the resulting market valuation of the firm’s assets is simply their Economic Value – that is, the discounted net present value of the future free cashflows expected to flow from operation of the firm subject to the constraint of the regulated price.
Grout (1995 p.391) describes this situation, which applied to the water industry in the UK where prices were restrained to historicallydetermined levels following privatisation: “if it is known at the time of privatisation that a utility will not be allowed to earn the cost of capital on the replacement cost of its assets then the market value of the utility will be less than the replacement cost of these assets. At this point the cost of capital does not determine the pricing policy. Indeed, the basic relationship becomes circular. The proposed regulatory policy determines the market value of the assets, i.e. potential investors will insist on earning the cost of capital on funds invested in the utility and this will produce an economic value below the replacement cost. If this value is taken as the measure of the valuation of the company then it is obvious that the regulatory policy is indeed the one that allows shareholders to earn the cost of capital on the utilities’ assets….. This fixes a value for the assets (market or modelbased) and it is possible to use this value as the base for setting future prices. The result is that the pricing policy is now tied together across time in the sense that prices chosen in subsequent price caps are not simply a function of the cost of capital but also depend on the initial prices that were chosen by the regulatory authority and the price path that the regulator intended to be followed in the future.”
45 Monopolies and Mergers Commission (1993) p.48 and Chapter 7; Board et al (1998) p.3. For US parallels see Bonbright et al (1988) p.336.
46 The Terms of Reference for the recent Inquiry into the electricity industry made extensive reference to issues of efficiency but not even passing mention of any goal of distributional fairness as between customers and suppliers.

ODV/Aug2000 23
Singleyear ratios are especially misleading when assets are being progressively revalued since the denominator used for the calculation then changes from year to year.
As Ernst and Young noted in 1994 47 ,
…because Electric Power Companies need not revalue their assets every year, any conclusions on monopoly behaviour and comparisons between EPCs would need to be drawn from several years’ data.
3. Some New Zealand Electricity Lines Data
The disclosed information from electricity distribution companies enables us to conduct a preliminary, very rough, IRR exercise for the industry over the past decade. 48 Table 2 gives the total disclosed book value of the fixed assets of distribution companies at March of each year from 1989 to 1999, together with their gross pretax operating surplus, all expressed in 1999 Marchyear dollars using the PPI (Inputs). The figures from 1989 to 1994 are for the combined retail and lines businesses (though excluding appliance trading and servicing) and therefore overstate the book value and surplus of the lines businesses alone. The figures from 1995 to 1999 are for lines businesses only, excluding energy trading. The result of the change in reporting framework between 1994 and 1995 is to understate the increases in book value and operating surpluses achieved by lines businesses over the full period, and hence to bias downwards our estimates of the internal rate of return.
Book value of all lines company fixed assets was about $2 billion at the time of the transfer of those assets from the former electric power boards and MEDs to the new corporate entities in 1993. By 1999 book value had doubled, to $4 billion 49 . Insofar as this reflected an increase in the present value of expected net cashflows for the sector, the implied wealth transfer to electricity lines companies from the rest of the community via the revaluation process was $2 billion (about 2% of GDP) 50 , which implies an increase of the order of $200 million or more per year in the rents secured from consumers by lines companies. As a rough order of magnitude, since 1995 electricity consumers appear to have paid over to lines businesses roughly a billion dollars of increased profits in order to sustain the writeup of asset values in the companies’ books. This seems a nontrivial sum.
47 Ernst and Young (1994) p.3. 48 Up to 1994, electricity sector financial and physical statistics were collected and published
annually on a consistent basis by the Ministry of Commerce. From 1995 on, financial disclosures by individual companies have appeared in the Gazette. The two main consequences of the change in reporting regime have been an increase in the transactions cost of research such as that reported here, and a fall in transparency due to the opportunities and incentives for companies to be creative in their interpretation of regulatory requirements.
49 For the March year 1999 the total Optimised Deprival Value of lines businesses recorded in the Information Disclosure Statistics was $4.287 billion. The lower figure in Table 1 reflects the fact that not all lines companies are yet carrying their fixed assets at full ODV in their financial reports as prepared for disclosure purposes.
50 “Revaluation reserves” in the disclosure balance sheets of lines companies peaked at $1.857 billion in the 1998 year.
ODV/Aug2000 24
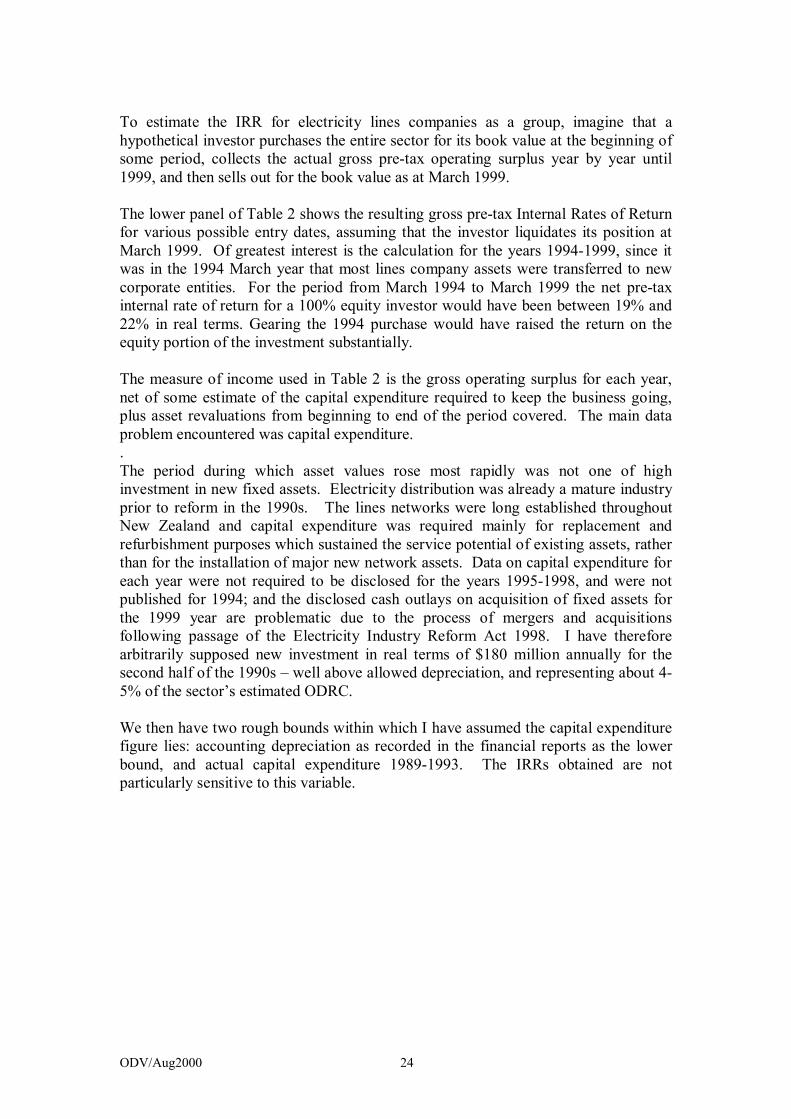
To estimate the IRR for electricity lines companies as a group, imagine that a hypothetical investor purchases the entire sector for its book value at the beginning of some period, collects the actual gross pretax operating surplus year by year until 1999, and then sells out for the book value as at March 1999.
The lower panel of Table 2 shows the resulting gross pretax Internal Rates of Return for various possible entry dates, assuming that the investor liquidates its position at March 1999. Of greatest interest is the calculation for the years 19941999, since it was in the 1994 March year that most lines company assets were transferred to new corporate entities. For the period from March 1994 to March 1999 the net pretax internal rate of return for a 100% equity investor would have been between 19% and 22% in real terms. Gearing the 1994 purchase would have raised the return on the equity portion of the investment substantially.
The measure of income used in Table 2 is the gross operating surplus for each year, net of some estimate of the capital expenditure required to keep the business going, plus asset revaluations from beginning to end of the period covered. The main data problem encountered was capital expenditure. . The period during which asset values rose most rapidly was not one of high investment in new fixed assets. Electricity distribution was already a mature industry prior to reform in the 1990s. The lines networks were long established throughout New Zealand and capital expenditure was required mainly for replacement and refurbishment purposes which sustained the service potential of existing assets, rather than for the installation of major new network assets. Data on capital expenditure for each year were not required to be disclosed for the years 19951998, and were not published for 1994; and the disclosed cash outlays on acquisition of fixed assets for the 1999 year are problematic due to the process of mergers and acquisitions following passage of the Electricity Industry Reform Act 1998. I have therefore arbitrarily supposed new investment in real terms of $180 million annually for the second half of the 1990s – well above allowed depreciation, and representing about 4 5% of the sector’s estimated ODRC.
We then have two rough bounds within which I have assumed the capital expenditure figure lies: accounting depreciation as recorded in the financial reports as the lower bound, and actual capital expenditure 19891993. The IRRs obtained are not particularly sensitive to this variable.

ODV/Aug2000 25
Table 2
(a) Electricity Distribution Companies’ Disclosed Book Value of Fixed Assets and Gross PreTax Operating Surplus
$000 at 1999 prices Using the PPI (Inputs)
March years 1989 1990 1991 1992 1993 1994 1995 1996 1997 1998 1999
Total distribution companies' book value $million
1,980 1,998 1,981 2,006 1,989 2,393 2,755 3,031 3,780 3,956 4,075
Total gross pretax operating surplus of distribution companies $000
169,884 183,048 224,005 240,281 222,023 342,715 389,374 450,230 389,750 435,593
Depreciation allowances $000
96,779 99,129 106,763 104,801 100,000 91,768 102,322 114,035 132,716 124,522
Net pretax operating surplus real (depreciation based) $000
73,105 83,919 117,242 135,480 222,023 250,947 287,052 336,195 257,034 311,071
Capital spend (arbitrary estimate 1995 on)
173,260 188,172 231,900 170,870 180,000 180,000 180,000 180,000 180,000 180,000
Net operating surplus (capitalspendbased)
3,376 5,124 7,895 69,411 42,023 162,715 209,374 270,230 209,750 255,593
ODV/Aug2000 26
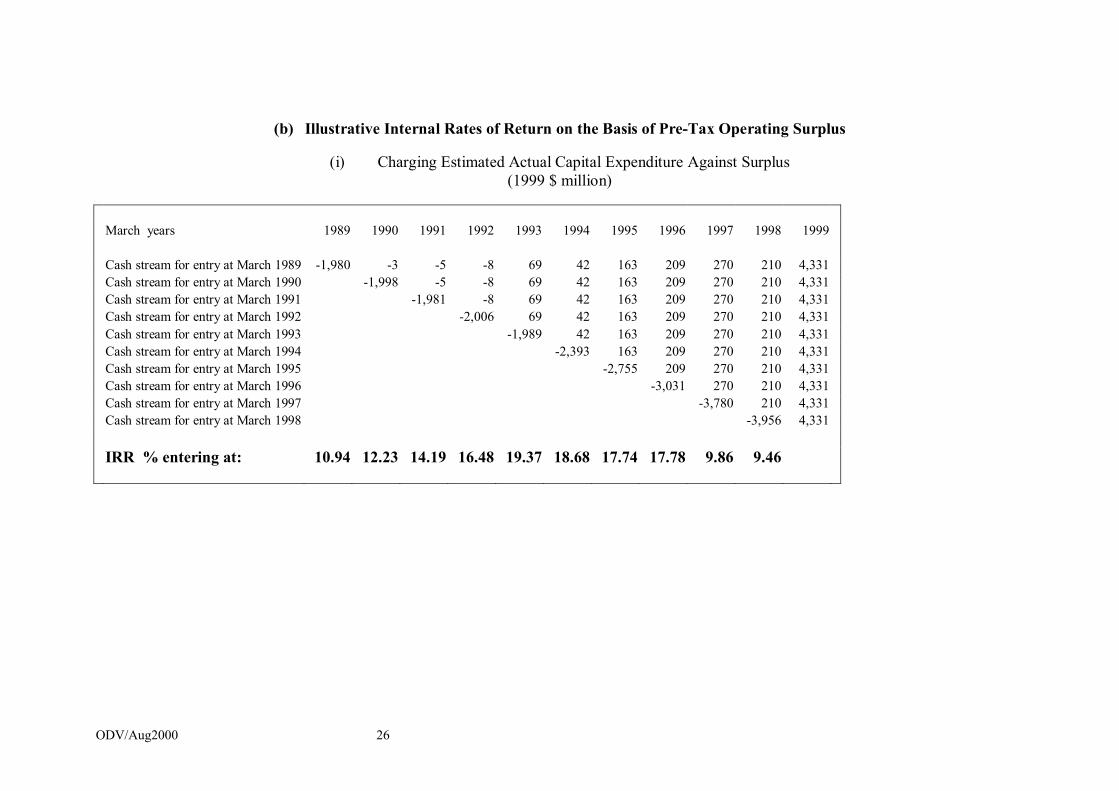
(b) Illustrative Internal Rates of Return on the Basis of PreTax Operating Surplus
(i) Charging Estimated Actual Capital Expenditure Against Surplus (1999 $ million)
March years 1989 1990 1991 1992 1993 1994 1995 1996 1997 1998 1999
Cash stream for entry at March 1989 1,980 3 5 8 69 42 163 209 270 210 4,331 Cash stream for entry at March 1990 1,998 5 8 69 42 163 209 270 210 4,331 Cash stream for entry at March 1991 1,981 8 69 42 163 209 270 210 4,331 Cash stream for entry at March 1992 2,006 69 42 163 209 270 210 4,331 Cash stream for entry at March 1993 1,989 42 163 209 270 210 4,331 Cash stream for entry at March 1994 2,393 163 209 270 210 4,331 Cash stream for entry at March 1995 2,755 209 270 210 4,331 Cash stream for entry at March 1996 3,031 270 210 4,331 Cash stream for entry at March 1997 3,780 210 4,331 Cash stream for entry at March 1998 3,956 4,331
IRR % entering at: 10.94 12.23 14.19 16.48 19.37 18.68 17.74 17.78 9.86 9.46
ODV/Aug2000 27
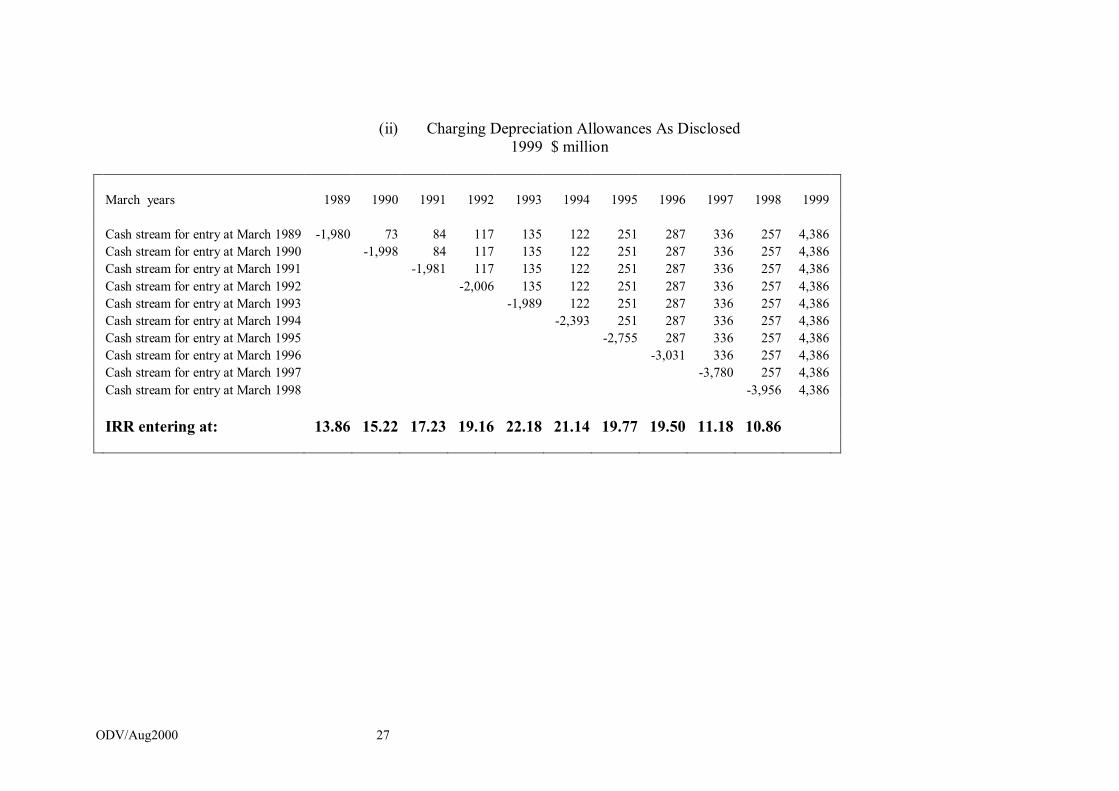
(ii) Charging Depreciation Allowances As Disclosed 1999 $ million
March years 1989 1990 1991 1992 1993 1994 1995 1996 1997 1998 1999
Cash stream for entry at March 1989 1,980 73 84 117 135 122 251 287 336 257 4,386 Cash stream for entry at March 1990 1,998 84 117 135 122 251 287 336 257 4,386 Cash stream for entry at March 1991 1,981 117 135 122 251 287 336 257 4,386 Cash stream for entry at March 1992 2,006 135 122 251 287 336 257 4,386 Cash stream for entry at March 1993 1,989 122 251 287 336 257 4,386 Cash stream for entry at March 1994 2,393 251 287 336 257 4,386 Cash stream for entry at March 1995 2,755 287 336 257 4,386 Cash stream for entry at March 1996 3,031 336 257 4,386 Cash stream for entry at March 1997 3,780 257 4,386 Cash stream for entry at March 1998 3,956 4,386
IRR entering at: 13.86 15.22 17.23 19.16 22.18 21.14 19.77 19.50 11.18 10.86

ODV/Aug2000 28
The rising aggregate value of fixed capital assets reported during the late 1990s was almost entirely attributable to changes in accounting procedures which led to the writingup of fixed assets already installed and in use. For this purpose a peculiarly homegrown version of the deprivalvalue methodology was relied on as justification for entering fixed assets at their estimated Optimised Depreciated Replacement Cost (ODRC, sometimes written as DORC).
4. The ODV Methodology
The ODV methodology has been widely adopted for application to natural monopoly utilities in New Zealand since 1990, and is now making increasing headway for the same purpose in Australia. While it is common to hear assertions that adoption of this methodology in New Zealand was preceded by rigorous and searching debate, there is to my knowledge no published record of such a debate. Only anecdotal material is available on when and where the claimed debate took place, and there is no way for outsiders to evaluate the calibre of arguments advanced for and against the proposed new methodology. Debate in Australia has been at a considerably higher level 51 .
An unfortunate feature of the early New Zealand discussions, such as they were, was that they took place under the aegis of organisations which had a strong vested interest in raising their own asset values. ECNZ is reported to have hosted a major seminar in 1991 at a time when the company was being groomed for sale and when the maximisation of sales proceeds loomed large in the minds not only of ECNZ management but also of key Government agencies such as Treasury, at a time when proceeds from asset sales were still often thought of as current revenue for the purpose of calculating the annual Budget deficit.
ECNZ’s leadership was exercised also through the Trans Power Establishment Board, set up to separate the assets of ECNZ between the new grid company TransPower and the parent company with its large portfolio of generation assets. The TPEB commissioned an ODV valuation from Ernst and Young and Ewebank Preece, on the basis of which the new SOE was set up with a book value of nearly $3 billion compared with the $1 billion at which the transmission assets had previously been recorded.
Where, then, did the ODV concept come from?
The deprival value concept was clearly stated by the US economist James C. Bonbright in the 1930s 52 . Its subsequent use and misuse outside the USA is partly attributable to a failure to take account of the wider context of Bonbright's work on asset valuation, of which the deprival concept formed only a part. Bonbright drew a clear distinction 53 between the legal appraisal of property value for the purpose of
51 See, for example, Choy (1996), Clarke and Dean (1996), and Bureau of Industry Economics (1996).
52 Bonbright, J.C., Valuation of property, Columbia University Press, New York, 1937, Vol.1 Chapter 4.
53 Bonbright, J.C., Valuation of property, Columbia University Press, New York, 1937, Vol.2 p.1078.

ODV/Aug2000 29
indemnifying property owners in the event of actual loss (the sort of ex post exercise for which deprival value was and is the appropriate concept) and ex ante ratemaking by regulators responsible for overseeing the prices of natural monopoly utilities.
"Economists", Bonbright said, "refer to the ... problem [of choosing a rate base] as one of choosing a proper rate base of deciding how much the property should be permitted to be worth rather than of discovering how much it actually is worth." 54
And he went on:
"For the value of a public utility system depends on earnings anticipated by present or prospective owners, and this anticipation will not serve as a basis by which a court or commission may ascertain whether the earnings realized by any proposed rate are too high or too low. To attempt, therefore, to fix rates by a valuation of the property, in the strict sense of the word "valuation", is to put the cart before the horse. It would mean that rates, however exorbitant, could never be lowered if the result of the reduction would be to reduce the earning power of the company and thereby adversely to affect the outlook for future profits." 55
Various potentiallyobjective benchmarks were considered by Bonbright to enable this circle to be broken by a regulator seeking to establish a rate base for price setting. An initial choice, he thought, was between a "cost plus" standard and a "competitive standard". 56 The cost plus standard would protect the producer from suffering any real loss, in return for which it would restrict prices to the lowest level consistent with a fair return on and of the capital included in the rate base. The competitive standard would focus more closely on the price that would be charged by the lowestcost producer in a competitive market, and would thus amount to capping prices on the basis of benchmark prices from competitive markets for similar products. The further from competitive conditions an industry lies, the greater is the appeal of the first approach, now often referred to as rateofreturn regulation.
Within his costplus paradigm, having distinguished between "replacement cost" and "prudent investment" theories of the rate base 57 , Bonbright came down firmly on the side of the latter:
The test of fair rates is their adequacy to yield a wellmanaged company a reasonable return on its actual capital invested. ... if the company, in prior years, has been permitted to amortise a portion of its gross capital investment, through annual charges to depreciation, it cannot fairly claim the right to continue earning a return on this investment, which it has
54 Bonbright, J.C., Valuation of property, Columbia University Press, New York, 1937, Vol.2 p.1081
55 Bonbright, J.C., Valuation of property, Columbia University Press, New York, 1937, Vol.2 p.1083.
56 Bonbright, J.C., Public Utilities and the National power Policies, Columbia University Press, New York, 1940, pp.1314.
57 Bonbright, J.C., Valuation of property, Columbia University Press, New York, 1937, Vol.2 p.1085.

ODV/Aug2000 30
already fully recouped. Any other rule would involve double counting against the ratepayers. 58
It is doublecharging of this sort which New Zealand lines companies have been imposing on users of their systems. Bonbright's solution was to prohibit real windfall revaluations of assets in the books of natural monopolies for ratemaking purposes, and to base allowed revenues on the minimum required to yield a fair return on and of the investor's actuallyincurred past financial sacrifices.
These arguments prevailed in the US Supreme Court's Hope decision which set the basis for subsequent utility regulation in the USA 59 . The decision, authored by Justice William O. Douglas, stated:
The investor interest has a legitimate concern with the financial integrity of the company whose rates are being regulated. From the investor or company point of view it is important that there be enough revenue not only for operating expenses but also for the capital costs of the business. These include service on the debt and dividends on the stock... By that standard the return to the equity owner should be commensurate with returns on investments in other enterprises having corresponding risks. That return, moreover, should be sufficient to assure confidence in the financial integrity of the enterprise, so as to maintain its credit and to attract capital…. Rates which enable the company to operate successfully, to maintain its financial integrity, to attract capital, and to compensate its investors for the risks assumed certainly cannot be condemned as invalid, even though they might produce only a meager return on the socalled 'fair value' [e.g. replacement cost] rate base."
The application of the deprival value concept to financial reporting of fixed asset values appears to have been due mainly to Solomons (1966)(1971). In presenting his interpretation of the deprivalvalue concept, he acknowledged the very wide bounds within which the "value to the owner" of an asset might fall under commercial conditions: 60
"... a valuation concept which, I think, could do much to integrate many of the conflicting ideas... is Bonbright's concept of 'value to the owner'. 'The value of a property to its owner', said Bonbright, 'is identical in amount with the adverse value of the entire loss, direct and indirect, that the owner might expect to suffer if he were to be deprived of the property.' Expressed in this way, 'value to the owner' would appear to be so much too subjective a concept to be of use to the accountant. And so it would be if it could not be quantified objectively, at least within tolerably close limits. Fortunately, we can approximate it fairly well, if we note that it is bounded by net realizable value on the lower side and replacement cost on the upper side. It is clear that an asset cannot be worth less to its owner than he could sell it for. It is
58 Bonbright, J.C., Valuation of property, Columbia University Press, New York, 1937, Vol.2 p.1139.
59 Federal Power Commission v Hope Natural Gas Company, 320 U.S. 591 (1945). 60 Solomons 1971, p.111.

ODV/Aug2000 31
also clear that the loss which he would sustain, if he were deprived of an asset, cannot be greater than the cost to which he would be put to replace it or its services."
Note that deprival value is not necessarily or essentially replacement cost. Replacement cost is merely the theoretical absolute upper limit to deprival value, in the sense of the maximum insurable loss that a commercial operation could ever credibly attribute to its assets following their actual total loss.
Deprival value may equate to ODRC under particular circumstances (for example, a perfectly competitive market in longrun equilibrium) which bring Economic Value into line with ODRC. But nothing in the concept of deprival, nor in the generally accepted economic theory of resource allocation, guarantees the owner of an asset any valuation greater than Net Realizable Value (opportunity cost, as measured by transfer earnings). Certainly the competitive market mechanism gives no such guarantee, for which reason there is a strong strand in accounting theory suggesting that NRV is the value at which sunkcost assets ought to be carried. 61
The subsequent close linking of the deprival concept with replacement cost was due largely to Baxter (1967, 1971, 1981); but his advocacy of the concept was for purposes of financial reporting, never of pricesetting. The literature on current cost accounting since 1971 is, admittedly, replete with recommendations for use of replacement cost, usually in the form of ODRC, for the balancesheet valuation of fixed assets which lack alternative uses (i.e. whose NRV is merely their scrap value). Under competitive conditions, for relatively shortlived assets which are regularly replaced, and whose entry and exit prices therefore tend to converge in the market value of the assets, there is a pragmatic case for using replacement cost as a valuation methodology for financial reporting, and the ODRC value of a firm's assets comes to the fore as a potentially important piece of information for managers 62 . By producing inhouse estimates of ODRC, management can (in theory) remain alert to any overpricing of the firm's product relative to the prices that might be charged by a new entrant. Management then has the chance to preempt such competitive entry by pricing to remain competitive.
From the viewpoint of shareholders of a firm under competitive conditions, the ODRC might provide also a useful benchmark for measuring management performance (assuming there are no intangible assets) since it standardises capital stock estimates across the various firms in the industry and so enables the profitability of one firm to be compared with that of another as a first approximation to measuring managerial efficiency.
Under conditions of natural monopoly, however, these beneficial features of ODRC valuation do not apply.
From the managerialdecisionmaking point of view, there is no benefit or discipline arising from having an approximate estimate of the entry threshold for a competitor, given that there is no such competitor and that the limit price is unlikely to coincide 61 Chambers (1971, 1991). 62 Baxter, W.T., (1986) , pp.246247.

ODV/Aug2000 32
with ODRC. (This, after all, is inherent in the very definition of natural monopoly.) Since there is no real threat of competitive entry, there is no real competitive incentive for management to price keenly to deter such entry. Consequently there is no incentive for management to conduct ODRC investigations with due diligence.
On the contrary, under monopolistic conditions there are strong incentives for both management and shareholders to use notional valuation procedures to inflate asset values as a means of reducing the apparent rate of return being earned, and hence ostensibly to "justify" larger revenues than might otherwise be allowed (even under a regime of lighthanded scrutiny). Such opportunistic inflation of ODRC estimates has been recognised as a major problem in the New Zealand electricity lines industry. In 1997 a Ministry of Commerce paper discussing problems encountered in applying the ODV provisions of the Electricity (Information Disclosure) Regulations noted that 63
"The ODVs are designed to provide a cap for the value of line business assets. The primary purpose of this is to ensure that an owner of a line business is not able to undertake continual revaluations of the value of the line business and use this as a basis for continual upward increases in line charges and hence line business profits (including capital gains). The current ODV handbook gives standard asset values and lives. However, the handbook allows exceptions to the standards. To date use of the exceptions provision has been limited, but the Ministry understands that some companies are moving to make increasing use of this provision. There is concern that extensive use of the exceptions provision could not be justified on the basis of actual asset values and lives.
"ODVs are required to be certified by auditors, but the auditors themselves have to rely on the advice of engineers regarding the values and lives of specific assets. However, there is anecdotal evidence that in some instances, engineers are being pressed by companies into recommending increased valuations. Auditors have commented to the Ministry that the exceptions provision has created difficulties for the audit process, and they have suggested that this provision be reviewed."
Just as the theoretical arguments for ODRC as a decision tool fail in the absence of actual realworld competitive disciplines, so too does the case for ODRC as a means for shareholders to put pressure on management to perform 64 . The essential problem here is again the lack of a competitive limit to the revenues which may actually be extracted from customers, and hence the ability of a natural monopoly's management to meet without difficulty any rateofreturn target on assets set by shareholders. Replacement cost is an entirely arbitrary benchmark for economic value of assets in the absence of actual market competition, and revenues extracted from customers to service an ODRC ratebase are correspondingly arbitrary and without any clear conceptual justification in economic theory.
63 Energy Policy Group (1997). 64 This argument was influential in the adoption of ODV by New Zealand policymakers about
1990. See Cooper (1995).

ODV/Aug2000 33
It is nevertheless the case that numerous writers have proposed using ODRC as the preferred methodology for use in the financial accounts of natural monopoly utilities. Virtually none, however, have translated this suggestion from the realm of financial reporting (assessment of the rate of return being realised on assets) to the conceptually quite distinct realm of rate making, and there is no established convention in favour of use of ODRC directly for price setting. On the contrary, in those jurisdictions where ODRC and ODV have attracted most interest in recent years, it has become apparent that the methodology does not readily translate from the use of ODRC as a denominator in rateofreturn calculations, to its insertion unadjusted into a required revenue formula.
In the UK, the Byatt Report of 1986 drew attention to the proposition that the realised rate of return on ODRCvalued assets in the public sector was below market rates of return, and recommended adoption of currentcost accrual accounting to render more transparent the actual rates of return being achieved by nationalised industries under their thenprevailing mandates. The Report thereby provided the basis for a series of policy moves by the Thatcher Government to increase charges for nationalised industries such as electricity, gas, rail, and water supply. The Report did not, however, directly recommend rebasing utility prices onto ODRC rate bases. While it clearly pointed the way to upwardtrending prices, it made explicit provision for accounting for asset writeups during any transition to a higher set of book values (thereby implicitly accepting that bygones were bygones in terms of revenues previously foregone by nationalised industries); it emphasized that application of replacementcost methods has to be anchored on original cost indexed for inflation 65 , not simply imposed on the back of a oneoff rate shock for customers with associated wealth windfalls; and it acknowledged "acute" practical difficulties in actually valuing large sunkcost assets to any current value 66 . Given all these provisos, the pricing strategy implied by the Report was no mechanistic application of a predetermined formula into which replacementcost values could then be inserted to yield a specific price. On the contrary, the implied process was one of making transparent the best available estimates of the economic costs of supplying outputs from the nationalised industries, in order to inform policymakers whose judgement would then be exercised in deciding on price changes.
The circumstances under which the Byatt Report was produced were conducive to its tendency to lean towards accounting procedures which increased rather than reduced the apparent total value of assets controlled by the nationalised industries, thereby making their achieved rates of return appear low. Not only did this match the traditional accounting principle of conservatism in reporting profitability; it also served well the political agenda of a government which, as owner of the assets concerned, intended to view the nationalised industries as a source of increased revenues, and ultimately to realise increased asset values through privatisation. At no stage in the UK privatisation process, however, was there any doubt that the actual prices charged and expected to be charged by the industries concerned would remain
65 Accounting for Economic Costs and Changing Prices: A Report to HM Treasury by an Advisory Group (the "Byatt Report"), HMSO, London, 1986, Vol.1 p.18 paragraph 72.
66 Accounting for Economic Costs and Changing Prices: A Report to HM Treasury by an Advisory Group (the "Byatt Report"), HMSO, London, 1986, Vol.1 p.27 paragraph 114.

ODV/Aug2000 34
below the levels that might bring realised profits up to a market return on ODRC valued assets (including infrastructural assets). Market to asset ratios at privatisation were uniformly low (below 11% in water 67 ; 41% in gas 68 ) and this privatisation discount reflected clearly the general awareness in the UK that there was no contemplation of actually inserting ODRC valuations into those industries' price setting procedures in the coldturkey fashion currently being pursued in New Zealand. Subsequent pricecap regulation in the UK, furthermore, has proceeded on the understanding that the MARs are not expected to rise until actual replacement expenditures have been capitalised into the privatised enterprise's books. Convergence to ODRCrelated prices, in other words, is to proceed only as fast and as far as is permitted by market forces and investment decisions.
Similarly in Australia, a 1995 report 69 recommended that infrastructural assets, particularly those in the public sector, should undertake ODRC valuations of their assets for reporting purposes; but there was no expectation that this valuation would mechanistically be carried into pricesetting by any rigid formula. The valuations were to be used in rateofreturn targetsetting for Government Business Enterprises, and the assumption was again (as in the UK Byatt Report) that the problem to be addressed was that prevailing charges were unreasonably low so that the fiscal contribution of the enterprises concerned could reasonably be increased. The Report explicitly noted that it was not to be expected that the Net Present Value of expected cashflows would necessarily come anywhere near the resulting valuation 70 , not only because of the presence of nonoptimised assets but also because of the existence of Community Service Obligations (CSOs) which legitimately constrained the rates charged for service as a matter of public policy. No pricing equation was proposed in the Report and there was no recommendation more precise than a general implication that prices for infrastructure services ought to be increased, and a call for more "efficient" pricing (not further defined).
As the Byatt Report had done, the BIE report acknowledged that "valuing infrastructure assets is a difficult task. A combination of asset valuation methodologies should be used. There is likely to be considerable judgement involved in making decisions about valuations.... [I]ndependent oversight may be required to ensure that GBEs do not make inappropriate adjustments to asset values with a view to making it easier to achieve a Rate of Return target." 71
None of the material surveyed above does anything to dispel the fundamental point that the only authoritative objective measure of the market value of an asset is its net realisable value – that is, the sum for which it could be sold if removed from its current use. Where an asset represents a sunk cost and has no alternative use, it does not have any market value (opportunity cost) that might impose on the owner of the asset some real sacrifice in making it available for its actual use. As Coase put it 72
67 Grout, P (1995) p.392. 68 Monopolies and Mergers Commission (1993) p.48 paragraph 2.194. 69 Bureau of Industry Economics, (1995,)Chapter 4. 70 Bureau of Industry Economics (1995) p.50. 71 Bureau of Industry Economics (1995) p.61. 72 Coase (1938) reprinted in Buchanan, J.M. and Thirlby, G.F. (eds) L.S.E. Essays on Cost,
Weidenfeld and Nicholson, London, 1973).

ODV/Aug2000 35
If there is no other job on which the equipment could be used, the cost of using the machine (if we exclude depreciation through use) will be nil. It is not therefore possible to say whether any allowance should be made for the use of the capital; this depends on the facts of the case.
Whatever the facts, if the asset has zero transfer earnings then any return which it yields to its owner is a rent. The issue of what level of rent is "fair and reasonable" cannot be resolved by any appeal to cost of service, because the economic surplus whose distribution is at issue is a rent, not a cost. In a costplus pricing equation, rents belong in the "plus", not in the "cost". The whole concept of “WACC on ODV” which currently drives electricity lines pricing in New Zealand lacks any sound principled basis.
6. Conclusion: the Policy Implication
The central problem in pricing services from very longlived infrastructural assets is sunk cost. The real resource requirements to establish the lines networks from scratch were incurred far in the past and are byegones. The real resource requirements to sustain the networks are small for the present generation of users. The future costs of replacement will come through gradually over a long period of time and can easily be borne on a payasyougo basis. As with superannuation, attempts to set aside, out of current revenues, portfolios of financial assets in the present to enable future outgoings to be “funded” are fraught with both theoretical and practical difficulties. (In any case, electricity lines companies are not even pretending to accumulate such portfolios for future investment funding needs – the capital charges collected from customers on the companies’ ODV asset bases are simply included in the bottom line as current profit, and then distributed as dividends and/or rebates.)
A commonplace observation in the literature on supply of infrastructural services is that, under competitive conditions with large lumpy assets whose costs are sunk, the sole economic requirement for incumbent operators to remain in business for the immediate future is that their revenues suffice to cover shortrun marginal cost, which approximates average variable cost under typical cost conditions. Exit will (and should) occur whenever a firm observes that the present value of its expected net profit stream has fallen below the disposal value of its assets.
In the long run, the full lifecycle earnings of a new project must be expected to match its initial investment cost if new entry is to be warranted. Hence when there is excess capacity, a competitive market would drive price down towards SRMC, while when capacity is scarce a competitive market would drive price up sufficiently to attract new entrants. Competitive markets, in other words, look after longrun security of supply in industries with longlived lumpy assets by means of continual cycles in scarcity and price 73 .
New Zealand policymakers, notwithstanding their ostensible commitment to “outcomes that match those in competitive markets”, have remained faithful to a very
73 Parks (1989).

ODV/Aug2000 36
different pricing philosophy 74 inherited from the era of state monopoly supply, namely that prices should be held continuously at somebody’s estimate of longrun marginal cost, in order to avoid “rate shock” and ensure seamless installation of new assets as they are needed. 75 To achieve this regime, the essential requirement is a barrier to entry sufficient to prevent competitive forces from operating.
Until the 1990s the relevant barrier to entry for the entire electricity sector was provided by monopoly state control of ECNZ/TransPower, combined with franchised monopoly distribution operations under various other forms of public ownership. Since restructuring, the electricity industry has divided into two groups of operators: those open to new entry (in generation and retailing) who have been exposed to precisely the radical pricecycle effects predicted by theory; and those endowed with natural monopolies by virtue of their ownership of established transmission and distribution networks.
For the network operators, both entry and exit costs are extremely high, economies of scale and scope seem to exist, and most investment costs are irretrievably sunk. The resulting entry barriers have enabled lines companies to hold their prices up against a ceiling which may or may not coincide with some concept of the “limit price”. 76
The economics of sunk cost are very straightforward, as Coase 77 long ago explained. Once establishment costs have been sunk, the only value objectively attributable to distribution line assets is their disposal value – that is, what they would fetch if thrown onto the open market as scrap. All value attributed to such assets above this floor is essentially arbitrary and is determined entirely by the institutional framework within which the assets are operated in their actual use. The difference between the asset valuations that line companies are permitted to sustain and the disposal value of their assets is the value of whatever barriers to entry 78 may have been given legitimacy by the local regulatory authorities.
(In New Zealand, one key barrier to entry into distribution networks is the value of existing easements, given the difficulty of securing new resource consents for major infrastructural projects. It is noticeable that the plans by Telstra and Saturn to bypass the incumbent nationwide telecommunication networks rely heavily on offshore submarine cables which bypass most of the need for onshore easements for trunk facilities.)
There is no “objective” basis for the asset values written into lines company books. The values are arbitrary, based upon the prevailing judgement of regulators. The range over which values could potentially range is bounded below by Net Realisable
74 Associated with the work of the French electricity economist Boiteux. 75 An explicit statement is in Trans Power Establishment Board 1991. 76 The only possible test of this would be whether existing networks are extensively bypassed by
new entrants in the long run. But as the literature recognises (Martin 1998 p.117; Friedman 1979), the limit price concept itself is seriously compromised by the fact that incumbent monopolies are always able to respond to new entry by price wars, which potential entrants are well able to foresee. This credible threat of retaliation effectively forecloses entry in many industries where the entry costs are very large and almost completely sunk at the moment of entry.
77 Coase (1938, 1946). 78 Edey (1974) recommends explicitly accounting for the value of barriers to entry.
ODV/Aug2000 37
Value (disposal or scrap value), and above by the full cost of replacing the system in toto. 79 In regulatory practice, wherever it is intended to maintain existing utility operations as going concerns, government regulators have chosen various arbitrary “lines in the sand” as the ceiling against which incumbent monopolists are allowed to push their asset values, and hence their prices. In the USA, depreciated historic cost has been used since the Hope case of 1944. In Australia, the ACCC allows operators to select for themselves any valuation between historic cost and optimised depreciated replacement cost. In the UK, regulators have used the “RPI minus X” procedure to anchor the time paths of asset values and prices to the historicallygiven set of valuations and prices in existence at the time of privatisation of the relevant assets. 80
In New Zealand, government policy has signalled that the regulatory ceiling is the ODV of the relevant assets, and lines companies have accordingly moved their values and prices up to this ceiling. Given that the electricity distribution industry was never in the slightest danger of financial collapse prior to restructuring, it is safe to say that the asset values recorded at the beginning of the 1990s were already above net realisable value, and probably included a substantial component attributable to entry barriers. All additions to the value of those assets since then reflect the market’s valuation of barriers to entry which had remained unexploited under the old regulatory regime but which are allowed to be exploited under the new regime.
Electricity lines asset valuation, therefore, is inescapably a policy matter – not a matter of any objective market test. From an economic point of view, the correct way to record the book value of line assets would be to start from their net realisable value as the sole objective basic component of value, and then to account explicitly for the value of allowed barriers to entry up to the ceiling set by the regulator.
The resulting transparency would focus attention where it belongs: on the regulator, not on the companies. The New Zealand disclosure regime, under which politicians and officials have invited the public to put their effort into scrutinising the lines companies, has served to divert attention from the regulatory economics that actually drive pricing outcomes, and to remove the accountability that a more explicit regulatory regime would have imposed on the political authorities. To that extent, the Caygill inquiry’s recommendation that the Commerce Commission should step forward to take the heat is a step in the right direction. The Commission, however, will need political guidance before it can undertake the exercise of subjective judgement that is inescapable in any regulatory exercise under natural monopoly.
The buck therefore will stop, in due course, with the Government. The easiest way forward would be a statement of economic policy from the Minister to the Commerce Commission. If the Government then opted for ODV as its explicit policy choice, it would be politically accountable for the consequences, which is as it should be.
79 For clear exposition of this range see the introductory chapter of Harcourt and Parker 1969. 80 See Grout (1995).
ODV/Aug2000 38
Bibliography
Accounting for Economic Costs and Changing Prices: A Report to HM Treasury by an Advisory Group (the "Byatt Report"), HMSO, London, 1986, Vol.1.
Armstrong, M., Cowan, S. and Vickers, J., Regulatory Reform: Economic Analysis and British Experience, MIT Press 1994.
Arnold, R., Ironfield, D., Orr, J., Brown, S., McLachlan, R. and Jubb, C., Issues in Infrastructure Pricing, Research Report 69, Bureau of Industry Economics, Canberra ACT, August 1995, 111 pp.
Australian Competition and Consumer Commission, “Implementation and Measurement of TSLRIC”, Appendix 2 of Access Pricing Principles – Telecommunications, July 1997.
Baron, D.P., "Design of Regulatory Mechanisms and Institutions", Chapter 24 in Schmalensee, R. and Willig, R.D. (eds) Handbook of Industrial Organization Vol.II, NorthHolland, 1989.
Baumol, W.J. and Sidak, J.G.,Transmission pricing and stranded costs in the electric power industry. Washington, D.C., published for the American Enterprise Institute by AEI Press, 1995.
Baxter, Depreciation, Sweet and Maxwell, London, 1971.
Baxter, W.T., “Accounting Values: Sale Price Versus Replacement Cost”, Journal of Accounting Research 5:208214, 1967, reprinted in Parker, R.H., Harcourt G.C. and Whittington, G., Readings in the Concept and Measurement of Income, second edition, Philip Alalan, Oxford. 1986, pp.242249.
Baxter, W.T., Depreciating Assets: An Introduction, Institute of Chartered Accountants of Scotland, 1981
Baxter, W.T., Accounting Theory, Garland Publishing, New York, 1996.
P.W. Bell, “On Current Replacement Costs and Business Income”, in Sterling, R.R. (ed.) Asset Valuation and Income Determination: A Consideration of the Alternatives – Papers Given at a Symposium held at the School of Business, University of Kansas, May 1970, Scholars Book Co, Lawrence Ka, 1971, pp.1932.
Berg, S.V. and Tschirhart, J., Natural Monopoly Regulation, Cambridge University Press, New York, 1988.
Bertram, G., and Terry, S. Lining Up the Charges: Electricity Line Charges and ODV, Simon Terry Associates, Wellington, July 2000.
Bertram, G., Dempster, I., Gale, S. and Terry, S., Hydro New Zealand: Providing for Progressive Pricing of Electricity, Wellington, 1991.
Board, M. et al, Accounting Requirements for Regulated Industries, Centre for the Study of Regulated Industries Research Report No 9, London, May 1998.
Bonbright, J.C., 1937, The Valuation of Property: A Treatise on the Appraisal of Property for Different Legal Purposes, 2 vols., The Michie Company, Charlottesville, Virginia, reprinted 1965. [VUW library HD1387/B699/V.]
ODV/Aug2000 39
Bonbright, J.C., Danielson, A.L. and Kamerschen, D.R., Principles of Public Utility Rates second edition, Public Utilities Reports Inc.,. Arlington Va, 1988.
Braeutigan, R.R., "Optimal Policies for Natural Monopolies", Chapter 23 in Schmalensee, R. and Willig, R.D. (eds) Handbook of Industrial Organization Vol.II, NorthHolland, 1989.
Bureau of Industry Economics, Issues in Infrasatructure Pricing, Research Report No 69, Canberra, August 1995.
Carpenter, P.R. and Lapuerta, C., Asset Valuation and the Pricing of Monopoly Infrastructure Services: A Discussion Paper, The Brattle Group, Cambridge Mass. and London UK, July 2000.
Chambers, R.J., “Evidence for a MarketSellingPrice Accounting System”, in ”, in Sterling, R.R. (ed.) Asset Valuation and Income Determination: A Consideration of the Alternatives – Papers Given at a Symposium held at the School of Business, University of Kansas, May 1970, Scholars Book Co, Lawrence Ka, 1971.
Chambers, R.J. and Wolnizer, P.W., “A True and Fair View of Position and Results: the Historical Background”, Accounting, Business and Financial History March 1991, reprinted in Parker, R.H., Wolnizer, P.W. and Nobes, C.W., Readings in True and Fair, Garland Publishing, New York, 1996.
Clarke, F. and Dean, G., “Commentary: Public Sector Accounting, Product and Service Pricing, and Performance Evaluation”, in Choy, E., Asset Valuation by Government Trading Enterprises: An Evaluation of Pricing Issues, Independent Pricing and Regulatory Tribunal of New South Wales and Australian Society of Certified Practising Accountants, Melbourne 1996, pp.111 135.
Choy, E., Asset Valuation by Government Trading Enterprises: An Evaluation of Pricing Issues, Independent Pricing and Regulatory Tribunal of New South Wales and Australian Society of Certified Practising Accountants, Melbourne 1996, pp.111135.
Coase, R.H., “Business Organisation and the Accountant”, originally in The Accountant, October 1 – December 17 1938, reprinted in Solomons, D. (ed) Studies in Costing, London, Sweet and Maxwell, 1952. Also reprinted in Buchanan, J.N. and Thirlby, G.F. (eds) LSE Essays on Cost, Weidenfeld and Nicholson, London, 1973.
Coase, R.H., “The Marginal Cost Controversy”, Econometrica 13(51):169182, August 1946.
Commerce Comission, Review of Asset Valuation Methodologies: Electricity Lines Businesses’ System Fixed Assets: Discussion Paper, Wellington, 1 October 2002, 117pp.
Confederation of British Industry, The Privatisation of the Electricity Industry: Asset Valuation, Rates of Return and Electricity Pricing, London 1988. Held by ECNZ.
Cooper, K., "Valuation Techniques and Problems", Continuing Education Paper No 439, in Infrastructure Assets Forum, New Zealand Society of Accountants, Wellington, 1995.
Davis, Kevin, Asset Valuation, Cost of Capital, and Access Pricing in the Australian Gas Industry, University of Melbourne Dept of Accounting and Finance Research Paper 9902, March 1999.

ODV/Aug2000 40
Dixit, A.K. and Pindyck, R.S., Investment Under Uncertainty, Princeton University Press, 1994.
Edey, H., “Deprival Value and Financial Accounting”, in Edey, H. and Yamey, B.S. (eds), Debits, Credits, Finance and Profits, London, Sweet and Maxwell, 1974, pp.7584. [UW library HF5629/E22/D]
Edwards, E.O. and Bell, P.W., The Theory and Measurement of Business Income, University of California Press, 1961.
Ernst and Young, Rationale for Financial Performance Measures in the Information Disclosure Regime, Including Use of Optimised Deprival Values and Avoidance of Double Counting of Asset Related Expenses: A Report to Energy Policy Group, Energy and Resources Division, Ministry of Commerce, by Ernst & Young for Briefing ESANZ, August 1994, 16 pp.
Federal Power Commission v Hope Natural Gas Company, 320 U.S. 344 (1944).
Foster, C.D., Privatization, Public Ownership and the Regulation of Natural Monopoly, Blackwell, Oxford, 1992.
Friedman, J.W., “On Entry Preventing Behaviour and Limoit Price Models of Entry”, in Brams, S.J. and Schwodiauer, G. (eds) Applied Game Theory, Wurzburg, PhysicaVerlag, 1979, pp.236 253.
Gale, S. and McWha, V., The Origins of ODV: Report to Air New Zealand, NZIER, Wellington, August 2000.
Grout, P., "The Cost of Capital in Regulated Industries", Chapter 16 in Bishop, M., Kay, J. and Mayer, C., The Regulatory Challenge, Oxford University Press, Oxford, 1995.
Harcourt, G.C. and Parker, R.H., Readings in the Concept and Measurement of Income, Cambridge University Press, 1969.
Hicks, J.R., Value and Capital, Clarendon Press, second edition 1941.
Holt, C.A., “Industrial Organization: A Survey of Laboratory Research”, in Kagel, J.H. and Roth, A.E. (eds) The Handbook of Experimental Economics, Princeton University Press, 1995, pp.349 443.
Hovenkam, Herbert, “The Takings Clause and Improvident Regulatory Bargains” 108 Yale L.Rev. 801 (1999).
Independent Pricing and Regulatory Tribunal of New South Wales (IPART), Summary of IPART’s Report on Pricing for Electricity Networks and Retail Supply, Sydney, June 1999.
Kahn, A.E., The Economics of Regulation, John Wiley, New York, 1970; second edition MIT Press 1988..
King,. S.P., 1997, Access Pricing Under RateofReturn Regulation, Discussion Paper No 366, Centre for Economic Policy Research, Australian National University, Canberra, May 1997, 21 pp.

ODV/Aug2000 41
King, S.P., Competition and Vertical Separation, Discussion Paper No 317, Centre for Economic Policy Research, Australian National University, Canberra, October 1994, 19 pp.
King, S.P. and Maddock, R., Competition and Almost Essential Facilities: Making the Right Policy Choices, La Trobe University May 1996. Held at Open Polytechnic of NZ.
Littlechild, S.C. Regulation of British Telecommunications Profitability, HMSO, London, 1983.
Martin, S., “Competition Policy: Publicity vs Prohibition & Punishment”, Chapter 6 in Martin, S. (ed) Competition Policies in Europe, NorthHolland, 1998, pp.105141.
Melbourne Society of Certified Accountants, Asset Valuation by Government Trading Enterprises: An Evaluation of Pricing Issues: A Project Sponsored by the Independent Pricing and Regulatory Tribunal, 1996. Held by Institute of Chartered Accountants.
Maikle, S., A Critique of the Optimised Deprival Value Ratebase Masters dissertation, Auckland University, 1999.
Miller, J., The New Zealand Electricity Sector 19961999, ANZ Securities, Auckland, 1997.
Ministerial Inquiry into the Electricity Industry, Report to the Minister of Energy, Wellington, June 2000.
Ministry of Commerce, Energy Policy Group, Energy & Resources Division, Discussion Paper on the Proposed Revisions to the Optimised Deprival Valuation Handbook of Electricity Lines Businesses, 1997.
Ministry of Commerce, Energy Policy Group, Questions and Answers on Financial Performance Measures, Optimised Deprival Valuations and Avoidance of DoubleCounting of Asset Related Expenses, August 1994.
Ministry of Commerce, Energy Policy Group, Handbook for Optimised Deprival Valuation of Electricity Line Businesses, 23 June 1994, 61 pp.
Ministry of Commerce, Energy Policy Group, Energy & Resources Division, Discussion Paper on the Proposed Revisions to the Optimised Deprival Valuation Handbook of Electricity Lines Businesses, 1997.
Monopolies and Mergers Commission, Gas: Volume 1 of Reports under the Fair Trading Act on the Supply Within Great Britain of Gas Through Pipes to Tariff and NonTariff Customers, and Other Supply within Great Britain of the Conveyance or Storage of Gas by Public Gas Suppliers, HMSO, London, August 1993.
Monopolies and Mergers Commission, BG plc A Report Under the Gas Act 1996 on the Restriction of Prices for Gas Transportation and Storage Services, HMSO, London, 1997.
New Zealand Labour Party, Changing Course: Labour on Energy, October 1999.
Newbery, D., "Determining the Regulatory Asset Base for Utility Price Regulation", Utilities Policy 6(1):18, 1997.
ODV/Aug2000 42
Officials Coordinating Committee, Review of the Regulation of the Gas Industry: Report to the State Sector Committee, March 1991.
Park, R.E., Incremental Costs and Efficient Prices with Lumpy Capacity: the SingleProduct Case, RAND Corporation, June 1989.
Pickford, M., “Economics and the Commerce Act”, in Compliance: Business Issues Information, Commerce Commission, Wellington, October 1997.
Rossie, Jim, “The Irony of Deregulatory Takings” 77 Tex.L.Rev. 297 (1998).
Scott, M. FG, "Some Economic Principles of Accounting: A Constructive Critique of the Sandilands Report", in Parker, R.H., Harcourt, G.C. and Whittingon, G., Readings in the Concept and Measurement on Income second edition, Philip Allan, 1986.
Sherman, R., "Is Public Utility Regulation Beyond Hope?" in Danielson, A.C. and Kamerschen. D.R. (eds), Current Issues in PublicUtility Economics: Essays in honor of James C. Bonbright, Lexington Books, Lexington Mass., 1983.
Sidak, J. Gregory and Spulber, Daniel F., Deregulatory Takings and the Regulatory Contract: The Competitive Transformation of Network Industries in the United States 1997.
Small, J.P. and Ergas, H., “The Rental Cost of Sunk and Regulated Capital”, mimeo, Department of Economics, Auckland University, June 1999.
Solomons, D., “Asset Valuation and Income Determination: Appraising the Alternatives”, in Sterling, R.R. (ed.) Asset Valuation and Income Determination: A Consideration of the Alternatives – Papers Given at a Symposium held at the School of Business, University of Kansas, May 1970, Scholars Book Co, Lawrence Ka, 1971, pp.107113.
Solomons, D., "Economic and Accounting Concepts of Income", in Backer, M., Modern Accounting Theory PrenticeHall, Englewood Cliffs NJ, 1966 reprinted in Harcourt, G.C. and Parker, R.H. (eds) Readings in the Concept and Measurement of Income, Cambridge University Press, 1969,pp.154160.
Tweedie, D.P. and Whittington, G., The Debate on Inflation Accounting, Cambridge University Press 1984.
United StatesUnited Kingdom Arbitration Concerning Heathrow Airport User Charges, 101 International Law Reports 216 (1995).
Walker, R.G., The SEC’s Ban on Upward Asset Revaluations and the Disclosure of Current Values, University of NSW Working Paper 106, 1991. Held by Institute of Chartered Accountants.
Whittred, G., Zimmer, I. And Taylor, S., Financial Accounting: Incentive Effects and Economic Consequences, Harcourt Brace, Sydney, 4th ed 1997.