Embed Size (px)
Citation preview

Joel Johnson, Yr 12 Physics ER 3.3 Final, 15/6/16 Page 1 of 12
The Optimum Launch Angle of a Projectile
ABSTRACT
Determining the launch angle that will maximise the horizontal distance of a projectile has
many applications in the sporting arena. It is particularly relevant to shotput competitors
and their coaches, as the launch angle has a significant effect on the distance travelled.
Using a marble and a curved ramp as a model of projectile motion, the optimum launch
angle was determined to be between 43 and 49°. These results were somewhat higher than
expected, and are probably due to experimental error associated with the video analysis
software.
INTRODUCTION
The aim of this experiment was to investigate the effect of launch angle on the horizontal
distance travelled by a projected marble, when all other factors are kept constant.
Many sports include some form of projectile motion, such as long jump, archery and
shotput. In shotput, as with most of these sports, the object is to maximise the horizontal
distance the projectile travels (International Association of Athletics Federations 2016).
Understanding the factors that affect projectile motion is very important to athletes and
coaches in order to enhance performance.
Once launched, a projectile follows a pre-determined path that is dependent upon the
launch velocity, launch angle, height of release, air resistance and gravity (Pyke 1991). Most
of these factors cannot be easily changed; the one exception is the launch angle.
In a vacuum, the maximum distance is obtained for a launch angle of 45°, and
complementary angles give the same distance (Price & Romano 1998). However when air
resistance is taken into account, the optimal angle is less than 45°. This is as angles below
45° have a reduced time and overall distance of flight, which in turn reduces the amount of
drag that acts upon the projectile (Price & Romano 1998).
The findings of this investigation may have relevance to athletes or coaches in the shotput
field, as they are very concerned with maximising the distance the shot travels.
HYPOTHESIS
It was hypothesised that the optimum launch angle would be slightly less than 45° (about
43°), as lower angles will result in a decrease in the total flight distance, reducing the
amount of time that drag acts on the projectile. Lenz & Rappl (2010) found that taking air
resistance into account, the optimum angle was 42°. However, the effect of air resistance
will probably be nearly insignificant in this experiment, as even at the maximum possible

Joel Johnson, Yr 12 Physics ER 3.3 Final, 15/6/16 Page 2 of 12
speed, the drag force would only be 2.0*10-3 N (calculations in Appendix 4). Therefore, the
optimum angle should be only slightly below 45.
METHOD
1. Figure 1 shows the general setup for the experiment.
2. The marble was dropped down a curved rubber ramp, from a height of 1.00 metres
above the ground. This provided it with a standard velocity for each trial.
3. The ramp then curved upward and finished nearly level1 with the height of the
sandpit, which was approximately 120 mm above the height of the ground.
4. The launch angle for different trials was varied by adjusting the steepness of the last
section of ramp, thus changing the launch angle of the marble.
5. Each trial was filmed with a digital camera. The distance from the end of the ramp to
the first mark in the sand was measured to the nearest 5 mm with a tape measure,
and also recorded. After each trial, the sand was re-levelled by hand.
6. The videos were analysed using Tracker, a free video analysis tool. The velocity and
angle of launch were determined for each trial. A 100 mm strip of paper was taped
to the side of the sandpit for use as a scale.
1 The top of the ramp surface was approximately 10 mm above the level of the sandpit for most trials; this
discrepancy was ignored in the calculations.

Joel Johnson, Yr 12 Physics ER 3.3 Final, 15/6/16 Page 3 of 12
DATA
Graph 1 shows a summary of the data obtained. A full summary of the data is available in
Appendix 1.
ANALYSIS
As can be seen from Graph 1, the maximum horizontal distance was observed at angles
between approximately 43° and 49°. There is a bell-shaped curve relationship between the
launch angle and horizontal distance; however the relationship is not strong enough to
determine the maximum point accurately. There is a significant amount of experimental
error, as shown by the variation in horizontal distance for the same, or very similar, launch
angles. For example, at an angle of around 34°, the horizontal distance ranges from almost
800 mm to just over 700 mm. This variation makes it impossible to identify any anomalous
data; however all of the points appear to fit the bell-curve shape fairly well.
Graph 2 shows the relationship between the distance travelled and the horizontal and
vertical components of the velocity vector, assuming a launch velocity of 1 m s-1. The
maximum distance occurs when both the horizontal and vertical components are
0
100
200
300
400
500
600
700
800
900
0 10 20 30 40 50 60 70 80 90
Ho
rizo
nta
l Dis
tan
ce T
rave
lled
(m
m)
Launch Angle (°)
Graph 1 - Relationship between launch angle and horizontal distance

Joel Johnson, Yr 12 Physics ER 3.3 Final, 15/6/16 Page 4 of 12
approximately 0.7 m s-1, which corresponds to a launch angle of around 45:
= cos-1(0.7) = 45.6 or
= sin-1(0.7) = 44.4
The results obtained could be roughly modelled using a sinusoidal curve, as shown in graph
3. For angles between about 30 and 70 the model fits fairly well; however towards the
edges there are significant differences. The model shows extremely small horizontal
distances for angles close to 0 or 90, whereas the experimental data showed values above
250 mm. This difference could be partly due to the fact that the ramp was slightly above the
level of the sand (see footnote in method).
The equation for the model used is:
y = 820*sin(2x)
0
100
200
300
400
500
600
700
800
900
0 0.2 0.4 0.6 0.8 1 1.2
Graph 2 - Horizontal and Vertical Vector Components
Horizontal Velocity Component
Vertical Velocity Component

Joel Johnson, Yr 12 Physics ER 3.3 Final, 15/6/16 Page 5 of 12
DISCUSSION
The results are quite surprising, as they show optimum launch angles of, or slightly above,
45°. It is well known that in real-world situations, where air resistance plays a part, the
optimum launch angle of a projectile is always less than 45° (Price & Romano 1998).
Moreover, even in a vacuum the optimum angle is only 45°. This suggests that there was at
least one significant source of experimental error in the procedure.
An obvious source of error is the release of the marbles – as it was done by a human; there
would be some variation in the crispness of the release. In addition, the range of angles
investigated could affect the results of the experiment. Most of the trials involved angles
less than 45° - for example, there were 4 trials where the launch angle was greater than 55°,
but over 20 trials where the launch angle was less than 35°. Further trials performed with
launch angles over 55° would fill out the ‘empty’ parts of the graph and might help clear up
the shape of the bell-curve relationship.
Another likely source of error is the angles obtained from the video analysis software. It was
quite difficult to accurately determine the launch angle for a projectile, as the video camera
used only filmed at 30 fps, so tracking the path of the projectile through the air was
somewhat limited. Moreover, the angles used were the angles between the last point the
marble was on the ramp, and the first point off the ramp, so were not actually the angle of
the tangent to the marble’s path.
The launch velocity (as measured by the Tracker software) of various trials was not constant,
ranging between 1.5 and 2.3 m s-1 (see Appendix 1). As the marble was dropped from the
0
100
200
300
400
500
600
700
800
900
0 20 40 60 80 100
Axi
s Ti
tle
Axis Title
Graph 3 - Modelling the Results
Experiment Results
Model
Joel Johnson, Yr 12 Physics ER 3.3 Final, 15/6/16 Page 6 of 12
same height for each trial, the velocity should have been consistent throughout the
experiment. This suggests there was some problem with the data provided by the video
analysis. Theoretical calculations, neglecting friction with the rubber surface or air
resistance, show that the launch velocity of the marble should be about 4.2 m s-1 (see
Appendix 2). Calculations in Appendix 3 also show that the velocities given by the video
analysis software are inaccurate, as even neglecting the effects of air resistance, they still
predict horizontal distances much lower than those observed.
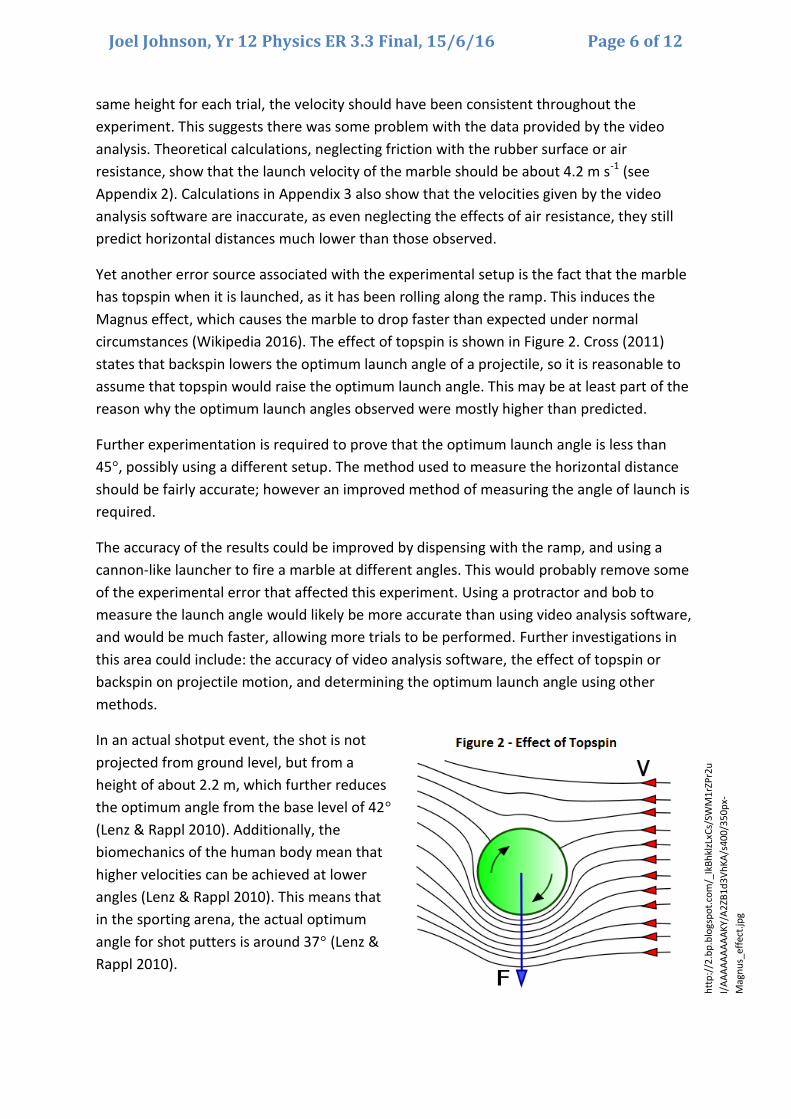
Yet another error source associated with the experimental setup is the fact that the marble
has topspin when it is launched, as it has been rolling along the ramp. This induces the
Magnus effect, which causes the marble to drop faster than expected under normal
circumstances (Wikipedia 2016). The effect of topspin is shown in Figure 2. Cross (2011)
states that backspin lowers the optimum launch angle of a projectile, so it is reasonable to
assume that topspin would raise the optimum launch angle. This may be at least part of the
reason why the optimum launch angles observed were mostly higher than predicted.
Further experimentation is required to prove that the optimum launch angle is less than
45°, possibly using a different setup. The method used to measure the horizontal distance
should be fairly accurate; however an improved method of measuring the angle of launch is
required.
The accuracy of the results could be improved by dispensing with the ramp, and using a
cannon-like launcher to fire a marble at different angles. This would probably remove some
of the experimental error that affected this experiment. Using a protractor and bob to
measure the launch angle would likely be more accurate than using video analysis software,
and would be much faster, allowing more trials to be performed. Further investigations in
this area could include: the accuracy of video analysis software, the effect of topspin or
backspin on projectile motion, and determining the optimum launch angle using other
methods.
In an actual shotput event, the shot is not
projected from ground level, but from a
height of about 2.2 m, which further reduces
the optimum angle from the base level of 42°
(Lenz & Rappl 2010). Additionally, the
biomechanics of the human body mean that
higher velocities can be achieved at lower
angles (Lenz & Rappl 2010). This means that
in the sporting arena, the actual optimum
angle for shot putters is around 37° (Lenz &
Rappl 2010).
htt
p:/
/2.b
p.b
logs
po
t.co
m/_
IkB
hkl
zLxC
s/SW
M1
rZP
r2u
I/A
AA
AA
AA
AA
KY/
A2
ZB1
d3
Vh
KA
/s4
00/3
50
px-
Mag
nu
s_ef
fect
.jpg

Joel Johnson, Yr 12 Physics ER 3.3 Final, 15/6/16 Page 7 of 12
CONCLUSION
In this experiment, the optimum launch angle for a projected marble was found to be
between 43 and 49°. This is slightly above the hypothesised optimum angle of 44. These
results are somewhat anomalous, as even when air resistance is ignored, the optimum
launch angle for a projectile is 45. This anomaly is likely due to errors in the video analysis;
however it could also be due to topspin on the marble. Further experimentation is required
to comprehensively explain the results obtained.
REFERENCES
Burrows, K, Andriessen, M, McKay, B, Mott, JB & Tacon, J 2008, Queensland physics: context
to concept, John Wiley & Sons Australia, Milton, Qld.
Cross, R 2011, ‘Ball trajectories’. Available from:
http://www.physics.usyd.edu.au/~cross/TRAJECTORIES/Trajectories.html. [6 June 2016].
Drag coefficient, n.d. Available from: http://www.engineeringtoolbox.com/drag-coefficient-
d_627.html. [18 May 2016].
International Association of Athletics Federations 2016, Shot put. Available from:
http://www.iaaf.org/disciplines/throws/shot-put. [6 June 2016].
Lenz, A & Rappl, F 2010, ‘The optimum angle of release in shot put’, arXiv. Available from:
http://arxiv.org/abs/1007.3689. [6 June 2016].
Price, RH & Romano, JD 1998, ‘Aim high and go far – optimal projectile launch angles
greater than 45°’, American Journal of Physics, vol. 66, no. 2, pp. 109 – 113. Available from:
http://www.cems.uvm.edu/~tlakoba/15_spring/math_121/1997_AJP_ProjectMotionAirResi
st.pdf. [18 May 2016].
Pyke, FS (ed.) 1991, Better coaching: advanced coaches manual, Australian Coaching Council
Incorporated, Australia.
Tracker, computer software 2015, Available from: http://physlets.org/tracker/. [19 May
2016].
Wikipedia 2016, ‘Magnus effect’. Available from:
https://en.wikipedia.org/wiki/Magnus_effect. [6 June 2016].

Joel Johnson, Yr 12 Physics ER 3.3 Final, 15/6/16 Page 8 of 12
APPENDIX 1 – Summary of Data Collected
The table below shows a summary of the data collected for this experiment. Some trials
were excluded as they were not filmed, or the marble was not dropped from a height of 1
metre.
d (mm) angle (°)
v (m/s)
B1 675 28.3 2.33
B3 685 30.2 1.6
B5 685 29.3 2
B19 300 8.5 1.54
B21 325 5.9 1.69
B23 340 5.6 1.62
B43 285 2.5 1.71
B45 275 4.5 1.66
B47 300 7.1 1.68
B49 370 11.4 1.59
B51 345 6.7 1.72
B53 370 12.5 2.07
B55 600 23 1.63
B57 600 24.8 1.73
B59 615 21.6 1.63
B61 690 24.5 1.59
B63 695 28.4 1.73
B65 695 25 1.85
B67 695 27.4 1.68
B69 715 34.3 1.64
B71 715 33.8 1.88
B73 735 33.9 1.9
B75 735 31.4 1.89
B77 760 37.1 1.51
C35 600 22.8 2.07
C37 765 36.3 2.12
C38 785 54 2.13
C39 785 33.7 2.13
C40 790 49.5 2.07
C41 755 35.3 2.11
C42 745 36 2.13
C43 775 41.8 2.14
C44 765 50.7 2.1
C45 800 45 2.02
C46 795 42 2.06
C47 800 44.9 2.06
C1 805 40 1.84
C3 785 38.3 2.1
C5 765 48 1.69
C7 770 49.8 1.96
C9 765 52 1.88
C11 695 62.7 1.82
C13 500 68 1.87
C15 250 84.2 1.64
C17 710 60 1.82
C19 800 51.8 1.97
C21 805 49.7 1.85
C23 825 42.8 1.77
C25 805 54 1.87
C27 830 45.2 1.93
C29 830 49 1.94
C31 815 51.5 1.77
C33 825 47.4 2.01

Joel Johnson, Yr 12 Physics ER 3.3 Final, 15/6/16 Page 9 of 12
APPENDIX 2 – Theoretical Launch Velocity
Assuming the rubber ramp was frictionless, the kinetic energy of the marble at the end of
the ramp should be equal to the change is gravitational potential energy. The calculations
below show that the velocity of a marble dropped from 1.00 m above ground level (which is
0.88 m above the end of the ramp) should have a velocity of 4.2 m s-1, neglecting friction.

Joel Johnson, Yr 12 Physics ER 3.3 Final, 15/6/16 Page 10 of 12
APPENDIX 3 – Theoretical Horizontal Distance
The theoretical horizontal distance of a projectile can easily be calculated, ignoring air
resistance. Using trial C1 as an example (see Appendix 1), the launch angle was 40°, the
horizontal distance was 0.805 m. The theoretical velocity calculated in Appendix 2 was 4.15
m s-1.
The launch velocity can be broken down into 2 components; ux and uy.
ux = u cos θ = 4.15 m s-1 * cos 40° = 3.18 m s-1
uy = u sin θ = 4.15 m s-1 * sin 40° = 2.67 m s-1
The time of flight can be calculated from considering the y component alone.
y = uyt + 0.5at2
0 m = (2.67 m s-1) t + 0.5(-9.8 m s-2) t2
0 = -4.9t2 + 2.67t
0 = -4.9t*(t – 0.54)
t = 0.54 seconds
Assuming the horizontal velocity stays the same, the horizontal distance can be calculated
using:
x = uxt
= 3.18 m s-1 * 0.54 s
x = 1.72 m
Using the same method, but with the measured velocity of 1.84 m s-1, the horizontal
distance will be 0.34 m.
Both calculated distances are a long way off the measured distance of 0.805 m; however
this shows that without a doubt, the velocity given by the video analysis software is
incorrect. After factoring in drag and the Magnus effect, the actual horizontal distance will
be less than that of these theoretical calculations, so the velocity for this trial can certainly
not be 1.84 m s-1.

Joel Johnson, Yr 12 Physics ER 3.3 Final, 15/6/16 Page 11 of 12
APPENDIX 4 – Air Resistance
The formula for the magnitude of the drag force acting on an object is:
Fdrag = 0.5CDv2A where CD = drag coefficient for object, = density of air, v =
speed of object through the air, and A = cross sectional area of object (Burrows et. al 2008).
The drag coefficient for the marble should be around 0.5, as that is the drag coefficient of a
sphere (Drag coefficient, n.d.). The density of air at sea level and 15C is 1.225 kg/m3
(Burrows et. al 2008); this value will be assumed for the calculation. As the radius of the
marble was approximately 11 mm, its area will be: A = r2 = *(0.011m)2 = 3.8*10-4 m2.
Using the maximum theoretical velocity of 4.15 m s-1 (Appendix 2), the drag will be:
Fdrag = 0.5CDv2A
Fdrag = 0.5*0.5*1.225 kg/m3*(4.15 m s-1)2*3.8*10-4 m2
Fdrag = 2.0*10-3 N
The drag force acting on the sphere, assuming the maximum velocity possible, will be
2.0*10-3 N.
APPENDIX 5 – Planning and Preliminary Trials
Introduction
The launch angle was chosen to be the manipulated variable, as it is the easiest variable to
alter in nearly any form of projectile motion, and has a significant effect on the horizontal
distance travelled.
Method
A marble was dropped
down a curved rubber
ramp, from a constant
height of 1.00 metres
above the ground. This
provided it with a
standard velocity.
The ramp then curved
upward and finished
nearly level2 with the
height of the sandpit.
The sandpit was
approximately 120 mm above the height of the ground.
2 The top of the ramp surface was approximately 10 mm above the level of the sandpit for most trials; this
discrepancy was ignored in the calculations.

Joel Johnson, Yr 12 Physics ER 3.3 Final, 15/6/16 Page 12 of 12
The launch angle was varied
by adjusting the steepness
of the last section of ramp,
thus changing the launch
angle of the marble.
Each trial was filmed with a
camera, and the distance
from the end of the ramp to
the first mark in the sand
was measured with a tape
measure (to the nearest 5
mm) and recorded. After
each trial, the sand was re-levelled by hand.
A 100 mm long strip of paper was taped to the side of the sandpit for use as a scale.
The videos were manually analysed using Tracker, a free video analysis tool, to
determine the angle of launch.
The setup is shown in figures 1 and 3.
Results
Video analysis was only performed on
three of the A trials, in order to ensure
that the video analysis software
worked. The results of these analyses
are shown below in Graphs 4 and 5.
Discussion
Measurable results could be obtained
from this experimental procedure;
however they were not very accurate,
as can be seen from Graph
3. To increase the accuracy
of the experiment, multiple
trials will be used.
Conclusion
The method outlined above
worked well, and can be
used for the actual
experimental work.
720
730
740
750
760
770
780
790
20 21 22 23 24 25
Graph 4 - Pilot Trial
Pilot Trial
0
100
200
300
400
500
600
700
800
900
0 20 40 60 80 100
Ho
rizo
nta
l Dis
tan
ce T
rave
lled
(m
m)
Launch Angle (°)
Graph 5 - Marble Launch Angles
Experimental Data
Pilot Trial