Embed Size (px)
Citation preview
The Oral Health of Rhode Island’s Preschool Children Enrolled in Head Start Programs
RHODE ISLAND ORAL HEALTH PROGRAM :: AUGUST 2013
2
TABLE OF CONTENTS
Summary 3
Introduction 4
Methods 5
Results 7
Comparison to Healthy People 2020 Objectives 11
Recommendations 12
References 13
Appendix and Acknowledgements 14
3
SUMMARY
In September–December 2012, the Oral Health Program at the Rhode Island Department of Health conducted
a statewide oral health screening survey of preschool children enrolled in Rhode Island’s Head Start programs.
Screenings were completed at 29 Head Start program sites with a participation rate of 33 percent among enrolled
children ages 3–5 years. Resulting estimates describe the oral health status of the state’s children in Head Start
programs with high statistical power and accuracy.
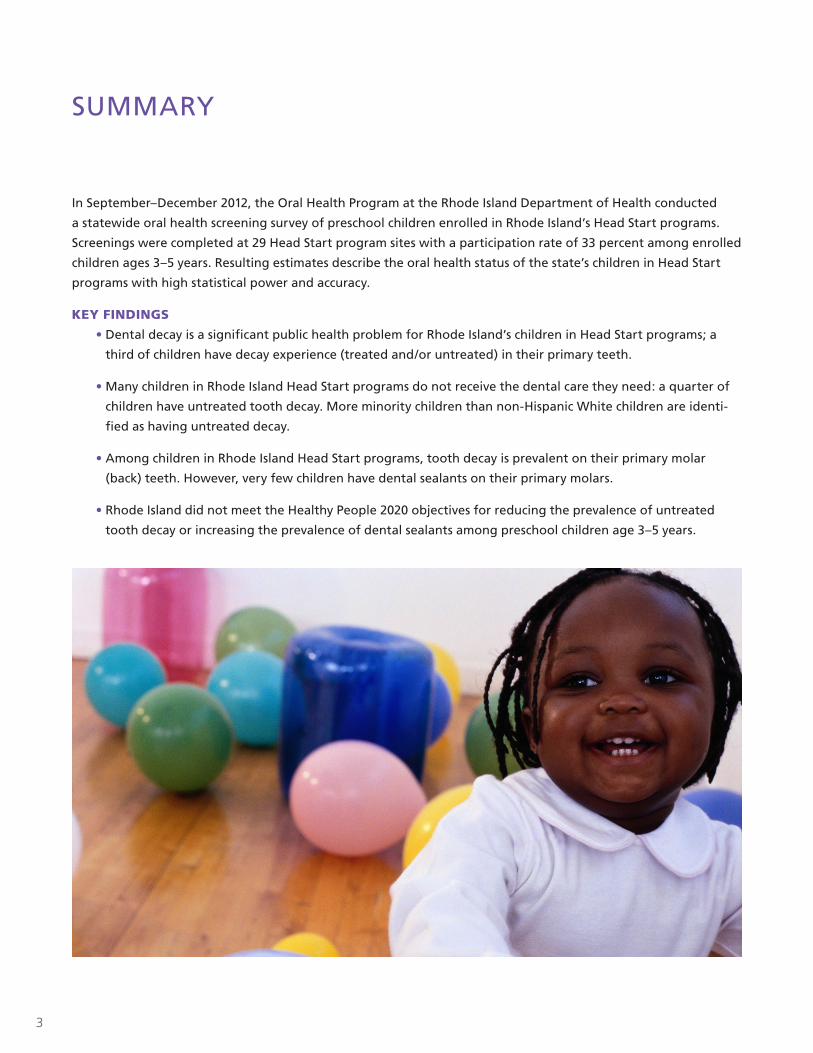
KEY FINDINGS
• Dental decay is a significant public health problem for Rhode Island’s children in Head Start programs; a
third of children have decay experience (treated and/or untreated) in their primary teeth.
• Many children in Rhode Island Head Start programs do not receive the dental care they need: a quarter of
children have untreated tooth decay. More minority children than non-Hispanic White children are identi-
fied as having untreated decay.
• Among children in Rhode Island Head Start programs, tooth decay is prevalent on their primary molar
(back) teeth. However, very few children have dental sealants on their primary molars.
• Rhode Island did not meet the Healthy People 2020 objectives for reducing the prevalence of untreated
tooth decay or increasing the prevalence of dental sealants among preschool children age 3–5 years.
4
INTRODUCTION
Tooth decay (dental caries) is a common, complex, and chronic disease resulting from an imbalance of multiple
risk factors and protective factors over time.1 Following decades of sustained community efforts, including water
fluoridation, topical fluoride regimens, and educational interventions, many children are free from tooth decay.
However, tooth decay is the single most common chronic disease of childhood, five times more common than
asthma.2
Based on the National Health and Nutrition Examination Survey (NHANES), more than a quarter of U.S. children
ages 2–5 years are reported to have early childhood caries (ECC).3 ECC affect young preschool age children and
are often characterized by severe and deep tooth decay that requires complex and expensive restorative care.
Currently, the most accurate predictor of a child’s future caries initiation and development is current or past car-
ies experience.4 Unless a young child’s ECC process is modified by appropriate and early interventions, the child’s
permanent teeth will be affected by the disease as well. A more concerning public health problem is that children
from lower income families and racial/ethnic minority groups are disproportionately affected by ECC than their
counterparts.3 Oral disease burden is likely to persist in underprivileged children throughout their school years
and negatively impact a lifetime of oral health, unless an effective measure is initiated to prevent and control
dental decay in primary teeth.
Many people do not consider tooth decay to be a serious problem, yet if ignored, the pain and disability caused
by untreated tooth decay may limit a child’s ability to focus and perform in the classroom, leading to missed
school days and falling behind their peers. Consequences of ECC include hospitalizations, emergency department
visits, increased treatment costs, poor physical development, loss of school days, increased days with restricted
activity, decreased ability to learn, and diminished oral health-related quality of life.
As a continuing surveillance effort to identify the oral health needs of Rhode Island’s children and ensure that all
Rhode Island children receive optimal oral health services, a statewide oral health screening survey of children in
Head Start programs that serve preschool children from families with low incomes was conducted by the Rhode
Island Oral Health Program in Fall 2012. A similar survey was conducted of third grade school children during the
2007-08 and 2010-2011 school years. The Oral Health of Rhode Island’s Children, 2008 and The Oral Health of
Rhode Island’s Children, 2011 documented disparities in the prevalence of tooth decay among Rhode Island third
grade children.5,6 The Program uses these data to facilitate collaborative efforts of decision makers and stake-
holders to improve oral health and reduce disparities among Rhode Island children.
5
METHODS
POPULATION AND SAMPLE
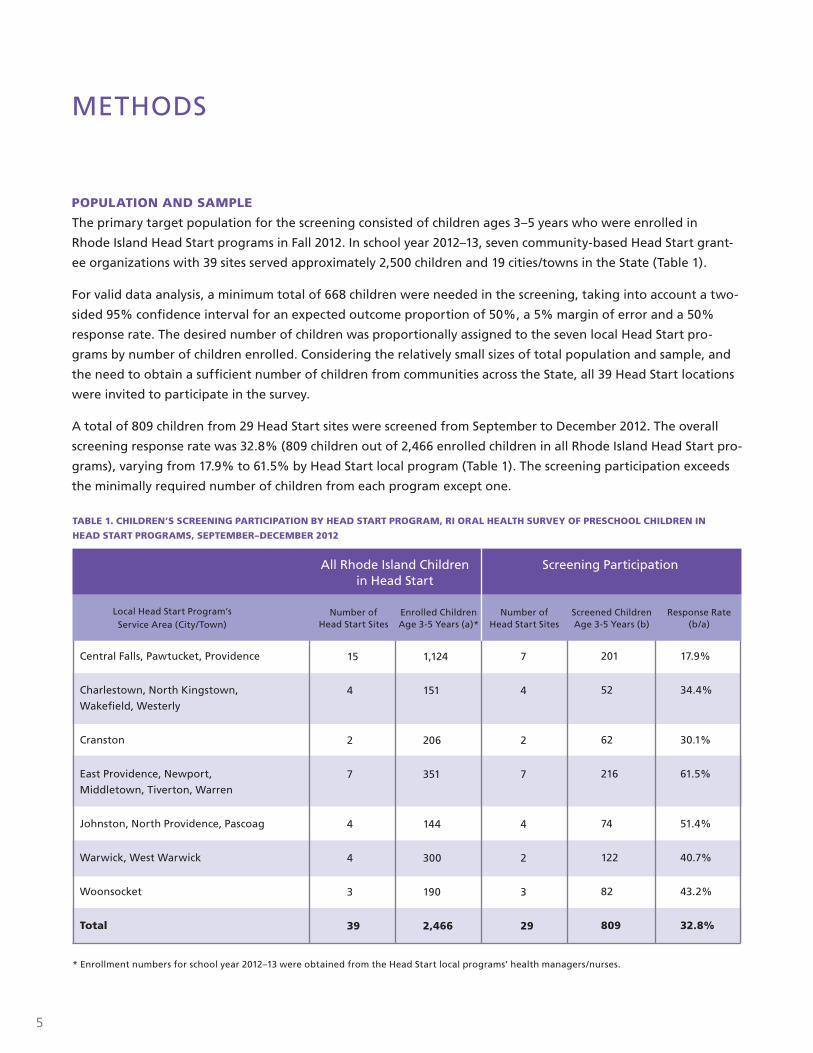
The primary target population for the screening consisted of children ages 3–5 years who were enrolled in
Rhode Island Head Start programs in Fall 2012. In school year 2012–13, seven community-based Head Start grant-
ee organizations with 39 sites served approximately 2,500 children and 19 cities/towns in the State (Table 1).
For valid data analysis, a minimum total of 668 children were needed in the screening, taking into account a two-
sided 95% confidence interval for an expected outcome proportion of 50%, a 5% margin of error and a 50%
response rate. The desired number of children was proportionally assigned to the seven local Head Start pro-
grams by number of children enrolled. Considering the relatively small sizes of total population and sample, and
the need to obtain a sufficient number of children from communities across the State, all 39 Head Start locations
were invited to participate in the survey.
A total of 809 children from 29 Head Start sites were screened from September to December 2012. The overall
screening response rate was 32.8% (809 children out of 2,466 enrolled children in all Rhode Island Head Start pro-
grams), varying from 17.9% to 61.5% by Head Start local program (Table 1). The screening participation exceeds
the minimally required number of children from each program except one.
All Rhode Island Children in Head Start
Number of Head Start Sites
Number of Head Start Sites
Screened Children Age 3-5 Years (b)
Response Rate (b/a)
Enrolled Children Age 3-5 Years (a)*
Local Head Start Program’sService Area (City/Town)
Central Falls, Pawtucket, Providence
Charlestown, North Kingstown,
Wakefield, Westerly
Cranston
East Providence, Newport,
Middletown, Tiverton, Warren
Johnston, North Providence, Pascoag
Warwick, West Warwick
Woonsocket
Total
15
4
2
7
4
4
3
39
1,124
151
206
351
144
300
190
2,466
7
4
2
7
4
2
3
29
201
52
62
216
74
122
82
809
17.9%
34.4%
30.1%
61.5%
51.4%
40.7%
43.2%
32.8%
Screening Participation
TABLE 1. CHILDREN’S SCREENING PARTICIPATION BY HEAD START PROGRAM, RI ORAL HEALTH SURVEY OF PRESCHOOL CHILDREN IN
HEAD START PROGRAMS, SEPTEMBER–DECEMBER 2012
* Enrollment numbers for school year 2012–13 were obtained from the Head Start local programs’ health managers/nurses.
6
DATA MANAGEMENT AND ANALYSIS
Screening data were entered into a customized Microsoft Access database which included edit checks for logic
and data entry errors. Analysis was completed using the survey analysis procedures in SAS 9.3. Outcome data in
this report have been weighted (adjusted) for children’s response rate by program and are presented with 95%
confidence intervals (CI). Since percentages from survey data are population estimates, the 95% CI indicates the
range of values within which the “true” value lies 95% of the time. In other words, if the same exact survey was
conducted 100 times for the same target population, the 95% CI represents the range of values that 95 of the
surveys would produce. The narrower a CI is, the closer estimation one would expect to get to that observed in
the population. Generally wider CI are due to small numbers of people in a sample. The range of prevalence, or
95% CIs, are marked in figures using vertical error bars (I).
SCREENING METHODS
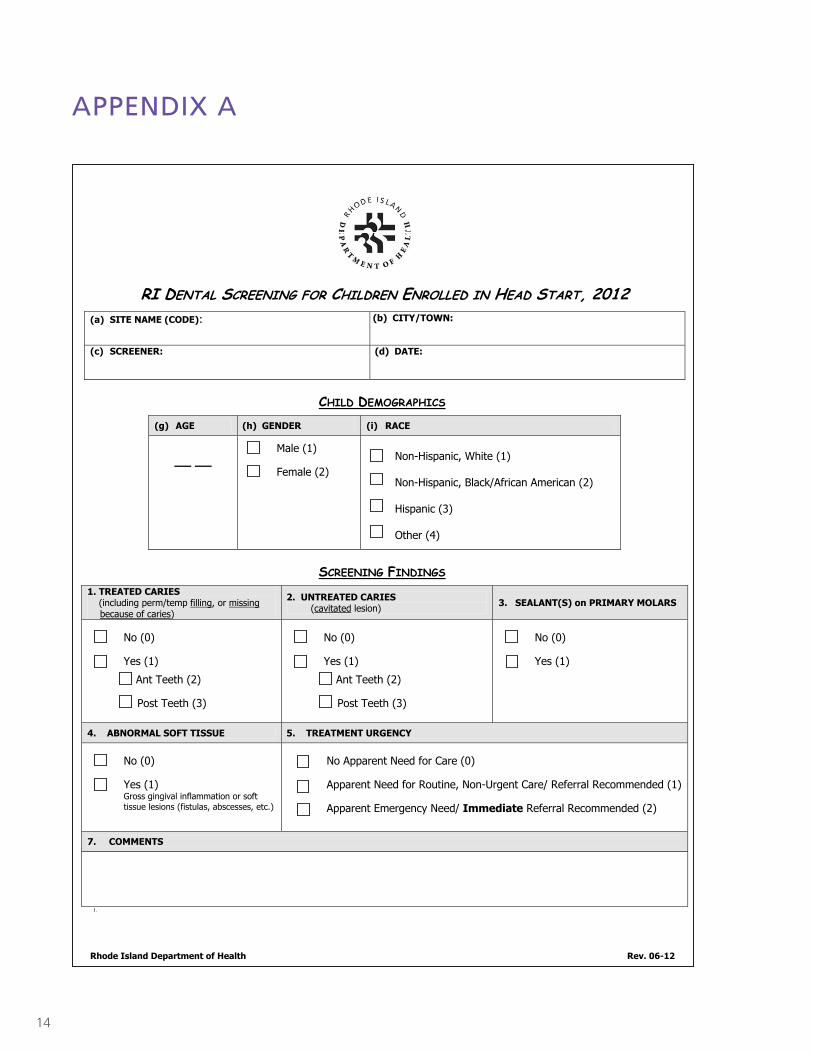
The 2012 Oral Health Screening Form for Children Enrolled in Head Start (Appendix A) was adapted from the
Basic Screening Survey developed by the Association of State and Territorial Dental Directors.7 The primary
purpose of the Basic Screening Survey is to provide a framework for obtaining oral health data that is inexpen-
sive and easy to implement, yet consistent. By collecting data in a consistent manner, communities and states can
compare their data over time and with data collected by other organizations. Surveys are cross-sectional (looking
at a population at a point in time), and descriptive (intended to determine estimates of oral health status for a
defined population). An oral health screening is not a thorough clinical examination and does not make a clinical
diagnosis resulting in a treatment plan. A screening is intended to identify gross dental or oral lesions according
to the survey guidelines.
In the survey planning stage, the Oral Health Program and Head Start programs mutually agreed on the use of
a standardized form and measurements for the Head Start dental screenings. Federal Head Start requirements
include provision of a dental examination for every child within 90 days of entry into the program.8 A total of 16
community dentists and one Oral Health Program public health dentist completed the examinations using gloves,
a light source, and disposable mouth mirrors. To ensure consistency among examiners, the dentists reviewed the
diagnostic criteria outlined in Basic Screening Surveys: An Approach to Monitoring Community Oral Health prior
to the start of the screening process.
To measure prevalence and severity of tooth decay among children, examiners assessed treated decay (presence
of fillings/crowns or teeth that have been extracted due to decay), untreated (unrestored) decay, and treatment
urgency. The screening results are likely to underestimate the percent of children with untreated or treated de-
cay, because examiners do not take radiographs (x-rays) or use dental instruments for tactile assessment of teeth.
Examiners also looked for a dental sealant on at least one primary molar tooth, an indicator of a child’s access to
preventive services. These indicators are consistent with the National Oral Health Surveillance System standards
and Healthy People 2020 oral health objectives, allowing for comparisons with other states and the nation.
Screenings were conducted anonymously; no identifying information, such as name or date of birth, was ob-
tained. Program staff provided each child’s age, while the screener or recorder determined gender and race/eth-
nicity (Non-Hispanic White, Hispanic, Black/African American, or other). If the screeners could not easily deter-
mine the race/ethnicity of the child, they were asked to code the race/ethnicity of the child as “unknown”.
7
RESULTS
Outcome data in this report have been adjusted for the response rates at each Head Start local program (Table
1). Based on the screening participation (32.8% or 809 of 2,466 children enrolled in all Rhode Island Head Start
programs), the estimates describe the oral health status of the State’s children in Head Start with high statistical
power and accuracy.
DEMOGRAPHIC CHARACTERISTICS OF CHILDREN
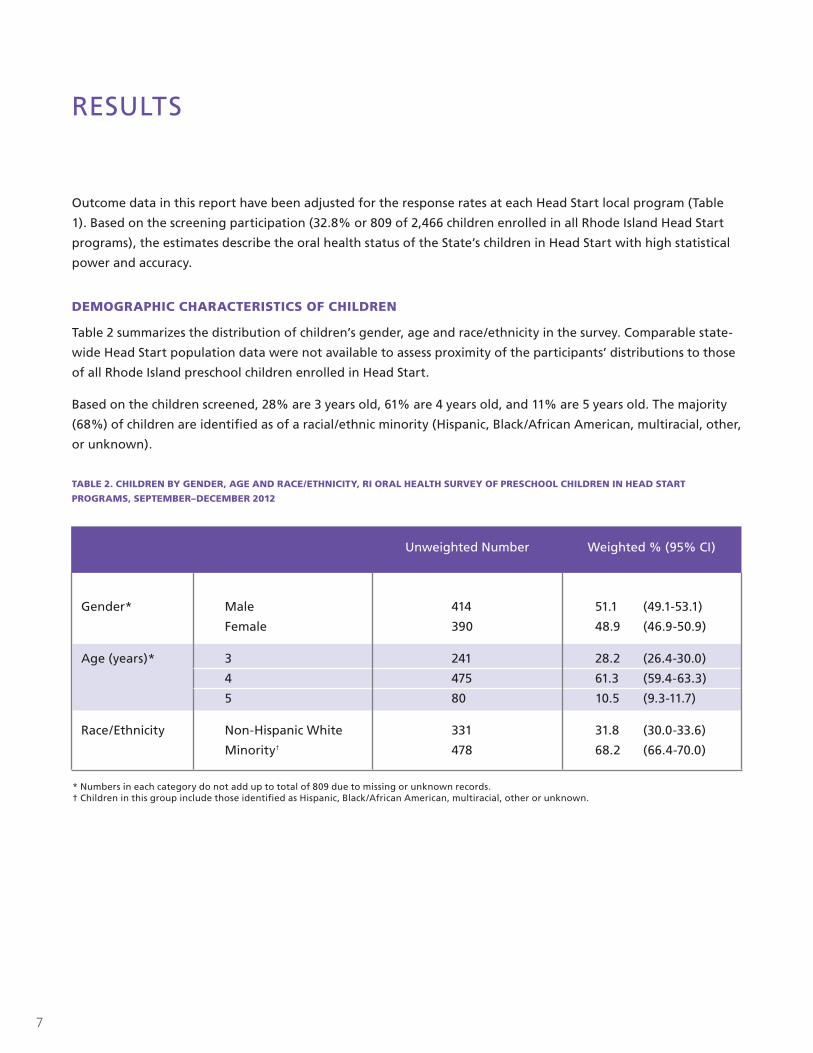
Table 2 summarizes the distribution of children’s gender, age and race/ethnicity in the survey. Comparable state-
wide Head Start population data were not available to assess proximity of the participants’ distributions to those
of all Rhode Island preschool children enrolled in Head Start.
Based on the children screened, 28% are 3 years old, 61% are 4 years old, and 11% are 5 years old. The majority
(68%) of children are identified as of a racial/ethnic minority (Hispanic, Black/African American, multiracial, other,
or unknown).
TABLE 2. CHILDREN BY GENDER, AGE AND RACE/ETHNICITY, RI ORAL HEALTH SURVEY OF PRESCHOOL CHILDREN IN HEAD START
PROGRAMS, SEPTEMBER–DECEMBER 2012
Gender* Male
Female
Age (years)* 3
4
5
Race/Ethnicity Non-Hispanic White
Minority†
414 51.1 (49.1-53.1)
390 48.9 (46.9-50.9)
241 28.2 (26.4-30.0)
475 61.3 (59.4-63.3)
80 10.5 (9.3-11.7)
331 31.8 (30.0-33.6)
478 68.2 (66.4-70.0)
Unweighted Number Weighted % (95% CI)
* Numbers in each category do not add up to total of 809 due to missing or unknown records. † Children in this group include those identified as Hispanic, Black/African American, multiracial, other or unknown.
8
Weighted %
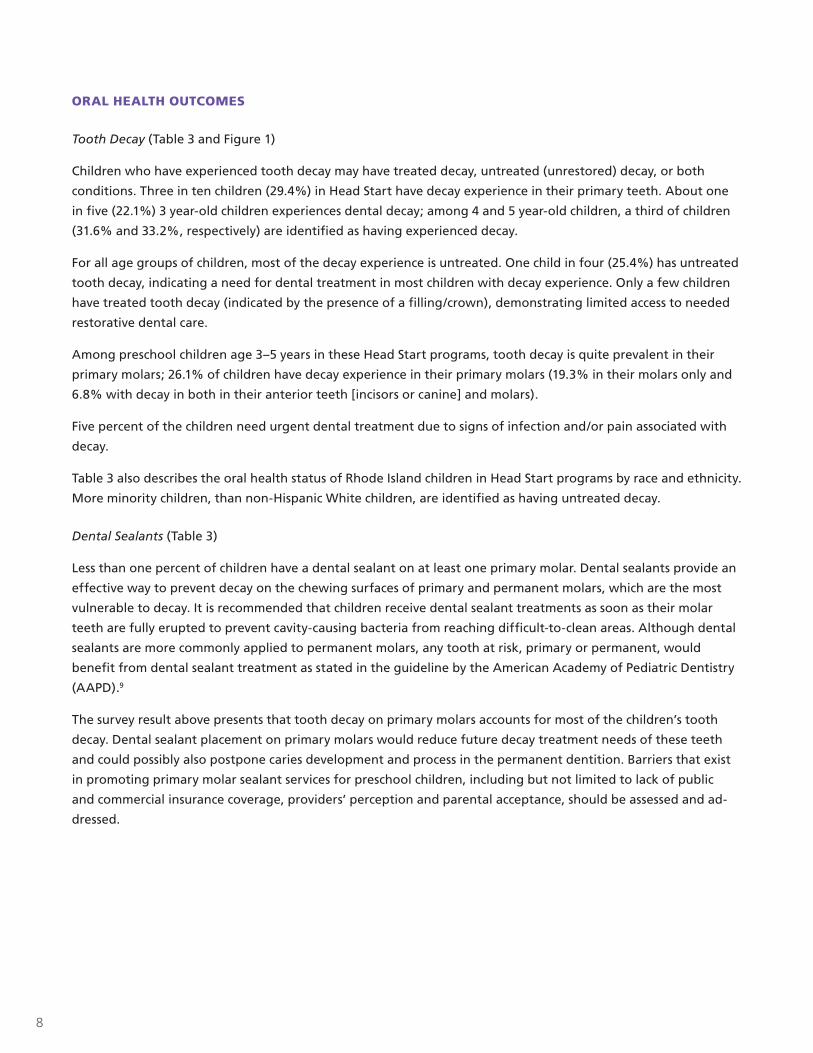
ORAL HEALTH OUTCOMES
Tooth Decay (Table 3 and Figure 1)
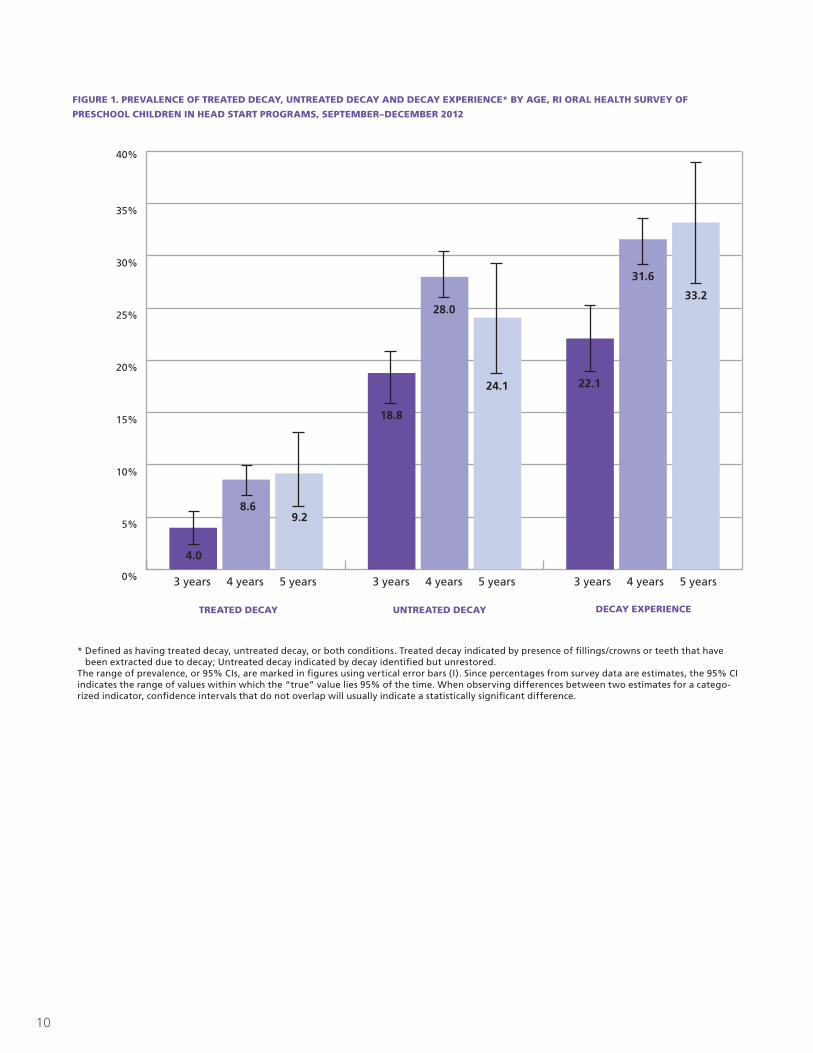
Children who have experienced tooth decay may have treated decay, untreated (unrestored) decay, or both
conditions. Three in ten children (29.4%) in Head Start have decay experience in their primary teeth. About one
in five (22.1%) 3 year-old children experiences dental decay; among 4 and 5 year-old children, a third of children
(31.6% and 33.2%, respectively) are identified as having experienced decay.
For all age groups of children, most of the decay experience is untreated. One child in four (25.4%) has untreated
tooth decay, indicating a need for dental treatment in most children with decay experience. Only a few children
have treated tooth decay (indicated by the presence of a filling/crown), demonstrating limited access to needed
restorative dental care.
Among preschool children age 3–5 years in these Head Start programs, tooth decay is quite prevalent in their
primary molars; 26.1% of children have decay experience in their primary molars (19.3% in their molars only and
6.8% with decay in both in their anterior teeth [incisors or canine] and molars).
Five percent of the children need urgent dental treatment due to signs of infection and/or pain associated with
decay.
Table 3 also describes the oral health status of Rhode Island children in Head Start programs by race and ethnicity.
More minority children, than non-Hispanic White children, are identified as having untreated decay.
Dental Sealants (Table 3)
Less than one percent of children have a dental sealant on at least one primary molar. Dental sealants provide an
effective way to prevent decay on the chewing surfaces of primary and permanent molars, which are the most
vulnerable to decay. It is recommended that children receive dental sealant treatments as soon as their molar
teeth are fully erupted to prevent cavity-causing bacteria from reaching difficult-to-clean areas. Although dental
sealants are more commonly applied to permanent molars, any tooth at risk, primary or permanent, would
benefit from dental sealant treatment as stated in the guideline by the American Academy of Pediatric Dentistry
(AAPD).9
The survey result above presents that tooth decay on primary molars accounts for most of the children’s tooth
decay. Dental sealant placement on primary molars would reduce future decay treatment needs of these teeth
and could possibly also postpone caries development and process in the permanent dentition. Barriers that exist
in promoting primary molar sealant services for preschool children, including but not limited to lack of public
and commercial insurance coverage, providers’ perception and parental acceptance, should be assessed and ad-
dressed.
9
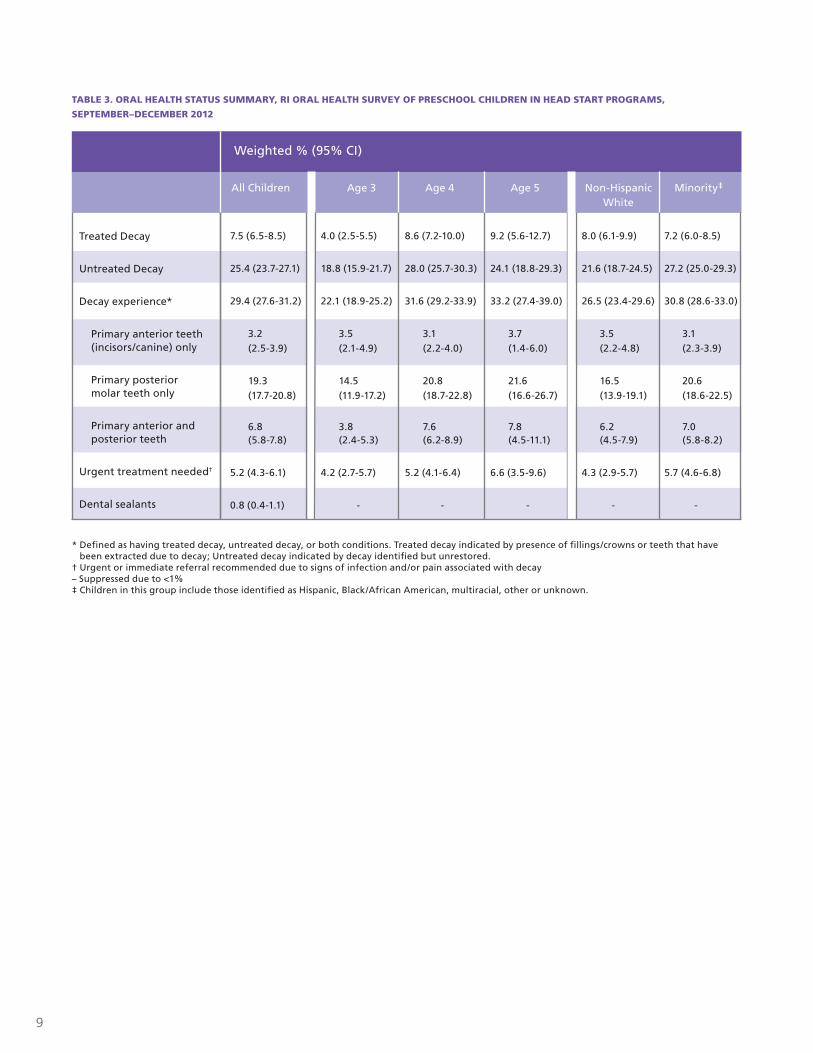
TABLE 3. ORAL HEALTH STATUS SUMMARY, RI ORAL HEALTH SURVEY OF PRESCHOOL CHILDREN IN HEAD START PROGRAMS,
SEPTEMBER–DECEMBER 2012
Treated Decay
Untreated Decay
Decay experience*
Primary anterior teeth (incisors/canine) only
Primary posterior molar teeth only
Primary anterior and posterior teeth
Urgent treatment needed†
Dental sealants
7.5 (6.5-8.5)
25.4 (23.7-27.1)
29.4 (27.6-31.2)
3.2 (2.5-3.9)
19.3 (17.7-20.8)
6.8 (5.8-7.8)
5.2 (4.3-6.1)
0.8 (0.4-1.1)
4.0 (2.5-5.5)
18.8 (15.9-21.7)
22.1 (18.9-25.2)
3.5 (2.1-4.9)
14.5 (11.9-17.2)
3.8 (2.4-5.3)
4.2 (2.7-5.7)
-
8.6 (7.2-10.0)
28.0 (25.7-30.3)
31.6 (29.2-33.9)
3.1 (2.2-4.0)
20.8 (18.7-22.8)
7.6 (6.2-8.9)
5.2 (4.1-6.4)
-
8.0 (6.1-9.9)
21.6 (18.7-24.5)
26.5 (23.4-29.6)
3.5 (2.2-4.8)
16.5 (13.9-19.1)
6.2 (4.5-7.9)
4.3 (2.9-5.7)
-
7.2 (6.0-8.5)
27.2 (25.0-29.3)
30.8 (28.6-33.0)
3.1 (2.3-3.9)
20.6 (18.6-22.5)
7.0 (5.8-8.2)
5.7 (4.6-6.8)
-
9.2 (5.6-12.7)
24.1 (18.8-29.3)
33.2 (27.4-39.0)
3.7 (1.4-6.0)
21.6 (16.6-26.7)
7.8 (4.5-11.1)
6.6 (3.5-9.6)
-
All Children Age 3 Age 4 Age 5 Non-Hispanic White
Minority‡
Weighted % (95% CI)
* Defined as having treated decay, untreated decay, or both conditions. Treated decay indicated by presence of fillings/crowns or teeth that have been extracted due to decay; Untreated decay indicated by decay identified but unrestored.
† Urgent or immediate referral recommended due to signs of infection and/or pain associated with decay – Suppressed due to <1%‡ Children in this group include those identified as Hispanic, Black/African American, multiracial, other or unknown.
10
FIGURE 1. PREVALENCE OF TREATED DECAY, UNTREATED DECAY AND DECAY EXPERIENCE* BY AGE, RI ORAL HEALTH SURVEY OF
PRESCHOOL CHILDREN IN HEAD START PROGRAMS, SEPTEMBER–DECEMBER 2012
0%
5%
10%
15%
20%
25%
30%
35%
40%
4.0
8.69.2
18.8
28.0
24.1 22.1
31.6
33.2
3 years 4 years 5 years 3 years 4 years 5 years 3 years 4 years 5 years
TREATED DECAY UNTREATED DECAY DECAY EXPERIENCE
* Defined as having treated decay, untreated decay, or both conditions. Treated decay indicated by presence of fillings/crowns or teeth that have been extracted due to decay; Untreated decay indicated by decay identified but unrestored.
The range of prevalence, or 95% CIs, are marked in figures using vertical error bars (I). Since percentages from survey data are estimates, the 95% CI indicates the range of values within which the “true” value lies 95% of the time. When observing differences between two estimates for a catego-rized indicator, confidence intervals that do not overlap will usually indicate a statistically significant difference.
11
0 5% 10% 15% 20% 25% 30% 35%
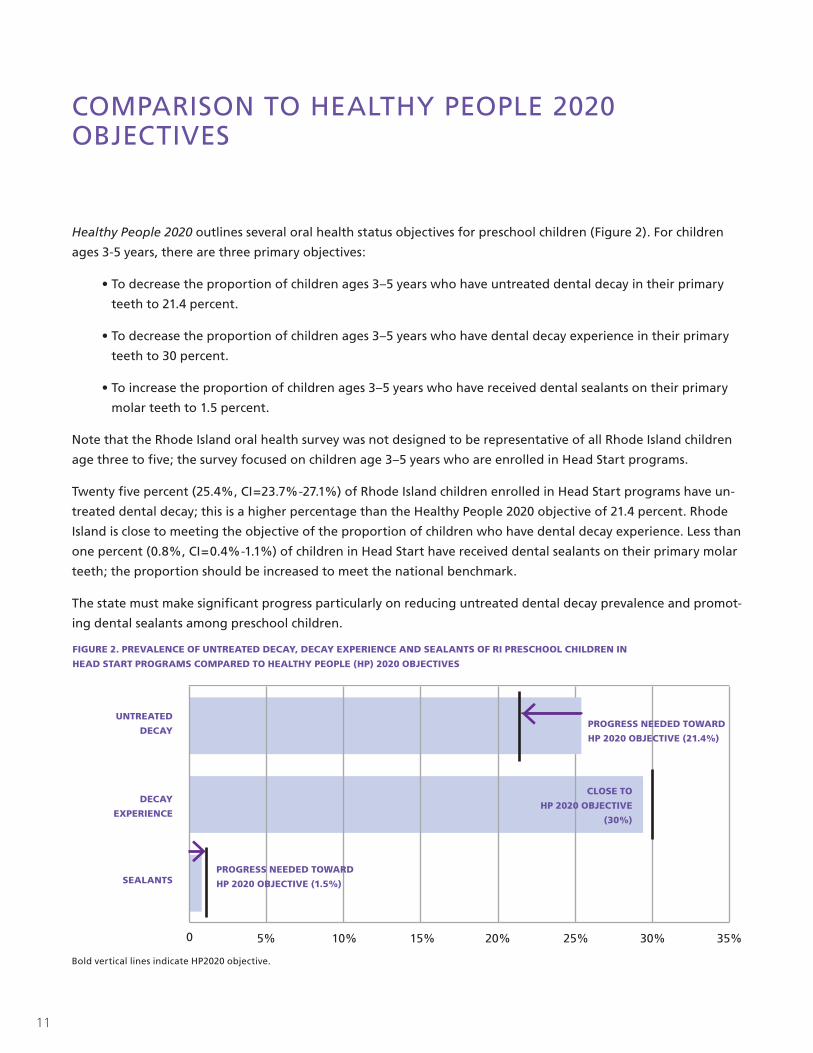
COMPARISON TO HEALTHY PEOPLE 2020 OBJECTIVES
Healthy People 2020 outlines several oral health status objectives for preschool children (Figure 2). For children
ages 3-5 years, there are three primary objectives:
• To decrease the proportion of children ages 3–5 years who have untreated dental decay in their primary
teeth to 21.4 percent.
• To decrease the proportion of children ages 3–5 years who have dental decay experience in their primary
teeth to 30 percent.
• To increase the proportion of children ages 3–5 years who have received dental sealants on their primary
molar teeth to 1.5 percent.
Note that the Rhode Island oral health survey was not designed to be representative of all Rhode Island children
age three to five; the survey focused on children age 3–5 years who are enrolled in Head Start programs.
Twenty five percent (25.4%, CI=23.7%-27.1%) of Rhode Island children enrolled in Head Start programs have un-
treated dental decay; this is a higher percentage than the Healthy People 2020 objective of 21.4 percent. Rhode
Island is close to meeting the objective of the proportion of children who have dental decay experience. Less than
one percent (0.8%, CI=0.4%-1.1%) of children in Head Start have received dental sealants on their primary molar
teeth; the proportion should be increased to meet the national benchmark.
The state must make significant progress particularly on reducing untreated dental decay prevalence and promot-
ing dental sealants among preschool children.
PROGRESS NEEDED TOWARD
HP 2020 OBJECTIVE (21.4%)
PROGRESS NEEDED TOWARD
HP 2020 OBJECTIVE (1.5%)
CLOSE TO
HP 2020 OBJECTIVE
(30%)
UNTREATED
DECAY
DECAY
EXPERIENCE
SEALANTS
FIGURE 2. PREVALENCE OF UNTREATED DECAY, DECAY EXPERIENCE AND SEALANTS OF RI PRESCHOOL CHILDREN IN
HEAD START PROGRAMS COMPARED TO HEALTHY PEOPLE (HP) 2020 OBJECTIVES
Bold vertical lines indicate HP2020 objective.
12
RECOMMENDATIONS
Based on the results of this screening, the following recommendations are suggested:
Continue collaborating with Head Start programs to share evidence-based prevention and early interven-
tion practice information and promote oral disease prevention efforts starting in early childhood. Assess and
address barriers that exist in promoting dental sealant services for preschool children.
Promote networking among the State Head Start Collaboration Office, community Head Start programs, State
Oral Health Program, State Medicaid agency, and dental professional organizations to establish dental homes
and improve age-appropriate preventive dental services (topical fluoride and dental sealants), particularly among
high-risk children, such as those enrolled in Head Start programs, RIte Smiles and/or Medicaid.
Increase the number of oral health professionals who provide care for Head Start participants enrolled in
RIte Smiles.
Facilitate Head Start program teacher and parent involvement in developing a culturally and linguistically
appropriate oral health campaign for children enrolled in Head Start and their families.
Continue to integrate Head Start oral health issues into the State Oral Health Plan and share common
agenda on early prevention strategy with stakeholders.
Continue to encourage Head Start health managers, teachers, and parents to actively participate on the
Rhode Island Oral Health Commission.
Continue oral health needs assessments and surveillance activities in collaboration with Head Start
programs, and track progress in reducing oral health disparities in Rhode Island.
13
REFERENCES
1Featherstone JD. Caries prevention and reversal based on the caries balance. Pediatr Dent. 2006; 28(2):128-32.
2 U.S. Department of Health and Human Services. Oral Health in America: A Report of the Surgeon General. Rockville, MD: U.S. Department of Health and Human Services, National Institutes of Health, National Institute of Dental and Craniofacial Research, 2000.
3 Dye BA, Tan S, Smith V, Lewis BG, Barker LK, Thorton-Evans G, et al. Trends in Oral Health Status: United States, 1998-1994 and 1999-2004. National Center for Health Statistics. Vital Health Stat 11(248), 2007.
4 American Academy of Pediatric Dentistry (AAPD). Guideline on caries-risk assessment and management for infants, children and adolescents. Chicago (IL): American Academy of Pediatric Dentistry (AAPD), 2011.
5The Oral Health of Rhode Island’s Children (2008). Rhode Island Department of Health. Providence RI. April 2008.
6The Oral Health of Rhode Island’s Children (2012). Rhode Island Department of Health. Providence RI. February 2012.
7 Association of State and Territorial Dental Directors Association (ASTDD). Basic Screening Surveys: An Approach to Monitoring Community Oral Health. December 2008.
8 Administration of Children and Family Office of Health Start, U.S. Department of Health and Human Services. Head Start Program Performance Standards and Other Regulations.
9 American Academy of Pediatric Dentistry (AAPD). Guideline on pediatric restorative dentistry. Chicago (IL): American Academy of Pediatric Dentistry (AAPD), 2012.
14
APPENDIX A
RI DENTAL SCREENING FOR CHILDREN ENROLLED IN HEAD START, 2012
(a) SITE NAME (CODE): (b) CITY/TOWN:
(c) SCREENER: (d) DATE:
CHILD DEMOGRAPHICS (g) AGE (h) GENDER (i) RACE
__ __ Male (1)
Female (2)Non-Hispanic, White (1)
Non-Hispanic, Black/African American (2)
Hispanic (3)
Other (4)
SCREENING FINDINGS 1. TREATED CARIES (including perm/temp filling, or missing
because of caries)
2. UNTREATED CARIES (cavitated lesion) 3. SEALANT(S) on PRIMARY MOLARS
No (0)
Yes (1)
Ant Teeth (2)
Post Teeth (3)
No (0)
Yes (1)
Ant Teeth (2)
Post Teeth (3)
No (0)
Yes (1)
4. ABNORMAL SOFT TISSUE 5. TREATMENT URGENCY
No (0)
Yes (1) Gross gingival inflammation or soft tissue lesions (fistulas, abscesses, etc.)
No Apparent Need for Care (0)
Apparent Need for Routine, Non-Urgent Care/ Referral Recommended (1)
Apparent Emergency Need/ Immediate Referral Recommended (2)
7. COMMENTS
1.
Rhode Island Department of Health Rev. 06-12
15
ACKNOWLEDGEMENTS
We would like to thank our partners: Rhode Island Department of Human Services Head Start State Collaboration
Office, Head Start local programs’ directors and health managers/ nurses, classroom teachers at participant Head
Start sites, community dentists, and parents/guardians for assisting us in completing this survey.
The children’s oral health survey and development of this report were supported through the cooperative
agreement PA #08-802 between the Rhode Island Department of Health Oral Health Program and the Centers
for Disease Control and Prevention.
The report was authored by:
Junhie Oh, BDS, MPH, Oral Health Epidemiologist/Evaluator
Laurie Leonard, MS, Oral Health Program Director
Deborah Fuller, DMD, MS, Public Health Dentist
3 CAPITOL HILL, CANNON BUILDING, PROVIDENCE, RHODE ISLAND 02908 :: www.health.ri.gov