Embed Size (px)
Citation preview

c04_1 12/02/2008 126
4
THE ORIGIN OF BIOPOTENTIALSJohn W. Clark Jr.
This chapter deals with the genesis of various bioelectric signals that arerecorded routinely in modern clinical practice. Given adequate monitoringequipment, many forms of bioelectric phenomena can be recorded with relativeease. These phenomena include the electrocardiogram (ECG), electroence-phalogram (EEG), electroneurogram (ENG), electromyogram (EMG), andelectroretinogram (ERG).
Engineers generally have a good physical insight into the nature ofelectromagnetic fields produced by bioelectric sources, and, because of theircomprehensive understanding of the physical problem, they may contribute tothe solution of biological problems.
This chapter begins by introducing bioelectric phenomena at the cellularlevel. It proceeds to discuss volume-conductor potential distributions of simplebioelectric sources, and gradually more anatomically complex ones. Thevolume-conductor electric field problem provides the link (mapping) betweenmicroscopic electrical activity generated within the bioelectric source, the flowof action current through the conducting medium, and the macroscopic poten-tial distribution produced at the surface of the body. We continue with adiscussion of the functional organization of the peripheral nervous system(outside the brain and spinal cord), which leads to a discussion of the ENG andEMG. Finally, other bioelectric sources (and associated field potentials) arediscussed including the active heart (ECG), retina (ERG), and brain (EEG).
4.1 ELECTRICAL ACTIVITY OF EXCITABLE CELLS
Bioelectric potentials are produced as a result of electrochemical activity of acertain class of cells, known as excitable cells, that are components of nervous,muscular, or glandular tissue. Electrically they exhibit a resting potential and, whenappropriately stimulated, an action potential, as the following paragraphs explain.
THE RESTING STATE
The individual excitable cell maintains a steady electrical potential differencebetween its internal and external environments. This resting potential of the
126

c04_1 12/02/2008 127
internal medium lies in the range �40 to �90 mV, relative to the externalmedium.
Figure 4.1(a) shows how the resting potential is usually measured. Amicromanipulator advances a microelectrode (see Section 5.8) close to thesurface of an excitable cell and then, by small movements, pushes it throughthe cell membrane. For the membrane to seal properly around the penetratingtip, the diameter of the tip must be small relative to the size of the cell in whichit is placed. Figure 4.1(b) shows a typical electrical recording from a singlenerve fiber, including the dc offset potential (resting potential) that occursupon penetration of the membrane. It also shows the transient disturbance ofmembrane potential (the action potential) when an adequate stimulus is given.
The cell membrane is a very thin (7 to 15 nm) lipoprotein complex that isessentially impermeable to intracellular protein and other organic anions ðA�Þ.The membrane in the resting state is only slightly permeable to Naþ and rather
Figure 4.1 Recording of action potential of an invertebrate nerve axon (a) Anelectronic stimulator supplies a brief pulse of current to the axon, strongenough to excite the axon. A recording of this activity is made at a downstreamsite via a penetrating micropipette. (b) The movement artifact is recorded asthe tip of the micropipette drives through the membrane to record restingpotential. A short time later, an electrical stimulus is delivered to the axon; itsfield effect is recorded instantaneously at downstream measurement site as thestimulus artifact. The action potential however, proceeds along the axon with aconstant conduction velocity. The time period L is the latent period ortransmission time from stimulus to recording site.
4 . 1 E L E C T R I C A L A C T I V I T Y O F E X C I T A B L E C E L L S 127

c04_1 12/02/2008 128
freely permeable to Kþ and Cl�. The permeability of the resting membrane topotassium ion ðPKÞ is approximately 50 to 100 times larger than its perme-ability to sodium ion ðPNaÞ.
Typically, the Kþ concentration of the internal medium (cytosol) is 140mmol/liter, whereas that of the external (bathing) medium is 2.5 mmol/liter.The concentration difference creates a diffusion gradient that is directedoutward across the membrane. The movement of the Kþ along this diffusiongradient (while the nondiffusible anion component stays within the cell) is insuch a direction as to make the interior of the cell more negative relative to theexternal medium (that is, positive charge is removed from the interior).Consequently, a transmembrane potential difference is established. Electri-cally the membrane can be described as a leaky capacitor, since structurally it iscomprised of a thin dielectric material (the lipoprotein complex) that acts as acharge separator, and yet it has transmembrane ion channels (pores) ofdifferent types, some of which allow a leakage flow of ions across themembrane at rest. The electric field supported by the membrane capacitorat rest is directed inward from positive to negative across the membrane. Ittends to inhibit the outward flow of positively charged ions (such as Kþ), as wellas the inward flow of negatively charged ions (such as Cl�). Thus thediffusional and electrical forces acting across the membrane are opposed toone another, and a balance is ultimately achieved. The membrane potential atwhich such an equilibrium occurs (considering Kþ to be the main ionic speciesinvolved in the resting state; that is, PK�PNa) is called the equilibriumpotential for the KþðEKÞ. It is measured in volts and is calculated from theNernst equation,
EK ¼RT
nFln
K½ �oK½ �i¼ 0:0615 log10
K½ �oK½ �i
Vð Þ (4.1)
at 37 �C (body temperature). Here n is the valence of the Kþ, [K]i and [K]o arethe intracellular and extracellular concentrations of Kþ in moles per liter,respectively, R is the universal gas constant (Appendix), T is absolute tem-perature in K, and F is the Faraday constant (Appendix). Equation (4.1)provides a reasonably good approximation to the potential of the restingmembrane, which indicates that the resting membrane is effectively a potas-sium membrane. A more accurate expression for the membrane equilibriumpotential E, which accounts for the influence of other ionic species in theinternal and external media was first developed by Goldman (1943) and latermodified by Hodgkin and Katz (1949), who assumed a constant electric fieldacross the membrane:
E ¼ RT
Fln
PK½K�o þ PNa½Na�o þ PCl½Cl�iPK K½ �iþPNa Na½ �iþPCl Cl½ �o
� �(4.2)
Here E is the equilibrium transmembrane (resting) potential when net currentthrough the membrane is zero and PM is the permeability coefficient of the
128 4 T H E O R I G I N O F B I O P O T E N T I A L S

c04_1 12/02/2008 129
membrane for a particular ionic species M. It is called the Goldman–Hodgkin–Katz (GHK) formulation.
EXAMPLE 4.1 For frog skeletal muscle, typical values for the intracellularand extracellular concentrations of the major ion species (in millimoles perliter) are as follows.
Assuming room temperature (20 �C) and typical values of permeability co-efficient for frog skeletal muscle (PNa ¼ 2� 10�8 cm/s, PK ¼ 2� 10�6 cm/s, andPCl ¼ 4� 10�6 cm/s), calculate the equilibrium resting potential for this mem-brane, using the Goldman equation.
ANSWER From (4.2),
E ¼ 0:0581 log10
PK 4ð Þ þ PNa 145ð Þ þ PCl 4ð ÞPK 155ð Þ þ PNa 12ð Þ þ PCl 120ð Þ
� �
¼ 0:0581 log10
26:9� 10�6
790:24� 10�6
� �¼ �85:3 mV
which is close to typical measured values for the resting membrane potential infrog skeletal muscle.
Maintaining the steady-state ionic imbalance between the internal andexternal media of the cell requires continuous active transport of ionic speciesagainst their electrochemical gradients. The active transport mechanism islocated within the membrane and is referred to as the sodium–potassiumpump. It actively transports Naþ out of the cell and Kþ into the cell in the ratio3Naþ : 2Kþ. The associated pump current iNaK is a net outward current thattends to increase the negativity of the intracellular potential. Energy for thepump is provided by a common source of cellular energy, adenosine tri-phosphate (ATP) produced by mitochondria in the cell.
Thus the factors influencing the flow of ions across the membrane are(1) diffusion gradients, (2) the inwardly directed electric field, (3) membranestructure (availability of pores), and (4) active transport of ions against anestablished electrochemical gradient. The charge separated by the cell membraneand the structure of this membrane (PK, PNa, PCl) account for the resting potential.Kþ diffuses outwardly according to its concentration gradient, whereas thenondiffusible organic anion component remains within the cell, creating apotential difference across the membrane. Electroneutrality is maintained withinthe bulk internal and external media, but due to the membrane capacitance, there
Species Intracellular Extracellular
Naþ 12 145Kþ 155 4Cl� 4 120
4 . 1 E L E C T R I C A L A C T I V I T Y O F E X C I T A B L E C E L L S 129

c04_1 12/02/2008 130
is a monolayer of cations distributed on the outer membrane surface and amonolayer of anions along the inner surface. The number of ions responsible forthe membrane potential, however, is very small relative to the total numberpresent in the bulk media. The Naþ influx does not compensate for the Kþ effluxbecause, in the resting state, PNa�PK. Chloride ion diffuses inward down itsconcentration gradient, but its movement is balanced by the electrical gradient.
EXAMPLE 4.2 The giant axon of the squid is frequently used in electro-physiological investigations because of its size. Typically it has a diameter of1000 mm, a membrane thickness of 7.5 nm, a specific membrane capacity of1 mF/cm2, and a resting transmembrane potential vm of 70 mV. Assume auniform field within the membrane and calculate the magnitude and direc-tion of the electric field intensity E within the membrane.
ANSWER The membrane is quite thin, serves as a charge separator, and canbe represented by a parallel-plate capacitor with E directed inward.
E ¼ vm
d¼ 70� 10�3
7:5� 10�9¼ 9:33� 106 V/m
THE ACTIVE STATE
Another property of an excitable cell is its ability to conduct an action potential[Figure 4.1(b)] when adequately stimulated. An adequate stimulus is one thatbrings about the depolarization of a cell membrane that is sufficient to exceedits threshold potential and thereby elicit an all-or-none action potential (brieftransient disturbance of the membrane potential), which travels in an un-attenuated fashion and at a constant conduction velocity along the membrane.Because of the steady resting potential, the cell membrane is said to bepolarized. A lessening of the magnitude of this polarization is called de-polarization, whereas an increase in magnitude is referred to as hyper-polarization. The all-or-none property of the action potential means thatthe membrane potential goes through a very characteristic cycle: a changein potential from the resting level of a certain amount for a fixed duration oftime. For a nerve fiber, Dv ffi 120 mV and the duration is approximately 1 ms.Further increases in intensity or duration of stimulus beyond that required forexceeding the threshold level produce only the same result.
The origin of the action potential lies in the voltage- and time-dependentnature of the membrane permeabilities (or equivalently, in electrical terms,membrane conductivities) to specific ions, notably Naþ and Kþ. As thetransmembrane potential (vm) is depolarized, the membrane permeability tosodium PNa (or, equivalently, the conductance of the membrane to sodiumgNa) is significantly increased. As a result, Naþ rushes into the internal mediumof the cell, bringing about further depolarization, which in turn brings about afurther increase in gNa (i.e., gNa is dependent on transmembrane potential). Ifthe membrane potential threshold is exceeded, this process is self-regenerative
130 4 T H E O R I G I N O F B I O P O T E N T I A L S

c04_1 12/02/2008 131
and leads to runaway depolarization. Under these conditions, vm tends toapproach the equilibrium Nernst potential of sodium, ENa, which has a value ofabout þ60 mV.
However, vm never achieves this level because of two factors: (1) gNa is notonly voltage dependent but also time dependent, and (as shown in Figure 4.2) itis relatively short-lived compared with the action potential. (2) There is adelayed increase in gK that acts as a hyperpolarizing influence, tending torestore vm to resting levels (Figure 4.2). As vm ultimately returns to the restinglevel, gK is still elevated with respect to its resting value and returns slowlyalong an exponential time course. Since Kþ continue to leave the cell duringthis time, the membrane hyperpolarizes and an undershoot is produced in thetransmembrane potential waveform (vm).
The calculated gNa and gK waveforms of Figure 4.2 are based on voltage-clamp data from squid axon. In voltage-clamp experiments, transmembranepotential vm is held at prescribed levels via a negative-feedback control circuit.
Figure 4.2 Model-generated transmembrane potential ðvmÞ and membraneionic conductance changes for sodium (gNa) and potassium (gK) during theaction potential. These waveforms are obtained by solving the differentialequations developed by Hodgkin and Huxley for the giant axon of the squid ata bathing medium temperature of 18:5 �C. ENa and EK are the Nernstequilibrium potentials for Naþ and Kþ across the membrane. (Modifiedfrom A. L. Hodgkin and A. F. Huxley, ‘‘A quantitative description ofmembrane current and its application to conduction and excitation in nerve.’’Journal of Physiology, 1952, 117, 530.)
4 . 1 E L E C T R I C A L A C T I V I T Y O F E X C I T A B L E C E L L S 131

c04_1 12/02/2008 132
Membrane currents in response to step changes in vm are studied in order todetermine the voltage- and time-dependent nature of gNa and gK.
Figure 4.3 shows a network equivalent circuit describing the electricalbehavior of a small unit area of membrane. The entire nerve axon membranecan be characterized in a distributed fashion by utilizing an iterative structureof this same basic form.
EXAMPLE 4.3 Suppose that the electrical properties of an elongatedexcitable cell of cylindrical geometry (such as a nerve or skeletal musclefiber) can be modeled fairly accurately with a distributed parameter ‘‘cable’’model such as that of Figure 4.3. What should the temporal-membranepotential response to brief square pulses of stimulating current look like atsome fixed distance from a particular stimulating electrode? As the separa-tion distance between the particular stimulating electrode and the exploringmicropipette is progressively increased, in what manner should the amplitudeof the subthreshold response change?
ANSWER Figure 4.3 shows that each section of the distributed parametermodel forms an R–C low-pass filter. Multiple sections form multiple low-pass
Figure 4.3 Diagram of network equivalent circuit of a small length (DDz) of a
cylindrical cell (unmyelinated nerve fiber or skeletal muscle fiber) The mem-brane proper is characterized by specific membrane capacitance Cm (mF/cm2)and specific membrane conductances gNa, gK, and gCl in millisiemens/cm2 (mS/cm2). Here an average specific leakage conductance is included that corre-sponds to ionic current from sources other than Naþ and Kþ (e.g., Cl�). Thisterm is usually neglected. The cell cytoplasm is considered simply resistive, as isthe external bathing medium; these media may thus be characterized by theresistance per unit length ri, and ro (V/cm), respectively. Here im is thetransmembrane current per unit length (A/cm), and vi and vo are the internaland external potentials at point z, respectively. Transmembrane potential ateach point in z is given by vm ¼ vi � vo. (Modified from A. L. Hodgkin and A. F.Huxley, ‘‘A quantitative description of membrane current and its application toconduction and excitation in nerve.’’ Journal of Physiology, 1952, 117, 501.)
132 4 T H E O R I G I N O F B I O P O T E N T I A L S

c04_1 12/02/2008 133
filters. Thus the response due to the stimulating square-wave pulse is progres-sively smoothed and attenuated as the separation distance increases.
When an excitable membrane produces an action potential in response toan adequate stimulus, the ability of the membrane to respond to a secondstimulus of any sort is markedly altered. During the initial portion of the actionpotential, the membrane cannot respond to any stimulus, no matter howintense. This interval is referred to as the absolute refractory period. It isfollowed by the relative refractory period, wherein an action potential can beelicited by an intense superthreshold stimulus (Figure 4.2). The existence ofthe refractory period produces an upper limit to the frequency at which anexcitable cell may be repetitively discharged. For example, if a nerve axon hasan absolute refractory period of 1 ms, it has an upper limit of repetitivedischarge of less than 1000 impulses/s.
For an action potential propagating along a single unmyelinated nervefiber, the region of the fiber undergoing a transition into the active state (theactive region) at an instant of time is usually small relative to the length of thefiber. Figure 4.4(a) shows schematically the charge distribution along the fiber
Figure 4.4 (a) Charge distribution in the vicinity of the active region of anunmyelinated fiber conducting an impulse. (b) Local circuit current flow in themyelinated nerve fiber.
4 . 1 E L E C T R I C A L A C T I V I T Y O F E X C I T A B L E C E L L S 133

c04_1 12/02/2008 134
in the vicinity of the active region. Note that the direction of propagation of theaction potential (considered frozen in time) is to the left, and the membranelying ahead of the active region is polarized, as in the resting state. A reversalof polarity is shown within the active region because of depolarization of themembrane to positive values of potential. The membrane lying behind theactive zone is repolarized membrane.
From the indicated charge distribution, solenoidal (closed-path) currentflows in the pattern shown in Figure 4.4(a). In the region ahead of the activezone, the ohmic potential drop across the membrane caused by this solenoidalcurrent flowing outward through the membrane is of such a polarity as toreduce the magnitude of vm i.e., depolarize the membrane. When vm isdepolarized to the threshold level (about 20 mV more positive than the restingpotential), this region becomes activated as well. The same current patternflowing behind the active region is ineffective in re-exciting the membrane,which is in the refractory state. The nature of this process is therefore self-excitatory, each new increment of membrane being brought to the thresholdlevel by lines of current from the active source region. The membrane stays inthe active state for only a brief period of time and ultimately repolarizescompletely. In this way, the action potential propagates down the length of thefiber in an unattenuated fashion, the signal being built up at each point alongthe way.
Most neurons in invertebrates are unmyelinated, but most vertebrateneurons are myelinated. That is, the axon is insulated by a sheath of myelin,a lipoprotein complex formed from successive wrappings of the axon by aspecial support cell found along nerve fibers. In peripheral nerves—those thatlie outside the central nervous system (CNS)—this support cell is known as aSchwann cell. In myelinated CNS neurons, this function is served by a specialglial cell known as an oligodendrogliocyte. The myelin sheath is interrupted atregular intervals (1 to 2 mm, depending on the species) by nodes of Ranvier; asingle Schwann cell thus provides the insulating myelin sheath covering of theaxon between two successive nodes of Ranvier [Figure 4.4(b)]. The tightlywrapped membranes of the Schwann cell closely adhere to the axon membraneand increase its thickness by a factor of 100. This substantially decreases thecapacitance of the modified membrane and increases the transverse impedanceto current flow in the internodal region of the fiber. Sodium ion channels aredistributed in a nonuniform manner in myelinated fibers, being denselyclustered at the nodes of Ranvier and very sparsely distributed in the inter-nodal region. Multiple types of potassium channels (fast-gated, slow-gated) aredistributed in the paranodal regions lying adjacent to each node of Ranvier.These channels are distributed to a lesser extent throughout the remainder ofthe internodal region in both amphibian and mammalian species.
Once the myelinated nerve fiber is activated, conduction proceeds througha process of local circuit current flow, much as in the case of the unmyelinatednerve fiber described earlier [Figure 4.4(a)]. There are differences, however, inthat the sources for action current flow are localized at the nodes of Ranvierand are therefore not uniformly distributed along the axonal membrane, as in
134 4 T H E O R I G I N O F B I O P O T E N T I A L S

c04_1 12/02/2008 135
the case of the unmyelinated fiber. Myelination of the internode reducesleakage currents, decreases membrane capacitance, and improves the trans-mission properties of the cable-like myelinated fiber. Local circuit currentsemanating from an active node have an exponentially diminishing magnitudeover an axial distance spanning several internodal lengths. Accordingly, theycontribute to a drop in nodal potential as current passes outward through agiven inactive nodal membrane [Figure 4.4(b)].
Thus myelinated nerve fiber conduction proceeds via rapid, sequentialactivation of the nodes of Ranvier, and local circuit current provides theunderlying mechanism for bringing the nodal membrane voltage to threshold.This process is frequently called saltatory conduction (from the Latin saltare,‘‘to leap or dance’’), because action potentials appear to leap from node tonode. For an axon of a given diameter, myelination improves the conductionrate by a factor of approximately 20. By reason of its structure, the myelinatednerve fiber represents a more complicated bioelectric action current sourcethan the unmyelinated nerve fiber. Mathematical modeling studies of conduc-tion in both unmyelinated and myelinated nerve fibers have appeared in theliterature (Moore et al., 1978; Waxman and Brill, 1978; Halter and Clark, 1991;Moffit et al., 2004).
4.2 VOLUME-CONDUCTOR FIELDS
A fundamental problem in electrophysiology is that of the single active cellimmersed in a volume conductor (a salt solution simulating the composition ofbody fluids). A study of this simple problem lends considerable insight intoother, more complex volume-conductor-field problems, including the ENG,EMG, and ECG.
The problem consists of two parts: (1) the bioelectric source and (2) itsbathing medium or electrical load. The bioelectric source is the active cell,which behaves electrically as a constant-current source, delivering its sole-noidal activation current to the resistive bathing medium over a large rangeof loading conditions. We consider the single active unmyelinated nerve fiber(bioelectric source) bathed by a volume conductor (specific resistivity r)whose dimensions are large relative to the spatial extent of the electric fieldsurrounding the nerve fiber (infinite volume conductor). The lines of sole-noidal current flow emanating from the active fiber into the bathing mediumand returning to the fiber are indicated schematically in Figure 4.4(a). Thispattern of current flow is consistent with the charge distribution shown inFigure 4.4(a).
We assume that the action potential travels down the fiber at a constantconduction velocity. Hence, the temporal waveform vm(t) can be convertedeasily to a spatial distribution vm(z), where z is the axial distance along thefiber. For a simple monophasic action potential, the associated potentialwaveform at the outer surface of the membrane is (1) triphasic in nature,
4 . 2 V O L U M E - C O N D U C T O R F I E L D S 135

c04_1 12/02/2008 136
(2) of greater spatial extent than the action potential, and (3) much smaller inpeak-to-peak magnitude. The magnitude of the field potential in a largebathing medium falls off exponentially with increasing radial distance fromthe active fiber (potential zero within fifteen fiber radii). Field potentialmagnitude at the fiber surface depends on the amount of active cell membranesurface area (bioelectric source) contributing to the signal and is usually on theorder of tens of microvolts (mV).
Changes in the properties of the volume conductor can also have aneffect on the field potential magnitude. If its specific resistivity (r) isincreased, the magnitude of the field potential measured at the outermembrane surface increases, as it would if the volume conductor is madesmaller. In each case, the extracellular load resistance to current flow fromthe constant action current generator (membrane) is greater. From Ohm’slaw, potential is increased [by changing material properties of volumeconductor (r) or its dimensions].
If instead, we consider the source to be an active nerve trunk with itsthousands of component nerve fibers simultaneously activated, the extracel-lular field potential recorded in an infinite homogeneous bathing medium canappear quite similar to the triphasic response of the single fiber [Figure 4.5(b)].
Figure 4.5 Extracellular field potentials (average of 128 responses) wererecorded at the surface of an active (1 mm-diameter) frog sciatic nervein an extensive volume conductor. The potential was recorded with (a)both motor and sensory components excited ðSm þ SsÞ, (b) only motornerve components excited (Sm), and (c) only sensory nerve componentsexcited (Ss).
136 4 T H E O R I G I N O F B I O P O T E N T I A L S

c04_1 12/02/2008 137
Here, the extracellular field potential is formed from the superimposed electricfields of individual active fibers within the nerve trunk. The extracellularpotential recorded at a field point in the volume conductor is triphasic, low-microvolt range in amplitude, and it diminishes in amplitude and high-fre-quency content as field point is moved to larger radial distances from thesurface of the trunk. The frog sciatic nerve utilized in this experiment is arather complex bioelectric source, consisting of large diameter motor fibersrunning from the spinal cord to the leg muscles, as well as large and smallsensory fibers running from sensory receptors in the leg and skin to the spinalcord. In Figure 4.5(a), the entire nerve trunk (containing both motor andsensory fibers of different diameters) was simultaneously excited by a briefsuprathreshold electric stimulus.
It is possible, however, to excite the motor and sensory components of thetrunk separately by isolating the nerve trunk in the vicinity of the spinal cord.Here the nerve trunk divides into a sensory branch (the dorsal root) and amotor branch (the ventral root). The results of separate motor and sensorystimulation are shown in Figure 4.5(b) and (c). Stimulation of the many large-diameter motor fibers in the trunk provides the largest extracellular response(largest active membrane surface area), whereas stimulation of the sensoryroot excites at least two groups of sensory fibers—a group of larger, fastconducting fibers (group I) and a group of smaller, slower fibers (group II).Observing the extracellular waveform produced by combined stimulation[Figure 4.5(a)], we can see the approximate superposition of motor and sensoryresponses.
The volume-conductor load of the active nerve trunk can also be alteredand made more complicated. A relatively simple variation is to increase the r
of the bathing medium or decrease the radial extent of the volume conductor,or both. These alterations produce larger extracellular potentials due to theconstant nature of the bioelectric current source. Ultimately, the volume-conductor load can consist of a nonhomogeneous multilayered conductingmedium containing skeletal muscle, blood vessels and bone (leg or arm).
Figure 4.5 (Continued)
4 . 2 V O L U M E - C O N D U C T O R F I E L D S 137

c04_1 12/02/2008 138
Current flow patterns are altered in this case due to regional differences inspecific resistivity (e.g., bone and blood) and skeletal muscle fiber orientation.Skeletal muscle constitutes an anisotropic conducting medium (specific resis-tivity different in each coordinate direction) and exhibits preferential conduc-tion in the direction of fiber orientation. Regardless, homogeneous volume-conductor models using bulk anisotropic properties of the passive conductingmedium can serve as useful approximations to the field potential distribution insuch media, lending insight into the interpretation of recorded waveforms.
The foregoing discussion may be considered an explanation of the electro-genesis of the ENG, which is commonly recorded from the surface of an arm, aleg, or the face. The concepts introduced here apply directly to the interpreta-tion of many bioelectric phenomena including those associated with thenervous system (e.g., evoked potential recordings from fiber tracts in thespinal cord and sensory centers in the brain), as well as active skeletal muscle(EMG), cardiac muscle (ECG), and smooth muscle (EGG).
4.3 FUNCTIONAL ORGANIZATION OF THE PERIPHERALNERVOUS SYSTEM
THE REFLEX ARC
The spinal nervous system is functionally organized on the basis of what iscommonly called the reflex arc [Figure 4.6(a)]. The components of this arc areas follows:
1. A sense organ, consisting of many individual sense receptors that respondpreferentially to an environmental stimulus of a particular kind, such aspressure, temperature, touch, or pain.
2. A sensory nerve, containing many individual nerve fibers that perform thetask of transmitting information (encoded in the form of action potentialfrequency) from a peripheral sense receptor to other cells lying within thecentral system (brain and spinal cord).
3. The CNS, which in this case serves as a central integrating station. Hereinformation is evaluated, and, if warranted, a ‘‘motor’’ decision is imple-mented. That is, action potentials are initiated in motor-nerve fibersassociated with the motor-nerve trunk.
4. A motor nerve, serving as a communication link between the CNS andperipheral muscle.
5. The effector organ, which consists, in this case, of skeletal muscle fibersthat contract (shorten) in response to the driving stimuli (action poten-tials) conducted by motor-nerve fibers.
The simplest example of the behavior of the reflex arc is the knee-jerk reflex,in which the patellar tendon below the knee is given a slight tap that stretches
138 4 T H E O R I G I N O F B I O P O T E N T I A L S

c04_1 12/02/2008 139
specialized length receptors, called muscle spindles, within the muscle andsubsequently excites them. This excitation results in action potentials thatpropagate along the sensory nerve that enters the spinal cord and communicateswith CNS cells, specifically motoneurons. The resultant motor activity reflexlybrings about contraction of the muscle that was initially stimulated, and theshortening muscle jerks the limb, producing the well-known knee-jerk response.Note that the initial stimulus to the muscle was a stretch, whereas the responsewas a contraction of the muscle. This simple reflex arc has many of the features ofa negative-feedback loop, in which the control variable is muscle length [Figure4.6(b)]. The CNS acts as the controller, the muscle spindle as a feedback lengthsensor, and the muscle–limb system as the process to be controlled.
JUNCTIONAL TRANSMISSION
Within the reflex arc there are intercommunicating links between neurons(neuro–neuro junctions) called synapses, as well as communicating linksbetween neurons and muscle fibers called neuromuscular junctions. Theseoccur at small, specialized regions of the muscle fiber referred to as an end-plate regions. The junctional transmission process in each of these cases iselectrochemical in nature. There is a prejunctional fiber involved in the
Figure 4.6 Schematic diagram of a muscle-length control system for a peripheral
muscle (biceps) (a) anatomical diagram of limb system, showing intercon-nections and (b) block diagram of control system.
4 . 3 F U N C T I O N A L O R G A N I Z A T I O N 139

c04_1 12/02/2008 140
neuromuscular junction that, when depolarized, releases a neurotransmittersubstance acetylcholine (ACh), which diffuses across a very small fluid-filledgap region approximately 20 nm in thickness. The fluid filling the gap isassumed to be ordinary interstitial body fluid. Once ACh reaches the postjunc-tional membrane, it combines with a membrane receptor complex thatactivates an ion channel, which leads to a relatively brief transient de-polarization of the postjunctional membrane and subsequently to the initiationof an action potential that propagates away from the junctional region. Theelectrochemical transmission process at the junction involves a time delay onthe order of 0.5 to 1.0 ms. More detailed descriptions of interneuronal andneuromuscular transmission are available in general physiology texts (e.g.,Levitan and Kaczmarek, 2002).
Another time delay associated with the neuromuscular system is the delaybetween electrical activation of the musculature and the onset of mechanicalcontraction. This delay, which is referred to as excitation–contraction time, is aproperty of the muscle itself. When the muscle is repeatedly stimulated, themechanical response summates. At high stimulation rates, the mechanicalresponses fuse into one continuous contraction called a tetanus (or tetaniccontraction).
4.4 THE ELECTRONEUROGRAM
Conduction velocity in a peripheral nerve is measured by stimulating a motornerve at two points a known distance apart along its course. Subtraction of theshorter latency from the longer latency (Figure 4.7) gives the conduction time
Figure 4.7 Measurement of neural conduction velocity via measurement oflatency of evoked electrical response in muscle. The nerve was stimulated attwo different sites a known distance D apart.
140 4 T H E O R I G I N O F B I O P O T E N T I A L S

c04_1 12/02/2008 141
along the segment of nerve between the stimulating electrodes. Knowing theseparation distance, we can determine the conduction velocity of the nerve,which has potential clinical value since, e.g., conduction velocity in a regen-erating nerve fiber is slowed following nerve injury (Sinkjaer et al., 2006).
Skeletal muscle fibers (70 mm diameter) are much larger than myelinatednerve fibers (2 to 20 mm); hence the amplitude of field potentials recorded fromactive nerve trunks are much smaller than field potentials recorded fromgroups of active muscle fibers (larger active membrane surface area). Suchpotentials can be recorded with either concentric needle electrodes or surfaceelectrodes (Chap. 5). Nerve field potentials can also be evoked by applyingstimuli to ‘‘mixed’’ nerves that contain both motor and sensory components(such as the ulnar nerve of the arm), in which case the resultant field potentialsare derived from both types of active fibers. However, field potentials can alsobe elicited from purely sensory nerves (e.g., the sural nerve in the leg) or fromsensory components of a mixed nerve, wherein stimulation is applied in amanner that does not excite the motor components of the nerve. In general, thestudy of evoked field potentials from sensory nerves has been shown to be ofconsiderable value in diagnosing peripheral nerve disorders.
Although measurements of conduction velocity and latency are most usefulin the assessment of peripheral nerve function, the characteristics of the fieldpotentials evoked in muscle, as stimulated by its active motor nerve, are alsoimportant. When considering evoked muscle potentials, the duration of theresponse is frequently of interest, since slowed conduction in a few motor nervefibers may lead to late activation of a portion of the muscle. The integrated fieldpotential thus recorded may appear prolonged and polyphasic. If the compo-nent motor fibers of the muscle have a uniform conduction velocity, there willbe a superposition of the recorded field potentials resulting in a larger ampli-tude, shorter duration triphasic response. Slowed conduction in some of themotor fibers may lead to partial fractionation of the integrated field potentialwaveform with a decrease in its magnitude and a broadening of its duration.
FIELD POTENTIALS OF SENSORY NERVES
Extracellular field responses from sensory nerves can be easily measured fromthe median or ulnar nerves of the arm by using ring-stimulating electrodesapplied to the fingers (Figure 4.8). Recording at two sites a known distanceapart along the course of the nerve enables one to compute the conductionvelocity of the sensory nerve. In the case of the ulnar nerve (roughly, it suppliesthe third and fourth fingers), evoked neural potentials can be recorded fromdifferent sites along the course of the nerve as high as the armpit. In the case ofthe median nerve (roughly, it supplies the index and the second fingers), fieldpotentials can be recorded from the nerve at and above the elbow.
Long pulses cause muscle contractions, limb movement, and undesiredsignals (artifacts). These are avoided by positioning the limb in a comfortable,relaxed posture and applying a brief, intense stimulus (square pulse ofapproximately 100 V amplitude with a duration of 100 to 300 ms). Such a
4 . 4 T H E E L E C T R O N E U R O G R A M 141

c04_1 12/02/2008 142
stimulus excites the large, rapidly conducting sensory nerve fibers but not smallpain fibers or surrounding muscle. To minimize artifacts caused by stimuli, weuse a stimulus isolation unit (isolation transformer, diode-bridge circuit,optical coupler, and so on) to isolate the bipolar stimulating electrodesfrom ground. A patient ground is placed at the wrist between the stimulatingand recording electrodes to provide a ground point for the passive electric fieldcoupling from the stimulating electrodes. The skin should be abraded underboth the stimulating and recording electrodes (Section 5.5) to reduce skinresistance and ensure good contact.
Clinically, field potentials are recorded using high-gain, high-input-imped-ance differential preamplifiers with good common-mode rejection capabilityand low inherent amplifier noise (Section 6.5). Figure 4.8 shows that themeasured ENGs are on the order of 10 mV, and power-line interference issometimes a problem even with good amplifier common-mode properties. Theinput leads should be properly twisted together and shielded. In addition, ifwarranted, the subject could be placed in an adequately shielded room or cage.
A further step we can use to enhance the signal-to-noise ratio in thepresence of random noise (for the most part generated by the amplifier) is touse a signal averager (Section 6.8).
MOTOR-NERVE CONDUCTION VELOCITY
In vivo measurement of the conduction velocity of a motor nerve may beobtained as shown in Figure 4.7. For example, the peroneal nerve of the left legmay be stimulated first behind the knee and second behind the ankle. A
Figure 4.8 Sensory nerve action potentials evoked from median nerve of ahealthy subject at elbow and wrist after stimulation of index finger with ringelectrodes. The potential at the wrist is triphasic and of much larger magnitudethan the delayed potential recorded at the elbow. Considering the mediannerve to be of the same size and shape at the elbow as at the wrist, we find thatthe difference in magnitude and waveshape of the potentials is due to the sizeof the volume conductor at each location and the radial distance of themeasurement point from the neural source. (From J. A. R. Lenman and A.E. Ritchie, Clinical Electromyography, 2nd ed., Philadelphia: Lippincott, 1977.Reproduced by permission of the authors.)
142 4 T H E O R I G I N O F B I O P O T E N T I A L S

c04_1 12/02/2008 143
muscular response is obtained from the side of the foot, using surface or needleelectrodes.
REFLEXLY EVOKED FIELD POTENTIALS
When a peripheral nerve is stimulated and an evoked field potential is recordedin the muscle it supplies, it is sometimes possible to record a second potentialthat occurs later than the initial response. As the neural stimulus site is broughtprogressively closer to the muscle, the latency of the first response decreases,whereas the latency of the second response is increased. This behavior of thesecond response indicates that to activate the muscle, the stimulus must travelalong the nerve toward the central nervous system (proximally) for somedistance before ultimately traveling in the opposite direction (distally). Thelatency of the second response is such that the activity could have traveledproximally along sensory nerves as far as the spinal cord to elicit a spinal reflex.
If the posterior tibial nerve in the leg is stimulated, a late potential can beevoked from the triceps sural muscle (Figure 4.9). This long latency responsehas a low threshold and appears at stimulus intensities that are well below thelevels required to elicit the conventional (short-latency) M wave. This long-latency potential—known as the H wave—was discovered by Hoffman (Figure4.9). Its latency indicates that it is a spinal reflex. It is, in fact, the electricalhomolog of the simple ‘‘ankle-jerk’’ reflex.
Thus, when a mixed peripheral nerve such as the posterior tibial nerve isstimulated by a stimulus of low intensity, only fibers of large diameter arestimulated because they have the lowest threshold. These large fibers are sensory
Figure 4.9 The H reflex The four traces show potentials evoked by stimula-tion of the medial popliteal nerve with pulses of increasing magnitude (thestimulus artifact increases with stimulus magnitude). The later potential or Hwave is a low-threshold response, maximally evoked by a stimulus too weak toevoke the muscular response (M wave). As the M wave increases in magnitude,the H wave diminishes. (From J. A. R. Lenman and A. E. Ritchie, ClinicalElectromyography, 2nd ed., Philadelphia: Lippincott, 1977; reproduced bypermission of the authors.)
4 . 4 T H E E L E C T R O N E U R O G R A M 143

c04_1 12/02/2008 144
fibers from muscle spindles that conduct toward the CNS and ultimately connectwithmotorfibers in thespinalcordviaasinglesynapse.Themotoneuronsdischargeand produce a response in the gastrocnemius muscle of the leg (the H wave). With astimulus of medium intensity, smaller motor fibers in the mixed nerve arestimulated in addition to the sensory fibers, producing a direct, short-latencymuscle response, the M wave (Figure 4.9). With still stronger stimuli, impulsesconducted centrally along the motor fibers may interfere with the production of theH wave (these excited motor fibers are in their refractory period) so that only an Mwave is produced (Figure 4.9). The amplitude of the H response depends on thenumber of motoneurons discharged. Its amplitude is also somewhat variable as aresult of fluctuating background neural conditions within the spinal cord. Theseneural disturbances are provided by the activity of other spinal and higher centerneurons impinging on the motoneuron(s) involved in the reflex.
4.5 THE ELECTROMYOGRAM
Skeletal muscle is organized functionally on the basis of the motor unit (seeFigure 4.10), which consists of a single motor nerve fiber and the bundle of
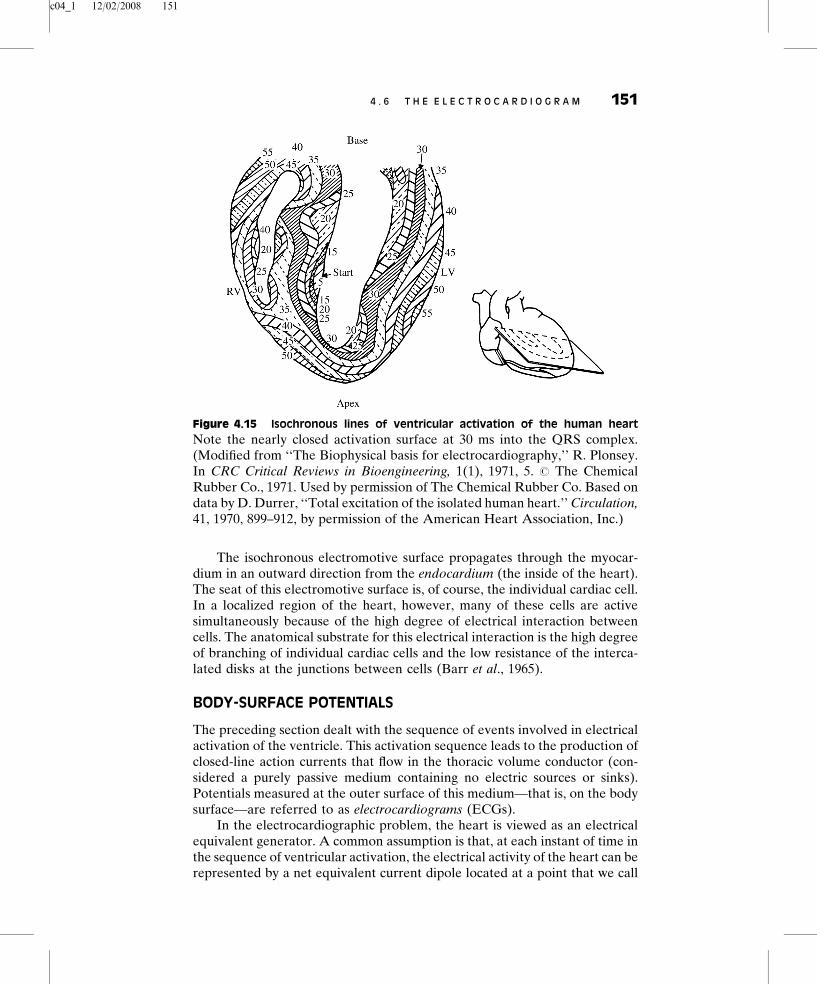
Figure 4.10 Diagram of a single motor unit (SMU), which consists of a singlemotoneuron and the group of skeletal muscle fibers that it innervates. Lengthtransducers [muscle spindles, Figure 4.6(a)] in the muscle activate sensorynerve fibers whose cell bodies are located in the dorsal root ganglion. Thesebipolar neurons send axonal projections to the spinal cord that divide into adescending and an ascending branch. The descending branch enters into asimple reflex arc with the motor neuron, whereas the ascending branch conveysinformation regarding current muscle length to higher centers in the CNS viaascending nerve fiber tracts in the spinal cord and brain stem. These ascendingpathways are discussed in Section 4.8.
144 4 T H E O R I G I N O F B I O P O T E N T I A L S

c04_1 12/02/2008 145
muscle fibers to which it is attached. The motor unit is the smallest unit thatcan be activated by a volitional effort, in which case all constituent musclefibers are activated synchronously. The component fibers of the motor unitextend lengthwise in loose bundles along the muscle. In cross section,however, the fibers of a given motor unit are interspersed with fibers ofother motor units. Thus, the active muscle fibers of the single motor unit(SMU) constitute a distributed bioelectric source located in a volumeconductor that consists of all other fibers within the muscle (active andinactive), blood vessels and connective tissue. The evoked field potentialfrom the active fibers of an SMU has a triphasic form of brief duration (3 to15 ms) and an amplitude of 20 to 2000 mV, depending on the size of the motorunit. The frequency of discharge usually varies from 6 to 30 per second (DeLuca, 2006).
One of the disadvantages of recording the EMG by using the conve-nient surface electrodes is that they can be used only with superficialmuscles and are sensitive to electrical activity over too wide an area.Various types of monopolar, bipolar, and multipolar insertion-type electro-des are commonly used in electromyography for recording from deepmuscles and from SMUs. These types of electrodes generally record localactivity from small regions within the muscle in which they are inserted.Often a simple fine-tipped monopolar needle electrode can be used torecord SMU field potentials even during powerful voluntary contractions.Bipolar recordings are also employed. Various types of electrodes arediscussed in Chapter 5.
Figure 4.11 shows motor unit potentials from the normal dorsal interosseusmuscle under graded levels of contraction. At high levels of effort, manysuperimposed motor unit responses give rise to a complicated response (theinterference pattern) in which individual units can no longer be distinguished.In interpreting Figure 4.11, note that when a muscle contracts progressivelyunder volition, active motor units increase their rate of firing and new(previously inactive) motor units are also recruited.
The shape of SMU potentials is considerably modified by disease. Inperipheral neuropathies, partial denervation of the muscle frequentlyoccurs and is followed by regeneration. Regenerating nerve fibersconduct more slowly than healthy axons. In addition, in many forms ofperipheral neuropathy, the excitability of the neurons is changed andthere is widespread slowing of nerve conduction. One effect of this isthat neural impulses are more difficult to initiate and take longer in transitto the muscle, generally causing scatter or desynchronization in the EMGpattern.
A number of mathematical modeling studies of single-fiber and multi-ple-fiber (single motor unit) action potentials have appeared in the litera-ture (Nandedkar et al., 1985; Ganapathy et al., 1987), as well as detailedvolume-conductor-based simulations of surface EMG signals (Duchene andHogrel, 2000; Farina et al., 2004). Signal processing methods have been
4 . 5 T H E E L E C T R O M Y O G R A M 145

c04_1 12/02/2008 146
employed in the analysis of surface EMGs and SMU signals (Reucher et al.,1987; Farina et al., 2003), as have automatic techniques for the detection,decomposition, and analysis of EMG signals (Mambrito and De Luca, 1984;Stashuk 2001).
Figure 4.11 Motor unit action potentials from normal dorsal interosseusmuscle during progressively more powerful contractions. (c) In the interfer-ence pattern, individual units can no longer be clearly distinguished. (d)Interference pattern during very strong muscular contraction. Time scale is10 ms per dot. (From J. A. R. Lenman and A. E. Ritchie, Clinical Electro-myography, 2nd ed., Philadelphia: Lippincott, 1977; reproduced by permissionof the authors.)
146 4 T H E O R I G I N O F B I O P O T E N T I A L S

c04_1 12/02/2008 147
4.6 THE ELECTROCARDIOGRAM
ANATOMY AND FUNCTION OF THE HEART
The heart serves as a four-chambered pump for the circulatory system (Figure4.12). Its main pumping function is supplied by the ventricles. The atria aremerely antechambers to store blood during the time the ventricles are pump-ing. The resting or filling phase of the heart cycle is referred to as diastole,whereas the contractile or pumping phase is called systole. The smooth,rhythmic contraction of the atria and ventricles has an underlying electricalprecursor in the form of a well-coordinated series of electrical events that takesplace within the heart. That this set of electrical events is intrinsic to the heartitself is well demonstrated when the heart (particularly that of cold-bloodedvertebrates such as the frog or turtle) is removed from the body and placed in anutrient medium (such as glucose-Ringer solution). The heart continues tobeat rhythmically for many hours. Thus, the coordinated contraction of theatria and ventricles is set up by a specific pattern of electrical activation in themusculature of these structures. In humans, these electrical activation patternsin the walls of the atria and ventricles are initiated by a coordinated series ofevents within the specialized conduction system of the heart (Figure 4.12).
In relation to the heart as a whole, the specialized conduction system isvery small and constitutes only a minute portion of the total mass of the heart.The wall of the left ventricle (Figure 4.12) is 2.5 to 3.0 times as thick as the rightventricular wall, and the intraventricular septum is nearly as thick as the leftventricular wall. Thus, the major portion of the muscle mass of the ventriclesconsists of the free walls of the right and left ventricles and the septum.Considering the heart as a bioelectric source, the source strength at eachinstant can be expected to be directly related to the active muscle mass at thatmoment (i.e., to the number of active myocardial cells). Hence, the active freewalls of the atria and ventricles and the interventricular septum can beconsidered the major action current sources responsible for the productionof external field potentials recorded from the heart (e.g., recorded within thethoracic volume-conductor medium or at the surface of the body).
ELECTRICAL BEHAVIOR OF CARDIAC CELLS
The heart comprises several different types of tissues (SA and AV nodal tissue;atrial, Purkinje, and ventricular tissue). Representative cells of each type of tissuediffer anatomically to a considerable degree. They are all electrically excitable,and each type of cell exhibits its own characteristic action potential (Figure 4.13).
THE VENTRICULAR CELL
The ventricular myocardium is composed of millions of individual cardiac cells(15� 15� 150 mm long). Figure 4.14 is a drawing of a small section of cardiacmuscle as seen under light microscopy. The individual cells are relatively long
4 . 6 T H E E L E C T R O C A R D I O G R A M 147

c04_1 12/02/2008 148
and thin, and although they run generally parallel to one another, there isconsiderable branching and interconnecting (anastomosing). The cells aresurrounded by a plasma membrane that makes end-to-end contact withadjacent cells at a dense structure known as the intercalated disk
Figure 4.12 Distribution of specialized conductive tissues in the atria and ventri-
cles, showing the impulse-forming and conduction system of the heart Therhythmic cardiac impulse originates in pacemaking cells in the sinoatrial(SA) node, located at the junction of the superior vena cava and the rightatrium. Note the three specialized pathways (anterior, middle, and posteriorinternodal tracts) between the SA and atrioventricular (AV) nodes. Bachmann’sbundle (interatrial tract) comes off the anterior internodal tract leading to theleft atrium. The impulse passes from the SA node in an organized mannerthrough specialized conducting tracts in the atria to activate first the right andthen the left atrium. Passage of the impulse is delayed at the AV node before itcontinues into the bundle of His, the right bundle branch, the common leftbundle branch, the anterior and posterior divisions of the left bundle branch, andthe Purkinje network. The right bundle branch runs along the right side of theinterventricular septum to the apex of the right ventricle before it gives offsignificant branches. The left common bundle crosses to the left side of theseptum and splits into the anterior division (which is thin and long and goesunder the aortic valve in the outflow tract to the anterolateral papillary muscle)and the posterior division (which is wide and short and goes to the posteriorpapillary muscle lying in the inflow tract). (From B. S. Lipman, E. Massie, and R.E. Kleiger, Clinical Scalar Electrocardiography. Copyright # 1972 by YearbookMedical Publishers, Inc., Chicago. Used with permission.)
148 4 T H E O R I G I N O F B I O P O T E N T I A L S

c04_1 12/02/2008 149
(Figure 4.14). Each fiber contains many contractile myofibrils that follow the axisof the cell from one end (intercalated disk) to the other. These myofibrilsconstitute the ‘‘contractile machinery’’ of the fiber. The component cells ofcardiac tissue are in intimate contact at the intercalated disks, both electricallyand mechanically, so the heart muscle functions as a unit (a functional syncytium).
Prior to excitation, the typical ventricular cell has a resting potential ofapproximately�85 mV. The initial rapid depolarization phase has a rate of risethat is usually greater than 150 V/s. This phase is followed by an initial rapidrepolarization that leads to a maintained depolarizing plateau region lastingapproximately 200 to 300 ms. A final repolarization phase restores membranepotential to the resting level and is maintained for the remainder of the cardiac
Figure 4.13 Representative electric activity from various regions of the heart
The bottom trace is a scalar ECG, which has a typical QRS amplitude of 1 to 3mV. (Copyright # 1969 CIBA Pharmaceutical Company, Division of CIBA-GEIGY Corp. Reproduced, with permission, from The Ciba Collection ofMedical Illustrations, Frank H. Netter, M.D. All rights reserved.)
Figure 4.14 The cellular architecture of myocardial fibers Note the centroidnuclei and transverse intercalated disks between cells.
4 . 6 T H E E L E C T R O C A R D I O G R A M 149

c04_1 12/02/2008 150
cycle. The duration of the action potential waveform is collectively referred toas electrical systole; the resting phase is referred to as electrical diastole.
Most models of membrane excitability that have been used in cardiacelectrophysiology are of the Hodgkin–Huxley (HH) type (Hodgkin and Huxley,1952). The HH formalism was first applied to Purkinje fibers of the specializedconduction system by Noble (1962). This model was later extensively revised byMcAllister et al. (1975), and variations have been used in simulations of theelectrophysiological responses of ventricular (Beeler and Reuter, 1977) and SApacemaker cells (Yanagihara et al., 1980). These models however, were based onmulticellular voltage clamp data that was approximate and contained exper-imental error. The discovery of (1) enzymatic dispersion techniques suitable forthe production of isolated cardiac cells and (2) patch clamp electrode techniquesmade quantitative whole-cell voltage clamping of individual cells possible (early1980s). Current–voltage characteristics of different types of ion channels couldnow be measured accurately and by the 1990s several good mathematical modelsof different cardiac cell types were available. Importantly, these models con-tained descriptions for ion pumps (e.g., Naþ/Kþ ATPase, Ca2þ ATPase) andexchangers (e.g., Naþ�Ca2þ, Naþ�Hþ exchangers), as well as, better fluidcompartment models describing ionic content of the internal medium, thesarcoplasmic reticulum (SR), and extracellular restricted diffusion spaces inthe intra- and extracellular media. The seminal model initiating these extensivechanges in cardiac cell modeling was the Purkinje fiber model developed byDiFrancesco and Noble (1985). It still utilized some ion channel data derivedfrom multicellular voltage clamp experiments, but nevertheless pointed the wayto the development of modern day cardiac cell models for all cell types: SA node(Wilders et al., 1991; Demir et al., 1994); atrial cell (Nygren et al., 1998);ventricular cell (Luo and Rudy, 1994; Puglisi and Bers, 2001).
VENTRICULAR ACTIVATION
Investigators have conducted studies of ventricular activation on experimentalanimals using multiple ‘‘plunge-type’’ electrodes inserted into many sites in theheart (Spach et al., 1972) (see Figure 4.15). The time of arrival of electricalactivation is noted, and isochronous (synchronously excited) excitation sur-faces can be mapped. Figure 4.15 shows a plot of isochronous lines of activationfor the perfused heart of a human who died from a noncardiac condition. Notethat activation first takes place on the septal surface of the left ventricle (5 msinto the QRS complex) and that the activity spreads with increasing time in adirection from left to right across the septum. At 20 ms, several regions of theright and left ventricles are simultaneously active. As time increases, excitationspreads and tends to become more confluent. For example, at 30 ms a nearlyclosed activation surface is seen. Excitation then proceeds in a relativelyuniform fashion in an epicardial (outside the heart) direction. The apex ofthe heart is activated roughly in the period 30 to 40 ms, along with other sites onthe right and left ventricular walls where ‘‘breakthrough’’ of activation hasoccurred. From both Figure 4.15 and data taken in other planes, we can see thatthe posterior-basal region of the heart is the last region activated.
150 4 T H E O R I G I N O F B I O P O T E N T I A L S
c04_1 12/02/2008 151
The isochronous electromotive surface propagates through the myocar-dium in an outward direction from the endocardium (the inside of the heart).The seat of this electromotive surface is, of course, the individual cardiac cell.In a localized region of the heart, however, many of these cells are activesimultaneously because of the high degree of electrical interaction betweencells. The anatomical substrate for this electrical interaction is the high degreeof branching of individual cardiac cells and the low resistance of the interca-lated disks at the junctions between cells (Barr et al., 1965).
BODY-SURFACE POTENTIALS
The preceding section dealt with the sequence of events involved in electricalactivation of the ventricle. This activation sequence leads to the production ofclosed-line action currents that flow in the thoracic volume conductor (con-sidered a purely passive medium containing no electric sources or sinks).Potentials measured at the outer surface of this medium—that is, on the bodysurface—are referred to as electrocardiograms (ECGs).
In the electrocardiographic problem, the heart is viewed as an electricalequivalent generator. A common assumption is that, at each instant of time inthe sequence of ventricular activation, the electrical activity of the heart can berepresented by a net equivalent current dipole located at a point that we call
Figure 4.15 Isochronous lines of ventricular activation of the human heart
Note the nearly closed activation surface at 30 ms into the QRS complex.(Modified from ‘‘The Biophysical basis for electrocardiography,’’ R. Plonsey.In CRC Critical Reviews in Bioengineering, 1(1), 1971, 5. # The ChemicalRubber Co., 1971. Used by permission of The Chemical Rubber Co. Based ondata by D. Durrer, ‘‘Total excitation of the isolated human heart.’’ Circulation,41, 1970, 899–912, by permission of the American Heart Association, Inc.)
4 . 6 T H E E L E C T R O C A R D I O G R A M 151

c04_1 12/02/2008 152
the electrical center of the heart. This center is assumed to lie within theanatomical boundaries of the heart. The magnitude and orientation of the netequivalent dipole can change with time.
Figure 4.15 shows that several regions of both ventricles may be activesimultaneously. Considering time frozen, we represent the electrical activity ofeach active region as a local current dipole and calculate a net equivalentdipole from this distribution at the electrical center. In the next instant, newareas can activate, others de-activate, and local current strengths changeaccording to the active muscle mass. We calculate another net dipole equiv-alent at the electrical center and proceed. This approach can be applied to theanalysis since the volume-conductor-field problem has been shown to bequasistatic (Plonsey, 1969). The thoracic medium can be considered theresistive load of this equivalent cardiac generator. With cardiac activity, afield potential distribution is set up in the thoracic volume conductor where themagnitude of potential decreases with increasing distance from the source.Ohmic potential drops can be measured between surface points (e.g., betweenpoints A and B in Figure 4.16) or between a single surface point and anassigned reference point. The general volume-conductor problem is illustratedin a highly schematic fashion in Figure 4.16 in terms of current source andlumped resistive load.
A scalar ‘‘lead’’ gives the magnitude of a single body-surface potentialdifference plotted versus time. Figure 4.13 (bottom) shows a typical scalarelectrocardiographic lead, where the significant features of the waveform arethe (1) individual waves (P, Q, R, S, and T), (2) wave durations, and (3) specifictime intervals (e.g., the P–R, S–T, and Q–T intervals). This figure also showsthe temporal relationship between single transmembrane cellular activities in
Figure 4.16 The electrocardiographic problem Points A and B are arbitraryobservation points on the torso, RAB is the resistance between them, and RT1,RT2 are lumped thoracic medium resistances. The bipolar ECG scalar leadvoltage FAB = FA � FB, where these voltages are both measured with respectto an indifferent reference potential.
152 4 T H E O R I G I N O F B I O P O T E N T I A L S

c04_1 12/02/2008 153
various regions of the heart (atria, ventricles, and specialized conductionsystem) and this typical ECG waveform.
Clearly the P wave is produced by atrial depolarization, the QRS complexprimarily by ventricular depolarization, and the T wave by ventricular re-polarization. The manifestations of atrial repolarization are normally maskedby the QRS complex. The P–R and S–T intervals are normally at zero potential,the P–R interval being caused mainly by conduction delay in the AV node. TheS–T segment is related to the average duration of the plateau regions ofindividual ventricular cells. A small additional wave, called the U wave, issometimes recorded temporally after the T wave. It is not always present and isbelieved to be the result of slow repolarization of ventricular papillary muscles.
Section 6.2 describes the 12 standard leads that constitute a diagnosticECG, so they will not be considered further here.
NORMAL AND ABNORMAL CARDIAC RHYTHMS
Each beat of the normal human heart originates in the SA node. The normal heartrate is approximately 70 beats per minute (bpm). The rate is slowed (bradycardia)during sleep and is accelerated (tachycardia) by emotion, exercise, fever, andmany other stimuli. Detailed aspects of the control that the nervous system hasover heart rate are beyond the scope of this book; the reader interested in furtherdiscussion is referred to Rowell (1993). Because many parts of the heart possess aninherent rhythmicity (e.g., nodal tissue, Purkinje fibers of the specialized conduc-tion system, and atrial tissues), any part under abnormal conditions can becomethe dominant cardiac pacemaker. This can happen when the activity of the SAnode is depressed, when the bundle of His is interrupted or damaged, or when anabnormal (ectopic) focus or site in the atria or in specialized conduction-systemtissue in the ventricles discharges at a rate faster than the SA node.
When the bundle of His is interrupted completely, the ventricles beat attheir own slow inherent rate (the idioventricular rhythm). The atria continue tobeat independently at the normal sinus rate, and complete or third-degreeblock is said to occur [Figure 4.17(a)]. The idioventricular rate in human beingsis approximately 30 to 45 bpm.
When the His bundle is not completely interrupted, incomplete heartblock is present. In the case of first-degree heart block, all atrial impulses reachthe ventricles, but the P–R interval is abnormally prolonged because of anincrease in transmission time through the affected region [Figure 4.17(b)]. Inthe case of second-degree heart block, not all atrial impulses are conducted tothe ventricles. There may be, for example, one ventricular beat every second orthird atrial beat (2:1 block, 3:1 block, and so on).
In another form of incomplete heart block involving the AV node, the P–Rinterval progressively lengthens until the atrial impulse fails to conduct to theventricle (Wenckebach phenomenon). The first conducted beat after the pause(or dropped beat) has a shorter P–R interval (sometimes of normal length)than any subsequent P–R interval. Then the process of the lengthening of theP–R interval begins anew, progressing over several cardiac cycles until another
4 . 6 T H E E L E C T R O C A R D I O G R A M 153

c04_1 12/02/2008 154
beat is dropped. The electrocardiographic sequence starting with the ventric-ular pause and ending with the next blocked atrial beat constitutes a Wenck-ebach period. The ratio of the number of P waves to QRS complexesdetermines the block (for example, 6:5 or 5:4 Wenckebach periods).
When one branch of the bundle of His is interrupted, causing right- or left-bundle-branch block, excitation proceeds normally down the intact bundle andthen sweeps back through the musculature to activate the ventricle on theblocked side. The ventricular rate is normal, but the QRS complexes areprolonged and deformed.
ARRHYTHMIAS
A portion of the myocardium (or the AV node or specialized conductionsystem) sometimes becomes ‘‘irritable’’ and discharges independently. Thissite is then referred to as an ectopic focus. If the focus discharges only once, theresult is a beat that occurs before the next expected normal beat, and the
Figure 4.17 Atrioventricular block (a) Complete heart block. Cells in theAV node are dead and activity cannot pass from atria to ventricles. Atria andventricles beat independently, ventricles being driven by an ectopic (other-than-normal) pacemaker. (b) AV block wherein the node is diseased (examplesinclude rheumatic heart disease and viral infections of the heart). Althougheach wave from the atria reaches the ventricles, the AV nodal delay is greatlyincreased. This is first-degree heart block. (Adapted from Brendan Phibbs, TheHuman Heart, 3rd ed., St. Louis: The C.V. Mosby Company, 1975.)
154 4 T H E O R I G I N O F B I O P O T E N T I A L S

c04_1 12/02/2008 155
cardiac rhythm is therefore transiently interrupted. (With respect to atrial,nodal, or ventricular ectopic beat, see Figure 4.18.) If the focus dischargesrepetitively at a rate that exceeds that of the SA node, it produces rapid regulartachycardia. [With respect to atrial, nodal, or ventricular paroxysmal tachy-cardia or atrial flutter, see Figure 4.19(a) and (b).] A rapidly and irregularlydischarging focus or, more likely, a group of foci in the atria or ventricles may
Figure 4.18 Normal ECG followed by an ectopic beat An irritable focus, orectopic pacemaker, within the ventricle or specialized conduction system maydischarge, producing an extra beat, or extrasystole, that interrupts the normalrhythm. This extrasystole is also referred to as a premature ventricularcontraction (PVC). (Adapted from Brendan Phibbs, The Human Heart, 3rded., St. Louis: The C.V. Mosby Company, 1975.)
Figure 4.19 (a) Paroxysmal tachycardia. An ectopic focus may repetitivelydischarge at a rapid regular rate for minutes, hours, or even days. (b) Atrialflutter. The atria begin a very rapid, perfectly regular ‘‘flapping’’ movement,beating at rates of 200 to 300 bpm. (Adapted from Brendan Phibbs, TheHuman Heart, 3rd ed., St. Louis: The C.V. Mosby Company, 1975.)
4 . 6 T H E E L E C T R O C A R D I O G R A M 155

c04_1 12/02/2008 156
be the underlying mechanism responsible for atrial or ventricular fibrillation[Figure 4.20(a) and (b)].
EXAMPLE 4.4 Premature ventricular contractions can be identified be-cause (1) they arrive early, (2) the following beat occurs at the normal time,because it is generated by the SA node, and (3) the QRS width is greaterthan the normal 80 ms. Describe a software algorithm to detect and countPVCs by using all these criteria.
ANSWER There will be slight variations in width and R–R interval of QRScomplexes. A PVC is wide. Use unfiltered ECG to determine average widthðAW ¼ average of 10Þ. The algorithm should test that width Wt > 1:3AWt�1.Use narrowband filter plus threshold to determine time of each R wave.Determine average R–R interval ðAR�R ¼ average of 10Þ. A PVC occursearly. The algorithm should test that the R�Rt�1 interval < 0.8 AR�Rt�2. APVC is followed by a compensatory pause. The algorithm should test thatR�Rt�1 þR�Rt is approximately 2 AR�Rt�2ð Þ. All three tests should bepositive to yield a PVC.
Rhythm disturbances can arise from sources other than ectopic foci orcompeting pacemakers. A feasible alternative is a circus re-excitation or
Figure 4.20 (a) Atrial fibrillation. The atria stop their regular beat and begin afeeble, uncoordinated twitching. Concomitantly, low-amplitude, irregularwaves appear in the ECG, as shown. This type of recording can be clearlydistinguished from the very regular ECG waveform containing atrial flutter.(b) Ventricular fibrillation. Mechanically the ventricles twitch in a feeble,uncoordinated fashion with no blood being pumped from the heart. TheECG is likewise very uncoordinated, as shown. (Adapted from Brendan Phibbs,The Human Heart, 3rd ed., St. Louis: The C.V. Mosby Company, 1975.)
156 4 T H E O R I G I N O F B I O P O T E N T I A L S

c04_1 12/02/2008 157
re-entrant mechanism (Allessie et al., 1973). This concept assumes a region ofdepressed conductivity within the atrium, Purkinje system, or ventricle. It istherefore ischemic (deficient in its blood supply) relative to surroundingnormal tissue. This brings about pronounced electrophysiological changesin the ischemic zone and a decreased velocity of conduction (see Figure 4.21).
Propagation in this area is slow enough to permit other areas to recover frominitial excitation and be re-entered by the slowly emerging impulse. The re-entrant impulse may in turn re-excite the area of slow conduction to complete acircus-movement loop. Intermittent establishment of a re-entrant circuit wouldresult in occasional ectopic beats (extrasystoles), and continuous propagation ofimpulses in the established circuit would underlie an episode of tachyarrhythmia.
ALTERATION OF POTENTIAL WAVEFORMS IN ISCHEMIA
Of particular interest in Figure 4.21 is the change in the intracellular andextracellular potential waveforms in ischemia. Note particularly that in lateischemia (ischemia that occurs several minutes after induced coronary occlu-sion), there are decreases in the magnitudes of the resting potential, thevelocity of the upstroke, and the height and duration of the action potential.(A decrease in upstroke velocity is indicative of a lowered velocity ofconduction of the action-potential wave front through this ischemic region.)The slope of the potential during the plateau phase of the action potential isalso altered in ischemia (increased). These changes in the action-potential
Figure 4.21 (a) Action potentials recorded from normal (solid lines) andischemic (dashed lines) myocardium in a dog. Control is before coronaryocclusion. (b) During the control period prior to coronary occlusion, there is noECG S–T segment shift; after ischemia, there is such a shift. (From Andrew G.Wallace, ‘‘Electrophysiology of the myocardium.’’ In Clinical Cardio-pulmonary Physiology, 3rd ed. New York: Grune & Stratton, 1969; usedwith permission of Grune & Stratton. Based on data by W. E. Sampsonand H. M. Scher, ‘‘Mechanism of S–T segment alteration during acutemyocardial injury,’’ 1960, Circulation Research, 8, by permission of TheAmerican Heart Association.)
4 . 6 T H E E L E C T R O C A R D I O G R A M 157

c04_1 12/02/2008 158
waveform bring about changes in the extracellular field potentials produced byindividual cardiac cells. The action current contributions of normal andischemic cells superimpose in the linear volume-conductor medium to bringabout altered forms of the ventricular portion of the ECG (QRS complex, S–Tsegment, and T wave, as shown in Figures 4.13 and 4.21).
Occlusion of the blood supply to a given myocardial region brings aboutrelatively rapid electrolytic adjustments in the affected region. Specifically,there is a loss of Kþ and an uptake of Naþ within the ischemic cell. Ca2þ and Hþ
also accumulate within the cell, and water shifts inward as well. These ionicshifts produce membrane depolarization and are indicative of the depressedactivity of the Naþ–Kþ pump, which is metabolically dependent. Changes inthe cell resting potential and the action potential waveform in ischemia aresimply external manifestations of the underlying electrochemical changesbrought about by an inadequate oxygen (blood) supply.
4.7 THE ELECTRORETINOGRAM
ANATOMY OF VISION
The normal eye is an approximately spherical organ about 24 mm in diameter(Figure 4.22). The retina, located at the back of the eye, is the sensory portionof the eye.
Figure 4.22 The transparent contact lens contains one electrode, shown hereon horizontal section of the right eye. Reference electrode is placed on theright temple.
158 4 T H E O R I G I N O F B I O P O T E N T I A L S

c04_1 12/02/2008 159
The light-transmitting parts of the eye are the cornea, anterior chamber,lens, and vitreous chamber, named in the order in which these structures aretraversed by light. A transparent fluid, the aqueous humor, is found in theanterior chamber. The vitreous chamber is filled by a transparent gel, thevitreous body. The aqueous humor provides a nutrient transport medium, but itis also of further optical significance. It is normally maintained at a pressure (20to 25 mm Hg) that is adequate to inflate the eye against its resistive outer coats(the sclera and choroid). This makes possible the precise geometrical configu-ration of the retina and the optical pathway that is necessary to ensureformation of a clear visual image. In addition, the aqueous humor is theessential link between the circulatory system and the lens and cornea, whichthemselves lack blood vessels. To satisfy the respiratory and nutritive require-ments of these two structures, there is a continual movement of fluid and solutematerial between the aqueous humor and contiguous blood vessels. Interfer-ence with this flow, in pathological conditions, not only leads to damage of thelens and cornea but may also result in the development of pressures within theeye that are high enough to injure the retina. Glaucoma is the term applied tothis high-pressure condition.
In considering the neural organization of the retina, we need examine onlyfive types of nerve cells: photoreceptors and bipolar, horizontal, amacrine, andganglion cells. The ganglion cells, the axons of which produce the nerve fiberssweeping across the inner retinal surface to be collected at the optic disk (andwhich form the greater bulk of the nerve fibers of the optic nerve), aresubstantially fewer in number than the photoreceptors. There is a convergencein the neural pathways of the retina as a whole. [That is, many photoreceptorsterminate on each bipolar cell (n : 1), and many bipolar cells, in turn, terminateon a single ganglion cell. The degree of convergence varies considerably, beinggreater in the peripheral parts of the retina and minimal at the fovea (Figure4.22). That is, the neural chain from photoreceptor to ganglion cell is 1 : 1 in thefoveal region.] The synaptic interconnections between photoreceptors andbipolar cells and between bipolar cells and ganglion cells occur in two well-defined regions. The external plexiform layer is the region of contact betweenphotoreceptor and bipolar cells, and the internal plexiform layer is the region ofcontact between bipolar and ganglion cells.
Lateral connections are also found in both layers. For example, horizontalcells interconnect rods and cones (defined below) at the level of the externalplexiform layer, and amacrine cells provide a second horizontal network at thelevel of the inner plexiform layer. The retina may thus be considered func-tionally organized into two parts: an outer sensory layer containing thephotoelectric sensors (photoreceptors) and an inner layer responsible fororganizing and relaying electrical impulses generated in the photoreceptorlayer to the brain.
Two types of photoreceptors occur in the human retina: rods (the agents ofvision in dim light) and cones (the mediators of color vision in brighter light).Both rods and cones are differentiated into outer and inner segments. Theinner segments are the major sites of metabolism and contain all the synaptic
4 . 7 T H E E L E C T R O R E T I N O G R A M 159

c04_1 12/02/2008 160
terminals. Outer segments—typically cylindrical and thin in rods and stout andconical in cones—are sites of visual excitation. The first stage in the transduc-tion of light to neural messages is the absorption of photons by photopigmentslocalized in the outer segments of the retina’s photoreceptors. The photopig-ment localized in the compact membrane infolding of the rod’s externalsegment is rhodopsin. It is easily isolated and has been extensively studied.Cones in human beings contain one of three photopigments and have photo-spectral absorption characteristics that differ from one another, and from therod pigment rhodopsin. Cone pigments have proved very difficult to isolate inhumans and other vertebrates, and hence their spectral characteristics haveusually had to be measured by indirect means (e.g., reflection densitometry).Each cone pigment responds to a range of light wavelengths, but with maximallight absorption in the red, green, or blue regions of wavelength, respectively.Photopigments are embedded in the specialized membranes of the outersegments of the photoreceptors, and they are photolabile; that is, eventsinitiated by light absorption result eventually in breakdown or ‘‘bleaching’’of the photopigment.
For example, the photopigment in rods is rhodopsin (Rh), and it iscomprised of two parts: a protein called opsin and retinal, a light-sensitivechromophore derived from vitamin A. In the absence of light, retinal is in its11-cis form and is bound to opsin. With absorption of a photon, retinalstraightens out to assume its all-trans form and dissociates. This processinitiates a cascade of intramolecular reactions that brings about a conforma-tional change in rhodopsin (now called activated rhodopsin Rh�). Rh� in turnactivates a G-protein coupled signal transduction cascade which targets closingof Naþ channels on the external segment membrane. An important secondmessenger mediating this channel closing is cyclic guanosine 3,5-cyclic mono-phosphate (GMP). Turning off the Naþ current that flows during the darkhyperpolarizes the cell membrane and reduces the release of neurotransmitterto downstream neurons in the visual pathway. Rhodopsin kinase and arrestininactivate Rh� resetting the signal transduction pathway.
Details of the phototransduction process are beyond the scope of thisbook, but most physiology texts cover this subject intensively. Both intra-cellular and extracellular potential recordings have been made from isolatedphotoreceptors, as well as whole-cell voltage clamp recordings that providequantitative descriptions of some of the membranes currents involved, e.g.,Yagi and Macleish (1994).
ELECTROPHYSIOLOGY OF THE EYE
When the retina is stimulated with a brief flash of light, a characteristictemporal sequence of changes in potential can be recorded between anexploring electrode—placed either on the inner surface of the retina or onthe cornea—and an indifferent electrode placed elsewhere on the body(usually the temple, forehead, or earlobe). These potential changes arecollectively known as the electroretinogram (ERG), and they are clinically
160 4 T H E O R I G I N O F B I O P O T E N T I A L S

c04_1 12/02/2008 161
recorded with the aid of an Ag/AgCl electrode embedded in a special contactlens used as the exploring electrode. The saline-filled contact lens is in goodcontact with the cornea, which is very thin and in intimate contact with theaqueous humor and passive fluid medium of the inner eye. The contact lens isusually well tolerated by the subject and permits long examinations withoutdiscomfort. By considering the eye as a fluid-filled sphere and the retina as athin sheetlike bioelectric source attached to the posterior pole of the sphere(Figure 4.22), we can easily visualize the volume-conductor problem inelectroretinography.
Figure 4.23 shows a typical vertebrate ERG waveform in response to a 2 slight flash. The four most commonly identified components of the ERGwaveform (the a, b, c, and d waves) are common to most vertebrates, includinghumans. The first part of the response to a brief light flash is the early-receptorpotential (ERP) generated by the initial light-induced changes in the photo-pigment molecules. It appears almost instantaneously with the onset of thelight stimulus. The second component, with a latency of 1 to 5 ms, is the late-receptor potential (LRP), which has been found to be maximal near thesynaptic endings of the photoreceptors and therefore reflects the outputs ofthe receptors. Normally the ERP and LRP sum to form the leading edge of thea wave. The b wave is generated by activity of the bipolar and ganglion cells ofthe inner layers of the retina. This is best seen in laboratory experiments underconditions where the retinal artery supplying the inner layers of the retina isoccluded, and the b wave is abolished. This experimental technique is usefulsince in the absence of the b wave, the entire time course of the earlyphotoreceptor response (ERPþ LRP) can be studied. The ERP is linearwith light intensity; the LRP is already markedly nonlinear, varying approxi-mately logarithmically with intensity. The c wave is not generated by the retinaitself, but rather by the pigment epithelial layer in which the tips of the externalsegments are embedded. This is shown experimentally by chemically ablatingthe pigment epithelium or using an isolated retina preparation. The d wave isthe off-response of the retina to the light stimulus.
Figure 4.23 Vertebrate ERG
4 . 7 T H E E L E C T R O R E T I N O G R A M 161

c04_1 12/02/2008 162
SPATIAL PROPERTIES OF THE ERG
It is possible to record ERGs from localized areas of the retina in addition tothe classical response that we have described in previous sections. [Thisconventional response is usually elicited from the dark-adapted eye via abrief light flash (flash ERG)]. In laboratory experiments on frog, the sum of theERGs produced by several retinal regions is equal to the single ERG producedwhen all these regions are stimulated simultaneously.
Linear superposition of ERG responses has likewise been confirmed inhumans. In applying localized light stimuli to portions of the human retina,precautions should be taken to prevent light scattered within the eye fromstimulating a much larger area of retina than is intended. Thus relatively highsteady background illumination is supplied that illuminates most of the retina,and a localized stimulus is superimposed. The background illumination lightcauses the retina to adapt and renders it much less sensitive to light scatteredfrom the stimulus region. In general, relatively high-background and low-stimulus intensities are preferred, making these locally generated ERGpotentials low in amplitude and detectable with only average response calcu-lations involving large numbers of responses. Without these special precau-tions, the resultant ERG represents the overall retinal response to lightstimulation. Little is known about the actual nature of the light input to aparticular retinal locus in the photoreceptive layer.
Despite the anatomical complexities of the retina, the problems ofobtaining good records from untrained subjects, and the need for employingaveraging techniques in obtaining spatially localized ERGs, the ERG haspotential importance in assessing functional retinal behavior. It serves as anobjective record of retinal function, is not dependent on the function of theoptic nerve or the optic pathways, and is minimally affected by clouding ofthe optic pathway.
THE ELECTRO-OCULOGRAM (EOG)
In addition to the transient potential recorded as the ERG, there is a steadycorneal–retinal potential. This steady dipole may be used to measure eyeposition by placing surface electrodes to the left and right of the eye (e.g., onthe nose and the temple). When the gaze is straight ahead, the steady dipole issymmetrically placed between the two electrodes, and the EOG output is zero.When the gaze is shifted to the left, the positive cornea becomes closer to theleft electrode, which becomes more positive. There is an almost linearrelationship between horizontal angle of gaze and EOG output up to approxi-mately 308 of arc. Electrodes may also be placed above and below the eye torecord vertical eye movements.
The EOG, unlike other bipotentials, requires a dc amplifier. The signal isin the microvolt range, so recessed Ag/AgCl electrodes are required to preventdrift. It is necessary to abrade the skin to short out changes in the potential thatexists between the inside and the outside of the skin. A noise is present that is
162 4 T H E O R I G I N O F B I O P O T E N T I A L S

c04_1 12/02/2008 163
compounded of effects from EEG, EMG, and the recording equipment; it isequivalent to approximately 18 of eye movement. Thus EOG data suffer froma lack of accuracy at the extremes. Specifically eye movements of less than 18 or28 are difficult to record, whereas large eye movements (for example, greaterthan 308 of arc) do not produce bioelectric amplitudes that are strictlyproportional to eye position. For an analysis of the accuracy and precisionof electro-oculographic recordings, consult North (1965).
The EOG is frequently the method of choice for recording eye movementsin sleep and dream research, in recording eye movements from infants andchildren, and in evaluating reading ability and visual fatigue. For a practicalclinical EOG setup, see Niedermeyer and Lopes Da Silva (1999).
4.8 THE ELECTROENCEPHALOGRAM
The background electrical activity of the brain in unanesthetized animals wasdescribed qualitatively in the nineteenth century, but it was first analyzed in asystematic manner by the German psychiatrist Hans Berger, who introducedthe term electroencephalogram (EEG) to denote the potential fluctuationsrecorded from the brain. Conventionally, the electrical activity of the brain isrecorded with three types of electrodes—scalp, cortical, and depth electro-des. When electrodes are placed on the exposed surface (cortex) of the brain,the recording is called an electrocorticogram (ECoG). Thin insulated needleelectrodes of various designs may also be advanced into the neural tissue ofthe brain, in which case the recording is referred to as a depth recording.(There is surprisingly little damage to the brain tissue when electrodes ofappropriate size are employed.) Whether obtained from the scalp, cortex, ordepths of the brain, the recorded fluctuating potentials represent a superpo-sition of the field potentials produced by a variety of active neuronal currentgenerators within the volume-conductor medium. Unlike the relativelysimple bioelectric source considered in Section 4.2 (the nerve trunk withits enclosed bundles of circular cylindrical nerve axons), the sources gener-ating these field potentials are aggregates of neuronal elements with complexinterconnections. The neuronal elements mentioned previously are thedendrites, cell bodies (somata), and axons of nerve cells. Moreover, thearchitecture of the neuronal brain tissue is not uniform from one location toanother in the brain. Therefore, prior to undertaking any detailed study ofelectroencephalography, we first discuss necessary background informationregarding (1) the gross anatomy and function of the brain, (2) the ultra-structure of the cerebral cortex, (3) the field potentials of single neuronsleading to an interpretation of extracellular potentials recorded in thecerebral cortex, and (4) typical clinical EEG waveforms recorded via scalpelectrodes. We shall then focus on the general volume-conductor problem inelectroencephalography and briefly discuss abnormal EEG waveforms(Sherman and Walterspacher, 2006).
4 . 8 T H E E L E C T R O E N C E P H A L O G R A M 163

c04_1 12/02/2008 164
INTRODUCTION TO THE ANATOMY AND FUNCTION OF THE BRAIN
The central nervous system (CNS) consists of the spinal cord lying within thebony vertebral column and its continuation, the brain, lying within the skull[Figure 4.24]. The brain is the greatly modified and enlarged portion of theCNS, surrounded by three protective membranes (the meninges) and enclosedwithin the cranial cavity of the skull. The spinal cord is likewise surrounded bydownward continuations of the meninges, and it is encased within the protec-tive bony vertebral column. Both brain and spinal cord are bathed in a specialextracellular fluid called cerebral spinal fluid (CSF).
Division of the brain into three main parts—cerebrum, brainstem, andcerebellum—provides a useful basis for the study of brain localization andfunction (Figure 4.24). The brainstem (medulla, pons, midbrain, diencephalon)is the oldest part of the brain. It is actually a short extension of the spinal cord and
Figure 4.24 Anatomical relationship of brainstem structures [medulla oblon-gata, pons, midbrain, and diencephalon (thalamus and hypothalamus)] to thecerebrum and cerebellum. General anatomic directions of orientation in thenervous system are superimposed on the diagrams. Here the terms rostral(toward head), caudal (toward tail), dorsal (back), and ventral (front) areassociated with the brainstem; remaining terms are associated with the cerebrum.The terms medial and lateral imply nearness and remoteness, respectively, to orfrom the central midline axis of the brain. Symbols: T (thalamus), HT (hypo-thalamus), MB (midbrain), SC (spinal cord), P pituitary gland). (Adapted fromJohn H. Martin, Neuroanatomy: Text and Atlas, 2nd ed., 1996, pp 14–15, withpermission of Appleton and Lange, a Simon and Schuster Company.)
164 4 T H E O R I G I N O F B I O P O T E N T I A L S
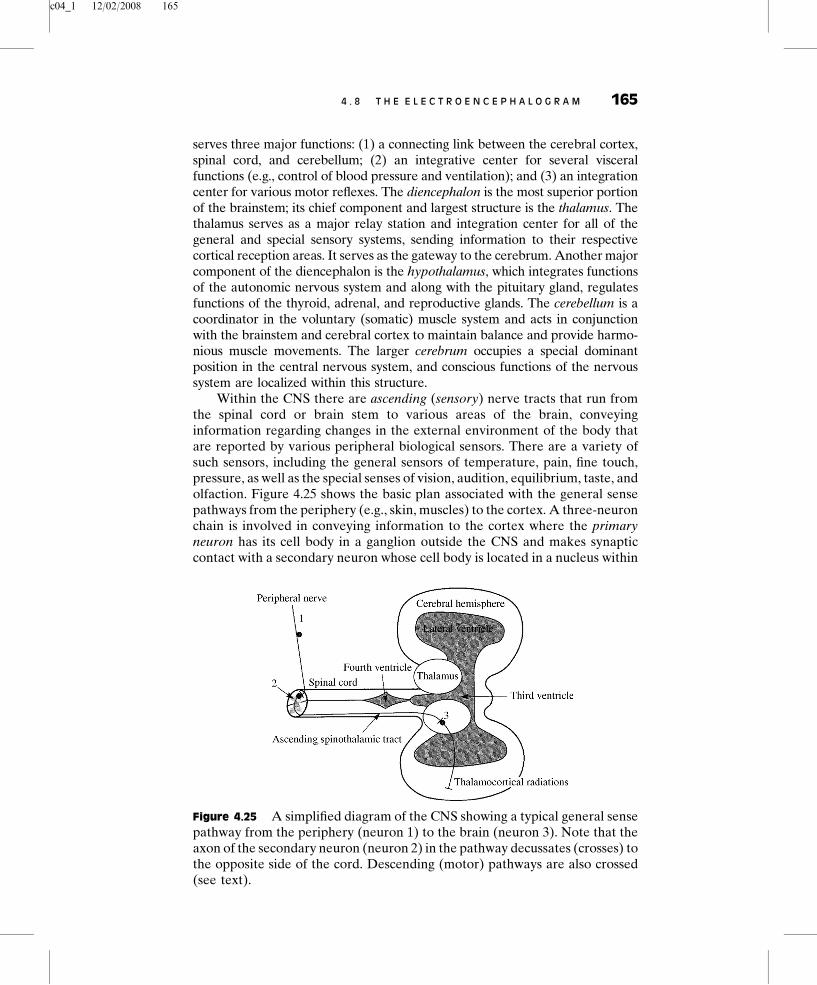
c04_1 12/02/2008 165
serves three major functions: (1) a connecting link between the cerebral cortex,spinal cord, and cerebellum; (2) an integrative center for several visceralfunctions (e.g., control of blood pressure and ventilation); and (3) an integrationcenter for various motor reflexes. The diencephalon is the most superior portionof the brainstem; its chief component and largest structure is the thalamus. Thethalamus serves as a major relay station and integration center for all of thegeneral and special sensory systems, sending information to their respectivecortical reception areas. It serves as the gateway to the cerebrum. Another majorcomponent of the diencephalon is the hypothalamus, which integrates functionsof the autonomic nervous system and along with the pituitary gland, regulatesfunctions of the thyroid, adrenal, and reproductive glands. The cerebellum is acoordinator in the voluntary (somatic) muscle system and acts in conjunctionwith the brainstem and cerebral cortex to maintain balance and provide harmo-nious muscle movements. The larger cerebrum occupies a special dominantposition in the central nervous system, and conscious functions of the nervoussystem are localized within this structure.
Within the CNS there are ascending (sensory) nerve tracts that run fromthe spinal cord or brain stem to various areas of the brain, conveyinginformation regarding changes in the external environment of the body thatare reported by various peripheral biological sensors. There are a variety ofsuch sensors, including the general sensors of temperature, pain, fine touch,pressure, as well as the special senses of vision, audition, equilibrium, taste, andolfaction. Figure 4.25 shows the basic plan associated with the general sensepathways from the periphery (e.g., skin, muscles) to the cortex. A three-neuronchain is involved in conveying information to the cortex where the primaryneuron has its cell body in a ganglion outside the CNS and makes synapticcontact with a secondary neuron whose cell body is located in a nucleus within
Figure 4.25 A simplified diagram of the CNS showing a typical general sensepathway from the periphery (neuron 1) to the brain (neuron 3). Note that theaxon of the secondary neuron (neuron 2) in the pathway decussates (crosses) tothe opposite side of the cord. Descending (motor) pathways are also crossed(see text).
4 . 8 T H E E L E C T R O E N C E P H A L O G R A M 165

c04_1 12/02/2008 166
either the spinal cord [e.g., the dorsal horn or the brain stem (Figure 4.25)].Note from Figure 4.25 that the axon of the secondary neuron crosses (decus-sates) to the other side of the cord and joins a nerve fiber tract bound for thethalamus. The tertiary neuron in the pathway is located in a thalamic nucleus,and its axon travels in the thalamocortical radiations to the postcentral gyrus,which is located just posterior to the central sulcus [Figure 4.24 (inset)]. Thus,the postcentral gyrus is the cortical projection area for the general senses.
Neural pathways for the special senses, particularly audition and vision,follow the same general ground plan; however, there are notable deviationsfrom the scheme depicted in Figure 4.25. Usually, more than three neurons areinvolved in the pathway and not all of the ‘‘secondary neurons’’ decussate.Most of the neurons cross to the opposite (contralateral) side of the body,however a significant number ascend to the thalamus on the same (ipsilateral)side of the body. The auditory and visual pathways have their own specialthalamic relay centers—the medial and lateral geniculate bodies, respectively,as well as their own cortical projection areas (Figure 4.24).
Likewise, within the CNS there are descending (motor) nerve tracts thatoriginate in various brain structures such as the cerebrum and cerebellum(Figure 4.24) and terminate ultimately on motor neurons in the ventral horn ofthe spinal cord (Figure 4.10). These motoneurons, in turn, control the con-tractile activity of the skeletal musculature. For example, the corticospinaltract is a bundle of axons from the primary motor cortex [precentral gyrus,Figure 4.24 (inset)], which projects directly to motor neurons in the spinal cord.Since the ascending general sensory pathways are crossed, the descendingcorticospinal tracts each cross to the opposite side of the body prior to makingsynaptic contact with the spinal motor neurons.
Thus, two-way communication links exist between the brain and spinalcord that allow higher centers in the brain to control or modify the behavior ofthe elemental spinal reflex arc at a given spinal level. By means of these links,the brain is not only informed of a peripheral event but can also modify theresponse of the spinal reflex to that environmental stimulus. Information istransmitted to the brain by means of a frequency-modulated train of nerveimpulses that, upon reaching specific areas of the brain, stimulates the activityof resident neurons. Similarly, the decision to implement a motor action inresponse to the initial stimulus is manifested in the electrical activity of corticalneurons in specific areas of the brain [e.g., precentral gyrus (primary motorcortex); premotor cortex in frontal lobe]. The pattern of activity is specific tothe type of motor action to be taken.
Electrical activity in either ascending or descending nerve fiber tracts maybe represented to a first approximation by an action current dipole oriented inthe direction of propagation (bioelectric source model). One should be awarethat the properties (e.g., size, bulk conductivity) of the volume-conductormedium can change along the length of a particular fiber tract between thespinal cord and the cortex, and the volume-conductor model adopted shouldbe based on the particular measurement considered. The volume-conductor-field potential solutions can be used to both fit and interpret body surface
166 4 T H E O R I G I N O F B I O P O T E N T I A L S

c04_1 12/02/2008 167
potential measurements obtained clinically. Recording field potentials non-invasively from the relatively small volume of active nerve trunks, invariablyrequires the use of cumulative signal averaging techniques. In Figure 4.8, themedian nerve was stimulated and compound action potentials were recordedfrom the subject’s forearm. Although not shown in this figure, sensory fibers inthe median nerve thus activated, initiate activity in the general sense pathwaysto the brain. Averaged field potential recordings can be taken at a variety ofpoints along the ascending pathways [e.g., from spinal cord and brain stemtracts taking note of the crossed nature of the pathway, and finally at the cortexitself (postcentral gyrus)]. The field potentials associated with long nerve tractsdepends to a large extent on (a) whether the tract is straight or bent and (b) theresistance (geometry and specific conductivity) of the surrounding volume-conductor media.
This important subject is discussed later; however, for the present, thesedifferent types of averaged field potentials are called collectively somato-sensory evoked potentials. The subject of nerve tracts has been discussedpreviously; however, the activity of both nuclei in the ascending pathwayand clusters of cells in the cortex, depends not only on the ensemble of neuronsthere, but also on the geometry of the ensemble and the different types ofsynaptic connections involved.
Averaged sensory evoked potentials in response to brief auditory ‘‘clicks’’or flashes of light are also routinely recorded as the auditory evoked response(AER) and the visual evoked response (VER), respectively (Jacobson, 1994;Heckenlively and Arden, 1991). Using an electromagnetic stimulating deviceheld over the primary motor cortex (just anterior to the central sulcus), it isalso possible to induce currents that activate the corticospinal tract, makingpossible the recording of averaged field potentials from the descending motorpathways (York, 1987; Geddes, 1987; Esselle and Stuchly, 1992). The samevolume-conductor principles are applicable to the analysis of these differenttypes of evoked potential recordings. The cerebrum is a paired structure, withright and left cerebral hemispheres, each relating to the opposite side of thebody. That is, voluntary movements of the right hand are ‘‘willed’’ by the leftcerebral hemisphere. The surface layer of the hemisphere is called the cortex;it receives sensory information from skin, eyes, ears, and other receptorslocated generally on the opposite side of the body. This information iscompared with previous experience and produces movements in responseto these stimuli.
Each hemisphere consists of several layers. The outer layer is a densecollection of nerve cells that appear gray in color when examined in a freshstate. It is consequently called gray matter. This outer layer, roughly 1 cm thick,is called the cerebral cortex. It has a highly convoluted surface consisting of gyri(ridges) and sulci (valleys), the deeper sulci being termed fissures. The deeperlayers of the hemisphere (beneath the cortex) consist of myelinated axons (orwhite matter) and collections of cell bodies termed nuclei. Some of theintegrative functions of the cerebrum can be localized within certain regionsof the cortex; others are more diffusely distributed.
4 . 8 T H E E L E C T R O E N C E P H A L O G R A M 167

c04_1 12/02/2008 168
A major dividing landmark of the cerebral cortex is the lateral fissure(Figure 4.24), which runs on the lateral (side) surface of the brain from theopen end in front, posteriorly and dorsally (backward and upward). The lateralfissure defines a side lobe of cortex inferior to (below) it that is called thetemporal lobe [Figure 4.24 (inset)]. The superior (upper) part of this lobecontains the primary auditory cortex, which is the part of the cortex thatreceives auditory impulses via neural pathways leading from the auditoryreceptors in the inner ear.
The visual system is another example of the projection of the senses ontothe cerebral cortex. The occipital lobe at the back of the head is the primaryvisual cortex. Light flashed into the eye evokes large electrical potentials fromelectrodes placed over this area of the cortex.
Another major landmark of the cerebral cortex is the central sulcus[Figure 4.24 (inset)]. However, it is not so prominent and unvarying ananatomical landmark as the lateral fissure. The central sulcus runs fromthe medial surface (surface along the midline of the brain) over the convexityof the hemisphere to the lateral fissure. It also represents the posterior borderof the frontal lobe. The gyrus lying just anterior (forward) to the central sulcusis the precentral gyrus, which functions as the primary motor cortex. From thisgyrus, nerve signals run down through the brainstem to the spinal cord forcontrol of skeletal muscles via neural control of motoneurons in the ventralhorn of the spinal cord (Figure 4.10). Lesions (destruction) of part of theprecentral gyrus cause partial paralysis on the opposite side of the body.
Immediately posterior to the central sulcus [Fig. 24 (inset)] is the primarysomatosensory cortex, the postcentral gyrus. This region receives impulses fromall the general sense receptors from the skin (such as pressure, touch, and painreceptors). Each little area along this gyrus is related to a particular part of thebody (for example, the legs on the medial end, the hand in the center, and theface on the end next to the lateral fissure). If a recording electrode is placedappropriately during a neurosurgical procedure, a cortical response can beevoked by tactile stimuli delivered to the contralateral (opposite) hand. Like-wise, if a stimulus is applied through the same electrode, the subject reports atingling sensation in the contralateral hand. Higher-order sensory discrimina-tion, such as the ability to recognize a number drawn on the palm of the hand,is organized solely in the parietal lobe of which the postcentral gyrus is a part.Destruction of the parietal lobe results in a loss of this discriminative ability.For example, a subject may still know that he or she is being touched butcannot tell where or what is being drawn on the palm of the hand. The parietallobe is also responsible for a person’s awareness of the general position of thebody and its limbs in space.
ULTRASTRUCTURE OF THE CEREBRAL CORTEX
The functional part of the cerebrum is the cerebral cortex (bark, outercovering), a relatively thin layer of gray matter (1.5 to 4.0 mm in thickness)covering the outer surface of the cerebrum, including its intricate convolutions.
168 4 T H E O R I G I N O F B I O P O T E N T I A L S

c04_1 12/02/2008 169
Because it is the most recent phylogenetic acquisition of the brain, the cerebralcortex has undergone a relatively greater development than other parts of thebrain. The greatest advance in relative growth has been the neocortex, which ispresent on the superior and lateral aspects of the cerebral hemispheres. Thedistinctly different type of cortex located on the medial surface and base of thebrain is known as the paleocortex. We shall use the term cortex in this chapterto refer specifically to the neocortex.
Cortical architectures in vertebrates share several common features:(1) stratified layers containing cell bodies and fiber bundles; (2) an outermostlayer that lacks neurons (layer I); (3) at least one inner layer containingneurons that give rise to large dendrites, which rise vertically to layer I andtravel in that layer forming multiple branches (arborization). The humancortex is generally arranged in six such cortical layers. The neurons are of twomain types: pyramidal and nonpyramidal (many subtypes have been identi-fied). There are also a large number of horizontally oriented layers of nervefibers that extend between adjacent regions of the cortex, as well as verticallyoriented bundles that extend from the cortex to more distant regions of thecortex or downward to the brainstem and spinal cord.
Figure 4.26 shows a schematic drawing of a typical cortical pyramidalcell. The bodies of this type of cell are commonly triangular in shape, withthe base down and the apex directed toward the cortical surface. (Pyramidal
Figure 4.26 Electrogenesis of cortical field potentials for a net excitatoryinput to the apical dendritic tree of a typical pyramidal cell. For the case of anet inhibitory input, polarity is reversed and the apical region becomes asource (þ). Current flow to and from active fluctuating synaptic knobs on thedendrites produces wavelike activity. (See text.)
4 . 8 T H E E L E C T R O E N C E P H A L O G R A M 169
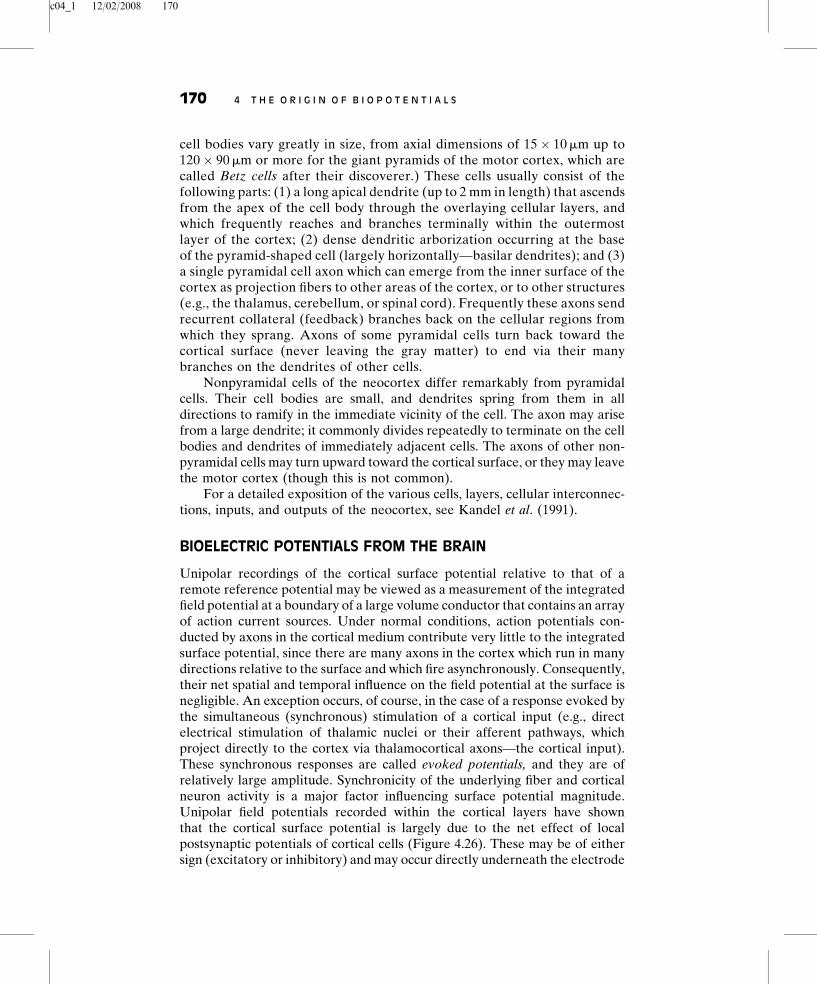
c04_1 12/02/2008 170
cell bodies vary greatly in size, from axial dimensions of 15� 10 mm up to120� 90 mm or more for the giant pyramids of the motor cortex, which arecalled Betz cells after their discoverer.) These cells usually consist of thefollowing parts: (1) a long apical dendrite (up to 2 mm in length) that ascendsfrom the apex of the cell body through the overlaying cellular layers, andwhich frequently reaches and branches terminally within the outermostlayer of the cortex; (2) dense dendritic arborization occurring at the baseof the pyramid-shaped cell (largely horizontally—basilar dendrites); and (3)a single pyramidal cell axon which can emerge from the inner surface of thecortex as projection fibers to other areas of the cortex, or to other structures(e.g., the thalamus, cerebellum, or spinal cord). Frequently these axons sendrecurrent collateral (feedback) branches back on the cellular regions fromwhich they sprang. Axons of some pyramidal cells turn back toward thecortical surface (never leaving the gray matter) to end via their manybranches on the dendrites of other cells.
Nonpyramidal cells of the neocortex differ remarkably from pyramidalcells. Their cell bodies are small, and dendrites spring from them in alldirections to ramify in the immediate vicinity of the cell. The axon may arisefrom a large dendrite; it commonly divides repeatedly to terminate on the cellbodies and dendrites of immediately adjacent cells. The axons of other non-pyramidal cells may turn upward toward the cortical surface, or they may leavethe motor cortex (though this is not common).
For a detailed exposition of the various cells, layers, cellular interconnec-tions, inputs, and outputs of the neocortex, see Kandel et al. (1991).
BIOELECTRIC POTENTIALS FROM THE BRAIN
Unipolar recordings of the cortical surface potential relative to that of aremote reference potential may be viewed as a measurement of the integratedfield potential at a boundary of a large volume conductor that contains an arrayof action current sources. Under normal conditions, action potentials con-ducted by axons in the cortical medium contribute very little to the integratedsurface potential, since there are many axons in the cortex which run in manydirections relative to the surface and which fire asynchronously. Consequently,their net spatial and temporal influence on the field potential at the surface isnegligible. An exception occurs, of course, in the case of a response evoked bythe simultaneous (synchronous) stimulation of a cortical input (e.g., directelectrical stimulation of thalamic nuclei or their afferent pathways, whichproject directly to the cortex via thalamocortical axons—the cortical input).These synchronous responses are called evoked potentials, and they are ofrelatively large amplitude. Synchronicity of the underlying fiber and corticalneuron activity is a major factor influencing surface potential magnitude.Unipolar field potentials recorded within the cortical layers have shownthat the cortical surface potential is largely due to the net effect of localpostsynaptic potentials of cortical cells (Figure 4.26). These may be of eithersign (excitatory or inhibitory) and may occur directly underneath the electrode
170 4 T H E O R I G I N O F B I O P O T E N T I A L S

c04_1 12/02/2008 171
or at some distance from it. A potential change recorded at the surface is ameasure of the net potential (current resistance iR) drop between the surfacesite and the distant reference electrode. It is obvious, however, that if all thecell bodies and dendrites of cortical cells were randomly arranged in thecortical medium, the net influence of synaptic currents would be zero. Thiswould result in a ‘‘closed field’’ situation that produces relatively small far-fieldpotentials (Lorente de No, 1947). Thus, any electrical change recorded at thesurface must be due to the orderly and symmetric arrangement of some class ofcells within the cortex.
Pyramidal cells of the cerebral cortex are oriented vertically, with theirlong apical dendrites running parallel to one another. Potential changes in onepart of the cell relative to another part create ‘‘open’’ potential fields in whichcurrent may flow and potential differences can be measured at the corticalsurface. Figure 4.26 illustrates this concept in diagrammatic fashion. Synapticinputs to the apical dendritic tree cause depolarization of the dendriticmembrane. As a result, subthreshold current flows in a closed path throughthe cytoplasmic core of the dendrites and cell body of the pyramidal cell,returning ultimately to the surface synaptic sites via the extracellular bathingmedium. From the indicated direction of the lines of current flow, theextracellular medium about the soma behaves as a source (þ), while theupper part of the apical dendritic tree behaves as a sink (�).
The influence of a particular dendritic postsynaptic potential (PSP) on thecortical surface recording depends on its sign [excitatory (�) or inhibitory (þ)]and on its location relative to the measurement site. The effect of each PSPmay be regarded as creating a radially oriented current dipole. Therefore,continuing synaptic input creates a series of potential dipoles and resultingcurrent flows that are staggered but overlapped in space and time. Surfacepotentials of any form can be generated by one population of presynaptic fibersand the cells on which they terminate, depending on the proportion that areinhibitory or excitatory, the level of the postsynaptic cells in the cortex, and soforth.
Nonpyramidal cells in the neocortex, on the other hand, are unlikely tocontribute substantially to surface records. Their spatially restricted dendritictrees are radially arranged around their cell bodies such that charge differencesbetween the dendrites and the cell body produce fields of current flow that sumto zero when viewed from a relatively great distance on the cortical surface(closed-field situation).
Thus, to summarize, the apical dendrites of pyramidal cells constitute ameshwork of similarly oriented, densely packed units in the outer layers of thecortex. As multiple synaptic endings on the dendritic tree of each cell becomeactive, current can flow in either direction between the dendritic processdepending on whether the synapses are excitatory or inhibitory. Thesource–sink relationship between dendrite and cell is that of a constantlyshifting current dipole, where variations in dipole orientation and strengthproduce wavelike fluctuations in the surface field potential (Figure 4.26).When the sum of dendritic activity is negative relative to the cell, the cell
4 . 8 T H E E L E C T R O E N C E P H A L O G R A M 171

c04_1 12/02/2008 172
is depolarized and quite excitable. When it is positive, the cell is hyper-polarized and less excitable.
RESTING RHYTHMS OF THE BRAIN
Electric recordings from the exposed surface of the brain or from the outersurface of the head demonstrate continuous oscillating electric activity withinthe brain. Both the intensity and the patterns of this electric activity aredetermined to a great extent by the overall excitation of the brain resultingfrom functions in the brainstem reticular activating system (RAS). Theundulations in the recorded electric potentials (Figure 4.27) are called brainwaves, and the entire record is called an electroencephalogram (EEG).
Figure 4.27 (a) Different types of normal EEG waves. (b) Replacement ofalpha rhythm by an asynchronous discharge when patient opens eyes.(c) Representative abnormal EEG waveforms in different types of epilepsy.(From A. C. Guyton, Structure and Function of the Nervous System, 2nd ed.,Philadelphia: W.B. Saunders, 1972; used with permission.)
172 4 T H E O R I G I N O F B I O P O T E N T I A L S

c04_1 12/02/2008 173
The intensities of the brain waves on the surface of the brain (recordedrelative to an indifferent electrode such as the earlobe) may be as large as 10 mV,whereas those recorded from the scalp have a smaller amplitude of approximately100 mV. The frequencies of these brain waves range from 0.5 to 100 Hz, and theircharacter is highly dependent on the degree of activity of the cerebral cortex. Forexample, the waves change markedly between states of wakefulness and sleep.Much of the time, the brain waves are irregular, and no general pattern can beobserved. Yet at other times, distinct patterns do occur. Some of these arecharacteristic of specific abnormalities of the brain, such as epilepsy (discussedlater). Others occur in normal persons and may be classified as belonging to one offour wave groups (alpha, beta, theta, and delta), which are shown in Figure 4.27(a).
Alpha waves are rhythmic waves occurring at a frequency between 8 and13 Hz. They are found in EEGs of almost all normal persons when they areawake in a quiet, resting state of cerebration. These waves occur most intenselyin the occipital region but can also be recorded, at times, from the parietal andfrontal regions of the scalp. Their voltage is approximately 20 to 200 mV. Whenthe subject is asleep, the alpha waves disappear completely. When the awakesubject’s attention is directed to some specific type of mental activity, the alphawaves are replaced by asynchronous waves of higher frequency but loweramplitude. Figure 4.27(b) demonstrates the effect on the alpha waves of simplyopening the eyes in bright light and then closing them again. Note that thevisual sensations cause immediate cessation of the alpha waves; these arereplaced by low-voltage, asynchronous waves.
Figure 4.27 (Continued)
4 . 8 T H E E L E C T R O E N C E P H A L O G R A M 173

c04_1 12/02/2008 174
EXAMPLE 4.5 Design a system that would provide nonvisual feedback to asubject who wished to maximize the amplitude of his EEG alpha waves.Explain its operation.
ANSWER Three electrodes over the occipital lobe detect the 100 mV EEGand feed a differential amplifier with a gain of 10,000. A band-pass filtercentered at 10 Hz selects the alpha waves, which are demodulated and filteredto yield a dc voltage proportional to amplitude. A voltage-to-frequencyconverter increases the frequency of an acoustic tone, and the subject attemptsto maximize the frequency.
Beta waves normally occur in the frequency range of 14 to 30 Hz, andsometimes—particularly during intense mental activity—as high as 50 Hz.These are most frequently recorded from the parietal and frontal regions of thescalp. They can be divided into two major types: beta I and beta II. The beta Iwaves have a frequency about twice that of the alpha waves. They are affectedby mental activity in much the same way as the alpha waves (they disappearand in their place appears an asynchronous, low-voltage wave). The beta IIwaves, on the other hand, appear during intense activation of the centralnervous system and during tension. Thus one type of beta activity is elicited bymental activity, whereas the other is inhibited by it.
Theta waves have frequencies between 4 and 7 Hz. These occur mainly inthe parietal and temporal regions in children, but they also occur duringemotional stress in some adults, particularly during periods of disappointmentand frustration. For example, they can often be brought about in the EEG of afrustrated person by allowing the person to enjoy some pleasant experienceand then suddenly removing the element of pleasure. This causes approxi-mately 20 s of theta waves.
Delta waves include all the waves in the EEG below 3.5 Hz. Sometimesthese waves occur only once every 2 or 3 s. They occur in deep sleep, in infancy,and in serious organic brain disease. They can also be recorded from the brainsof experimental animals that have had subcortical transections producing afunctional separation of the cerebral cortex from the reticular activatingsystem. Delta waves can thus occur solely within the cortex, independent ofactivities in lower regions of the brain.
A single cortical cell can give rise only to small extracellular current, so largenumbers of neurons must be synchronously active to give rise to the potentialsrecorded from the cerebral surface. The individual waves of the EEG are of longduration (for example, 30 to 500 ms), and one might well ask how they areproduced. They can be long-lasting depolarizations of the cell membranes (forexample, of the apical dendrites of pyramidal cells) or a summation of a numberof shorter responses. In any event, a sufficiently large number of neurons mustdischarge together to give rise to these cortical potentials. The term synchroni-zation is used to describe the underlying process that acts to bring a group ofneurons into unified action. Synaptic interconnections are generally thought tobring about synchronization, although extracellular field interaction between
174 4 T H E O R I G I N O F B I O P O T E N T I A L S

c04_1 12/02/2008 175
cells has been proposed as a possible mechanism. Rhythmically firing neurons arevery sensitive to voltage gradients in their surrounding medium.
Besides the synchronization required for each wave of resting EEG, the seriesof repeated waves suggests a rhythmic and a trigger or pacemaker process thatinitiates such rhythmic action. By means of knife cuts below the intact connective-tissue covering (meningeal layer or pia matter) of the brain, one may preparechronic islands of cortex—with all neuronal connections cut, but with the bloodsupply via surface vessels intact. Only a low level of EEG activity remains in suchislands. Though the isolated islands of cortex may not show spontaneous EEGactivity, they still have the ability to respond rhythmically, which may be readilydemonstrated by the rhythmic responses that are elicited by applying a singleelectrical stimulus. The inference is that various regions of the cortex, thoughcapable of exhibiting rhythmic activity, require trigger inputs to excite rhythmic-ity. The RAS, mentioned earlier, appears to provide this pacemaker function.
THE CLINICAL EEG
The system most often used to place electrodes for monitoring the clinicalEEG is the International Federation 10–20 system shown in Figure 4.28. Thissystem uses certain anatomical landmarks to standardize placement of EEGelectrodes. The representation of the EEG channels is referred to as amontage. In the bipolar montage, each channel measures the differencebetween two adjacent electrodes. In the referential montage, each channel
Figure 4.28 The 10–20 electrode system This system is recommended by theInternational Federation of EEG Societies. [From H. H. Jasper, ‘‘The ten–twenty electrode system of the International Federation in Electroencepha-lography and Clinical Neurophysiology.’’ EEG Journal, 1958, 10 (Appendix),371–375.]
4 . 8 T H E E L E C T R O E N C E P H A L O G R A M 175

c04_1 12/02/2008 176
measures the diffference between one electrode and a reference electrode,such as on the ear. In the average reference montage, each channel measuresthe difference between one electrode and the average of all other electrodes.In the Laplacian montage, each channel measures the difference between oneelectrode and a weighted average of the surrounding electrodes. The differ-ential amplifier requires a separate ground electrode plus differential inputs tothe electrode connections. The advantage of using a differential recordingbetween closely spaced electrodes (between successive pairs in the standardsystem, for example) is cancellation of far-field activity common to bothelectrodes; one thereby obtains sharp localization of the response. Althoughthe same electric events are recorded in each of the ways, they appear in adifferent format in each case. The potential changes that occur are amplified byhigh-gain, differential, capacitively coupled amplifiers. The output signals arerecorded and displayed.
In the routine recording of clinical EEGs, the input electrodes are aproblem. They must be small, they must be easily affixed to the scalp withminimal disturbance of the hair, they must cause no discomfort, and they mustremain in place for extended periods of time. Technicians prepare the surfaceof the scalp, degrease the recording area by cleaning it with alcohol, apply aconducting paste, and glue nonpolarizable Ag/AgCl electrodes to the scalpwith a glue (collodion) and hold them in place with rubber straps, or use arubber cap that contains all electrodes.
The EEG is usually recorded with the subject awake but resting recumbenton a bed with eyes closed. With the patient relaxed in such a manner, artifactsfrom electrode-lead movement are significantly reduced, as are contaminatingsignals from the scalp. Muscle activity from the face, neck, ears, and so on isperhaps the most subtle contaminant of EEG records in the recording of bothspontaneous ongoing activity in the brain and activity evoked by a sensorystimulus (evoked response). For example, the frequency spectrum of the fieldproduced by mildly contracted facial muscles contains frequency componentswell within the nominal EEG range (0.5 to 100 Hz). After technicians haveachieved resting, quiescent conditions in the normal adult subject, the subject’sscalp recordings show a dominant alpha rhythm in the parietal-occipital areas,whereas in the frontal areas, there is a low-amplitude, higher-frequency betarhythm in addition to the alpha rhythm. In the normal subject there issymmetry between the recordings of the right and left hemispheres. Therecan be a wide range of EEG measurement artifacts.
In general there is a relationship between the degree of cerebral activityand the average frequency of the EEG rhythm: The frequency increasesprogressively with higher and higher degrees of activity. For example, deltawaves are frequently found in stupor, surgical anesthesia, and sleep; thetawaves in infants; alpha waves during relaxed states; and beta waves duringintense mental activity. However, during periods of mental activity, the wavesusually become asynchronous rather than synchronous, so that the magnitudeof the summed surface potential recording decreases despite increased corticalactivity.
176 4 T H E O R I G I N O F B I O P O T E N T I A L S

c04_1 12/02/2008 177
SLEEP PATTERNS
When an individual in a relaxed, inattentive state becomes drowsy and fallsasleep, the alpha rhythm is replaced by slower, larger waves (Figure 4.29). Indeep sleep, very large, somewhat irregular delta waves are observed. Inter-spersed with these waves—during moderately deep sleep—are bursts of alpha-like activity called sleep spindles. The alpha rhythm and the patterns of thedrowsy and sleeping subject are synchronized, in contrast with the low-voltagedesynchronized, irregular activity seen in the subject who is in an alert state.
The high-amplitude, slow waves seen in the EEG of a subject who is asleepare sometimes replaced by rapid, low-voltage irregular activity resembling thatobtained in alert subjects. However, the sleep of a subject with this irregularpattern is not interrupted; in fact, the threshold for arousal by sensory stimuli iselevated. This condition has therefore come to be called paradoxical sleep.During paradoxical sleep, the subject exhibits rapid, roving eye movements.For this reason, it is also called rapid-eye-movement sleep, or REM sleep.Conversely, spindle or synchronized sleep is frequently called nonrapid-eye-movement (NREM), or slow-wave sleep. Human subjects aroused at a timewhen their EEG exhibits a paradoxical (REM) sleep pattern generally report
Figure 4.29 The electroencephalographic changes that occur as a human subject
goes to sleep The calibration marks on the right represent 50 mV. (From H.H. Jasper, ‘‘Electrocephalography.’’ In Epilepsy and Cerebral Localization, W.G. Penfield and T. C. Erickson (eds.). Springfield, IL: Charles C. Thomas,1941.)
4 . 8 T H E E L E C T R O E N C E P H A L O G R A M 177

c04_1 12/02/2008 178
that they were dreaming, whereas individuals wakened from spindle sleep donot. This observation and other evidence indicate that REM sleep anddreaming are closely associated. It is interesting that during REM sleep, thereis a marked reduction in muscle tone, despite the rapid eye movements.
THE VOLUME-CONDUCTOR PROBLEM INELECTROENCEPHALOCRAPHY
Geometrically speaking, the brain approximates a sphere surrounded byconcentric shells that differ in impedance and comprise the meninges (connec-tive tissue coverings of the brain), cerebral spinal fluid, skull, and scalp. Thismodel is inaccurate to the extent that the brain is not really a true sphere, andits coverings are irregular in shape and thickness. Such irregularities areinsignificant for the upper half of the brain, but complications are introducedby the marked departure of the lower parts of the brain from a spherical shape,as well as by variations in impedance produced by the openings (to the spinalcolumn) through the base of the shell. Various cerebral structures differsomewhat in specific resistivity. Resistivity also varies in relation to thepredominant direction of the fibers within the white matter. Thus the brainis neither a homogeneous nor an isotropic conducting medium.
In practice, neurological generators do not correspond precisely to simple,one-dimensional dipoles. Any source of activity large enough to manifest itselfin the EEG constitutes at least a small area of the cortex containing synchro-nously active neurons. This source may be regarded as a three-dimensionalsheet polarized across its thickness. If it is small enough, it may still beconveniently represented as an equivalent dipole per unit volume. A largerarea of the cortex may be curved, or even convoluted, and the equivalentdipole then becomes a complex vector sum of the whole. When there are manywidely scattered active-current generators, an infinite number of combinationsmay give rise to the same pattern of surface potentials.
Determining the equivalent dipole of cerebral activity is therefore ofpractical value only when EEG sources are highly ‘‘focal.’’ Fortunately, thiscondition occurs frequently in the brain’s response to sensory stimulation, aswell as in pathological conditions. For example, Nunez (1981) considers insome depth the subject of the calculation of field potentials from equivalentcurrent sources in inhomogeneous media. Particularly in Chapter of his book,Nunez provides an introduction to the equivalent source models that havebeen used in the field of theoretical electroencephalography to interpret scalppotentials. Examples of these models include the simple dipole at the center ofa spherical conducting medium, the radially oriented dipole not at the center ofa sphere (the radially oriented eccentric dipole), the freely oriented eccentricdipole in a sphere, the dipole in a three-concentric spherical shell model, and adipole current source below a multilayered planar conducting medium.
Considerable interest has arisen in determining the location of intra-cerebral sources of the potentials that are measured on the scalp. In general,nonuniqueness of this inverse problem is well known in that different
178 4 T H E O R I G I N O F B I O P O T E N T I A L S

c04_1 12/02/2008 179
configurations of sources can lead to the same surface distribution. The usualapproach taken to obtaining an approximate solution to the inverse problem isas follows:
1. Assume a model (such as the eccentrically located dipole in a uniform,homogeneous spherical conducting medium. Assume that the electricfield is quasistatic).
2. After obtaining a solution to the associated boundary-value problem (theforward problem), produce model-generated potential values at measure-ment points on the cortical surface.
3. Compare these theoretical potential values with particular discrete-timevalues of EEG waveforms measured at the same surface sites, and form ageneral least-squares reconstruction error function wherein the error isdefined as the difference between predicted and measured potential atseveral selected cortical measurement sites.
4. Iteratively adjust the EEG dipolar source parameters at each discrete-time instant to obtain the best fit to sampled EEG waveforms in a least-squares sense. The optimal dipole location is assumed to be the dipolelocation obtained when the reconstruction error function is so minimized.
The influence of anisotropy on various EEG phenomena has been studiedusing models [Henderson et al. (1975); Cuffin (1991); Haueisen et al. (2002)].These investigations, together with various in vivo studies, substantially agreethat the presence of tissue anisotropy tends to attenuate and smear the patternof scalp-recorded EEGs. However, this type of amplitude-related degradationapparently does not affect the model’s ability to predict the locus of the EEGequivalent-dipole generator (although the dipole moment might be under-estimated). This is important in the sense that one of the major objectives ofelectroencephalography is determination of source location—for localized orfocal activity—because in case of evoked cortical potentials and deep-brainpathologies, this concept of an equivalent-dipole generator is of clinical value.
THE ABNORMAL EEG
One of the more important clinical uses of the EEG is in the diagnosis ofdifferent types of epilepsy and in the location of the focus in the brain causingthe epilepsy. Epilepsy is characterized by uncontrolled excessive activity byeither a part or all of the CNS. A person predisposed to epilepsy has attackswhen the basal level of excitability of all or part of the nervous system risesabove a certain critical threshold. However, as long as the degree of excitabilityis held below this threshold, no attack occurs.
There are two basic types of epilepsy, generalized epilepsy and partialepilepsy. Generalized epilepsy involves the entire brain at once, whereaspartial epilepsy involves a portion of the brain—sometimes only a minutefocal spot and at other times a fair amount of the brain. Generalized epilepsy isfurther divided into grand mal and petit mal epilepsy.
4 . 8 T H E E L E C T R O E N C E P H A L O G R A M 179

c04_1 12/02/2008 180
Grand mal epilepsy is characterized by extreme discharges of neuronsoriginating in the brainstem portion of the RAS. These discharges then spreadthroughout the cortex, to the deeper parts of the brain, and even to the spinalcord to cause generalized tonic convulsions of the entire body. They arefollowed near the end of the attack by alternating muscular contractions, calledclonic convulsions. The grand mal seizure lasts from a few seconds to as long as3 to 4 min and is characterized by postseizure depression of the entire nervoussystem. The subject may remain in a stupor for 1 min to as long as a day or moreafter the attack is over.
The middle recording in Figure 4.27(c) shows a typical EEG during agrand mal attack. This response can be recorded from almost any region of thecortex. The recorded potential is of a high magnitude, and the response issynchronous, with the same periodicity as normal alpha waves. The same typeof discharge occurs on both sides of the brain at the same time, indicating thatthe origin of the abnormality is in the lower centers of the brain that control theactivity of the cerebral cortex, not in the cortex itself. Electrical recordingsfrom the thalamus and reticular formation of experimental animals during aninduced grand mal attack indicate typical high-voltage synchronous activity inthese areas, similar to that recorded from the cerebral cortex. Experiments onanimals have further shown that a grand mal attack is caused by intrinsichyperexcitability of the neurons that make up the RAS structures or by someabnormality of the local neural pathways of this system.
Petit mal epilepsy is closely allied to grand mal epilepsy. It occurs in twoforms, the myoclonic form and the absence form. In the myoclonic form, aburst of neuronal discharges, lasting a fraction of a second, occurs throughoutthe nervous system. These discharges are similar to those that occur at thebeginning of a grand mal attack. The person exhibits a single violent muscularjerk involving arms or head. The entire process stops immediately, however,and the attack is over before the subject loses consciousness or stops what he orshe is doing. This type of attack often becomes progressively more severe untilthe subject experiences a grand mal attack. Thus the myoclonic form of petitmal is similar to a grand mal attack, except that some form of inhibitoryinfluence promptly stops it.
The absence type of petit mal epilepsy is characterized by 5 to 20 s ofunconsciousness, during which the subject has several twitchlike contractionsof the muscles, usually in the head region. There is a pronounced blinking ofthe eyes, followed by a return to consciousness and continuation of previousactivities. This type of epilepsy is also closely allied to grand mal epilepsy. Inrare instances, it can initiate a grand mal attack.
Figure 4.27(c) shows a typical spike-and-dome pattern that is recordedduring the absence type of petit mal epilepsy. The spike portion of the record isalmost identical to the spikes occurring in grand mal epilepsy, but the domeportion is distinctly different. The spike-and-dome pattern can be recordedover the entire cortex, illustrating again that the seizure originates in the RAS.
Partial epilepsy can involve almost any part of the brain, either localizedregions of the cerebral cortex or deeper structures of both the cerebrum and
180 4 T H E O R I G I N O F B I O P O T E N T I A L S

c04_1 12/02/2008 181
brainstem. Partial epilepsy almost always results from some organic lesion ofthe brain, such as a scar that pulls on the neuronal tissue, a tumor thatcompresses an area of the brain, or a destroyed region of the brain tissue.Lesions such as these can cause local neurons to fire very rapid discharges.When the rate exceeds approximately 1000/s, synchronous waves beginspreading over adjacent cortical regions. These waves presumably resultfrom the activity of localized reverberating neuronal circuits that graduallyrecruit adjacent areas of the cortex into the ‘‘discharge,’’ or firing, zone. Theprocess spreads to adjacent areas at rates as slow as a few millimeters perminute to as fast as several centimeters per minute. When such a wave ofexcitation spreads over the motor cortex, it causes a progressive ‘‘march’’ ofmuscular contractions throughout the opposite side of the body, beginningperhaps in the leg region and marching progressively upward to the headregion, or at other times marching in the opposite direction. This is calledJacksonian epilepsy or Jacksonian march.
Another type of partial epilepsy is the so-called psychomotor seizure,which may cause (1) a short period of amnesia, (2) an attack of abnormal rage,(3) sudden anxiety or fear, (4) a moment of incoherent speech or mumbling, or(5) a motor act of rubbing the face with the hand, attacking someone, and soforth. Sometimes the person does not remember his or her activities during theattack; at other times the person is completely aware of, but unable to control,his or her behavior. The bottom tracing of Figure 4.27(c) represents a typicalEEG during a psychomotor seizure showing a low-frequency rectangular-waveresponse with a frequency between 2 and 4 Hz with superimposed 14 Hz waves.
The EEG frequently can be used to locate tumors and also abnormalspiking waves originating in diseased brain tissue that might predispose toepileptic attacks. Once such a focal point is found, surgical excision of the focusoften prevents future epileptic seizures.
The EEG is also used to monitor the depth of anesthesia.The EEG is also used as a brain–computer interface to enable disabled
persons to communicate with a computer.
4.9 THE MAGNETOENCEPHALOGRAM
Active bioelectric sources in the brain generate magnetic as well as electricfields. However, the magnitude of the magnetic field associated with activecortex is extremely low. For example, it is estimated that the magnetic field ofthe alpha wave is approximately 0.1 pT at a distance of 5 cm from the surface ofthe scalp. By way of comparison, this biomagnetic field associated with themagnetoencephalogram (MEG) is roughly one hundred million times weakerthan the magnetic field of the earth ( 50 mT). Recent technological advancesin the study of superconductivity have made measurement of these extremelylow-strength magnetic fields possible. Specifically, the superconducting quan-tum interference device (SQUID) magnetometer, which is based on a
4 . 9 T H E M A G N E T O E N C E P H A L O G R A M 181

c04_1 12/02/2008 182
superconducting effect at liquid helium temperature, has sensitivity on theorder of 0.01 pT. Background fields such as the earth’s magnetic field andurban magnetic noise fields (10 to 100 nT) can be removed for all practicalpurposes by using a gradiometer technique.
Using the MEG offers a number of advantages: (1) The brain and over-lying tissues can be characterized as a single medium having a constantmagnetic permeability m. Therefore, the magnetic field (unlike the electricfield) is not influenced by the shell-like anisotropic inhomogeneities (menin-ges, fluid layers, skull, muscle layer, and scalp) surrounding the brain. (2) Themeasurement is indirect in that electrodes are not necessary to record theMEG. That is, the SQUID detector does not need to touch the scalp, becausethe magnetic field does not disappear in air.
The magnetic vector potential A has the same orientation as the equiv-alent current dipole representing an active region of the brain. For a derivationof the vector potential in terms of the volume current density J, see Plonsey(1969). Because the magnetic field lies perpendicular to the vector potential,radially oriented current dipoles produce magnetic fields that are orientedtangentially to the sphere representing the head. Similarly, tangentially ori-ented brain dipoles produce radially oriented magnetic fields.
The local time dependence of biomagnetic fields can be recorded faithfullywith SQUID detection systems, but in order to measure the field distributionover the surface of the scalp, measurements must be made at many locations.This is a time-consuming process. Superconducting quantum interferencedevice (SQUID) magnetometer vendors have systems with well over 100channels (Wiksow, 1995). Advances in material fabrication techniques in thefield of superconductivity should yield smaller detector coils for better spatialresolution and, subsequently, more precise localization of intracerebral sour-ces of activity.
PROBLEMS
4.1 What are the four main factors involved in the movement of ions across thecell membrane in the steady-state condition?4.2 Assume that life on Mars requires an interior cell potential of þ100 mVand that the extracellular concentrations of the three major species are as givenin Example 4.1. Choose one species that has the permeability coefficient given,and assume the other two permeabilities are zero. Design the cell by calculat-ing the intracellular concentration of the chosen species.4.3 An excitable cell is impaled by a micropipette, and a second extracellularelectrode is placed close by at the outer-membrane surface. Brief pulses ofcurrent are then passed between these electrodes, which may cause it toconduct an action potential. Explain how the polarity of the stimulating pairinfluences the membrane potential, and subsequently the activity, of theexcitable cell.
182 4 T H E O R I G I N O F B I O P O T E N T I A L S

c04_1 12/02/2008 183
4.4 Explain the subthreshold-membrane potential changes that would occur inthe immediate vicinity of each of two extracellular stimulating electrodes placedat the outer-membrane surface of an excitable cell. (See Figure P4.1.) Assumethat membrane potential is determined by impaling the cell with a micropipetteat various points in the vicinity of the stimulating electrodes and recording thepotential with respect to an indifferent extracellular electrode.4.5 If a stimulus of adequate strength is supplied to the stimulating pair ofProblem 4.4, an action potential is generated. Explain by means of the conceptof ‘‘local-circuit’’ current flow how the action potential is able to propagate in anunattenuated fashion down the fiber and away from the site of stimulation.4.6 If an elongated fiber is stimulated in the middle (as opposed to at eitherend), is an action potential propagated in both directions along the fiber? If so,would you expect any differences in the action-potential response measured atequal distances on either side of the stimulation site?4.7 Define the following terms: (a) absolute refractory period, (b) relativerefractory period, (c) compound nerve-action potential, (d) synapse, (e) neuro-myo junction, (f) motor unit, (g) reflex arc.4.8 An excised, active nerve trunk serves as a bioelectric source located on theaxis of a circular cylindrical volume conductor. Field potentials are recorded atvarious radial distances from the nerve trunk from an appropriate electrodeassembly connected to an amplifier. (a) Describe the behavior of the field potentialwith increasing radial distance from the nerve (angle and axial distance are fixed).(b) Describe the effect of increasing the specific resistivity r of the bathing mediumon the magnitude of the field potential, and explain how this change in r might beaccomplished experimentally. (c) In what manner would changing the radius ofthe surrounding volume-conductor affect the magnitude and waveshape of theextracellular field potential? (d) When can a volume conductor of finite dimen-sions be considered an essentially ‘‘infinite’’ volume conductor?4.9 The experimental situation posed in Problem 4.8 is roughly analogous tothe problem of recording either surface or intramuscular potentials from the armof a human subject whose ulnar or median nerve has been stimulated (see Figure4.8, for instance). Explain in terms of changes in specific resistivity and geometrywhy potential waveforms recorded at the wrist may differ considerably fromthose recorded at the level of the forearm (see Figure 4.8).4.10 Define the M wave and the H reflex.4.11 In many forms of peripheral neuropathies, the excitability of someneurons is changed, and their conduction velocities are consequently altered.
Figure P4.1
P R O B L E M S 183

c04_1 12/02/2008 184
Describe the effect that this might have on an EMG recording and on muscularcontraction.4.12 A muscle is paralyzed if its neural connection to, or within, the CNS isinterrupted. A disconnection at the level of the motor neuron is called a lowermotoneuron lesion. A disconnection higher in the spinal cord or brain is calledan upper motoneuron lesion. In both cases, the contractility of the peripheralskeletal muscle is initially preserved, but after a period of disuse, the muscleatrophies. (Atrophy, however, is much delayed in the case of an uppermotoneuron lesion.) Consider Figure P4.2 to represent schematically aquadriplegic patient with paralyzed extremities as shown. Suggest a schemefor using the EMG from an auxiliary intact muscle (for example, the lefttrapezius muscle) to aid in the control of stimulation of the paralyzed limb.(The motor nerve supply to the trapezius muscle is assumed to lie above thesite of spinal-cord lesion and is therefore under volitional control. Draw ablock diagram of the suggested control system. Label the anatomical struc-tures serving as the plant (or controlled system), the controller, the feedbackpathway, the actuator, and so forth. [Hint: The EMG signal is usuallyamplified, rectified, and low-pass filtered before it is used to modulate astimulator. For further interesting discussions of the work in this area, seeVodovnik et al. (1981).]4.13 Conduct a search of the literature on the subject of the use of electro-myography in the study of (a) the function of ocular muscles (the EMG yieldsvaluable information regarding the synergistic action of the different ocularmuscles, and it is of value in the interpretation of paralytic squint) and (b)myasthenia gravis and other disorders of neuromuscular transmission.4.14 Define the following cardiac anatomical terms: (a) internodal tracts,(b) subendocardial layer, (c) intercalated disk, (d) bundle branches, (e) ventric-ular activation.4.15 Draw a typical lead II electrocardiogram and label all waves (P, QRS, T)and intervals. Explain what is happening electrically within the heart duringeach wave or interval.
Figure P4.2
184 4 T H E O R I G I N O F B I O P O T E N T I A L S

c04_1 12/02/2008 185
4.16 The electrical activity of the His bundle normally is not present in thetypical ECG recorded at the body surface because of its relatively small tissuemass. However, clinical recordings of His bundle activity could be of consider-able importance in the analysis of various disorders of the conduction system.The His bundle signal can be enhanced for such analyses by successivelyaveraging the surface electrocardiogram, or—better yet—by using an invasivetechnique wherein a small bipolar electrode is introduced into the right atrialchamber via conventional techniques of cardiac catheterization. Conduct asearch of the literature on the topics of noninvasive and invasive methods ofrecording His bundle activity as well as on the use of this signal in diagnosingvarious disorders of the conduction system.4.17 Why is it necessary for the ventricular action potential to have a relativelylong absolute refractory period?4.18 Draw and label a block diagram of the retina considered as a photo-electric sensor. What is the output at the ganglion cell layer and at thephotoreceptive layer?4.19 Explain the components of the ERG in terms of retinal cell activity.4.20 Discuss, in terms of volume-conductor theory, the production of an ERGsignal at a point on the corneal surface of the eye when the retinal bioelectricsource is considered an array of current dipole sources per unit volume.Consider the possibility of (experimentally) exciting each of the elements ofretinal dipole array individually, one at a time, by applying a localized spot oflight superimposed on a background illumination that partially adapts theretina. What special technical considerations are involved?4.21 Discuss the use of the steady corneal–retinal potential of the eye tomeasure eye movements. How accurate is this technique? Discuss at least twoapplications of this method.4.22 Explain the functional role played by the following CNS structures.a. The ascending pathways of the general sensory-nerve fibers and the
descending pathways of the motor-nerve fibersb. The ascending reticular formation (RAS)c. The pre- and postcentral gyrid. The primary auditory and visual corticese. The specific and nonspecific thalamic neural fibers to the cortex
4.23 Relate EEG-wave activity recorded at the surface of the cortex to theunderlying activity of cortical neurons.4.24 Discuss in general terms the design of a spectrum analyzer for automaticanalysis of EEG waves.4.25 How might volume-conductor theory aid in the analysis of evokedcortical potentials produced by specific repetitive stimuli (auditory, visual, etc.)?4.26 Design the switches and resistor networks required, and show all con-nections between any four electrodes on the scalp (Fig. 4.28) and one differentialamplifier, to record the EEG for each of the three types of electrode connections(monopolar, bipolar, and ‘‘average’’ potential recordings). See text associatedwith Figure 4.28.
P R O B L E M S 185

c04_1 12/02/2008 186
REFERENCES
Allessie, M. A., F. I. Bonke, and F. J. Shopman, ‘‘Circus movement in rabbit atrial muscle as amechanism of tachycardia.’’ Circ. Res., 1973, 33, 54–62.
Barr, L., M. M. Dewey, and W. Berger, ‘‘Propagation of action potentials and the structure of thenexus in cardiac muscle.’’ J. Gen. Physiol., 1965, 48, 797–823.
Beeler, G. W., and H. Reuter, ‘‘Reconstruction of the action potential of ventricular myocardialfibres.’’ J. Physiol., 1977, 268, 177–210.
Clark, J. W., and R. Plonsey, ‘‘The extracellular potential field of the single active nerve fiber in avolume conductor.’’ Biophys. J., 1968, 8, 842–864.
Cuffin, N. ‘‘Eccentric spheres model of the head.’’ IEEE Trans. Biomed. Eng., 1991, 38, 871–878.
DeLuca, C., ‘‘Electromyography.’’ In J. G. Webster (ed.), Encyclopedia of Medical Devices and
Instrumentation. 2nd ed. New York: Wiley, 2006, Vol. 3, pp. 98–109.Demir, S., J. W. Clark, C. Murphey, and W. Giles, ‘‘A mathematical model of a rabbit sinoatrial
node cell.’’ Amer. J. Physiol., 1994, 266, C832–C852.DiFrancesco, D., and D. Noble, ‘‘Model of cardiac electrical activity incorporating ionic pumps and
concentration changes.’’ Phil. Trans. R. Soc., 1985, B307, 353–398.Duchene, J. and J. Y. Hogrel, ‘‘A model of EMG generation.’’ IEEE Trans. Biomed. Eng., 2000, 47,
192–201.Esselle, K. P., and M. A. Stuchly, ‘‘Neural stimulation with magnetic fields.’’ IEEE Trans. Biomed.
Eng., 1992, 39, 693–700.Farina, D, L. Mesin, S. Martina, and R. Merletti, ‘‘A surface EMG generation model with
multilayer cylindrical description of the volume conductor.’’ IEEE Trans. Biomed. Eng.,2004, 51, 415–426.
Farina, D., E. Schulte, R. Merletti, G. Rau, C. Disselhorst-Klug, ‘‘Single motor unit analysis fromspatially filtered surface electromyogram signals: Parts I and II.’’ Med. Biol. Eng. Comput.,2003, 41, 330–345.
Ganapathy, N., J. W. Clark Jr., and O. B. Wilson, ‘‘Extracellular potentials from skeletal muscle.’’Math. Biosciences, 1987, 83, 61–96.
Geddes, L. A., ‘‘Optimal stimulus duration for extracranial cortical stimulation.’’ Neurosurgery,1987, 20, 94–99.
Goldman, D. E., ‘‘Potential, impedance and rectification in membranes.’’ J. Gen. Physiol, 1943, 27,37–60.
Halter, J. A., and J. W. Clark Jr., ‘‘A distributed-parameter model of the myelinated nerve fiber,’’ J.
Theo. Biol., 1991, 148, 345–382.Haueisen, J., D. S. Tuch, C. Ramon, P. H. Schimpf, V. J. Wedeen, J. S. George, and J. W. Belliveau,
‘‘The influence of brain tissue anisotropy on human EEG and MEG.’’ Neuroimage, 2002, 15,159–166.
Heckenlively, J. R., and G. B. Arden (eds.), Principles and Practice of Clinical Electrophysiology
of Vision. St. Louis, MO: Mosby Year Book, 1991.Henderson, C. J., S. R. Butler, and A. Glass, ‘‘The localization of equivalent dipoles of EEG
sources by the application of electric field theory.’’ Electroencephalog. Clin. Neurophysiol.,1975, 39, 117–130.
Hodgkin, A. L., and A. F. Huxley, ‘‘A quantitative description of membrane current and itsapplication to conduction and excitation in nerve.’’ J. Physiol., 1952, 117, 530.
Hodgkin, A. L., and B. Katz, ‘‘The effect of sodium ions on the electrical activity of the giant axonof the squid.’’ J. Physiol., 1949, 108, 37–77.
Jacobson, J. T., Principles and Applications in Auditory Evoked Potentials. Boston, MA: Allyn andBacon, 1994.
Kandel, E. R., J. H. Schwartz, and T. M. Jessell, Principles of Neural Science, 3rd ed. New York:Elsevier Science, 1991.
Au: Pleasesupply textcitation forreference; elsedelete orcreateseparatebibliographysection.
186 4 T H E O R I G I N O F B I O P O T E N T I A L S

c04_1 12/02/2008 187
Levitan I. B., and Kaczmarek, L. K., The Neuron: Cell and Molecular Biology, 3rd ed., New York:Oxford University Press, 2002.
Lorente de No, R., ‘‘Action potential of the motoneurons of the hypoglossus nucleus,’’ J. Cell.
Comp. Physiol., 1947, 29, 207–287.Luo, C. H., and Y. Rudy, ‘‘A dynamic model of the cardiac ventricular action potential I:
Simulations of ionic currents and concentration changes,’’ Circ. Res., 1994, 74, 1097–1113.Mambrito, B., and C. J. DeLuca, ‘‘A technique for the detection, decomposition and analysis of the
EMG signal.’’ Electroencephalog. Clin. Neurophysiol., 1984, 58, 175–188.McAllister, R. E., D. Noble, and R. W. Tsien, ‘‘Reconstruction of the electrical activity of cardiac
Purkinje fibers.’’ J. Physiol., 1975, 251, 1–59.Moffit, M. A., C. C. McIntyre, and W. M. Grill, ‘‘Prediction of myelinated nerve fiber
stimulation thresholds: Limitations of linear models.’’ IEEE Trans. Biomed. Eng.,2004, 51, 229–236.
Moore, J. W., R. W. Joyner, M. H. Brill, S. G. Waxman, and M. Najar-Joa, ‘‘Simulations ofconduction in uniform myelinated fibers.’’ Biophys. J., 1978, 21, 147–160.
Nandedkar, S. D., E. Stalberg, and D. B. Sanders, ‘‘Simulation techniques in electromyography.’’IEEE Trans. Biomed. Eng., 1985, 32, 775–785.
Nazeran, H., ‘‘Electrocardiography, computers in.’’ In J. G. Webster (ed.), Encyclopedia of
Medical Devices and Instrumentation, 2nd ed. New York: Wiley, 2006, pp. 34–53.Niedermeyer, E. and Lopes Da Silva, F. Electroencephalography: Basic Principles, Clinical
Applications and Related Fields, 4th ed. Philadelphia: Lippincott, Williams and Wilkins, 1999.Noble, D., ‘‘A modification of the Hodgkin–Huxley equations applicable to Purkinje fiber action
and pacemaker potentials.’’ J. Physiol., 1962, 160, 317–352.North, A. W., ‘‘Accuracy and precision of electro-oculographic recording.’’ Invest. Ophthalmol.,
1965, 4, 343–348.Nunez, P. L., Electric Fields of the Brain: The Neurophysics of the EEG. New York: Oxford
University Press, 1981.Nygren, A., C. Fiset, L. Firek, J. W. ClarkJr., D. S. Lindblad, R. B. Clark, and W. R. Giles,
‘‘Mathematical model of an adult human atrial cell: The role of Kþ currents in re-polarization.’’ Circ. Res., 1998, 82, 63–81.
Plonsey, R., and R. C. Barr, Bioelectricity: A Quantitative Approach, 3rd ed. New York: Springer,2007.
Plonsey, R., Bioelectric Phenomena. New York: McGraw-Hill, 1969.Puglisi, J. L., and D. M. Bers, ‘‘LabHEART: an interactive computer model of rabbit ventricular
myocyte ion channels and Ca transport.’’ Amer. J. Physiol., 2001, 281, C2049–2060.Reucher, H., G. Rau, and J. Silny, ‘‘Spatial filtering of noninvasive multielectrode EMG: Parts I
and II.’’ IEEE Trans. Biomed. Eng., 1987, 34, 98–113.Rowell, L. B., Human Cardiovascular Control. New York: Oxford University Press, 1993.Sherman, D., and D. Walterspacher, ‘‘Electroencephalography.’’ In J. G. Webster (ed.), Ency-
clopedia of Medical Devices and Instrumentation. 2nd ed., New York: Wiley, 2006, Vol. 3, pp.62–83.
Sinkjaer, T., K. Yoshida, W. Jensen, and V. Schnabel, ‘‘Electroneurography.’’ In J. G. Webster(ed.), Encyclopedia of Medical Devices and Instrumentation. 2nd ed. New York: Wiley, 2006,Vol. 3, pp. 109–132.
Spach, M. S., R. C. Barr, G. A. Serwer, J. M. Kootsey, E. A. Johnson, ‘‘Extracellular potentialsrelated to intracellular action potentials in the dog Purkinje system.’’ Circ. Res., 1972, 30, 505–519.
Stashuk, D., ‘‘EMG signal decomposition: how can it be accomplished and used?’’ J. Electromyogr.
Kinesiol., 2001, 11, 151–173.Vodovnik, L., T. Bajd, A. Kralj, F. Gracanin, and P. Strojnik, ‘‘Functional electrical stimulation for
control of locomotor systems.’’ CRC Crit. Rev. Bioeng., 1981, 6, 63–151.Waxman, S. G., and M. H. Brill, ‘‘Conduction through demyelinated plaques in multiple sclerosis:
Computer simulations of facilitation by short internodes.’’ J. Neural., Neurosurg. and
Psychiat., 1978, 41, 408–416.
R E F E R E N C E S 187

c04_1 12/02/2008 188
Wikswo, J. P., Jr., ‘‘SQUID magnetometers for biomagnetism and nondestructive testing:important questions and initial answers.’’ IEEE Trans. Appl. Superconductivity, 1995, 5,74–120.
Wilders, R., H. J. Jongsma, and A. C van Ginneken, ‘‘Pacemaker activity of the rabbit sinoatrialnode. A comparison of mathematical models.’’ Biophys. J., 1991, 60, 1202–1216.
Yagi T. and P. R. Macleish, ‘‘Ionic conductances of monkey solitary cone inner segments.’’ J.Neurophysiol., 1994, 71, 656–665.
Yanagihara, K., A. Noma, and H. Irisawa, ‘‘Reconstruction of sino-atrial node pacemakerpotential based on the voltage clamp experiments.’’ Japan J. Physiol., 1980, 30, 841–857.
York, D. H., ‘‘Review of descending motor pathways involved with transcranial stimulation.’’Neurosurgery, 1987, 20, 70–73.
188 4 T H E O R I G I N O F B I O P O T E N T I A L S


![Implantable, wireless device platforms for …rogersgroup.northwestern.edu/files/2018/curropneuro.pdfand electroneurogram measurements [30]. Successful collection animal behavioral](https://img.pdfslide.net/doc/110x75/5e27beb767629249454a0ad1/implantable-wireless-device-platforms-for-and-electroneurogram-measurements-30.jpg)

![Cardiac …downloads.hindawi.com/journals/ijhy/2012/968123.pdfENG, electroneurogram. The scheme is based on previous publications [3, 31]. endothelial nitric oxide synthase (eNOS)](https://img.pdfslide.net/doc/110x75/5e5fb6a8cd9bd87cec594b3c/cardiac-eng-electroneurogram-the-scheme-is-based-on-previous-publications-3.jpg)