Embed Size (px)
Citation preview

1
The Origin of Continental Carbonates in Andean Salars: 1 A Multi-Tracer Geochemical Approach in Laguna Pastos Grandes (Bolivia) 2
E. Muller1, E. C. Gaucher2, C. Durlet3, J.S. Moquet1, M. Moreira1, V. Rouchon4, P. 3 Louvat1, G. Bardoux1, S. Noirez4, C. Bougeault3, E. Vennin3, E. Gérard1, M. Chavez5, A. 4 Virgone2, M. Ader1 5
1Université de Paris, Institut de physique du globe de Paris, CNRS, F-75005 Paris, France 6 2Total CSTJF, Avenue Larribau, 64018 Pau Cedex, France 7 3Biogéosciences, UMR 6282 CNRS, 6 boulevard Gabriel, Université Bourgogne 8 Franche-Comté, 21000 Dijon, France 9 4IFP Energies Nouvelles, 1-4 Avenue de Bois Préau, 92852, Rueil-Malmaison Cedex, 10 France 11 5Total E&P, 40 Calle Las Violetas, Edificio Arcus, Santa Cruz de la Sierra, Bolivia 12 Corresponding author: Elodie Muller ([email protected]) 13 14
This article has been accepted in Geochimica et Cosmochimica Acta. 15
Abstract 16 In continental volcanic settings, abundant carbonate precipitation can occur with 17
atypical facies compared to marine settings. The (bio-)chemical processes responsible for 18 their development and early diagenesis are typically complex and not fully understood. In 19 the Bolivian Altiplano, Laguna Pastos Grandes hosts a 40-km2 carbonate platform with a 20 great diversity of facies and provides an ideal natural laboratory to understand the processes 21 responsible for the precipitation of carbonates in a continental province dominated by 22 volcanism. In order to trace the origin of both water and solutes in the lagoon, the major 23 element and stable isotope compositions (δ2H-δ18O, δ37Cl, δ7Li, δ11B and 87Sr/86Sr) of the 24 spring and stream waters were characterized, as well as the stable isotope compositions 25 (δ13C, δ15N) and noble gas isotope ratios of hydrothermal gases associated with spring 26 waters. The results show that thermal springs discharging on the carbonate platform are 27 close to saturation with calcite. PHREEQC modeling, together with fluid geochemistry and 28 temperature estimated from a combination of geothermometers, indicate that Ca in these 29 springs is inherited from the alteration of the volcanic bedrock by aqueous fluids heated at 30 ~225 °C and enriched in magmatic mantle-derived CO2. Our results clearly show that the 31 main driver for the precipitation of modern carbonates in Laguna Pastos Grandes is the 32 deeply sourced CO2, which boosts the alteration of volcanic rocks at depth. 33 34
1. Introduction 35
It has long been documented that continental carbonates can form, in varying abundances, 36 both in pedogenetic profiles (see synthesis in Zamanian et al., 2016; Durand et al., 2018) 37 and in palustrine-lacustrine environments (see synthesis in Alonso-Zarza and Tanner, 38 2010; Verrecchia, 2007). Yet, their occurrences in continental volcanic provinces, typically 39

2
dominated by volcanoclastic, bio-silica, clay or evaporitic sediments, have not been 40 investigated as much as their marine equivalents, generally considered as common 41 hydrocarbon reservoirs and traditional archives of past oceans since the Archean. The 42 recent discovery of hydrocarbon plays in Lower Cretaceous continental carbonates off the 43 Brazilian coast changed this paradigm (Terra et al., 2010; Tosca and Wright, 2015) and 44 promoted several studies focused on the origin and occurrence of carbonates in continental 45 settings where the catchment and underlying rocks are mainly volcanic (e.g., Teboul et al., 46 2016; 2017). 47
Laguna Pastos Grandes in southern Bolivia includes a ~40 km2 carbonate platform making 48 it unique among the more than 200 salars scattered across the volcanic Central Andes 49 region (Fig. 1a, b). Laguna Negra in Argentina is the only other Andean salar recently 50 described with a significant, but much smaller (6.5 km2; Gomez et al., 2014), carbonate 51 platform. Laguna Pastos Grandes exhibits a great diversity of calcitic, siliceous and 52 evaporitic fabrics deposited in palustrine to shallow lacustrine environments, including 53 some of the largest modern pisoliths discovered to date (Fig. 1c; Risacher and Eugster, 54 1979; Jones and Renaut, 1994; Bougeault et al., 2019). In some ways, it may be considered 55 as a modern equivalent of carbonate facies and processes that occurred during 56 sedimentation of the Presalt facies in the volcanic-rich South Atlantic realm during the 57 Early Cretaceous. 58
Although several studies were conducted on the hydrology and origin of chemical 59 sediments in Bolivian and Chilean salars, a clear explanation for the abundance of modern 60 carbonates in Laguna Pastos Grandes is still lacking. From structural, climatic and 61 lithological points of view, Laguna Pastos Grandes seems to be similar to salars where 62 carbonate precipitation is insignificant (Risacher et al., 2003; Risacher and Fritz, 2009; see 63 geological setting). Indeed, while climatic parameters fundamentally control the existence 64 and morphology of salars (Risacher and Fritz, 2009), the chemical composition of the 65 brines and the nature of the precipitates in these lakes mainly depend on the initial 66 composition of the inflow waters. In the present study, we thus performed a comprehensive 67 geochemical study of gases and waters discharging on the carbonate platform of Laguna 68 Pastos Grandes and of the brine filling the main basin. 69
The overarching goal of our research is to better understand the ongoing processes that 70 allow for the rapid growth of these continental carbonates in a volcanic area under 71 structural extension and fed by hydrothermal fluids. As a first step, this study focuses on 72 the origin of the fluids and solutes from which carbonates have formed in the laguna based 73 on the study of: (i) the chemical compositions of water samples from streams of the 74 drainage area and hydrothermal springs upwelling through or near the carbonate platform 75 and gas associated with the hydrothermal springs; (ii) the isotopic compositions of gas 76 components (δ13C, δ15N and noble gases), water samples (δ2H and δ18O) and some of their 77 solutes (δ37Cl, δ7Li, δ11B and 87Sr/86Sr); and (iii) Li, B and Sr isotopic compositions of 78 volcanic rock samples surrounding the salar. These results, together with the temperature 79 of the underlying geothermal reservoir estimated from a combination of geothermometers 80 and with PHREEQC modeling of the hydrological system allowed us to identify the main 81

3
factor responsible for the abundant precipitation of modern carbonates in Laguna Pastos 82 Grandes. 83
2. Geological Setting 84 Laguna Pastos Grandes is located in the southern part of the Bolivian Altiplano, in the 85 South Lipez region. The Altiplano (3700 – 4500 m) is a major Plio-Pleistocene continental 86 plateau bounded by the Eastern and Western Cordilleras and dominated by Cenozoic 87 stratovolcanoes and their products (Fig. 1). To the south, rhyolitic ignimbrites and dacites 88 to rhyodacites of the Altiplano-Puna Volcanic Complex (APVC) dominate the South Lipez 89 region, whereas andesites to dacites predominate on the Chilean side (Thorpe et al., 1976). 90 Native sulfur deposits occur on many volcanoes in Chile, and thermal springs are abundant. 91 A thick succession of Cretaceous and Tertiary continental sediments, including evaporite 92 deposits, outcrops in the Bolivian Eastern Cordillera and could be covered by volcanic 93 rocks towards the west in the studied area (Deconinck et al., 2000). 94 95 There are more than 200 closed basin lakes in the Bolivian Altiplano and Chilean Western 96 Cordillera (Luddington et al., 1992). Most are saline and encompass a wide range of 97 perennial or ephemeral lakes, locally termed “salars”. The two largest salars, Uyuni and 98 Coipasa, are remnants of larger Pleistocene lakes and occupy the lower part of the Altiplano 99 (3650 m altitude), whereas an abundance of smaller evaporitic basins (<400 km2) occur at 100 higher altitudes (4000–4500 m) of the southern Altiplano (Fig. 1). The presence of these 101 southern basins and their morphology primarily result from the cold and dry climate of this 102 region, characterized by mean annual precipitations between 100 and 200 mm, air 103 temperatures varying from -30 °C in winter to 25 °C in summer with daytime fluctuations 104 of up to 40 °C, and annual evaporation of about 1400 mm (Risacher and Fritz, 1991). 105 Although they belong to relatively similar environments in terms of geology and climate, 106 Andean salars show a wide variety of brine compositions, which can be organized into 107 three major groups: alkaline, sulfate-rich, and calcium-rich brines (Risacher and Fritz, 108 2009). Different precipitates can be found in association with these brines, the most 109 common being sodium chloride, sodium sulfates to borates, sodium carbonates and calcium 110 sulfates (Risacher and Fritz, 2009). Their formation and evolution are thought to result 111 from the combination of two fundamental factors: the presence of interior drainage basins 112 as a source of solutes and high evaporation rates allowing salt precipitation (Risacher et 113 al., 2003). Inflows to the Andean salars stem from various sources such as permanent and 114 ephemeral streams, shoreline springs, groundwater discharge, and thermal springs. Most 115 of the rainwater falling on the drainage area infiltrates and recharges underlying aquifers. 116 Shoreline spring and hot-spring waters are typically enriched in solutes compared with 117 streams due to the dissolution of ancient and/or present-day evaporitic sediments or 118 through the infiltration and recycling of lake brines. Therefore, the composition of inflow 119 waters feeding Andean salars reflects a mixture from two main sources: (1) dilute waters 120 produced by the alteration of volcanic rocks by meteoric waters and (2) highly concentrated 121 brackish waters derived from brine/salt recycling (Risacher et al., 2003 and references 122 therein). The high rate of evaporation of these inflow waters in ponds and lakes increases 123 the concentration of solutes and leads to the precipitation of a sequence of minerals in the 124 order of their increasing solubility, following diverse evaporative pathways depending on 125 the initial chemistry of inflow waters (Risacher and Fritz, 2009). 126 127

4
With an area of ~120 km2, Laguna Pastos Grandes is one of the largest salars of the 128 southern Altiplano (Risacher and Eugster, 1979). This salar lies at an altitude of 4450 m in 129 a 50-km-long caldera dated at 2.89±0.01 Ma by 40Ar/39Ar of sanidine (Salisbury et al., 130 2011) and is probably the remnant of a larger lake that once occupied the caldera moat (de 131 Silva and Francis, 1991). The drainage basin (660 km2) is limited to the west by rhyolitic 132 lava ridges up to an elevation of 5800 m, and to the east by rhyolitic ignimbrite ridges up 133 to an elevation of 5000 m (Fig. 1b). Coalescent alluvial fans with thin pebbly soils and 134 xerophytic vegetation surround the laguna. Laguna Pastos Grandes can be divided into two 135 main domains previously identified by Ballivian and Risacher (1981) and Jones and Renaut 136 (1994): the eastern domain corresponds to a playa environment characterized by gypsum 137 and carbonate muds associated with ulexite (NaCaB5O6(OH)6), and the western domain 138 corresponds to a vast 40-km² palustrine carbonate platform, highly fragmented through 139 cryoturbation exposing underlying recent carbonates (muds to calcarenites). Over these 140 recent carbonate deposits, a few ponds no more than one decimeter deep host pisoliths and 141 carbonate concretions up to 20 cm thick (Fig. 1c). Hydrothermal spring discharge over this 142 platform produces important modern carbonate deposits (Bougeault et al., 2019). 143
3. Materials and Methods 144
3.1 Water, gas and rock sampling 145 Nine water samples were collected during two sampling trips in January 2016 and 146
March 2017, dry and wet seasons respectively (Tables 1, 2). We thus consider our samples 147 as representative of the two main climatic seasons in terms of rainfall. Seven samples of 148 water were selected from five thermal springs including one on the border of the laguna, 149 two samples from cold streams, and one sample of brine from the southwestern part of the 150 laguna (Fig. 2, Tables 1, 2). Two samples of fresh snow and one sample of rainfall were 151 also collected respectively in January 2016 and March 2017 in order to constrain the 152 meteoric sources of water in the area (Table A2). 153 Water samples were filtered using a 0.1 µm sterile acrylic filter (Sartorius Minisart®) fixed 154 at the end of a 50 mL syringe. For cation analyses, ~20 ml samples were acidified with 3 155 drops of HNO3 (16N) in the field. The temperature and pH were measured on site at each 156 collection point. In 2016, in the field, the total alkalinity was determined by H2SO4 (1.6 N) 157 titration using a manual titrator and adapted cartridge (Hach®; error below 1%, Table 2; 158 Gran, 1952). Samples of 25 ml were titrated and 25 titrations (pH and volume of added 159 titrated acid) were numerically processed using the Gran function (Gran, 1952). The 160 correlation factors obtained by regression on the derivate of the titration curve are better 161 than 0.998. In 2017, the total alkalinity was determined by end-point titration with HCl 162 (1N or 0.1N) with an automatic titrimeter (Metrohm) at the Total laboratory (France, error 163 below 1%; Rounds and Wilde, 2012). The bicarbonates alkalinity was calculated from the 164 total alkalinity corrected from the contribution of weak acid and B(OH)4- concentration. 165 The B(OH)4- concentration was calculated from the B concentration (obtained with ICP-166 AES) and the pH of the sampled solution. The weak acid (HCOO-; CH3COO-; C2H5COO-167 ; i-C3H7COO-; n-C3H7COO-) were measured by ionic chromatography (930 Compact IC 168 Flex, Metrohm). Considering the high alkalinities of the samples, the contribution of OH- 169 remains negligible. In this article, the alkalinity refers to the HCO3-/CO32- alkalinity. 170
171 Four thermal springs named La Salsa, La Rumba, El Ojo Verde and El Gigante 172 (Fig. 2) were selected for both water and gas sampling on the carbonate platform based on 173

5
accessibility and high water-gas flux. La Salsa, La Rumba and El Ojo Verde springs contain 174 bubbling sources of gas in water ponds whereas El Gigante is a dry source of gas (a mofet) 175 away from the main water source. Gases were collected in March 2017 in 100- and 250-176 mL stainless-steel reservoirs and in four 12 mL Exetainer® vials, all previously evacuated 177 to primary vacuum. To capture bubbling thermal spring gases, an inverted funnel 178 connected to a rubber pipe was submerged in spring water and placed on top of the rising 179 bubbles (Fig. A1). The other end of the pipe was connected through a T-junction to a 180 stainless-steel fitting ending in a septum (for sampling in an Exetainer®) and a stainless-181 steel reservoir (for direct sampling) connected to a GA5000 gas detector (Scientific 182 Instruments). Before collecting the gases accumulated in the funnel, the sampling system 183 was completely flushed by the continuously outgassing bubbles to avoid air contamination 184 (O2 level typically below 2.0%). 185 Five rock samples of volcanic bedrock (2 andesites, 2 dacites and 1 ignimbrite of 186 rhyolitic composition) were also collected on the border of the laguna (see location in Fig. 187 2). 188
3.2 Analytical methods – Chemical compositions 189 Gas composition 190 The gas composition was determined on the four samples collected in Exetainer® vials with 191 a Varian 3800 high-resolution gas chromatograph (GC) equipped with Molsieve and 192 Haesep type chromatographic columns at the IFPEN laboratory (Rueil-Malmaison, 193 France). H2 and He quantification was performed using a thermal conductivity detector 194 (TCD) with N2 as the carrier gas, whereas CO2, N2, O2 and CH4 were quantified using a 195 TCD with He as the carrier gas. Relative concentrations were calculated after the 196 chromatographic response had been calibrated in partial pressure for each compound using 197 "Air Liquide TM" and "Saphir". These standards are quality gas mixtures that include H2, 198 He, N2, CO2, O2, CH4, C2H6, C3H8, n-C4H10 and i-C4H10, available in the laboratory at 199 different concentrations bracketing the samples’ composition range. Each sample analysis 200 was followed by a blank analysis to ensure the absence of carry over. Results are given 201 with a precision of ± 5 vol.% for O2, ±1.3 vol.% for CO2, ±3 vol.% for N2 and ±0.1 vol.% 202 for CH4 based on replicate measurements of gas standards of similar concentrations. 203 204 Water composition 205 All chemical analyses were carried out in the Total laboratories (Pau, CSTJF, France) using 206 ion chromatography (Cl, Br and SO4), Inductively Coupled Plasma-Atomic Emission 207 Spectroscopy (Li, B and Sr), Inductively Coupled Plasma-Mass Spectrometry (Ca and 208 Mg), and Flame Emission Spectrometry (Na, K, Ca and SiO2). Accuracy for major 209 elements was better than ± 5% and verified by repeated measurements of certified standard 210 materials, namely Ion96-3 and LGC6020 (river waters) for cations and anions, and diluted 211 Li and B ICP-AES standard solutions (Merck). Saline samples were analyzed either after 212 dilution (to minimize matrix effects during measurement) or by adding a standard (to match 213 the matrix of the standard materials). The matrix effects were validated on at least three 214 dilutions (500, 1000, 2000). 215
3.3 Analytical methods – Isotopic compositions 216 CO2 gas 217 The isotopic composition of the CO2 gas was measured in Exetainer® vials at the IFPEN 218 laboratory using a MAT253 (Finnigan Mat-Thermo Fisher) triple collection mass 219

6
spectrometer coupled to a gas chromatograph, operating with He as a carrier gas. An 220 internal reference CO2 gas was calibrated with the international gas reference standards 221 RM8562, RM8563 and RM8564 with δ13CvPDB of -3.76 ± 0.03 ‰, -41.56 ± 0.04‰ and -222 10.45 ± 0.03‰, respectively (Verkouteren and Klinedinst, 2004). All the isotopic 223 compositions given in this study are reported in the usual δ-scale in‰ according to δsample 224 (‰) = {(Rsample/Rstandard) -1} x 1000, where R is the 13C/12C atomic ratio. The uncertainties 225 on δ13C values are better than ± 0.4‰ based on the external reproducibility of internal 226 standards. 227 228 N2 gas 229 The isotopic composition of N2 in gas samples stored in Exetainer® vials or stainless-steel 230 cylinders was measured at the Institut de physique du globe de Paris (IPGP, France). The 231 N2 was purified and isolated from other gases before being transferred to the IRMS dual-232 inlet mass spectrometer Delta + XP (Finnigan Mat-Thermo Fisher) for isotopic analyses. 233 N2 purification was performed using the high vacuum line (P<10-5 mbar) described in Li 234 et al. (2009) (details in Appendix). We obtained a relative uncertainty on the δ15N better 235 than ± 0.5‰ taking into account the N2 extraction process efficiency and the 236 reproducibility on an internal reference N2 gas, itself calibrated against the air, the 237 international reference standard for δ15N measurements. 238 239 Noble gases 240 Noble gas isotopic compositions were measured at IPGP using the Helix-SFT (Split Fight 241 Tube, Thermo Instruments©) following the protocol of Moreira et al. (2018) (details in 242 Appendix). For Ne and Ar, the standard is the atmosphere. The helium standard is a gas 243 collected at the Irene thermal spring (Reunion island) with a 3He/4He value (R) of 12.56 ± 244 0.05 RA (with RA the 3He/4He value of the air 1.4x10⁻⁶). For the present study, blank 245 corrections were negligible. Final uncertainties for the isotopic ratios in samples are ±0.1 246 for R/Ra, ±0.06 for 20Ne/22Ne, ±0.0005 for 21Ne/22Ne, ±5 for 40Ar/36Ar and correspond to 247 the error propagation of the measured uncertainty, the blank correction, and the correction 248 for mass discrimination. 249 250 Water isotopes 251 Oxygen and hydrogen isotope measurements were performed at BRGM stable isotope 252 laboratory by equilibrating during one night 1 mL of water with gas mixtures of H2–He 253 and CO2–He respectively for δ2H and δ18O, and using a Finnigan MAT 252 mass 254 spectrometer (Assayag et al., 2008). The external precision was ± 0.1‰ for δ18O and ± 255 0.8‰ for δ2H vs. SMOW. 256 257 Chlorine 258 The chlorine stable isotope compositions were measured at the IPGP on gaseous CH3Cl 259 that was prepared and purified with the method described in Godon et al. (2004). The δ37Cl 260 measurements were then performed on the dual-inlet IRMS Delta + XP. They are reported 261 in Table A4 with the conventional δ37Cl notation in per mil variations relative to Standard 262 Mean Ocean Chlorine (SMOC). In this study, the external reproducibility of the seawater 263 standard was 0 ± 0.04‰ (1s, n = 18) as routinely obtained at IPGP for more than two 264 decades (Godon et al., 2004). Four pore fluid samples were measured twice. The mean 265 difference between duplicates was 0.04‰. 266 267

7
δ7Li analysis 268 In water samples, lithium isotopic compositions were measured using a Neptune 269
Multi Collector ICP-MS (Thermo Fisher Scientific) at BRGM stable isotope laboratory. 270 7Li/6Li ratios were normalized to the L-SVEC standard solution (NIST SRM 8545) 271 following the standard-sample bracketing method (Millot et al., 2004). The uncertainties 272 on δ7Li values are better than ± 0.5‰ (2s) based on the external reproducibility using 273 internal standards (seawater IRMM BCR-403 and basalt JB-2). 274
In volcanic rocks, Li was separated from the matrix by ion-exchange 275 chromatography using the method described in detail by Dellinger et al. (2015). After 276 digestion, a sample aliquot was loaded onto a column filled with AG50-X12 resin and the 277 Li was eluted in HCl 0.2 N. The Li isotopic composition was measured by MC-ICP-MS 278 Neptune (Thermo Scientific, Bremen) at IPGP using an APEX desolvating system and at 279 typical Li concentrations of 20–30 ppb. Each sample was successively measured three 280 times within a standard-sample bracketing (SSB) sequence, yielding five δ7Li values from 281 which an average value was derived. Data were corrected for the background intensities 282 recorded before each bracketing standard and each sample. The intensity of the background 283 was no more than 0.5–1% of the sample intensity. The overall reproducibility and accuracy 284 of the procedure (including solid sample digestion and Li separation) was checked by 285 measurement of the basalt reference material BHVO-2 (δ7Li = 4.23 ± 0.83‰; Ryu et al., 286 2014). The external error (2σ) was better than 0.5‰. Finally, the concentration of the total 287 procedural blank (acid digestion and column chemistry) was assessed to be less than 0.05 288 ng, i.e., insignificant compared with the amount of Li in the samples. 289 290 δ11B analysis 291
Boron isotopic compositions of water samples were determined on a Finnigan 292 MAT 261 solid source mass spectrometer in a dynamic mode at BRGM stable isotope 293 laboratory. For these samples, water volumes corresponding to a mass of 10 μg of B 294 underwent a two-step chemical purification using Amberlite IRA-743 selective resin 295 according to a method adapted from Gaillardet and Allègre (1995). The uncertainties on 296 δ11B values are better than ± 0.3‰ (2s) based on the external reproducibility on the internal 297 standard NBS951 (δ11B = 4.05398 ± 0.00105‰). 298
Rock samples were dissolved by alkali fusion and B was extracted following the 299 procedure of Chetelat et al. (2009) (details in Appendix). Boron isotope ratios were 300 determined by MC-ICP-MS with a direct injection nebulizer (d- DIHEN; Louvat et al., 301 2014a) at IPGP with a 2s reproducibility between 0.05 and 0.3‰. 11B/10B values are 302 expressed relative to the boric acid standard NBS 951 (NIST). 303
304 87Sr/86Sr measurement 305
For water samples, chemical purification of Sr (~3 μg) was performed using an ion-306 exchange column (Sr-Spec) before mass analysis according to a method adapted from Pin 307 and Bassin (1992) with total blank <1 ng for the entire chemical procedure. After chemical 308 separation, around 150 ng of Sr were loaded onto a tungsten filament with tantalum 309 activator and analyzed with a Finnigan MAT 262 multi-collector mass spectrometer at 310 BRGM’s stable isotope laboratory. The 87Sr/86Sr values were normalized to the certified 311 value of the NBS987 standard 0.710240. An average internal precision of ± 10 ppm (2σm) 312 was obtained and the reproducibility of the 87Sr/86Sr ratio measurements was verified by 313 repeated analysis of the NBS987 standard (87Sr/86Sr = 0.710243 ± 10, 2σ). 314

8
For volcanic rocks, after total evaporation of ~0.2 mL of rock sample digestion 315 solutions, the remaining solid was retaken with 0.1 mL of HNO3 3N and loaded onto a Sr-316 SPEC (Eichrom) resin chromatography column to separate ca. 200 ng of Sr (Pin and 317 Bassin, 1992). The Sr isotopic composition was measured by MC-ICP-MS at IPGP. The 318 mass discrimination was corrected using the invariant ratio 88Sr/86Sr (0.1194). Accuracy 319 and reproducibility were verified by repeated analysis of the NBS standard SRM 987 320 (87Sr/86Sr = 0.710250±0.0000025). 321
3.5 PHREEQC modeling 322 The PHREEQC software, version 3 (Parkhurst and Appelo, 2013) was applied to compute 323 aqueous speciation and fluid-mineral equilibria using the “thermoddem v1.10 06jun2017” 324 thermodynamic database (website http://thermoddem.brgm.fr/; Blanc et al., 2012). 325
4. Results 326
4.1 Gas molecular and noble gases composition 327 Table 1. Analytical results of the gas sampled in 2017. δ15N and δ13C values are averaged 328 from multiple measurements (n=2-6) except for sample PG17_116, which was analyzed 329 only once for δ15N (details in Table A1). See text for calculations of atmospheric N2 330 proportion, δ15N correction from atmospheric contribution and modeling results. 331
Sample no. PG17_100 PG17_112 PG17_116 PG17_117 Sample location La Salsa La Rumba El Gigante El Ojo Verde Latitude (°S) 21.619349 21.638776 21.64819 21.651306 Longitude (°W) 67.848462 67.852883 67.848736 67.840695 Temperature (°C) 43.4 44.6 41.5 36.2
Major composition (vol.%) CO2 74.7 66.2 86.0 38.4 CH4 0.04 0.03 0.00 0.07 O2 3.36 2.01 1.63 4.76 N2 21.8 32.0 12.4 56.4 % N2 atm 57.3 23.4 49.1 31.5
Isotopic composition (‰) δ13C (±0.1‰, 2σ) -11.2 -11.2 -11.2 -11.0 δ15N (±0.5‰, 2σ) 2.7 1.8 1.6 2.3 δ15Nprimary 6.4 2.3 3.1 3.4
Noble gases (ppm) 4He 337 517 109 814 20Ne 0.56 1.50 0.43 2.03 36Ar 7.1 12.9 3.6 12.2 40Ar/36Ar 298 288 283 288 RC/RA 3.68 3.84 3.81 3.86 Mantle He (%) 45.4 47.3 47.1 47.6 CO2/3Hesurface 4.35*108 2.42*108 1.51*109 8.85*107
Modeling CO2/3Hebefore degassing 1.2*108 9.6*108 2.9*109 4.7*108 CO2 exsolution (%) 36 23 49 17
332

9
Thermal spring gases are mainly composed of CO2 (38.4 to 86 vol. %) and N2 (12.4 to 56.4 333 vol. %) with minor amounts of O2 (1.63 to 4.76 vol. %) and negligible traces of CH4 (< 334 0.07 vol. %; Table 1). No H2 and H2S were detected. If we assume that O2 is derived from 335 atmospheric contamination during sampling or natural diffusion into the thermal spring, 336 we obtain a contribution of associated atmospheric N2 up to 57.3% of the total N2 (Table 337 1). Abundances of the Atmosphere-Derived Noble Gases (ADNG: 20Ne and 36Ar) are 338 depleted relative to air and follow the composition expected for an Air Saturated Water 339 (ASW; Fig. 3). In contrast, 4He is found in high proportions, from 109 to 814 ppm, with a 340 high 3He/4He value normalized to air (RC/RA) of 3.79 ± 0.08 (with (3He/4He)air = 1.4x10⁻⁶; 341 Table 1). This value indicates a high mantle contribution (Sano and Marty, 1995, see 342 discussion). 343 344 4.2 Gas C and N isotope compositions 345 346 The CO2 gas sampled from thermal springs shows homogeneous δ13C values with an 347 average of -11.1 ± 0.1‰ (Table 1, A1). In contrast, the isotopic composition of N2 (δ15N) 348 is more variable and ranges between 1.6 and 2.7 ± 0.5‰. Nitrogen isotope measurements 349 of sample PG17_112 were performed on gases sampled in both Exetainers® and stainless-350 steel tubes to ensure good reproducibility of the results, regardless of the container used 351 (Table A1). Similar values were obtained with a deviation of ±0.3‰. Considering an 352 atmospheric contamination of up to 57.3% for N2, we can estimate the primary δ15N value 353 by isotopic mass balance as follows: 354 δ15Nmeasured = δ15Natm *%atm + δ15Nprimary*(1-%atm) 355 With atmospheric contamination %atm up to 0.57 and δ15Natm = 0‰, a maximum δ15Nprimary 356 of 6.4‰ is obtained (Table 1). We thus consider the measured values as minimum values. 357 358 4.3 Isotopic composition of water 359 360 Table 2. Chemical and isotopic compositions of Laguna Pastos Grandes waters. NICB: 361 Normalized Ionic Charge Balance. 362
Sample no. PG17-117 PG17-112 PG17-100 PG1_1 MV_1 PGS_1 PG17_99 SP_3 LS_4 Sampling trip 2017 2017 2017 2016 2016 2016 2017 2016 2016
Name El Ojo Verde spring
La Rumba spring
La Salsa spring
La Salsa spring
El Gigante spring
Piedmont spring Stream Stream Lake
brine Lat. (°S) 21.651306 21.638776 21.619349 21.61934 21.64865 21.61996 21.60764 21.69665 21.69552 Lg. (°W) 67.840695 67.852883 67.848462 67.84842 67.84866 67.85628 67.75753 67.8098 67.80927 T (°C) 36.2 44.6 43.4 42.2 45.7 32.4 17.3 16.4 24.5 pH 6.41 5.99 6.90 6.42 6.20 6.35 9.15 7.99 7.39 Alkalinity on site 10.7 8.91 4.35 0.78
Chemical composition (mM) Na 232 137 173 220 251 23.7 0.57 1.17 3924 K 12.9 8.7 12.5 13.4 16.6 1.8 0.14 0.36 131 Ca 10.9 6.5 10.1 11.4 12.8 0.7 0.17 0.37 59.7 Mg 5.8 2.8 5.2 5.4 6.0 0.4 0.13 0.18 54.6 Alkalinity 7.4 5.3 7.4 7.4 8.9 1.8 0.90 0.79 10.9 SO4 2.9 2.3 2.3 2.9 4.2 0.8 0.04 0.22 39.5 Cl 278 173 197 258 291 25.5 0.73 1.52 4375 Li 11.1 6.6 9.9 7.7 9.6 0.8 0.02 0.25 74.8 Sr 0.11 0.06 0.11 0.11 0.15 0.01 0.001 0.003 1.03 B 3.6 2.2 3.3 3.2 4.7 0.5 0.04 0.08 28.6

10
*mg/L; **g/L; ***calculated with PHREEQC based on water chemistry 363 364 Spring waters exhibit a narrow range of δ18O (-14.2 to -11.4‰) and δ2H (-104.2 to -92.2‰), 365 slightly more enriched in 18O and 2H than streams (with δ18O ~ -13.2‰ and -104.7 < δ2H 366 < -99.4‰; Fig. 4, Table 2). They are located on the regional Ground and Spring Water Line 367 (LGSWL; δ2H = 7.99 x δ18O + 0.3; n = 44) established by Fritz et al. (1981) and Rissmann 368 et al. (2015) to the right of the Local Meteoric Water Line (LMWL) defined for modern 369 precipitation in the Chilean and Bolivian Altiplano at altitudes of 2800 to 5700 m (δ2H = 370 8.15 x δ18O + 15.3; Chaffaut et al., 1998). Streams and springs define a trend given by the 371 following equation: δ2H = 4.29 x δ18O + 43.8 (R2 = 95 %, n = 8; Fig. 4b) with δ18O and 372 δ2H values more positive than rainfall collected at 4500 m during the wet season. Two 373 snow samples collected during the dry season show more positive δ18O and δ2H values 374 than rainfall and fall to the left of the LMWL trend (Table A2). The Piedmont thermal 375 spring, located on the border of the laguna, is shifted from the other springs toward more 376 negative δ18O and δ2H values. In the southeastern part of Laguna Pastos Grandes, the brine 377 sampled from the lake (LS4 sample) is enriched in both 18O and 2H compared to the inlet 378 waters and has even greater δ18O and δ2H values than other Andean salars (Fig. 4, Table 379 A2). 380 381 4.4 Geothermometry 382 383 The thermal waters associated with gases reach the surface at up to 46 °C, which is among 384 the highest temperatures recorded in the Altiplano salars (Risacher and Fritz, 1991; Spiro 385 et al., 1997). Based on the concentrations of some soluble elements (Si, Na, K, Ca, Mg, Li) 386 in the thermal springs, we calculated the maximum temperature of the fluids at depth using 387 empirical, semi-empirical and experimental equilibrium relations between water and 388 minerals in the geothermal reservoirs (Sanjuan et al., 2014 and references therein). We 389 used several geothermometers including silica, Na-K-Ca, Na-Li, Li-Mg, Li isotopes, and 390 Na-K (details in Appendix; Table A3). They yield equilibrium temperatures for spring 391 waters reacting with rocks of a deep reservoir that are comprised between 149 ±11 °C and 392 325 ±21 °C. The lowest value, given by the silica geothermometer, is probably 393 underestimated because of silica precipitation during thermal water cooling (Verma and 394 Santoyo, 1997). The highest value, given by Na/Li geothermometers, is overestimated 395 because Li concentrations in the fluids are higher than those used for calibrations (Sanjuan 396 et al., 2014). We thus retain a range of temperature between 200 and 250 °C obtained using 397 δ7Li (200 ±25 °C; Millot et al., 2010) and Na/K (228 ±9 °C and 205 ±12 °C; Verma and 398 Santoyo, 1997; Santoyo and Diaz-Gonzalez, 2010) geothermometers, as the maximum 399 temperature encountered by the water through the faults of the Pastos Grandes caldera. 400
Br 0.073 0.046 0.069 0.060 0.070 0.006 0.006 0.006 0.426 SiO2* 116 101 116 155 152 101 36 60 60 Salinity** 16.2 10.1 11.5 15.1 17.0 1.49 0.04 0.09 256 NICB (%) -1.3 -7.5 6.9 0.7 2.2 -3.1 -26.4 3.0 -2.9 pCO2 (mbar)*** 141 309 60.3 110.0 389.0 61.7 0.03 0.5 10.5
Isotopic compositions (‰ ±2s) δ2H (±0.8) -92.2 -96.7 -93.9 -93.8 -92.5 -104.2 -99.4 -104.7 7.6 δ18OH2O (±0.1) -11.4 -12.4 -11.8 -11.7 -11.4 -14.2 -13.1 -13.2 3.3 δ7Li 5.2 ±0.1 5.6 ±0.1 3.8 ±0.1 3.6 ±0.1 4.0 ±0.2 2.6 ±0.2 4.0 ±0.2 10.9 ±0.1 3.9 ±0.3 δ11B -4.4 ±0.1 -5.0 ±0.1 -4.9 ±0.2 -4.3 ±0.3 -6.7 ±0.3 -6.0 ±0.3 0.0 ±0.3 -7.2 ±0.3 87Sr/86Sr 0.708384 0.708412 0.708398 0.708396 0.708402 0.708354 0.707950 0.707646 0.708327 2sm 0.000005 0.000006 0.000010 0.000007 0.000006 0.000006 0.000010 0.000007 0.000007

11
401 4.5 Chemical composition of the water 402 403 As extensively demonstrated in previous papers (Roche et al., 1991; Moquet et al., 2011), 404 we assumed the atmospheric contribution to groundwater chemistry as negligible in this 405 region and did not correct the data from this contribution. Elemental concentrations 406 reported in this study are represented and interpreted together with those from previous 407 studies of Laguna Pastos Grandes (Ballivian and Risacher, 1981; Hurlbert and Chang, 408 1984; Risacher and Fritz, 1991; Jones and Renaut, 1994). Spring waters have higher 409 salinity (~14 g/L) than streams (0.09 g/L) and homogeneous δ37Cl values of 0.25±0.03‰ 410 (n=12; Table A4). The Piedmont spring is the only exception with a relatively low salinity 411 of 1.9 g/L. The brines from the southeastern part of the laguna are more saline than the 412 water sources (256 g/L; Table 2). 413 Most of the waters show charge balances better than ±8 % (Table 2), which denote a 414 negligible influence of potential organic charges to the ionic balance. Due to higher 415 sensitivity of low concentration samples to analytical errors, one stream sample shows a 416 charge balance of -26% corresponding to a low anion excess of 0.41 mM. 417 Sodium and chloride are the dominant ions in spring waters, with average concentrations 418 of 173 and 203 mM, respectively. With a Ca:Mg molar ratio ranging from 1.9 to 2.4, spring 419 waters are enriched in Ca relative to Mg. Hydrothermal springs show similar relative ion 420 concentrations suggesting that a common origin and common processes constrained the 421 chemistry of their major elements (Fig. 5a). Their Ca:alkalinity molar ratio is favorable to 422 the precipitation of large amounts of calcite (with a ratio of almost one Ca for two C). 423 Compared with the hydrothermal springs, the Piedmont spring is diluted by surface waters. 424 As for the laguna brine, it presents relative ion concentrations similar to those of the 425 hydrothermal springs but with lower alkalinity (Fig. 5b). 426
4.6 δ7Li, δ11B and 87Sr/86Sr in waters compared with surrounding rocks 427 Table 3. Chemical and isotopic data available for dacites, andesites and ignimbrites from 428 Laguna Pastos Grandes. Data in italic are from previous studies. 429
Rock type Ca/Na Mg/Na Li (ppm) ±0.3 1SD δ7Li (‰) B (ppm)
±0.3 1SD δ11B (‰) Sr (ppm) ±3 1SD
87Sr/86Sr
Ignimbrite 0.61 0.30 66.9 -3.33±0.47 54 -7.79±0.21 330 0.725764 Dacite 1 0.70 0.45 147.4 -5.82±0.12 60 -14.88±0.21 351 0.707906 Dacite 2 0.87 0.36 80.2 -5.43±0.35 30 -13.70±0.15 464 0.706951 Andesite 1 1.69 1.50 279.7 -5.11±0.38 144 -13.57±0.09 690 0.705835 Andesite 2 2.13 1.61 147.8 -9.22±0.15 116 -13.89±0.10 706 0.706206 Ignimbrite (Kaiser, 2014) 0.708173 Ignimbrite (Kaiser, 2014) 0.708040
Cenomanian-Turonian carbonates (McArthur et al., 1994) 0.707298-0.707428 Modern marine evaporites (Pierret et al., 2001) 0.708940
430
Thermal springs show homogeneous 87Sr/86Sr values slightly more radiogenic than cold 431 streams with average values of 0.70839±0.00002 and 0.70780±0.00021, respectively. In 432

12
the eastern part of the laguna, the perennial lake has a 87Sr/86Sr value of 0.70833, slightly 433 lower than thermal spring water values. As expected, all waters are within the range 434 reported for dacites (0.70890±0.00238; Cortecci et al., 2005) and andesites 435 (0.70763±0.00161; Cortecci et al., 2005) of the Andean Central Volcanic Zone. Our dataset 436 is also compared with andesites, dacites and rhyolitic ignimbrites sampled in the vicinity 437 of Laguna Pastos Grandes (Table 3). Sr isotope ratios of streams are between those of 438 Pastos Grandes ignimbrites and dacites, whereas springs and brines show compositions 439 similar to ignimbrites (Fig. 6a). The 87Sr/86Sr value of Cenomanian-Turonian marine 440 carbonates, considered as the last open marine period in the central Andes (Deconinck et 441 al., 2000), is much lower than the values of the thermal springs (with 87Sr/86Sr = 0.7073-442 0.7074; McArthur et al., 1994). 443
Boron and lithium isotopic compositions of Pastos Grandes waters are also clearly different 444 from seawater composition (δ11B = 39.6‰ and δ7Li = 31.0‰; Boschetti et al., 2017). δ11B 445 and δ7Li values increase between rock and water samples in the following order: volcanic 446 rocks < hydrothermal springs = lake brines < surface runoff. Pastos Grandes’ thermal 447 waters and brine present δ11B and δ7Li values around -5.5±1.1‰ and +4.1±1.0‰, 448 respectively (Fig. 6b). In comparison, one stream displays more positive values for both 449 δ11B and δ7Li, at 0 and 10.9‰, respectively, whereas surrounding volcanic rocks are more 450 negative, with δ11B between -14.9 and -7.8‰ and δ7Li between -9.2 and -3.3‰ (Fig. 6b; 451 Table 3). In the study area, volcanic rocks have high Li and B concentrations (67–280 ppm 452 of Li and 30–144 ppm of B) and isotopic compositions depleted in 7Li and 11B compared 453 to the range of values for the Andean volcanic arc: 3-9 ppm of Li with -6.4 < δ7Li < -4.5‰ 454 (Chan et al., 2002) and 6-60 ppm of B with -7 < δ11B < +4‰ (Rosner et al., 2003). Boron 455 isotopic compositions of Pastos Grandes volcanic rocks are slightly higher than the average 456 continental crust, estimated by Chaussidon and Albarède (1992) between -15 and -10‰. 457
4.7 Thermodynamic model 458 We compared the average spring water composition and the water chemistry obtained 459 using PHREEQC modeling of volcanic bedrock alteration at 200-250 °C and CO2 partial 460 pressure varying between 10 and 100 bar (typical of CO2-rich geothermal systems; 461 Lowenstern, 2001). The objective was to determine if the observed concentrations of major 462 cations (Ca, Mg, K, Na and Si) can be reached by dissolution of the volcanic rocks (Table 463 A5, see Appendix for the PHREEQC model) without input of ancient marine sediments. 464 The mineralogy of the volcanic rocks surrounding Laguna Pastos Grandes was modeled 465 with the following suite of minerals from the Thermoddem database (details in Appendix): 466
– Albite for the source of Na 467 – Anorthite for Ca 468 – Pargasite for Mg 469 – Quartz for Si 470 – Sanidine for K 471
In all models tested, the Si and DIC are higher than in the spring water. Ca, Mg, K and Na 472 concentrations are best reproduced at 225 °C and 20 bar of CO2 (SI=1.3; Fig. A2). To 473 adjust the Cl concentration in the water, we tried different Cl sources: pure magmatic Cl2(g) 474 or halite. Modeling results were inconclusive with pure magmatic Cl2(g) but consistent 475 with halite, suggesting that the salinity of the spring water is provided by halite dissolution. 476 As halite is commonly associated with gypsum in the sedimentary series of the Andean 477 region, we also added anhydrite to the bedrock composition in the model. Despite this, the 478

13
main source of Ca in the spring waters remains anorthite (Table A5). All minerals were 479 considered in the calculation as infinite reservoirs, except halite, which was fixed by the 480 average Cl concentration in the spring water (239 mM). 481
5. Discussion 482
Laguna Pastos Grandes is a calcic-type salar characterized by Na-Ca-Cl brines that can, 483 according to thermodynamic models, lead to the precipitation of calcite, the first mineral 484 of the evaporation pathway before gypsum and ulexite (Hardie and Eugster, 1970; Risacher 485 and Fritz, 2009). Although 19% of the salars in Bolivia (n=6) and 24% in Chile (n=12, 486 Table A6) are calcic-type salars, massive calcite precipitation is only observed in Laguna 487 Pastos Grandes. Gypsum, mirabilite (Na2SO4), halite and ulexite dominate the other calcic 488 salars. This means that, in addition to the Ca2+ concentration, at least one parameter varies 489 among the Andean salars and controls the magnitude of calcite precipitation in Laguna 490 Pastos Grandes. The precipitation of carbonate minerals is complicated by 491 biomineralization processes (mediated here by microorganisms; Jones and Renaut, 1994) 492 and reaction kinetics in a near-surface continental environment (with ionic interactions, 493 variable substrates, fluctuating pH, organic molecules and gas-phase interactions; Alonso-494 Zarza and Tanner, 2010). Still, the fundamental reasons why calcite precipitates in 495 significant amounts are that i) Ca2+(aq) and CO32-(aq) are supplied in sufficient concentrations 496 by water inputs and ii) surface processes allow the pH to increase, thereby dynamically 497 sustaining supersaturation relative to calcite. At Laguna Pastos Grandes, we expect these 498 processes to be related to dissolved CO2 losses, such as degassing, salting-out by 499 evaporation and photosynthesis. Our investigations therefore focused on the origin of CO2 500 and Ca enrichment in water inputs. 501
5.1 Origin of CO2 and N2 in thermal spring gases 502 The thermal springs of Laguna Pastos Grandes discharge not only thermal waters but also 503 gases that are essentially mixtures of CO2 and N2 (Table 1). This is common in the Central 504 Andes (Spiro et al., 1997). Changes in the relative proportions of CO2 and N2 gases between 505 sources in Laguna Pastos Grandes can be partly attributed to changes in the contribution 506 from Air Saturated Waters (ASW) to the hydrothermal system. Indeed, the 40Ar/36Ar mean 507 value of 289 in thermal springs is close to the air value of 295 (Nier, 1950) and their 508 Atmosphere-Derived Noble Gases abundances (ADNG: 20Ne and 36Ar) normalized to air 509 indicate that the atmospheric component in thermal springs (including O2 and the 510 atmospheric proportion of N2) derives from ASW and not from air-contamination during 511 sampling (Fig. 3). 512 513 Despite the ASW component, the mean RC/RA value of 3.79 ± 0.08 (Fig. 3, Table 1) 514 indicates the presence of mantle-derived helium in the ascending hydrothermal gas. Our 515 helium isotope results complement and confirm previous data from the central Andes, 516 including an isolated analysis at Laguna Pastos Grandes (Fig. A3; Hilton et al., 1993; Hoke 517 et al., 1994). Assuming that pure mantle-derived helium is characterized by RC/RA ~8, we 518 calculated that about 47 % of the helium in Laguna Pastos Grandes is of mantle origin 519 (using the calculations described in Hoke et al., 1994; Table 1), whereas it does not exceed 520 20% in other gas sources on the Altiplano. In the Western Cordillera, however, the supply 521 of mantle helium reaches 69% at the Isluga volcano in Chile, 300 km north of Laguna 522 Pastos Grandes (Hoke et al., 1994). In addition, the highest temperature of salar springs on 523

14
the Altiplano was recorded at Laguna Pastos Grandes, at 75 °C by Jones and Renaut (1994) 524 and at 46 °C in this study (Table A6). For comparison, the maximum temperature recorded 525 in the Western Cordillera is about 87 °C (Puchuldiza salar, northern Chile; Risacher et al., 526 2011). Therefore, the strong mantle influence in Laguna Pastos Grandes is probably due to 527 its proximity to the active volcanic arc of the Western Cordillera (Table A6; Springer and 528 Förster, 1998). 529 530 The average δ13C value of CO2 ~ -11.1 ± 0.1‰ is lower than the typical value of a magmatic 531 mantle-derived CO2 source (between -9 and -4‰; Hoefs, 1980) that would be expected 532 based on He results. Two hypotheses can be proposed to explain this low value: a 533 contribution of CO2 from sedimentary sources, i.e., organic carbon with δ13C < -20‰ 534 (Hoefs, 1980), or carbonate precipitation during fluid ascent. To trace the origin of the CO2, 535 δ13C values are generally interpreted in relation to CO2/3He values (Sano and Marty, 1995). 536 In order to avoid the effects of hydrothermal degassing and liquid-vapor partitioning that 537 could have significantly affected the δ13C and CO2/3He values of the gas, we determined 538 the CO2/3He composition at threshold P-T degassing conditions, using fluid phase 539 equilibrium calculations applied to our system (H2O-NaCl-CO2-N2-O2-He-Ne-Ar; 540 Rouchon et al., 2016). We assumed that all gaseous CO2 was exsolved at a single 541 supersaturation depth and that there was no carbonate precipitation (which would decrease 542 the CO2/3He value). The best results were obtained with an initial meteoric water recharge 543 at high altitude, i.e. 5500 m, and a temperature of 0 °C. This is consistent with the δ18O and 544 δ2H relationship in the spring waters, which suggests that the geothermal reservoir is fed 545 during the wet season by meteoric water of rainfall isotopic composition (i.e., δ18O of -546 16‰ and δ2H of -123‰; Fig. 4 and Table A2 for values). Snow deposited during the dry 547 season has different isotopic compositions (minimum δ18O of -6.8‰ and δ2H of -30.3‰). 548 Considering a local geotherm of 45 °C/km (Rothstein and Manning, 2003), we calculated 549 between 17 and 49% CO2 exsolution at a depth of about 25-35 m (at 2.5-3.5 bar) in the 550 different springs (Table 1). Before degassing, the CO2/3He values were higher than those 551 measured at the surface and ranged from 4.7*108 to 2.9*109. These values are in the range 552 or slightly lower than the mantle value of 2*109 (Marty and Jambon, 1987). The depletion 553 of CO2 relative to 3He in fluids could be consistent with carbonate precipitation during the 554 geothermal fluid ascent. Since carbonates are enriched in 13C relative to original CO2, this 555 would also explain why the remaining CO2 in the gas is depleted in 13C (Ray et al., 2009). 556 557 Even so, we cannot completely rule out a minor contribution from thermal or microbial 558 decomposition of organic matter in the underlying but unknown sedimentary rocks, 559 perhaps accompanied to some extent by carbonate dissolution, which could account for the 560 slight shift towards negative δ13CCO2 values relative to the mantle. Likewise, the δ15N 561 values between 2.3 and 6.4‰ could reflect a crustal (mean δ15N = +7‰; e.g. Sano et al., 562 1998) contribution mainly generated by biological or thermal degradation (Boyd, 2001). 563 Although stratovolcanoes and their products dominate the South Lipez landscape of the 564 Altiplano (e.g. de Silva and Francis, 1991), volcanic rocks probably overlained (Ludington 565 et al., 1975) or incorporated (Risacher and Alonso, 2001) Cretaceous and Early Tertiary 566 clastic to evaporitic sediments. Alternatively, as this region is close to the subduction zone 567 of the Nazca plate under the South American plate (the slab being located at a depth of 568 ~150-km below the Altiplano; Hoke et al., 1994; Kay and Coira, 2009), organic carbon and 569 nitrogen could be remobilized from the slab by metamorphism (Gorman et al., 2006) and 570 transported through primary melts into crustal intrusions. This hypothesis is supported by 571

15
the high Li concentrations and light δ7Li recorded in volcanic lava flows surrounding 572 Laguna Pastos Grandes (compared with MORB composition representing the upper 573 mantle, δ7Li = 3.7‰; Misra and Froelich, 2012). It can only be interpreted as the addition 574 of highly-negative δ7Li slab-derived fluids to the mantle wedge beneath our study area 575 (Fig. 7; Chan et al., 2002). Boron is also highly concentrated in the volcanic rocks of the 576 area (30-144 ppm) and could come from the same source as Li. However, δ11B values, 577 between -14 and -8‰, are more negative than the lowest value of the slab-derived fluids 578 predicted for the Andes (-2.8‰; Rosner et al., 2003). Boron is more volatile than lithium, 579 and light δ11B values are commonly observed in magmatic rocks (Chaussidon and 580 Albarède, 1992) due to magma degassing effects, which produce 11B depletion in the 581 residual melt (Jiang and Palmer, 1998). 582 583
5.2 Hydrological history of spring water 584 585
The spring waters in Andean salars have previously been suggested to originate from the 586 recycling of lake brines that continuously infiltrate through their bottom sediments 587 (Risacher and Fritz, 1991; Risacher et al., 2003; Risacher and Fritz, 2009). The origin (and 588 evolution) of the spring waters in Laguna Pastos Grandes can be assessed using their water 589 isotopic composition. Spring waters lie on the local Ground and Spring Water Line 590 (LGSWL) with slightly more positive δ18O and δ2H values than the local rainfall (Fig. 4), 591 indicating that hydrothermal springs are genetically linked to meteoric waters. The slight 592 enrichment in both 18O and 2H relative to meteoric water may imply either evaporative 593 enrichment prior to infiltration at high altitude (Bershaw et al., 2016) or vapor loss during 594 the ascent of thermal fluids (Cortecci et al., 2005). In comparison, the laguna brine is highly 595 enriched in 18O and 2H, ruling out the hypothesis of a significant recharge of the springs by 596 infiltration of the laguna brine. In addition, the Cl/Br values of spring waters cannot be 597 explained by a dilution of recycled brines by mixing with groundwater or meteoric water 598 (Fig. 5c). We thus suggest that the solutes in the spring waters more likely derive from the 599 alteration of the bedrock minerals. 600
5.3 Volcanic bedrock alteration at high temperature and pCO2 601 δ7Li and Na/K geothermometers applied to spring waters indicate that the meteoric water 602 reached a maximum temperature of 200-250 °C after infiltration. Due to the high mantle-603 derived CO2 flux delivered in thermal springs, the estimated pCO2 in these waters (between 604 3 and 389 mbar estimated by PHREEQC; Table 2) spans the range and even exceeds the 605 pCO2 in spring waters of the Altiplano and Western Cordillera at 40 – 120 and 10 – 340 606 mbar, respectively (Morteani et al., 2014). This CO2 enrichment can acidify thermal waters 607 to a pH ~5 favoring bedrock minerals dissolution and hence thermal waters enrichment in 608 solutes, especially in Ca. To test this hypothesis, we performed a series of PHREEQC 609 simulations to determine the water composition resulting from the alteration of the volcanic 610 bedrock with possible evaporites (halite, gypsum and anhydrite) from a meteoric water at 611 200, 225 and 250 °C and varying CO2 partial pressures and compared the results to the 612 average spring water composition (Table A5; Fig. A2). 613 614 The best results for Ca, Mg and K concentrations in spring waters were obtained by 615 alteration of volcanic minerals at a temperature of 225 °C and at 20 bar of CO2 (Fig. A2). 616 This amount of CO2 is compatible with the proximity of an ancient pre-eruptive magma 617 reservoir at a depth of ~3 km as proposed by de Silva and Kay (2018). Under these 618

16
conditions, the main source of Ca in the water is the dissolution of Ca-rich felspars rather 619 than anhydrite (Table A5). These results are corroborated by Sr isotope data, which suggest 620 that local meteoric waters interact with the host volcanic rocks (dacite, andesite and 621 rhyolitic ignimbrite) rather than with ancient marine carbonates (Fig. 6a). Similarly, the 622 δ7Li and δ11B values of the thermal waters and laguna brine are closer to those of the 623 surrounding volcanic rocks than to those of seawater (Fig. 6b). δ7Li values measured in 624 waters are on average 8‰ higher than those measured in the surrounding rocks. This 625 fractionation corresponds to the equilibrium isotopic fractionation between water and 626 weathered volcanic rocks at high temperature (200±25°C; Millot et al., 2010). On the other 627 hand, the average 7‰ positive δ11B shift between springs and volcanic rocks can be 628 explained either by adsorption of B on mineral surfaces during the ascent and cooling of 629 hydrothermal fluid to the spring vent (Louvat et al., 2014b) or by the preferential 630 incorporation of light B during carbonate precipitation (Vengosh et al., 1991). 631 632 Interestingly, the hydrothermal fluid obtained with these simulations is over-saturated with 633 several carbonate minerals (SIcalcite=1.23, SIdolomite=3.03, SImagnesite=2.02), which supports 634 the hypothesis (based on CO2/3He and δ13C data) that carbonate could have precipitated 635 during fluid ascent. The higher Si concentration obtained in our simulations compared with 636 those measured in spring waters together with the low temperature given by the SiO2 637 geothermometer are also consistent with the precipitation of silica during fluid ascent. 638 Furthermore, the simulations suggest that the salinity of the spring water most likely results 639 from the dissolution of halite deposits. This interpretation is confirmed by the 640 homogeneous δ37Cl mean value of the springs at 0.25±0.03‰ (n=12; Table A4), as 641 expected for halite precipitation in equilibrium with seawater at 25 °C (δ37Cl = 0.30 ‰; 642 Eggenkamp et al., 2016). It indicates that over time, multiple cycles of halite precipitation 643 and dissolution without new Cl inputs to the laguna have homogenized the Cl isotopic 644 composition of the laguna brine and salts. Therefore, we can assume that Na and Cl 645 originate from marine evaporites deposited during the last Cenomanian-Turonian marine 646 period and later remobilized in Cretaceous and Tertiary continental deposits (Deconinck et 647 al., 2000) that could have been either overlain by volcanic rocks or incorporated by 648 volcanic eruptions as suggested by Risacher and Alonso (2001) for gypsum. This is also 649 consistent with equimolar Cl and Na concentrations of these waters, typical of halite 650 leaching (Fig. A4). 651 652
5.4 How is Laguna Pastos Grandes unique? 653 654 Ca:alkalinity molar ratios of waters of Laguna Pastos Grandes show that stream waters and 655 mixed sources (Piedmont) are too diluted to contribute significantly to the growth of the 656 carbonate platform. They also show that the laguna brine, which largely derives from 657 spring waters (as suggested by chemical and isotopic data; Figs. 4, 5, 6), has been depleted 658 in carbonate relative to Ca. Therefore, only the thermal springs have the potential to 659 precipitate calcite massively (Fig. 5b). Most of the salars in the Central Andes are fed by 660 thermal spring (60% in Bolivia and 78% in Chile) enriched in solutes compared with 661 streams and regional groundwater (Table A6; Risacher and Fritz, 1991; Risacher et al., 662 2011). Modern carbonates are, however, absent or minor in these systems and generally 663 precipitated as the first mineral of a more developed evaporitic sequence (Risacher and 664 Fritz, 2009). Laguna Pastos Grandes is unique in this respect, as it hosts a ~40 km2 recent-665 to-modern carbonate platform spatially associated with thermal springs. There is a 666

17
remarkable mantle influence on these springs’ temperature and gas composition, as well as 667 on their solute enrichments (the highest of the Central Andes) with an average salinity of 668 14 g/l (Fig. 7; Table A6). This highlights the high water-rock reactivity of the hydrothermal 669 system of Laguna Pastos Grandes compared to other salars, due to the high flow of CO2 670 gas from the mantle. Furthermore, the singularity of this laguna is probably related to the 671 mineralogy of the volcanic bedrock since calcic-type salars are limited to the Andean 672 region. For example, Chilean volcanic rocks are known to be enriched in sulfides (Risacher 673 and Alonso, 2001) and could be responsible for the greater abundance of sulfate-type salars 674 (65%) compared to calcic-type salars. 675
6. Conclusion and perspectives 676 Bolivian and Chilean salars belong to broadly the same climatic and geological 677 environment (Risacher and Fritz, 2009). Nevertheless, they vary widely in terms of 678 chemistry and salt types mostly as a result of local variations in their fluid sources. In this 679 study, we have shown that the western part of Laguna Pastos Grandes, characterized by 680 abundant carbonate deposits, is mainly fed by thermal spring water, with minor 681 contributions from rainfall and surrounding streams. We demonstrated that these spring 682 waters, over-saturated with calcite, have been enriched in calcium and carbonate alkalinity 683 by the alteration of the volcanic bedrock under high CO2 partial pressure and a temperature 684 of 200-250°C. The magmatic CO2 and the high heat flow that drive the fluid circulation to 685 the surface are probably due to a shallow pre-eruptive magma chamber as proposed by de 686 Silva et al. (2006) and de Silva and Kay (2018) (i.e. at a typical depth of ~5 km; Fig. 7). 687 We propose that this doping in magmatic CO2 and the mineralogy of the volcanic bedrock 688 are the reason for the large volumes of carbonates compared to most other modern Andean 689 salars. 690 691 This configuration is not exclusive to Laguna Pastos Grandes system and can be found in 692 many continental extensional settings (e.g. in Afar) where we posit, by analogy, that the 693 same mechanisms are involved in the genesis of continental carbonate deposits in volcanic 694 provinces. As identified in this study, the main factors that favor a significant production 695 of carbonates would be a deep source of CO2 and a Ca-rich volcanic basement allowing 696 the following processes to occur: 697
i. Alteration of a sulfide-poor volcanic bedrock containing Ca-enriched minerals 698 (usually feldspars) at high pCO2 (20 bar) and high temperature (225°C), leading to cationic 699 enrichment of the waters and yielding calcic type hydrothermal waters. 700
ii. At the surface, CO2 degassing that leads to a pH increase and results in carbonate 701 precipitation. CO2 loss may also be driven by photosynthesis. 702
iii. High evaporation rates, increasing both the solute concentrations above calcite 703 saturation and the associated CO2 salting-out, and resulting in a pH increase. 704 705 Laguna Pastos Grandes is therefore a unique natural laboratory that hosts a great diversity 706 of carbonate facies (including pisoliths, ooids, muds and microbialites; Risacher and 707 Eugster, 1979; Jones and Renaut, 1994; Bougeault et al., 2019), sometimes remarkably 708 similar to ancient equivalents such as Cretaceous Presalt carbonates (Terra et al., 2010; 709 Tosca and Wright, 2015). This laguna could, therefore, be further used to identify the biotic 710 and/or abiotic controls involved in the formation of these carbonate deposits. Indeed, 711 microbial mats and thin, dark, mucilaginous films locally coating the pool floors and 712 pisolith surfaces in Laguna Pastos Grandes (described by Jones and Renaut, 1994 and 713

18
Bougeault et al., 2019) could also influence both the carbonate precipitation and fabrics 714 (Pace et al., 2018; Gomez et al., 2018). Comprehensive geochemical, mineralogical and 715 biodiversity studies are underway to characterize the links between physicochemical 716 parameters, microbial communities and the diversity of carbonate fabrics observed in 717 Laguna Pastos Grandes. These results will provide additional insight into the nature of the 718 biosignatures preserved in microbialites’s mineralogy and fabrics and allow us to further 719 interpret the sedimentary record on our planet. 720
Acknowledgments, Samples, and Data 721 We would like to thank Total E&P Bolivia for field assistance (Serge Nicoletis, Jean-Pierre 722 Meunier, Olivier-Daniel Moreau, Rozmarie Cuellar) and Total Lab (CSTJF, Pau, France; 723 Carole Bortelle, Josiane Sentenac, Valérie Burg) for water analysis; Mathilde Mercuzot 724 (Univ. Burgundy) for field and laboratory assistance (2016); Antoine Cogez for strontium 725 isotopic analysis of volcanic rocks, Pierre Burckel for the chemical composition analysis 726 of volcanic rocks, and BRGM (Catherine Guerrot team) for the chemical and isotopic 727 measurements in water samples (2016). We would also like to thank Dr. Daniel Carrizo for 728 providing the Chilean geological map. Particular thanks go to Magali Bonifacie for 729 constructive discussion on chlorine isotope data. Funding was provided by Total EP R&D 730 Carbonate Project (E. Poli). Parts of this work were supported by IPGP’s multidisciplinary 731 program PARI, and by the Paris–IdF region SESAME Grant no. 12015908. 732 This is IPGP contribution No. 4062. 733
References 734 Alonso-Zarza A. M. and Tanner L. H. (2010) Carbonates in continental settings: Facies, 735 environments, and processes. Dev. Sedim. 61, pp. 378. 736 Assayag N., Jézéquel D., Ader M., Viollier E., Michard G., Prévot F., and Agrinier P. 737 (2008) Hydrological budget, carbon sources and biogeochemical processes in Lac Pavin 738 (France): constraints from δ18O of water and δ13C of dissolved inorganic carbon. Appl. 739 Geochem. 23(10), 2800-2816. 740 Ballivian O. and Risacher F. (1981) Los salares del altiplano boliviano: métodos de 741 estudio y estimación económica. IRD Editions. 742 Bershaw J., Saylor J.E., Garzione C.N., Leier A. and Sundell K.E. (2016) Stable isotope 743 variations (δ18O and δ2H) in modern waters across the Andean Plateau. Geochim. et 744 Cosmochim. Acta 194, 310–324. 745 Blanc P., Lassin A., Piantone P., Azaroual M., Jacquemet N., Fabbri A., and Gaucher 746 E.C. (2012) Thermoddem: A geochemical database focused on low temperature 747 water/rock interactions and waste materials. Appl. Geochem. 27(10), 2107-2116. 748 Boschetti T., Cortecci G., Barbieri M. and Mussi M. (2007) New and past geochemical 749 data on fresh to brine waters of the Salar de Atacama and Andean Altiplano, northern 750 Chile. Geofluids 7(1), 33-50. 751 Boschetti T., Toscani L., Iacumin P. and Selmo E. (2017) Oxygen, Hydrogen, Boron and 752 Lithium Isotope Data of a Natural Spring Water with an Extreme Composition: A Fluid 753 from the Dehydrating Slab? Aquat. Geochem. 23(5-6), 299-313. 754 Bougeault C., Vennin E., Durlet C., Muller E., Mercuzot M., Chavez M., Gérard E., Ader 755 M., Virgone A. and Gaucher E. C. (2019). Biotic–Abiotic Influences on Modern Ca–Si-756 Rich Hydrothermal Spring Mounds of the Pastos Grandes Volcanic Caldera (Bolivia). 757 Minerals 9(6), 380. 758 Boyd S. R. (2001). Nitrogen in future biosphere studies. Chem. Geol. 176(1-4), 1-30. 759

19
Chaffaut I., Coudrain-Ribstein A., Michelot J. L. and Pouyaud B. (1998) Précipitations 760 d'altitude du Nord-Chili, origine des sources de vapeur et données isotopiques. Bull. Inst. 761 Fr. Etudes andines 27, 367-384 (in French). 762 Chan L.H., Edmond J.M., Thompson G. and Gillis K. (1992) Lithium isotopic 763 composition of submarine basalts: implications for the lithium cycle in the oceans. Earth 764 Planet. Sci. Lett. 108, 151–160. 765 Chan L.H. and Kastner, M. (2000) Lithium isotopic composition of pore fluids and 766 sediments in the Costa Rica subduction zone: implications for fluid processes and 767 sediment contribution to arc volcanoes. Earth Planet. Sci. Lett. 183, 275–290. 768 Chan L. H., Leeman W. P. and You C. F. (2002) Lithium isotopic composition of Central 769 American volcanic arc lavas: implications for modification of subarc mantle by slab-770 derived fluids: correction. Chem. Geol. 182(2-4), 293-300. 771 Chaussidon M. and Albarède F. (1992) Secular boron isotope variations in the continental 772 crust: an ion microprobe study. Earth Planet. Sci. Lett. 108(4), 229-241. 773 Chaussidon M. and Marty B. (1995) Primitive boron isotope composition of the mantle. 774 Science 269, 383–386. 775 Chetelat B., Liu C.-Q., Gaillardet J., Wang Q.L., Zhao Z.Q., Liang C.S., Xiao Y.K. 776 (2009) Boron isotopes geochemistry of the Changjiang basin rivers. Geochim. 777 Cosmochim. Acta 73, 6084-6097. 778 Cortecci G., Boschetti T., Mussi M., Lameli C. H., Mucchino C. and Barbieri M. (2005) 779 New chemical and original isotopic data on waters from El Tatio geothermal field, 780 northern Chile. Geochem. J. 39(6), 547-571. 781 Deconinck J. F., Blanc-Valleron M. M., Rouchy J. M., Camoin G. and Badaut-Trauth D. 782 (2000) Palaeoenvironmental and diagenetic control of the mineralogy of Upper 783 Cretaceous–Lower Tertiary deposits of the Central Palaeo–Andean basin of Bolivia 784 (Potosi area). Sedim. Geol. 132(3-4), 263-278. 785 Dellinger M., Gaillardet J., Bouchez J., Calmels D., Louvat P., Dosseto A., Gorge C., 786 Alanoca L. and Maurice L. (2015) Riverine Li isotope fractionation in the Amazon River 787 basin controlled by the weathering regimes. Geochim. Cosmochim. Acta 164, 71-93. 788 De Hoog J. C. and Savov I. P. (2018) Boron isotopes as a tracer of subduction zone 789 processes. In Boron Isotopes (eds Springer, Cham), pp. 217-247. 790 de Silva S. L. and Francis P. W. (1991) Volcanoes of the Central Andes. Springer Verlag, 791 Berlin. 792 de Silva S., Zandt G., Trumbull R., Viramonte J. G., Salas G. and Jimenez N. (2006) 793 Large ignimbrite eruptions and volcano-tectonic depressions in the Central Andes: a 794 thermomechanical perspective. In: Trois, C., De Natale, G., Kilburn, C.R.J. (Eds.), 795 Mechanism of Activity and Unrest at Large Calderas, vol. 269. Geol. Soc. London, Spec. 796 Publ., pp. 47-63. 797 de Silva S. and Kay S.M. (2018) Turning up the Heat: High-Flux Magmatism in the 798 Central Andes. Elements 14, 245-250. 799 Durand N., Monger H. C., Canti M. G. and Verrecchia E. P. (2018) Calcium carbonate 800 features. In Interpretation of micromorphological features of soils and regoliths. Elsevier. 801 pp. 205-258. 802 Eggenkamp H. G. M., Bonifacie M., Ader M., and Agrinier P. (2016) Experimental 803 determination of stable chlorine and bromine isotope fractionation during precipitation of 804 salt from a saturated solution. Chem. Geol. 433, 46-56. 805 Fritz P., Suzuki O., Silva C. and Salati E. (1981) Isotope hydrology of groundwaters in 806 the Pampa Del Tamarugal, Chile. J. Hydrol. 53, 161–184. 807

20
Gaillardet J. and Allègre C. J. (1995) Boron isotopic compositions of corals: Seawater or 808 diagenesis record? Earth Planet. Sci. Lett. 136(3-4), 665-676. 809 Godon A., Jendrzejewski N., Eggenkamp H. G., Banks D. A., Ader M., Coleman M. L. 810 and Pineau F. (2004) A cross-calibration of chlorine isotopic measurements and 811 suitability of seawater as the international reference material. Chem. Geol. 207(1-2), 1-812 12. 813 Gomez F. J., Kah L. C., Bartley J. K. and Astini R. A. (2014) Microbialites in a high-814 altitude Andean lake: multiple controls on carbonate precipitation and lamina accretion. 815 Palaios 29(6), 233-249. 816 Gomez F. J., Mlewski C., Boidi F. J., Farías M. E. and Gérard E. (2018) Calcium 817 carbonate precipitation in diatom-rich microbial mats: the Laguna Negra hypersaline 818 lake, Catamarca, Argentina. J. Sedim. Res. 88(6), 727-742. 819 Gorman P. J., Kerrick D. M. and Connolly J. A. D. (2006) Modeling open system 820 metamorphic decarbonation of subducting slabs. Geochem. Geophy. Geosy. 7(4). 821 Gran, G. (1952). Determination of the equivalence point in potentiometric titrations. Part 822 II. Analyst 77(920), 661-671. 823 Hardie L. A. and Eugster H. P. (1970) The evolution of closed-basin brines. Min. Soc. 824 Am. Special Paper 3, 273-290. 825 Hilton D. R., Hammerschmidt K., Teufel S. and Friedrichsen H. (1993) Helium isotope 826 characteristics of Andean geothermal fluids and lavas. Earth Planet. Sci. Lett. 120(3-4), 827 265-282. 828 Hoefs J. (1980) Stable isotope geochemistry. Berlin and Heidelberg, Springer Verlag. 829 Hoke L., Hilton D. R., Lamb S. H., Hammerschmidt K. and Friedrichsen H. (1994) 3He 830 evidence for a wide zone of active mantle melting beneath the Central Andes. Earth 831 Planet. Sci. Lett. 128(3-4), 341-355. 832 Hurlbert S. H. and Chang C. C. (1984) Ancient ice islands in salt lakes of the Central 833 Andes. Science 224(4646), 299-302. 834 Jiang S. Y. and Palmer M. R. (1998) Boron isotope systematics of tourmaline from 835 granites and pegmatites; a synthesis. Europ. J. Min. 10(6), 1253-1265. 836 Jones B. and Renaut R. W. (1994) Crystal fabrics and microbiota in large pisoliths from 837 Laguna Pastos Grandes, Bolivia. Sedimentology 41(6), 1171-1202. 838 Kaiser J. F. (2014) Understanding large resurgent calderas and associated magma 839 systems: the Pastos Grandes Caldera Complex, southwest Bolivia. PhD thesis of Oregon 840 State University. 841 Kay S. M. and Coira B. L. (2009) Shallowing and steepening subduction zones, 842 continental lithospheric loss, magmatism, and crustal flow under the Central Andean 843 Altiplano-Puna Plateau. Backbone of the Americas: shallow subduction, plateau uplift, 844 and ridge and terrane collision, 204, 229. 845 Li L., Cartigny P. and Ader M. (2009) Kinetic nitrogen isotope fractionation associated 846 with thermal decomposition of NH3: Experimental results and potential applications to 847 trace the origin of N2 in natural gas and hydrothermal systems. Geochim. Cosmochim. 848 Acta 73(20), 6282-6297. 849 Louvat P., Moureau J., Paris G., Bouchez J., Noireaux J., Gaillardet J. (2014a) A fully 850 automated direct injection nebulizer (d-DIHEN) for MC-ICP-MS isotope analysis: 851 application to boron isotope ratio measurements. J. Anal. Atom. Spectrom. 29(9), 1698-852 1707. 853

21
Louvat P., Gayer E. and Gaillardet J. (2014b) Boron behavior in the rivers of Réunion 854 island, inferred from boron isotope ratios and concentrations of major and trace elements. 855 Proced. Earth Plan. Sc. 10, 231-237. 856 Lowenstern J. B. (2001) Carbon dioxide in magmas and implications for hydrothermal 857 systems. Miner. Deposita 36(6), 490-502. 858 Ludington S., Orris G.J., Cox D.P., Long K.R. and Asher-Bolinden S. (1975) Mineral 859 deposit models. In Geology and Mineral Resources of the Altiplano and the Cordillera 860 Occidental, Bolivia (eds Bleiwas D. J. and Christiansen R. G.). U.S. Geol. Survey Bull. 861 pp. 63-224 862 Luddington S., Orris G.J., Cox D.P., Long K.R. and Asher-Bolinder S. (1992) Mineral 863 deposit models. In Geology And Mineral Resources Of The Altiplano and Cordillera 864 Occidental, Bolivia (eds by U.S. Geological Survey and Servicio Geolbgico de Bolivia). 865 Bull. US geol. Surv. 1975, pp. 63-89. 866 Marschall H. R. (2018) Boron isotopes in the ocean floor realm and the mantle. In Boron 867 Isotopes (eds Springer, Cham), pp. 189-215. 868 Marty B. and Jambon A. (1987) 3He in volatile fluxes from the solid Earth: Implications 869 for carbon geodynamics. Earth Plan. Sci. Lett. 83, 16-26. 870 McArthur J. M., Kennedy W. J., Chen M., Thirlwall M. F. and Gale A. S. (1994) 871 Strontium isotope stratigraphy for Late Cretaceous time: direct numerical calibration of 872 the Sr isotope curve based on the US Western Interior. Palaeogeo. Palaeoclim. 873 Palaeoeco. 108(1-2), 95-119. 874 Millot R., Guerrot C. and Vigier N. (2004) Accurate and high-precision measurement of 875 lithium isotopes in two reference materials by MC-ICP-MS. Geostand. Geoanal. Res. 876 28(1), 153-159. 877 Millot R., Scaillet B. and Sanjuan B. (2010) Lithium isotopes in island arc geothermal 878 systems: Guadeloupe, Martinique (French West Indies) and experimental approach. 879 Geochim. Cosmochim. Acta 74, 1852-1871. 880 Misra S. and Froelich P. N. (2012) Lithium isotope history of Cenozoic seawater: 881 changes in silicate weathering and reverse weathering. Science 335(6070), 818-823. 882 Moquet J. S., Crave A., Viers J., Seyler P., Armijos E., Bourrel L., Chavarri E.N, Lagane 883 C., Laraque A., Lavado Casimiro W.S., Pombosa R., Noriega L., Vera A. and Guyot J.L. 884 (2011) Chemical weathering and atmospheric/soil CO2 uptake in the Andean and 885 Foreland Amazon basins. Chem. Geol. 287(1-2), 1-26. 886 Moreira M., Rouchon V., Muller E. and Noirez S. (2018) The xenon isotopic signature of 887 the mantle beneath Massif Central. Geochem. Perspect. Lett. 6, 28-32. 888 Moriguti T. and Nakamura E. (1998) Across-arc variation of Li isotopes in lavas and 889 implications for crust/mantle recycling at subduction zones. Earth Planet. Sci. Lett. 890 163(1-4), 167-174. 891 Morteani G., Möller P., Dulski P. and Preinfalk C. (2014) Major, trace element and stable 892 isotope composition of water and muds precipitated from the hot springs of Bolivia: Are 893 the waters of the spring's potential ore forming fluids? Chemie der Erde-Geochemistry 894 74(1), 49-62. 895 Nier A. O. (1950) A redetermination of the relative abundances of the isotopes of carbon, 896 nitrogen, oxygen, argon and potassium. Phys. Rev. 77(6), 789-793. 897 Ozima M. and Podosek F. A. (2002) Noble Gas Geochemistry. Cambridge University 898 Press. 899 Pace A., Bourillot R., Bouton A., Vennin E., Braissant O., Dupraz C., Duteil T., 900 Bundeleva I., Patrier P., Galaup S., Yokoyama Y., Franceschi M., Virgone A. and 901

22
Visscher P.T. (2018) Formation of stromatolite lamina at the interface of oxygenic–902 anoxygenic photosynthesis. Geobiology 16(4), 378-398. 903 Parkhurst D.L. and Appelo C.A.J. (2013) Description of input and examples for 904 PHREEQC version 3 – a computer program for speciation, batch-reaction, one-905 dimensional transport, and inverse geochemical calculations. U.S. geological survey 906 techniques and methods, book 6, chap. A43, pp 497. 907 Pierret M. C., Clauer N., Bosch D., Blanc G. and France-Lanord C. (2001). Chemical and 908 isotopic (87Sr/86Sr, δ18O, δD) constraints to the formation processes of Red-Sea brines. 909 Geochim. Cosmochim. Acta 65(8), 1259-1275. 910 Pin C. and Bassin C. (1992) Evaluation of a strontium-specific extraction 911 chromatographic method for isotopic analysis in geological materials. Analytica Chimica 912 Acta 269(2), 249-255. 913 Pineau F. and Javoy M. (1983) Carbon isotopes and concentrations in mid-Atlantic ridge 914 basalts. Earth Planet. Sci. Lett. 29, 413-421. 915 Ray M.C., Hilton D.R., Muñoz J., Fischer T.P. and Shaw A.M. (2009) The effects of 916 volatile recycling, degassing and crustal contamination on the helium and carbon 917 geochemistry of hydrothermal fluids from the Southern Volcanic Zone of Chile. Chem. 918 Geol. 266(1-2), 38-49. 919 Risacher F. and Eugster H. P. (1979) Holocene pisoliths and encrustations associated 920 with spring-fed surface pools, Pastos Grandes, Bolivia. Sedimentology 26(2), 253-270. 921 Risacher F. and Fritz B. (1991) Geochemistry of Bolivian salars, Lipez, southern 922 Altiplano: origin of solutes and brine evolution. Geochim. Cosmochim. Acta 55(3), 687-923 705. 924 Risacher F., and Alonso H. (2001) Geochemistry of ash leachates from the 1993 Lascar 925 eruption, northern Chile. Implication for recycling of ancient evaporites. J. volcano. 926 geoth. Res. 109(4), 319-337. 927 Risacher F. and Fritz B. (2009) Origin of salts and brine evolution of Bolivian and 928 Chilean salars. Aquat. Geochem. 15(1-2), 123-157. 929 Risacher F., Alonso H. and Salazar C. (2003) The origin of brines and salts in Chilean 930 salars: a hydrochemical review. Earth-Sci. Rev. 63(3-4), 249-293. 931 Risacher F., Fritz B. and Hauser A. (2011) Origin of components in Chilean thermal 932 waters. J. S. Am. Earth Sci. 31(1), 153-170. 933 Rissmann C., Leybourne M., Benn C. and Christenson B. (2015) The origin of solutes 934 within the groundwaters of a high Andean aquifer. Chem. Geol. 396, 164-181. 935 Roche M.A., Fernandez Jauregui C., Aliaga A., Bourges J., Cortes J., Guyot J.L., Pena J. 936 and 937 Rosner M., Erzinger J., Franz G. and Trumbull R.B. (2003) Slab- derived boron isotope 938 signatures in arc volcanic rocks from the Central Andes and evidence for boron isotope 939 fractionation during progressive slab dehydration. Geochem. Geophy. Geosy. 4, 1–25. 940 Rothstein D.A. and Manning C.E. (2003) Geothermal gradients in continental magmatic 941 arcs: Constraints from the eastern Peninsular Ranges batholith, Baja California, México. 942 In Tectonic evolution of northwestern México and the southwestern USA: Boulder, 943 Colorado (eds. Johnson S.E. et al.) Geological Society of America Special Paper 374, pp. 944 337–354. 945 Rouchon V., Courtial X., Durand I., Garcia B., Creon L. and Mougin P. (2016) A Fluid 946 Phase 947

23
Equilibria Model in the System CO2-N2-H2O-NaCl-He-Ne-Ar Below 200 Bar and 150°C 948 – Application to CO2/He Fractionation in Continental Mantle Degassing. Goldschmidt 949 Abstracts 2658. 950 Rounds S. A., and Wilde F. D. (2012) Chapter A6. Section 6.6. Alkalinity and acid 951 neutralizing capacity. In US Geological Survey TWRI book 09. 952 Ryu J. S., Vigier N., Lee S. W., Lee K. S. and Chadwick O. A. (2014) Variation of 953 lithium isotope geochemistry during basalt weathering and secondary mineral 954 transformations in Hawaii. Geochim. Cosmochim. Acta 145, 103-115. 955 Salisbury M. J., Jicha B. R., de Silva S. L., Singer B. S., Jiménez N. C., and Ort M. H. 956 (2011) 40Ar/39Ar chronostratigraphy of Altiplano-Puna volcanic complex ignimbrites 957 reveals the development of a major magmatic province. Bulletin, 123(5-6), 821-840. 958 Sano Y. and Marty B. (1995) Origin of carbon in fumarolic gas from island arcs. Chem. 959 Geol. 119(1-4), 265-274. 960 Sano Y., Takahata N., Nishio Y. and Marty B. (1998) Nitrogen recycling in subduction 961 zones. Geophy. Res. Lett. 25, 2289-2292. 962 Santoyo E., and Díaz-González L. (2010) A new improved proposal of the Na/K 963 geothermometer to estimate deep equilibrium temperatures and their uncertainties in 964 geothermal systems. Proceedings World Geothermal Congress, Bali, Indonesia. 965 Sanjuan B., Millot R., Ásmundsson R., Brach M. and Giroud N. (2014) Use of two new 966 Na/Li geothermometric relationships for geothermal fluids in volcanic environments. 967 Chem. Geol. 389, 60-81. 968 Spiro B., Hoke L. and Chenery C. (1997) Carbon-isotope characteristics of CO2 and CH4 969 in geothermal springs from the Central Andes. Internat. Geol. Rev. 39(10), 938-947. 970 Springer M., and Förster, A. (1998). Heat-flow density across the central Andean 971 subduction zone. Tectonophysics 291, 123-139. 972 Teboul P. A., Durlet C., Gaucher E. C., Virgone A., Girard J. P., Curie J., ... and Camoin 973 G. F. (2016) Origins of elements building travertine and tufa: New perspectives provided 974 by isotopic and geochemical tracers. Sedim. Geol. 334, 97-114. 975 Teboul P. A. (2017) Diagenesis of lower Cretaceous presalt continental carbonates from 976 the West African margin: simulations and analogues (Doctoral dissertation, Aix-977 Marseille). 978 Terra G.J.S., Spadini A.R., França A.B., Sombra C.L., Zambonato E.E., da Silva 979 Juschaks L.C., Arienti L.M., Erthal M.M., Blauth M., Franco M.P., Matsuda N.S., da 980 Silva N.G.C., Moretti Junior P.A., D’Avila R.S.F., de Souza R.S., Tonietto S.N., Couto 981 dos Anjos S.M., Campinho V.S. and Winter W.R. (2010) Classificação de rochas 982 carbonáticas aplicável às bacias sedimentares brasileiras. Bulletin Geoscience Petrobras, 983 Rio de Janeiro 18 (1), 9–29 984 Thorpe R. S., Potts P. J., and Francis P. W. (1976) Rare earth data and petrogenesis of 985 andesite from the North Chilean Andes. Contrib. Mineral. Petr. 54(1), 65-78. 986 Tosca N.J., Wright V.P. (2015) Diagenetic pathways linked to labile Mg-clays in 987 lacustrine carbonate reservoirs: a model for the origin of secondary porosity in the 988 Cretaceous Pre-salt Barra Velha Formation, Offshore Brazil, 435. Geological Society of 989 London, Special Publication. SP435-1. 990 Vengosh A., Kolodny Y., Starinsky A., Chivas A. R. and McCulloch M. T. (1991) 991 Coprecipitation and isotopic fractionation of boron in modern biogenic carbonates. 992 Geochim. Cosmochim. Acta 55(10), 2901-2910. 993

24
Verkouteren R. M. and Klinedinst D. B. (2004) Value Assignment and Uncertainty 994 Estimation of Selected Light Stable Isotope Reference Materials: RMs 8543-8545, RMs 995 8562-8564, and RM 8566. NIST Special Publication 260 (149), 59. 996 Verma S. P. and Santoyo E. (1997) New improved equations for Na/K, Na/Li and SiO2 997 geothermometers by outlier detection and rejection. J. Volcanol. Geoth. Res. 79(1-2), 9-998 23. 999 Verrecchia E.P. (2007) Lacustrine and palustrine geochemical sediments - Chapter 9. In: 1000 Terrestrial geochemical sediments and geomorphology (Eds. D.J. Nash and S.J. 1001 McLaren), Blackwell, London, Oxford, pp. 298-329. 1002 Zamanian K., Pustovoytov K. and Kuzyakov Y. (2016). Pedogenic carbonates: Forms 1003 and formation processes. Earth-Sci. Rev. 157, 1-17. 1004

25
Figure Captions 1005 1006 Fig. 1: a. Topographic map of the Central Andes showing the location of Laguna Pastos 1007 Grandes among the main Chilean and Bolivian salars (in white); b. Zoom on the geological 1008 context of Laguna Pastos Grandes (modified from Bougeault et al., 2019); satellite image 1009 provided by Zoom Earth website, © 2018 Microsoft Corporation Earthstar Geographics 1010 SIO; c. View of the carbonate platform with partially submerged calcitic pisoliths. 1011 1012 Fig. 2: Location of water and gas sampling in streams (blue stars), thermal springs (red 1013 stars) and brine in one of the sustainable lakes (yellow star) in Laguna Pastos Grandes 1014 (Bolivia). The location of the volcanic rock samples is also indicated by black dots. The 1015 four thermal springs (images 1-4) flow up through the recent carbonate platform 1016 developing to the west of the laguna. The arrows indicate gas bubbling in the water basins, 1017 except for "El Gigante" where gas and water have separate vents. Ign.: Ignimbrite; Dac.: 1018 Dacite; And.: Andesite. 1019 1020 Fig. 3: Relative abundance of air-normalized isotopic composition of noble gas (4He, 20Ne, 1021 36Ar, 40Ar/36Ar and 3He/4He) in thermal springs El Ojo Verde, La Rumba, La Salsa and El 1022 Gigante. The normalization values used as references are 295.5 for 40Ar/36Ar ratio (Nier, 1023 1950) and 1.39x10⁻⁶ for 3He/4He ratio (Ozima and Podosek, 2002). Helium isotope ratios 1024 are corrected for the effects of ASW (Air saturated Water) contamination in hydrothermal 1025 system and are equivalent to Rc/Ra. 1026 1027 Fig. 4: Plot of δ18O versus δ2H for Pastos Grandes waters. Plot b is focused on thermal 1028 springs (in red) and cold streams (in blue) compared to a rain sample (in white) collected 1029 at the same altitude during the wet season in March 2017. Two snow samples (grey) were 1030 also collected during the dry season in January 2016. Rainfall and snow data are presented 1031 in Table A2. The composition of the lake brine (in yellow) of Pastos Grandes is compared 1032 to other Andean salars (in black, based on this study and Boschetti et al., 2007; Table A2). 1033 The Local Meteoric Water Line (LMWL; Chaffaut et al., 1998) and the Local Ground- and 1034 Spring-Water Line (LGSWL; Rissmann et al., 2015) for the South-Central Andes are also 1035 indicated. 1036 1037 Fig. 5: Chemical composition of Laguna Pastos Grandes water sources (thermal springs in 1038 red/orange and streams in blue) and lake brine (in yellow). a. Schoeller diagram showing 1039 relative concentrations in solutes; b. Plot of Ca versus Alkalinity (mM); c. Plot of Cl 1040 concentration versus Cl/Br. Data from this study are presented as dots and previous data as 1041 squares (Ballivian and Risacher, 1981; Hurlbert and Chang, 1984; Risacher and Fritz, 1042 1991; Jones and Renaut, 1994). 1043 1044 Fig. 6: Sr, Li and B isotopic compositions of Laguna Pastos Grandes water sources (thermal 1045 springs in red and streams in blue) and lake brine (in yellow) compared with andesite, 1046 dacite (this study), and rhyolitic ignimbrite (this study and Kaiser, 2014) from the Pastos 1047 Grandes caldera. a. 87Sr/86Sr vs Sr concentration (mg/l) data compared to Cenomanian-1048 Turonian marine carbonates (McArthur et al., 1994) representing the last marine 1049 sedimentary sequence in the Central Andes region and modern marine evaporites (Pierret 1050 et al., 2001). Mean values of dacite (D) and andesite (A) from the Andean Central Volcanic 1051 Zone (CVZ) are also given for comparison (Cortecci et al., 2005); b. δ11B vs δ7Li data 1052

26
compared to modern seawater (Boschetti et al., 2017) and rocks from the Andean volcanic 1053 arc (Chan et al., 2002; Rosner et al., 2003). 1054 1055 Fig. 7: Conceptual model of modern carbonate precipitation in relation to water and gas 1056 sources in Laguna Pastos Grandes. Violet-blue arrows refer to hydrothermal circulations. 1057 See the conclusion for more details. Boron isotope data are from De Hoog and Savov 1058 (2018) for the Altered Oceanic Crust (AOC) and marine sediments and Marschall (2018) 1059 for the mantle. Lithium isotope data are from Chan and Kastner (2000) for subducted 1060 sediments, Moriguti and Nakamura (1998) and Chan et al. (1992) for AOC and Misra and 1061 Froelich (2012) for the mantle. Nitrogen isotope data are from Sano et al. (1998) for the 1062 crust. Carbon isotope data are from Hoefs (1980) for sedimentary organic carbon and 1063 Pineau and Javoy (1983) for mantle-derived signature. Rc/Ra data are from Hoke et al 1064 (1994). Other data are from this study. 1065 1066

27
Figure 1 1067
1068 1069

28
Figure 2 1070
1071 1072

29
Figure 3 1073
1074 1075
0.01
0.1
1
10
100
Air
4He 20Ne 36Ar 40Ar/36Ar 3He/4He
ASWAir n
orm
aliz
ed a
bund
ance
La Salsa
El Ojo VerdeLa Rumba
El Gigante

30
Figure 4 1076
1077 1078
-120
-100
-80
-60
-40
-20
0
20
40
-20 -15 -10 -5 0 5 10 δ18O (‰)
δD (‰
)
LMW
L 8.15
*δ18 O+15
.3
Surface runoffHydrothermal springsPastos Grandes LagunaOther Andean salars
RainfallLG
SWL 7
.99*δ
18 O+0.3
Snow
δD = 4.29 δ18O - 43.82 R2 = 0,95
-120
-100
-80 -16 -12
b.
b.

31
Figure 5 1079
1080 1081
0.01
0.1
1
10
100
1000
10000
K Ca Mg Na Cl Alkalinity SO4
Surface streams
Piedmont spring
Hydrothermal springs
Laguna brine
Con
cent
ratio
n (m
M)
LS-4MV-1PG17-112PG17-110PG1-1PG17-117PGS-1SP-3PG17-99
a
b
Cl/B
r (m
olar
)
c
0.1 1 10 100 1 000 10 000Cl (mM)
100
1 000
10 000
SW
Precipitation of halite
Evaporation
Dissolution of halite
Mixi
ng o
f rec
ycle
d br
ines
with
gro
undw
ater
10%
1%
2%
20%
Streams
Thermal springs (T>35°C)Brines
Cold springs (T<32°C)
Ca/Alk = 5.3
Ca/Alk = 1.3
Ca/Alk = 0.4
Ca (mM)
Alka
linity
(mM
)
0.1
1
10
100
0.01 0.1 1 10 100
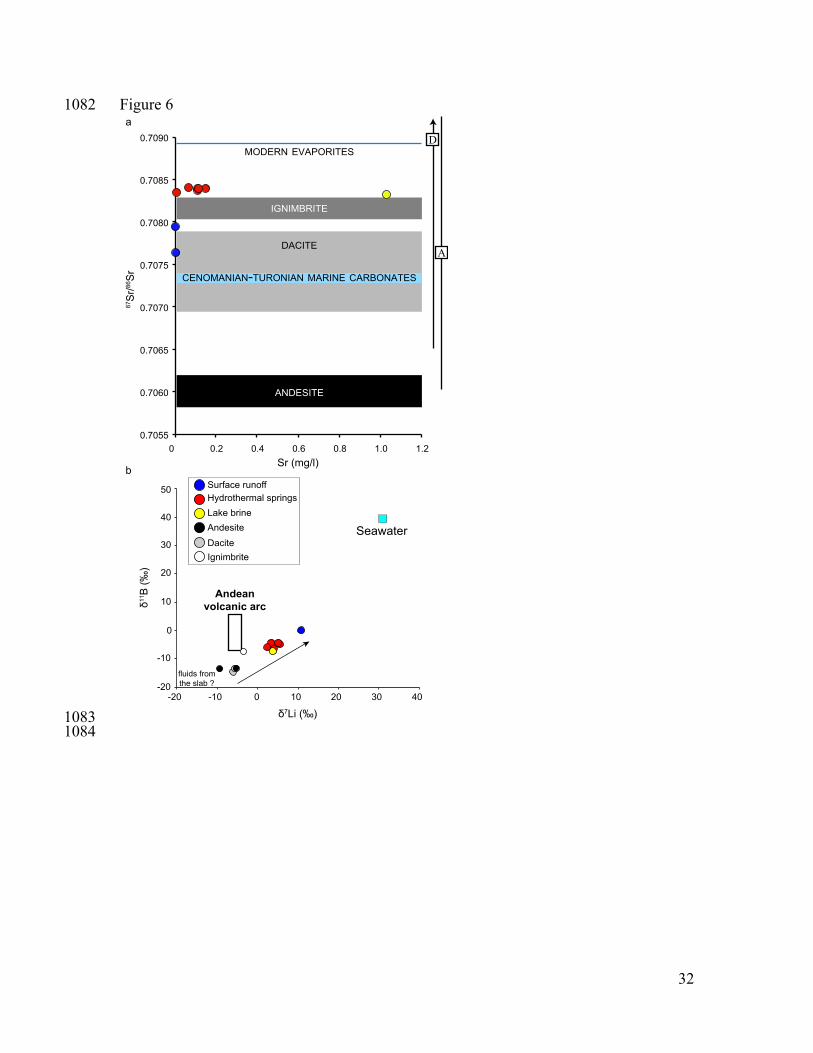
32
Figure 6 1082
1083 1084
0.7055
0.7060
0.7065
0.7070
0.7075
0.7080
0.7085
0.7090
0 0.2 0.4 0.6 0.8 1.0 1.2 Sr (mg/l)
87Sr
/86Sr
IGNIMBRITE
CENOMANIAN-TURONIAN MARINE CARBONATES
DACITE
ANDESITE
MODERN EVAPORITES
A
Da
-20
-10
0
10
20
40
50
-20 -10 0 10 40
δ7Li (‰)
δ11 B
(‰)
Surface runoffHydrothermal springsLake brine
30
20 30
AndesiteDaciteIgnimbrite
fluids from the slab ?
Andean volcanic arc
Seawater
b

33
Figure 7 1085
1086 1087

34
Appendix of 1088
A Multi-Tracers Analysis of Gas and Solutes in Laguna Pastos Grandes (Bolivia): Key 1089 Proxies of the Origin of Continental Carbonates in Andean Salars 1090
E. Muller1, E. C. Gaucher2, C. Durlet3, J.S. Moquet1, M. Moreira1, V. Rouchon4, P. Louvat1, G. 1091 Bardoux1, S. Noirez4, C. Bougeault3, E. Vennin3, E. Gérard1, M. Chavez5, A. Virgone2, M. Ader1 1092
1Institut de Physique du Globe de Paris, Sorbonne Paris Cité, Université Paris Diderot, UMR 7154 CNRS, F-75005 1093 Paris, France 1094
2Total EP CSTJF, Pau, France 1095
3Laboratoire Biogéosciences, UMR 6282, CNRS, Université Bourgogne Franche-Comté, 21000 Dijon, France 1096
4IFP Energies Nouvelles, 1-4 Avenue de Bois Préau, 92852, Rueil-Malmaison Cedex, France 1097
5Total EP Bolivia 1098
Corresponding author: Elodie Muller ([email protected]) 1099
1100
Analytical methods 1101 N2 gas: δ15N of N2 gas was measured following the protocol of Li et al. (2009). 1102
Purification starts with a cryogenic separation at liquid nitrogen temperature. The non-1103 condensable gases, including N2, H2, O2, CH4 and He, are inserted in the line and circulated 1104 using a mercury Toeppler pump through a CuO reactor maintained at 950 °C for 30 minutes 1105 (and then cooled to 450 °C) to oxidize H2 and CH4. The resulting CO2 and H2O are 1106 cryogenically trapped at liquid-nitrogen boiling temperature. Excess O2, if any, is resorbed 1107 and the NOx that was potentially generated during the previous oxidation phase is reduced 1108 to N2 by circulating the gases over a Cu reactor maintained at 600 °C. The purified N2 and 1109 He are then collected with the mercury Toeppler pump and manometrically quantified 1110 before being transferred in vials for measurement using a dual-inlet IRMS Delta + XP. This 1111 instrument is calibrated by measuring an internal reference N2 gas, itself calibrated against 1112 the air, the international reference standard for δ15N measurements, which has by definition 1113 an absolute value of δ15NAir = 0‰. The CO2 that was trapped using liquid nitrogen was 1114 then released at -140 °C, collected using a liquid N2 trap and manometrically quantified 1115 before being transferred to vials for measurement using the dual-inlet IRMS Delta + XP. 1116 δ13C values compare well with those obtained by GC/C/IRMS at the IFPEN laboratory 1117 (mean difference < 0.2‰; Table A1). 1118
Noble gas: Noble gases were measured following the protocol of Moreira et al. 1119 (2018). The gas purification consists of several combustions: the first one with a Bulk 1120 Getter (SAES) heating system maintained at 400 °C for 5 minutes, followed by two 5-1121 minute combustions at 800 °C each with titanium sponge. After purification, helium is 1122 separated from the other noble gases using activated charcoal at 30 K, introduced into the 1123 Helix-SFT mass spectrometer and analyzed using peak jumping. 3He is collected on the 1124 electron multiplier in pulse-counting mode whereas 4He is analyzed on the Faraday cup 1125 and the signal is amplified using either 1011 ohm or 1012 ohm resistance depending on the 1126 signal. After the helium was measured, neon is released from the cold trap at 70 K. Two 1127

35
cycles of neon isotope measurement are performed before neon is introduced to stabilize 1128 the magnet. For each cycle, 20Ne is measured using a mass-scan instead of setting the 1129 magnet on the required field to measure 20Ne (see Moreira et al., 2018 for details). 21Ne, 1130 22Ne, 40Ar and CO2 were measured for 10 seconds each using peak switching. Argon is 1131 partially desorbed at 130 K and transferred to charcoal at the temperature of liquid nitrogen 1132 for 15 minutes. After the desorption of argon at room temperature from the charcoal trap, 1133 dilution(s) using a 1 L reservoir is/are used to decrease the amount of argon introduced into 1134 the mass spectrometer. 36Ar and 38Ar are collected on the electron multiplier, whereas 40Ar 1135 is measured on the Faraday cup using 1011 ohm resistance. All the data were corrected 1136 following the procedure of Moreira et al. (2018). 1137
B isotopes: δ11B was measured in rock samples following the protocol of Chetelat 1138 et al. (2009). Finely powdered sample (50 mg) was admixed with 300 mg of ultra-pure 1139 K2CO3 in a Pt crucible and melted in a muffle furnace at 950 °C for 15 minutes. The pellet 1140 was taken up in 3 mL of 0.5 HNO3 and added to a 50 mL vial filled with 20 mL H2O. An 1141 additional 1-2 mL of 0.5N HNO3 were added until complete dissolution. The final pH was 1142 adjusted to pH 1.7 with 3N HNO3, and 7 mL of this solution were passed through 2 mL of 1143 the cation exchange resin AG 50W-X8 to extract most of the cationic load. The recovered 1144 solution was adjusted to pH 8-9 with distilled 4N NH4OH and B was extracted on 1145 Amberlite IRA-743 resin in two steps: the first step consisted of extraction on a column 1146 loaded with 300 µL of resin and the second step of purification (after adjustment to pH 8-1147 9 again) on a column filled with 50 µL of the resin. 1148
1149 Geothermometric calculations 1150 The silica concentration of our samples is fairly uniform within the range of 101 to 154 1151 mg/l (Table 2). Applying the quartz geothermometer described in Kharaka and Mariner 1152 (1989), Verma and Santoyo (1995, 1997) estimated equilibrium temperatures of spring 1153 water with the rocks of a deep reservoir up to 163 ± 3 °C (assuming no steam loss; Table 1154 A3) with a mean of 149 ±11 °C. However, considering the temperature between the surface 1155 and the deep reservoir, the strong influence of temperature on quartz solubility as well as 1156 precipitation of silica during water cooling as it ascends to the surface could affect the 1157 estimated temperature. The Na-K-Ca geothermometer yields similar estimates (156 ±30 1158 °C) when the Mg correction of Fournier and Potter (1979) is applied. But similarly, this 1159 geothermometer calibrated on silicates can also be affected by a precipitation of silicates 1160 during the cooling of the thermal water. 1161
1162 The Na-Li geothermometer gives much higher estimates (around 300 °C) regardless of the 1163 equation used (Fouillac and Michard, 1981; Kharaka et al., 1982; Verma and Santoyo, 1164 1993, 1997). Using a larger dataset than in the previous articles, Sanjuan et al. (2014) 1165 modified the equations of Kharaka et al. (1982) and Fouillac and Michard (1981). Their 1166 corrections do not modify the results for the Kharaka et al. equation (mean value 325 °C) 1167 and decrease the values obtained with the Fouillac and Michard equation (mean value 251 1168 °C) by 50 °C. The Li-Mg geothermometer (Kharaka and Mariner, 1989) yields lower 1169 values (186 ±18 °C; Table A3) than the Na-Li geothermometer. The discrepancies 1170 observed between the geothermometers using Li can be explained by the high 1171 concentrations of Li in our samples. The Log(Na/Li) values obtained for the thermal 1172 springs of Laguna Pastos Grandes are between 1.24 and 1.47 whereas the values used by 1173 Sanjuan et al. (2014) for their calibrations are never lower than 2.00. Consequently, our 1174
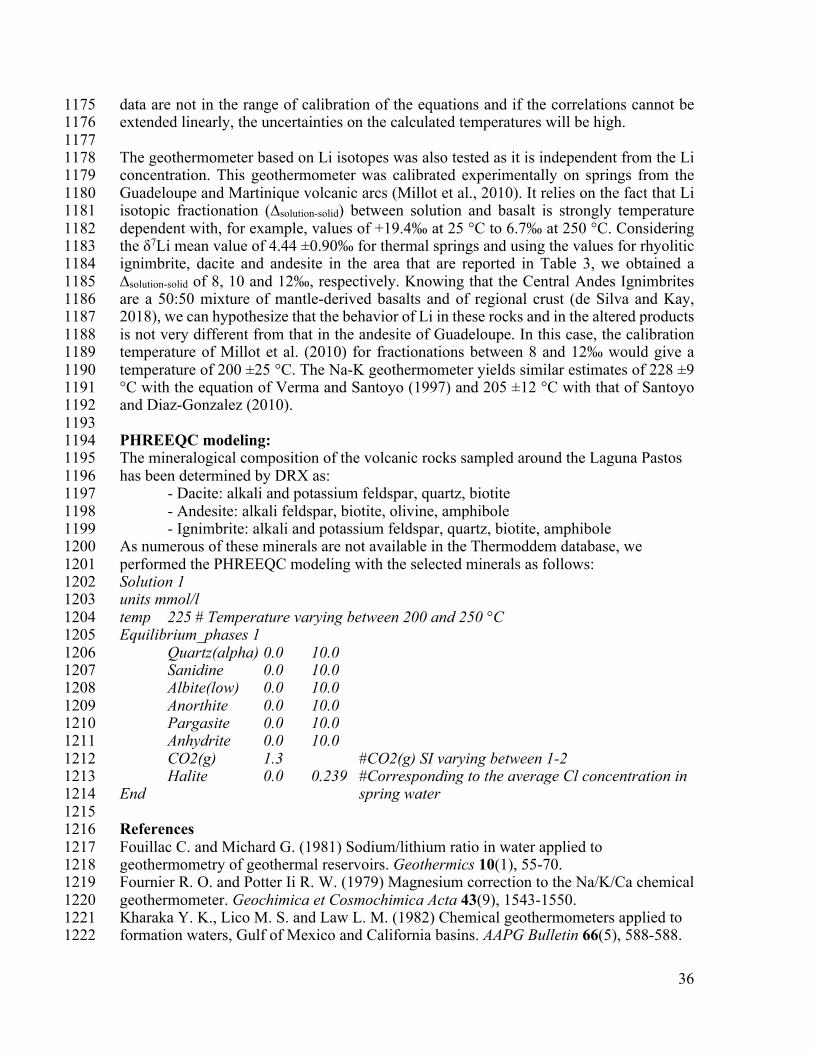
36
data are not in the range of calibration of the equations and if the correlations cannot be 1175 extended linearly, the uncertainties on the calculated temperatures will be high. 1176
1177 The geothermometer based on Li isotopes was also tested as it is independent from the Li 1178 concentration. This geothermometer was calibrated experimentally on springs from the 1179 Guadeloupe and Martinique volcanic arcs (Millot et al., 2010). It relies on the fact that Li 1180 isotopic fractionation (∆solution-solid) between solution and basalt is strongly temperature 1181 dependent with, for example, values of +19.4‰ at 25 °C to 6.7‰ at 250 °C. Considering 1182 the δ7Li mean value of 4.44 ±0.90‰ for thermal springs and using the values for rhyolitic 1183 ignimbrite, dacite and andesite in the area that are reported in Table 3, we obtained a 1184 ∆solution-solid of 8, 10 and 12‰, respectively. Knowing that the Central Andes Ignimbrites 1185 are a 50:50 mixture of mantle-derived basalts and of regional crust (de Silva and Kay, 1186 2018), we can hypothesize that the behavior of Li in these rocks and in the altered products 1187 is not very different from that in the andesite of Guadeloupe. In this case, the calibration 1188 temperature of Millot et al. (2010) for fractionations between 8 and 12‰ would give a 1189 temperature of 200 ±25 °C. The Na-K geothermometer yields similar estimates of 228 ±9 1190 °C with the equation of Verma and Santoyo (1997) and 205 ±12 °C with that of Santoyo 1191 and Diaz-Gonzalez (2010). 1192 1193 PHREEQC modeling: 1194 The mineralogical composition of the volcanic rocks sampled around the Laguna Pastos 1195 has been determined by DRX as: 1196 - Dacite: alkali and potassium feldspar, quartz, biotite 1197 - Andesite: alkali feldspar, biotite, olivine, amphibole 1198 - Ignimbrite: alkali and potassium feldspar, quartz, biotite, amphibole 1199 As numerous of these minerals are not available in the Thermoddem database, we 1200 performed the PHREEQC modeling with the selected minerals as follows: 1201 Solution 1 1202 units mmol/l 1203 temp 225 # Temperature varying between 200 and 250 °C 1204 Equilibrium_phases 1 1205 Quartz(alpha) 0.0 10.0 1206 Sanidine 0.0 10.0 1207 Albite(low) 0.0 10.0 1208 Anorthite 0.0 10.0 1209 Pargasite 0.0 10.0 1210 Anhydrite 0.0 10.0 1211 CO2(g) 1.3 #CO2(g) SI varying between 1-2 1212 Halite 0.0 0.239 #Corresponding to the average Cl concentration in 1213 End spring water 1214 1215 References 1216 Fouillac C. and Michard G. (1981) Sodium/lithium ratio in water applied to 1217 geothermometry of geothermal reservoirs. Geothermics 10(1), 55-70. 1218 Fournier R. O. and Potter Ii R. W. (1979) Magnesium correction to the Na/K/Ca chemical 1219 geothermometer. Geochimica et Cosmochimica Acta 43(9), 1543-1550. 1220 Kharaka Y. K., Lico M. S. and Law L. M. (1982) Chemical geothermometers applied to 1221 formation waters, Gulf of Mexico and California basins. AAPG Bulletin 66(5), 588-588. 1222

37
Kharaka Y. K. and Mariner R. H. (1989) Chemical geothermometers and their 1223 application to formation waters from sedimentary basins. In Thermal history of 1224 sedimentary basins. Springer, New York, NY. pp. 99-117. 1225 Verma S. P. and Santoyo E. (1995) New improved equations for Na/K and SiO2 1226 geothermometers by error propagation. Proc. World Geotherm. Congr 2, 963-968. 1227 1228 Figure captions 1229
Figure A1. Photography and illustrating schema of bubbling gas sampling method. 1230
Figure A2. Comparison of the water composition obtained for the volcanic bedrock 1231 weathering at 200 (blue), 225 (red) and 250 °C (green) with increasing pCO2 from 10 bar 1232 in light color to 100 bar in dark color. The average spring water is in black. 1233
Figure A3. Air-normalized helium R/Ra values plotted against He/Ne ratios of gas samples 1234 from Laguna Pastos Grandes compared with other Andean sources (Hoke et al., 1994). 1235 Mixing lines between the three main sources of helium (crustal CRUST, mantle MORB 1236 and air saturated water ASW) are also represented. 1237 1238 Figure A4. Relations between chloride and sodium for Pastos Grandes brines (in yellow) 1239 and water sources as a function of temperature: thermal spring >35 °C in red, <32 °C in 1240 orange and cold stream <15 °C in blue. Na-Cl compositions are compared with other 1241 Bolivian salars (pale triangles; Risacher and Fritz, 1991). Data from this study are reported 1242 with dots and previous data with squares (Ballivian and Risacher, 1981; Hurlbert and 1243 Chang, 1984; Risacher and Fritz, 1991; Jones and Renaut, 1994). 1244 1245

38
Table A1. Detailed nitrogen and carbon isotopic analysis of gas samples from Laguna 1246 Pastos Grandes. 1247
Nitrogen analysis Sample Date Method δ15N (‰) 1σ PG100 20/07/2017 GC-IRMS on steel tube 2.73 0.03 PG100 20/07/2017 GC-IRMS on steel tube 2.75 0.01 PG112 20/07/2017 GC-IRMS on steel tube 1.79 0.02 PG112 20/07/2017 GC-IRMS on steel tube 1.77 0.01 PG112 07/02/2018 GC-IRMS on exetainer 1.74 0.02 PG116 07/02/2018 GC-IRMS on exetainer 1.60 0.02 PG117 19/07/2017 GC-IRMS on steel tube 2.49 0.05 PG117 19/07/2017 GC-IRMS on steel tube 2.47 0.03 PG117 19/07/2017 GC-IRMS on steel tube 2.24 0.03 PG117 19/07/2017 GC-IRMS on steel tube 2.26 0.02 PG117 19/07/2017 GC-IRMS on steel tube 2.18 0.02 PG117 19/07/2017 GC-IRMS on steel tube 2.17 0.02
Carbon analysis Sample Date Method δ13C (‰) 1σ PG100 14/06/2017 GC-C-IRMS -11.36 0.01 PG100 14/06/2017 GC-C-IRMS -11.32 0.01 PG100 14/06/2017 GC-C-IRMS -11.31 0.01 PG100 20/07/2017 GC-IRMS -10.73 0.03 PG100 20/07/2017 GC-IRMS -11.27 0.03 PG112 14/06/2017 GC-C-IRMS -11.31 0.01 PG112 14/06/2017 GC-C-IRMS -11.24 0.01 PG112 14/06/2017 GC-C-IRMS -11.26 0.01 PG112 20/07/2017 GC-IRMS -11.11 0.03
PG112 20/07/2017 GC-IRMS -11.24 0.03
PG116 14/06/2017 GC-C-IRMS -11.25 0.03 PG116 14/06/2017 GC-C-IRMS -11.08 0.03 PG116 14/06/2017 GC-C-IRMS -11.05 0.03 PG116 07/02/2018 GC-IRMS -11.00 0.04 PG116 07/02/2018 GC-IRMS -11.49 0.04 PG116 07/02/2018 GC-IRMS -11.43 0.06 PG117 14/06/2017 GC-C-IRMS -11.06 0.04 PG117 19/07/2017 GC-IRMS -10.85 0.05

39
Table A2. Stable isotope compositions of Andean salars water, rainfall and snow from the 1248 region of Pastos Grandes (from this study* and Boschetti et al., 2007). 1249 δ18O (±0.1‰, 1s) δD (±0.8‰, 1s) Chaxa lagoon -0.8 -30.5
Miñique lagoon 5.4 10.1
Miscanti lagoon 3.3 0.5
Uyuni* 1.9 -26.1
Rainfall* -16.3 -112.9
Snow 1* -6.8 -30.3
Snow 2* -2.7 6.5 1250 Table A3. Estimated equilibrium temperatures (°C) for hydrothermal sources obtained with 1251 different geothermometers. 1252 Geothermometer PG_117 PG_112 PG_100 PG1_1 MV_1 PGS_1 Mean 1s SiO2 (Verma and Santoyo, 1997) 145 138 145 163 162 138 149 11 Na/K/Ca – Mg (Fournier and Potter, 1979) 177 144 169 167 171 107 156 26 Na/K (Verma and Santoyo, 1997) 215 226 237 222 230 240 228 9 Na/K (Santoyo and Diaz-Gonzalez, 2010) 188 202 216 197 221 207 205 12 Na/Li (Fouillac and Michard, 1981) 315 316 344 272 283 268 300 30 Na/Li (modified by Sanjuan et al., 2014) 264 264 285 230 239 226 251 23 Na/Li (Verma and Santoyo, 1997) 323 324 351 280 292 276 308 30 Na/Li (Kharaka et al., 1982) 334 335 353 304 312 301 323 21 Na/Li (modified by Sanjuan et al., 2014) 336 337 355 306 314 303 325 21 Mg/Li (Kharaka and Mariner, 1989) 199 193 197 185 192 151 186 18
Table A4. δ37Cl analyses of water samples from Laguna Pastos Grandes. 1253 Sample δ37Cl (‰) 1σ La Salsa 1 0.308 0.002 La Salsa 2 0.230 0.010 La Salsa 3 0.230 0.009 La Salsa 4 0.260 0.009 La Salsa 5 0.234 0.003 La Salsa 6 0.292 0.002 La Salsa 7 0.300 0.002 La Rumba 1 0.227 0.010 La Rumba 2 0.205 0.006 La Rumba 3 0.234 0.011
El Ojo Verde 1 0.246 0.009 El Ojo Verde 2 0.252 0.013 Average 0.251 0.032
1254

Table A5. Results of PHREEQC modeling. Alb. Albite(low); Anh. Anhydrite; An. Anorthite; 1255 Hal. Halite; Par. Pargasite; Qtz. Quartz(alpha); San. Sanidine 1256
pCO2 (bar) Alb. Anh. An. CO2(g) Hal. Par. Qtz San. C Ca Cl K Mg Na S Si
Inpu
t tem
pera
ture
: 2
00 °C
10
Am
ount
of d
issol
utio
n ( -)
or p
reci
pita
tion
(+) (
mol
ality
)
4.9E-2 -5.0E-4 -1.7E-2 -1.0E-1 -2.4E-1 -1.4E-3 -7.6E-2 -1.1E-2
Wat
er c
hem
istry
(mol
ality
)
1.0E-1 2.0E-2 2.4E-1 1.1E-2 5.6E-3 1.9E-1 5.0E-4 5.4E-3 20 5.0E-2 -5.3E-4 -1.6E-2 -2.0E-1 -2.4E-1 -2.4E-3 -7.6E-2 -1.1E-2 2.0E-1 2.1E-2 2.4E-1 1.1E-2 9.8E-3 1.9E-1 5.3E-4 5.4E-3 40 5.2E-2 -5.7E-4 -1.4E-2 -3.9E-1 -2.4E-1 -4.4E-3 -7.4E-2 -1.1E-2 3.9E-1 2.3E-2 2.4E-1 1.1E-2 1.8E-2 1.9E-1 5.7E-4 5.4E-3 60 5.4E-2 -6.0E-4 -1.2E-2 -5.8E-1 -2.4E-1 -6.3E-3 -7.2E-2 -1.1E-2 5.8E-1 2.5E-2 2.4E-1 1.1E-2 2.5E-2 1.9E-1 6.0E-4 5.3E-3 80 5.5E-2 -6.3E-4 -9.9E-3 -7.6E-1 -2.4E-1 -8.1E-3 -6.9E-2 -1.1E-2 7.6E-1 2.7E-2 2.4E-1 1.1E-2 3.2E-2 1.9E-1 6.3E-4 5.3E-3 100 5.7E-2 -6.6E-4 -7.8E-3 -9.6E-1 -2.4E-1 -1.0E-2 -6.7E-2 -1.1E-2 9.6E-1 2.9E-2 2.4E-1 1.1E-2 4.0E-2 1.9E-1 6.6E-4 5.3E-3
Inpu
t tem
pera
ture
: 2
25 °C
10 3.6E-2 -4.5E-4 -9.4E-3 -1.0E-1 -2.4E-1 -6.4E-4 -4.7E-2 -1.5E-2 1.0E-1 1.1E-2 2.4E-1 1.5E-2 2.6E-3 2.0E-1 4.5E-4 7.2E-3 20 3.6E-2 -4.7E-4 -8.9E-3 -2.0E-1 -2.4E-1 -1.1E-3 -4.6E-2 -1.5E-2 2.0E-1 1.2E-2 2.4E-1 1.5E-2 4.4E-3 2.0E-1 4.7E-4 7.1E-3 40 3.7E-2 -4.9E-4 -8.1E-3 -4.0E-1 -2.4E-1 -1.9E-3 -4.5E-2 -1.5E-2 4.0E-1 1.2E-2 2.4E-1 1.5E-2 7.7E-3 2.0E-1 4.9E-4 7.1E-3 60 3.7E-2 -5.1E-4 -7.2E-3 -6.0E-1 -2.4E-1 -2.7E-3 -4.4E-2 -1.5E-2 6.0E-1 1.3E-2 2.4E-1 1.5E-2 1.1E-2 2.0E-1 5.1E-4 7.0E-3 80 3.8E-2 -5.2E-4 -6.3E-3 -7.9E-1 -2.4E-1 -3.4E-3 -4.3E-2 -1.5E-2 7.9E-1 1.4E-2 2.4E-1 1.5E-2 1.4E-2 2.0E-1 5.2E-4 7.0E-3 100 3.8E-2 -5.4E-4 -5.4E-3 -9.9E-1 -2.4E-1 -4.2E-3 -4.1E-2 -1.5E-2 1.0E0 1.4E-2 2.4E-1 1.5E-2 1.7E-2 2.0E-1 5.4E-4 6.9E-3
Inpu
t tem
pera
ture
: 2
50 °C
10 3.2E-2 -4.3E-4 -5.8E-3 -1.1E-1 -2.4E-1 -3.0E-4 -3.1E-2 -1.9E-2 1.1E-1 6.8E-3 2.4E-1 1.9E-2 1.2E-3 2.1E-1 4.3E-4 7.3E-3 20 3.2E-2 -4.4E-4 -5.6E-3 -2.2E-1 -2.4E-1 -5.0E-4 -3.1E-2 -1.9E-2 2.2E-1 7.0E-3 2.4E-1 1.9E-2 2.0E-3 2.1E-1 4.4E-4 7.2E-3 40 3.2E-2 -4.5E-4 -5.2E-3 -4.5E-1 -2.4E-1 -8.6E-4 -3.0E-2 -1.9E-2 4.5E-1 7.3E-3 2.4E-1 1.9E-2 3.5E-3 2.1E-1 4.5E-4 7.2E-3 60 3.3E-2 -4.6E-4 -4.8E-3 -6.7E-1 -2.4E-1 -1.2E-3 -3.0E-2 -1.9E-2 6.7E-1 7.6E-3 2.4E-1 1.9E-2 4.8E-3 2.1E-1 4.6E-4 7.1E-3 80 3.3E-2 -4.7E-4 -4.4E-3 -8.8E-1 -2.4E-1 -1.5E-3 -2.9E-2 -1.9E-2 8.9E-1 7.9E-3 2.4E-1 1.9E-2 6.1E-3 2.1E-1 4.7E-4 7.1E-3 100 3.3E-2 -4.7E-4 -4.0E-3 -1.1E0 -2.4E-1 -1.8E-3 -2.9E-2 -1.9E-2 1.1E0 8.2E-3 2.4E-1 1.9E-2 7.3E-3 2.1E-1 4.7E-4 7.0E-3
1257 1258

1259 Table A6. Comparison of Laguna Pastos Grandes characteristics with Chilean and Bolivian salars. Data 1260 from this study and Hoke et al., 1994; Spiro et al., 1997; Risacher et al., 2003, 2011; Risacher and Fritz, 1261 1991, 2009. ul: ulexite; hal: halite; gyps: gypsum; mirab: mirabilite. *Previous data TDS: Total Dissolved 1262 Solids 1263 1264
Laguna Pastos Grandes Chilean salars Bolivian salars Location Bolivian Altiplano Western Cordillera Bolivian Altiplano
Basement Dacite-Andesite- Rhyolitic Ignimbrite
Rhyolitic ignimbrite Andesite
Andesite Rhyodacite
Altitude 4450 m 3400-4300 m 4100-4600 m Surface 130 km2 0.03-400 km2 0.03-500 km2 Potential evaporation 1400 mm/year 1000-2000 mm/year 1000-1500 mm/year Precipitation 100 mm/year 40-380 mm/year 50-150 mm/year Mean temperature 5 °C 0 °C 5-10 °C Morphology Playa lake Mainly playa lakes Mainly playa lakes Salinity 256 g/l 1.2-365 g/l 0.4-348 g/l Brine type (Na-Cl-) Ca 65% SO4 – 24% Ca 52% SO4 – 26% CO3 – 19% Ca Salts Calcite-gyps.-ul.-hal. Gyps.-hal.-mirab.-ul. Gyps.-hal.-mirab.-ul. Infiltration rate ~negligible 0.01-12.8% of outflow 0.01% - ~inflows Thermal influence (T>15°C) Yes 78 % 60% Spring Tmax 47 °C (20-75 °C*) 83 °C (Puchuldiza) 36 °C (Challviri) Spring TDS (range) 14 g/l 3.8 g/l in average (0.2-21.8) 0.82 g/l in average (max. 14) Mantle influence 47% 69% 44% CO2 isotopic composition -11‰ -8 to -0.6‰ -20 to -6‰
1265 1266