Embed Size (px)
Citation preview
The Origins of Innovation: An Analysis of the Finnish Innovation Database
Bernd Ebersberger*, Keld Laursen**, Jani Saarinen*** and Ammon Salter****
*ISI, Karlsruhe, Germany, E-mail: [email protected] **DRUID/IVS, Copenhagen Business School, Denmark, E-mail: [email protected]
***VTT, Helsinki, Finland, [email protected] ****Tanaka Business School, Imperial College, London, UK, E-mail:
Preliminary draft, April 26th, 2005; word count, main body: 6956
Abstract: We combine theory and empirical research on the origins of innovation to investigate the determinants of complexity and degrees of novelty in the emergence new innovations. We link up two important dimensions of technological change in both looking at the degree of novelty of the innovation (incremental/radical) and the complexity of the innovation (simple/complex). Using a novel dataset of major Finnish innovations from 1985-1998, we examine the role of technological opportunities, customers, breadth of collaboration with different communities of practice, the breadth of the sources of inspiration for the innovation, and competitive pressures in shaping the emergence of innovations. We find that taking into account both dimensions is imperative to the understanding of the origins of innovations. Keywords: sources of innovation, radical innovation, complex innovation Paper to be presented at the 4th European Meeting on Applied Evolutionary Economics (EMAEE): Geography, Networks and Innovation, Marinus Ruppert building, Utrecht University, De Uithof, Utrecht, The Netherlands, 19-21 May 2005

1. Introduction
The origins of technological innovation in the economic system remain a significant
concern for business, governments and academic researchers. A substantial part of the
recent literature on technological change focuses on the sources and impact of different
types of innovations, including incremental, radical, architectural, modular, simple and
complex types (Tushman and Anderson 1986, Anderson and Tushman 1990, Henderson
and Clark 1990, Tushman and Rosenkopf 1992, Singh 1997). This literature focuses the
effect of the introduction of different types of innovation and the competitive situation
within industries and whether or not the innovation was a commercial success (Gatignon
et al. 2002). Although we have learned a lot about the sources of innovation in general
(Schmookler 1966, Rothwell et al. 1974, Rosenberg 1976, Mowery and Rosenberg 1979,
Pavitt 1984, von Hippel 1988, Klevorick et al. 1995, Palmberg 2004), the origins of
different types of innovations are insufficiently understood. Even though there is
awareness that the origins of an innovation may affect the degree of novelty in the
innovation (see for instance, Ahuja and Lampert 2001, Rosenkopf and Nerkar 2001) and
that innovations differ in their complexity (see for instance, Tushman and Rosenkopf
1992, Singh 1997), there are to our knowledge no studies that combine the radicalness
and complexity of innovations in attempts to understand the origins of new innovations.
In other words, the link between the degree and complexity of innovation on the one
hand, and the sources and determinants on the other, is a missing link in the study of
innovation.
In this paper, we attempt to overcome this shortcoming in the literature, by combining the
two dimensions of technological innovation – that is incremental/radical and
simple/complex – to create a taxonomy of innovations where the origins of the
innovations may differ according to where the particular innovation fit in the taxonomy.
We contrast the sources of radical/simple, radical/complex, incremental/simple and
incremental/complex innovations, exploring the factors that influence the emergence of
these innovations (see Figure 1 for a depiction of the proposed taxonomy of innovations).
In particular, we are interested exploring the sources, mechanisms and collaboration that
give rise to each of the different types of innovation. In doing so, we are able to assist in
1

Degree of novelty Increment
Simple
Degree of complexity
Complex
Figure 1: Degree of novelty and variety of kn
filling the missing link in the literature and
nature of innovation. Applying a unique da
from a range of services, manufacturing and
multinomial logit model as the means of estim
differ indeed, according to where each i
taxonomy.
2. Empirical and theoretical background
Innovations can be classified according to m
used distinction in innovation studies is the
innovation (see for instance, Mansfield 196
Gatignon et al. (2002), incremental innovatio
improve price/performance at a rate consisten
while radical innovations “advance the price/
existing rate of progress.” However – as poi
this distinction may fail to account for impo
that innovation may be more or less syste
incremental or radical. As such there is strong
2
al Radical
owledge bases in innovation
to develop new theory and evidence on the
tabase on 540 Finnish innovations, drawn
construction industries, and while using a
ation, we find that the origins of innovation
nnovation is situated in our two-by-two
any different dimensions. Perhaps the most
distinction between incremental and radical
8, Freeman and Soete 1997). According to
ns can be defined as “those innovations that
t with the current technological trajectory”,
performance frontier by much more than the
nted out by Henderson and Clark (1990) –
rtant aspects of technological change, given
mic no matter whether the innovation is
evidence that there are numerous technical

innovations that involve moderate changes in technology, but have dramatic competitive
consequences (Clark 1987).
Simon (1969: 86) defines a complex system in general terms as “one made up of a large
number of parts that interact in nonsimple way.” Accordingly, complexity concerns both
the number of the parts involved in the system and the nature of the interconnections
among those parts. Merges and Nelson (1990) make the distinction between discrete and
complex technologies in the context of the appropriation of the returns from innovation.
In the context of socio-political effects of innovation, Tushman and Rosenkopf (1992)
develop a typology of products ranging from simple to complex. These are: (a) non-
assembled products, (b) simple assembled products, (c) closed systems, and (d) open
systems. Accordingly, the authors examine the nature and determinants of the product
technologies for each of the four categories. Building on Tushman and Rosenkopf (1992),
Soh and Roberts (2003) define complex technologies to be “technological systems
involving a large number of inter-related subsystems arranged in a hierarchical order”.
Hence, modularity can be seen to be one way to manage complexity by grouping
elements into a smaller number of subsystems (Simon 1969, Langlois 2002).
The degree of complexity encompasses two dimensions of complexity: artefactual
complexity and development complexity. Artefactual complexity refers to the degree of
complexity of the final product and developmental complexity refers to the degree of
complexity involved in design and production of the product. Artefactually complex
products involve systems of modules and components that need to be integrated in order
to allow the product to be functional. Developmentally complex products require
extensive design and production processes in order to be produced, but they may
themselves be relatively simple artefactually products. For example, pharmaceutical
products, such as aspirin, are artefactually simple, but developmentally complex and
capital goods, such as an electricity network, are simple to construct but complex to
integrate. In our study innovations have to have at least medium artefactual complexity
and high developmental complexity in order to be deemed “complex” rather than
“simple”.
3

However, it should be underscored that while this paper is concerned with different types
of innovation in terms of the origins of different types of innovation, it is not concerned
with the consequences of innovation – radical or complex.
3. Hypotheses
Generally speaking, we suggest that radical innovation is driven by technological
opportunities and inputs from single or few sources of knowledge, including universities
and users. In contrast complex, innovations, involving many sub-systems, are conjectured
to be driven by collaboration with suppliers and users that may possess key knowledge
inputs with respect to each of the subsystems. Below, we discuss the origins of
innovations for the four types of innovation with respect to environmental factors,
collaboration, and R&D intensity in turn.
Environmental factors
Technological opportunities comprise the set of possibilities for technological advance
and may be measured as the returns to R&D, given demand conditions, the current level
of technology, and the appropriability regime (Klevorick et al. 1995: 188). As resources
are devoted to R&D and projects are completed, the pool of opportunities can be
depleted. However, the pool of opportunities are refilled through the sources of
opportunity, including the advance of scientific understanding; technological advance
originating outside of the industry; and through new possibilities opened up by feedbacks
resulting from current innovations (ibid, 1995: 189). Accordingly, whenever the pool of
opportunities is replenished it is implied that a period of incremental change is replaced
by a period of ferment – a period in which radical innovations materialize (Tushman and
Anderson 1986), possibly to the extent that a new technological paradigm emerge (Dosi
1982). The theory of recombinant invention (Utterback 1994, Fleming 2001) provides
another related argument for why new technological opportunities may lead to radical
innovations. According to this theory, inventors’ experimentation with the combination
of new components and new configurations of previously combined components leads to
less technological success on average, but increases the variability that can lead to
4

technological breakthroughs associated with radical innovation (Fleming 2001). However
as technologies mature, the likelihood that high-utility combinations of the technology’s
elements have not been tried or exploited already must eventually decline (Ahuja and
Lampert 2001). As a result, new technological opportunities offer the possibility of
radical combinations and re-combinations. However, not only do new technological
opportunities open up the search space to radical innovations, new technological
opportunities may also allow innovations of an architectural kind (Henderson and Clark
1990). In other words new technological opportunities may allow technologies that
hitherto were separate to be combined in a complex fashion. In sum, we conjecture:
H1a New technological opportunities advance radical and complex innovations
In many cases advances in basic scientific research has led to radical innovations – in
particular in science-based industries (Nelson 1959, Levin et al. 1987, Klevorick et al.
1995). Although basic scientific research may eventually lead to a technological
breakthrough, it is fundamentally uncertain when and where the results of basic research
may be applied (Nelson 1959, Pavitt 1993). In the words of Nelson (1959): “Moving
from the applied-science end of the spectrum to the basic-science end, the degree of
uncertainty about the result of specific research projects increases, and the goals become
less clearly defined and less closely tied to the solution of a specific practical problem or
the creation of a practical object.” Accordingly, the reason why basic science has often
led to radical breakthroughs can be related to the fact that basic research address
fundamental questions that are not necessarily constrained by the solution to a practical
problem, and moreover, that the results of the research are fully and freely disseminated
to a large community, so that the sources of new ideas are numerous and diverse. In sum,
we hypothesize:
H1b Scientific breakthroughs foster radical innovations
The behavioral theory of the firm (Cyert and March 1963) argues that one of the types of
search firms undertake is “problemistic search” (i.e. search triggered by a problem). Such
5

search is triggered when managers find that organizational performance is below their
aspiration level. Accordingly, if an organization is under competitive pressure (for
instance through pressure from price competition or rival innovation) it may increase its
search for innovation when decision makers judge that upgrading their technology and
product portfolio can solve the performance problems. For instance, firms with soaring
profits may enter R&D races to restore profitability (Kamien and Schwarz 1982,
Antonelli 1989). Greve (2003: 689) goes on to suggest that performance below aspiration
level not only makes managers search for solutions, but also makes them more likely to
accept risky solutions. The proposition that managers become less risk-adverse when
under strain also finds empirical support (see e.g., Bolton 1993, Greve 1998).
Accordingly, since risk aversion is likely to fall when the organization is under
competitive pressure and since greater uncertainties are involved when undertaking
radical innovation, given that such an innovation process typically involves the lack of
knowledge about the precise cost and outcomes of different alternatives in addition to a
lack of knowledge of what the alternatives are (Nelson and Winter 1982, Freeman and
Soete 1997), we expect that firms will attempt to engage in more radical innovation
projects, when they are under competitive pressure. In sum, we submit the following:
H1c Competitive pressure from the external environment fosters radical innovation
Collaboration
Early in the life of a radical technology there is generally a lot of technological and
market uncertainty that needs to be resolved (Utterback and Abernathy 1975, Nelson and
Winter 1982, Afuah 2004). Accordingly, the resolution of these uncertainties often
requires new knowledge from lead users (Urban and von Hippel 1988, von Hippel 1988).
Such lead users are sophisticated users that perceive the particular needs before other,
otherwise similar users, and such lead users may therefore benefit earlier from successful
upstream radical innovations when compared to the average users in the market.
As argued by Singh (1997), the fundamental challenge that firms face in commercializing
complex technologies is developing the multiple competencies required. Although some
6

complex technologies draw on similar knowledge bases, most complex technologies
require the orchestration of components building on different knowledge bases (Patel and
Pavitt 1997, Brusoni et al. 2001). Most firms have, however, only a limited ability to
develop a broad set of competencies, since organizations must develop routines
specialized to each technology (Richardson 1972, Nelson and Winter 1982). Since
complex technologies entail many different subsystems, components and interfaces, often
involving many different knowledge bases, organizations engaged in complex
technologies, must also comprise of many differently organized, but closely integrated
subunits (Burns and Stalker 1961). Accordingly, if the complex innovation is designed
and created in-house in its totality, the resulting organization will be (too)
organizationally complex.
Given that pure market exchange will not allow close enough coupling of the
interdependent components and subsystems, a possible solution to these problems is to
collaborate with suppliers and users of components in order to facilitate information
exchange, mutual learning and other interdependent activities. In other words, such
collaboration can facilitate complex coordination beyond what the price system can
accomplish, while avoiding the dysfunctional properties sometimes associated with
hierarchy (Teece 1992, Singh 1997). In the case of a modular complex system,
organizations may often need to collaborate closely with suppliers and users in order to
specify the relevant interfaces that make the modules interact within the overall
architecture (Brusoni et al. 2001). In sum, we conjecture:
H2a Collaboration with lead users increases the radicalness and complexity of an
innovation
H2b Collaboration with suppliers increases the complexity of an innovation.
Above we argued that scientific breakthroughs can sometimes lead to radical innovations.
However, while private firms invest in basic research (Rosenberg 1990), they are unlikely
to do so to a substantial extent because of private firms’ inability to appropriate the
returns from such investment (Nelson 1959, Pavitt 1993). Accordingly, most basic
7
research is undertaken within universities (Geuna 2001, Pavitt 2001). However, scientific
breakthroughs need to be translated into industrial practice in order to be able to affect
innovations. One mechanism for translating scientific breakthroughs into industrial
practice is for firms to collaborate with universities (Tether 2002). Accordingly, we
hypothesize:
H2c Collaboration with universities fosters the radicalness of an innovation
Rosenkopf and Nerkar (2001) argue that the gains associated with the internal
development of technology are not sustained unless the organization is able to integrate
external developments and that boundary-spanning technological exploration across
organizations affects subsequent technological evolution more than non-boundary
spanning technological exploration. One reason for this can be that “do-it-alone”
organizations may tend to conduct search in a myopic fashion that in turn leads to
competence traps (Levinthal and March 1993). Collaboration can also be seen to be a
way of increasing the variety of inputs of new knowledge needed to produce more radical
and complex innovation. In the words of David Teece: “It is well recognized that the
variety of assets and competencies which need to be accessed is likely to be quite large,
even for modestly complex technologies. To produce a personal computer, for instance, a
company needs access to expertise in semiconductor technology, display technology, disk
drive technology, networking technology, keyboard technology, and several others. No
company can keep pace in all these areas itself.” (1986: 293). Along similar lines
Tushman and Rosenkopf (1992) argue that the more complex the product, the greater the
uncertainties and thus the greater the incentive for firms to share the uncertainties by
engaging in inter-organizational relationships, including collaboration. More
internationally dispersed sources of knowledge may also enhance the technological
opportunity set of innovators (Cantwell and Janne 1999), thus resulting in more radical
and complex innovations, especially in the small country case (as in our case), where the
local technological opportunity set may be limited. In sum, we infer:
H3a No collaboration fosters simple and incremental innovation
8

H3b The degree of national collaboration fosters simple and incremental
innovation
H3c The degree of international collaboration fosters complex and radical
innovations
Level of R&D
The level of R&D is partially endogenous, since it is in part a function of the
technological opportunities and the appropriability conditions facing the firm in industry
in which the firm operate (Klevorick et al. 1995, Breschi et al. 2000). Nevertheless, some
degree of managerial choice is left when it comes to the amount of resources each firm
devote to innovative search in the form of R&D. Incremental innovation often emerge in
conjunction with ordinary production activities (Freeman and Soete 1997), and although
innovation activities are never costless it is reasonable to conjecture that search for
radical innovation involves much larger and devoted projects, involving substantially
larger investments in R&D. In addition, innovations which are both artefactually and
developmentally complex, while involving a number of interfaces and subsystems are
likely to require substantial investment in R&D. Accordingly, we posit:
H4 The level of R&D is associated with radical and complex innovations
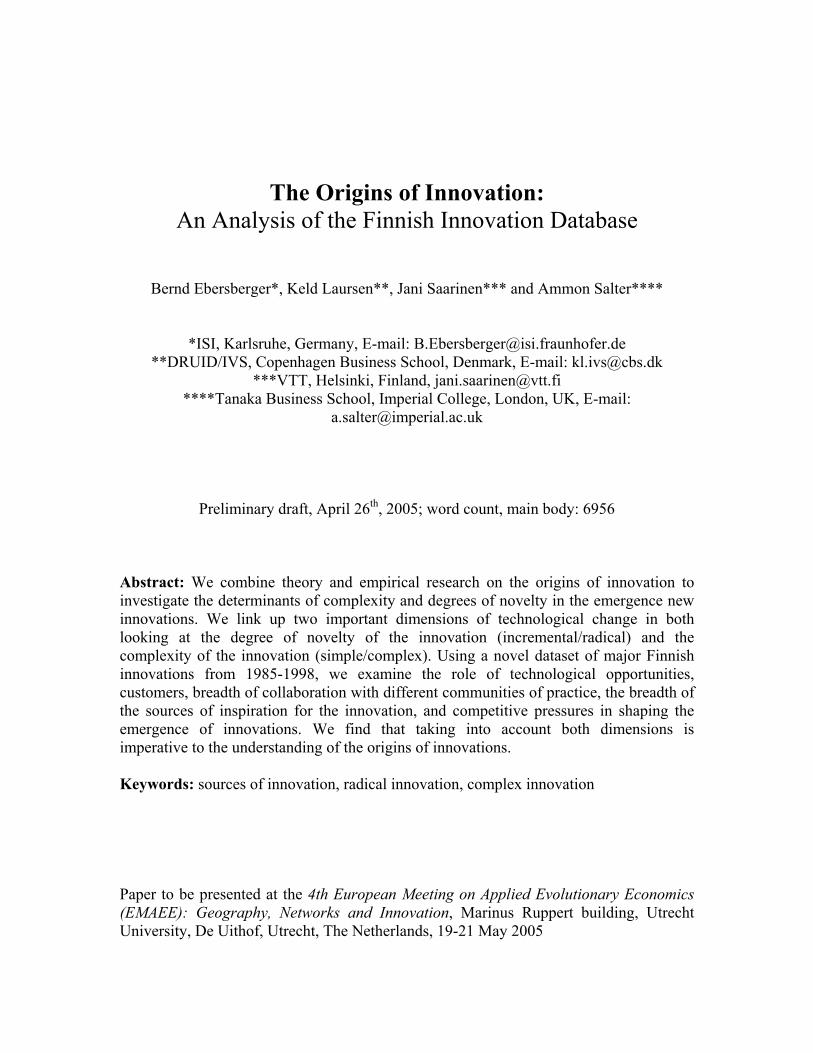
In Figure 2, we have summarized our hypotheses for each of the drivers of the four
innovation types, with the upper left corner (incremental/simple) as the benchmark.
4. The Finnish Innovation Database
In 1991, Finland experienced a major economic transformation through the collapse of its
markets in the former USSR. Since the crisis, Finland’s economy has grown
tremendously, spurred on by the growth of mobile phone industry and other high
technology industries. For example, Finland’s share of R&D as a percentage of GDP rose
from 2.0% in 1990 to 3.5% in 2003. In context of these major economic changes, the
Finnish Innovation Database (Sfinno) was created by Technical Research Centre of
9
Degree of novelty
Incremental Radical A B
H1a (+) H3a (-) H1b (+) H3b (-) Simple H1c (+) H3c (+) H2a (+) H4 (+) H2c (+)
HHHH F Fi
A
de
cr
du
T
O
de
th
si
in
T
su
co
Degree of complexity
C D H1a (+) H3c (+) H1a (+) H2c (+) Complex H2a (+) H4 (+) H1b (+) H3a (-)
H1c (+) H3b (-) H2b (+) H2a (+) H3c (+) H3a (-) H2b (+) H4 (+) H3b (-)
1a: Technological opportunities; H1b: Scientific breakthroughs; H1c: Competitive pressures. 2a: Collaboration/lead users; H2b: Collaboration/suppliers; H2c: Collaboration/universities. 3a: No collaboration; H3b: Collaboration breadth/national; H2c: Collaboration breadth/international. 4: R&D level.
igure 2: Overview of the proposed framework and hypotheses
nland (VTT) with financial support of Tekes (the Finnish National Technology
gency). The database was designed to capture major technological innovations
veloped by Finnish industry during the 1980s and 1990s. The aim underlying the
eation of the database was to identify the sources and types of innovation of Finland
ring a period of significant economic transition.
he definition of an innovation used in the creation of the database was derived from the
rganisation of Economic Development and Co-operation’s Oslo Manual (1992). The
finition of innovation in the study “was an invention that has been commercialized on
e market by a business firm and these innovations needed to be technologically new or
gnificantly enhanced product compared with the firm’s previous products”. Only
novations that were commercialized by Finnish firms are included in the dataset.
he Sfinno database draws on two research tools – a list of innovations and a postal
rvey of innovators. For the first element, a list of innovations was compiled using a
mbination of three methods: 1) expert opinion, 2) reviews of trade and technical
10

journals, and 3) interviews and validation with large firms. Of these three methods, expert
opinion and literature-based reviews have been used in the creation of many other
innovation databases (see for instance, Rothwell et al. 1974, von Hippel 1988, Pavitt et
al. 1989, Kogut and Zander 1992, Acs et al. 1994). The first stage in the development of
the innovation database was the creation of technical experts’ lists of major Finnish
innovations. 150 experts representing different industrial and technological fields from
industry, the Technical Research Centre of Finland (VTT), Tekes and the leading Finnish
universities of technology were asked to list the significant innovations developed in
Finland from 1985 to 1998. In total, these technical experts identified 285 innovations.
However, given that the technical experts were unable to identify the year of
commercialization of innovation and describe origins of the innovations; additional
methods were required to capture the number and sources of innovation in Finland.
The second stage in the creation of the innovation database was a literature review of the
Finnish technical press. First, a population of journals that were eligible for innovation
detection was defined. Journals were considered eligible as far as they were edited,
independent and were published regularly; i.e. mere product listings or announcements,
irregular publications or journals directly controlled by companies were not considered
eligible. This approach resulted in a population of 60 trade or technical journals. In the
next phase, all such journals were selected that regularly published edited and non-paid
material about innovations. In total, 18 Finnish technical journals fulfilled this criterion.
The VTT team read over these journals for years of the study (scanning close to 300,000
pages of technical material). They searched these journals for articles describing on the
introduction of new products. The VTT team was careful to avoid technical articles that
simply listed of new products. The technical journal review resulted in the identification
of 1144 innovations. In addition, lists of award-winning innovations in the literature were
also included.
Alongside the expert lists and technical journals, and due to the importance of a small
number of large firms in the Finnish economy, the VTT team conducted a case-by-case
analysis of the innovations of the twenty-two largest Finnish firms. The team was
11

concerned that the expert lists and journal reviews would not fully cover the activities of
these firms. The selection of firms was made on the basis of their R&D spending and
patenting. A list of the innovations for each firm was produced from the existing database
and these lists were then sent to the firm for validation. The firms were asked to pick out
those products that they considered especially important and innovative to their firm. In
this way, a group of 200 innovations were identified. In addition, a group of 226
innovations was identified other Finnish sources, such as government reports and
background technical documents, by the VTT team.
Once the combined innovation database was created, the VTT team then compared
results of the different classification methods. The results of these exercises confirmed
that larger shares of innovations from smaller firms were identified by the literature
review than by the technical experts’ lists. However, the technical experts did not appear
to have a bias in favor of innovations from large firms. Moreover, the share of
innovations that were identified from more than one source is relatively small, indicating
that the combination of different methodologies has indeed enhanced the coverage of the
database (Pentikäinen et al. 2002). Another problem addressed by the VTT team was
double counting of innovations. In order to avoid this, each innovation was checked for
duplicates before they were added to the database. Almost 200 duplicate innovations
were identified and removed from the database. In total and the basis of the three
methods, 1678 innovations were identified.
Once the list of innovation was finalized, supplementary data on the innovations and
firms who were responsible for these innovations was collected by using Finnish business
register and patent databases at Statistics Finland. The basic data on the innovation
includes: its name, a brief technical description of the innovation, its year of
commercialization, its NACE industrial field and its patent technological class (ICP).
Firm-level information included the firm official identification code, its name and
address, industrial sector, number of employees, sales, number of patents and year of
entry in the business register. In total, there were 1049 Finnish firms who had at least one
innovation over the period of the study.
12

The second stage of the research involved a postal survey of the individuals who
responsible for each innovation. Owing to various practicalities related to the extensive
time period covered and organizational changes among the firms, a significant amount of
preparatory work was required before mailing the questionnaires. Where the name of the
individual was available, the questionnaire was addressed directly to them. Where the
name of the individual was not available, the questionnaire was addressed to the Chief
Executive Officer or R&D Director and they were asked to forward the survey to the
person responsible for that innovation.
The questionnaire itself was developed through interviews and reviews of the previous
literature on innovation. Questions were pre-tested with technical experts within VTT and
piloted with range of Finnish companies. From pilot, several significant changes were
made to the questionnaire, including removal sensitive and poor responded questions and
improve phrasing and language. The postal survey was implemented in 1998. 1074
questionnaires were posted and 729 responses were returned, providing a response rate of
67 per cent. The firms were contacted five times in order to ensure a high response rate.
The completed questionnaires were also checked for internal inconsistency and non-
responses. Where there were non-responses or inconsistencies in responses, the VTT
team contacted the respondent to capture the missing information.
The Sfinno Innovation database includes only major product, process and service
innovations and, as Kogut and Zander (1992) suggest, these types of innovations are
easier to track than minor innovations. Appendix X lists a sample of innovations from the
Sfinno database. Major innovations include “Sauna-Stu - insulation material for new and
renovated saunas” developed by Spu Systems in 1997, “Monospace: an elevator without
machine room” developed by Kone in 1995, and “Mowjli – mobile office workstation
using GSM links” developed by Nokia in 1997.
Although the Sfinno database includes innovations in “production methods” and
“commercialization of new service concepts”, we focus on major product innovations and
13

our sample includes 540 innovations, drawn from a range of services, manufacturing and
construction industries. Product innovations included innovations that involved the
“commercialization of the core technology of the firm” and the “development and
integration of components and modules”. Each innovation was also classified by degree
of novelty from totally new, major improvement and incremental improvement and
whether the product was new to the Finnish or global market.
Alongside the classification by novelty, innovators were asked to indicate the degree of
complexity of the innovation in terms of artefactual and developmental complexity. The
innovators could classify their innovations into four different complexity categories: 1)
low artefactual complexity/ low developmental complexity (i.e. innovation is a simple
unit); 2) medium artefactual complexity/ low developmental complexity (i.e. innovation
is a unit and development is based on knowledge base from one discipline; examples
include: electronic wheel chair, drill); 3) medium artefactual complexity/high
developmental complexity (innovation is a unit and development is based on knowledge
base from several disciplines. Examples include: pharmaceuticals, software, generators);
and 4) High artefactual complexity/ high developmental complexity (innovation is a
system consisting of several functional parts and development is based on several
different disciplines; examples include: paper machine, mobile phone network, cruise
ship). We combine category 3 and category 4 to be complex and 1 and 2 to be simple. In
other words, in our study, innovations have to have at least medium artefactual
complexity and high developmental complexity in order to be deemed “complex” rather
than “simple”.
Measures
Dependent Variable. Based on the discussion above we classify each innovation by a 4-
variate composite variable from the indicator of novelty and complexity. The analysis
revolves around the explanation of this variable. Table 1 displays the categories and the
number of observations for each category. From the table it can be seen that the single
largest group of innovations are of the radical/complex type. Here it has to be kept in
mind that although some innovations have been classified as being of the incremental and
14
complex (type A), they still have to be “major technological innovations”. Accordingly,
many small Finnish incremental and simple innovations have been excluded from the
database. The focus here is on significant innovations, as in the case of the classical
“Project SAPPHO” innovation study (Rothwell et al. 1974). Table 2 breaks down the
innovation types on the sectors from where they stem. From the table it can seen that
incremental and simple innovations (type A) tend to dominate low tech sectors such as
food & textiles; wood, furniture, pulp & paper; and metal products, but this innovation
type is also dominant within medium tech industries such as machinery and transport
equipment. At the other extreme, radical/complex innovations (type D) are unsurprisingly
dominant within chemicals; electronics; construction and utilities; and within business
services. Innovations stemming from the computer related service industry tend to be
more of the incremental, but complex type (type C).
[Table 1 and 2, just about here]
Independent Variables. The independent variables in the analysis refer to two different
levels of observations. Project level variables characterize the innovation project
eventually generating the innovation. Firm level characteristics identify certain features
deemed essential for innovation on the level of the innovating organization.
Firm specific characteristics. The innovating firm is characterized by its size (size)
measured by the number of employees and its R&D intensity (rdint) measured by the
fraction of sales spent on R&D prior to introducing the innovation. The major area of the
firm’s activities is captured by ten industry dummies. Additionally we use a time dummy
indicating the after-crisis innovation to capture changes in the macro economic
environment firms operate after the crisis of the early 1990s.
Project specific characteristics. Include variables about the factors that inspired the
innovation, information about the collaboration relationships during the innovation
project and other project related information. Among the factors inspiring the innovation
project we differentiate between technological opportunities (stech), technological
15

breakthrough (sbreak), increasing price competition (scomp) and market opportunities
(smarket). The collaboration relationships during the innovation project are characterized
by variables indicating certain collaboration partners such as customers (cocus), suppliers
(cosup), universities (couni) and competitors (cocom). Where our indicator does not only
refer to collaboration but also requires relevant contributions of the collaboration partner
as perceived by the manager of the innovation project. In addition to the specific
collaboration partners we characterize the breadth of the national and the international
collaboration network during the project (codomdiv and cointdiv).1
Table 3 characterizes the innovation types A to D and the complete sample based on the
firm level and project level characteristics. From the table it can be seen that firms
producing radical and complex innovations (type D) tend to have the highest R&D
intensity as the mean is 22 per cent. Moreover, innovations of type D also tend to be
more based on new technological opportunities, scientific breakthroughs and diverse,
international collaboration, when compared to the other types of innovation.
Collaboration with suppliers appears to be associated more with incremental and simple
innovations (type A) than with other types of innovations from a descriptive point of
view.
[Table 3, just about here]
Multivariate analysis
Means of estimation
We apply a multinomial logit model as the means of estimation to assess the importance
of the different kinds of origins of innovation for each of the innovation types with
incremental/simple innovations (A) as the benchmark and we report results for the
determinants of innovation for the three other categories of innovation types -
radical/simple (B); incremental/complex (C); and radical/complex (D). We estimate the
1 We use an entropy index to construct a measure of diversity for the national and international
collaboration network of the project.
16

model for 540 innovations. We use both project specific and firm specific exogenous
variables.
Presentation of the results
Table 4 reports the results of the multinomial logit regression, where the
incremental/simple (A) innovations represent the base category. The Hausman test in
Table 5 indicates that we cannot reject the independence of irrelevant alternatives.
[Table 4, just about here]
We visualize the results of the analysis by means of odds ratio plots. Generally, odds
ratio plots facilitate the discussion of the results of multinomial regression model (Long
1997, Chapter 6). Figure 3 to 6 contain the odds ratio plots for the regression. In a rather
intuitive way, odds ratio plots capture all the information also contained in Table XX3.
Each row in the plot represents an independent variable. The plotted letters A-D indicate
the category of the innovation. The bottom scale indicates the estimated coefficient βk,m|n,
where k is the independent variable, n is the base category and m is the category under
investigation. The top scale indicates the factor change coefficient exp(βk,m|n,⋅δ), with δ
being 1 for dummy variables k and std(xk) for continuous variables xk. It gives the change
in the odds of the dependent variable being m rather than n if xk changes by δ. In addition
to the information about the size of the coefficients and the odds ratio change the plots
also convey information about the significance. A connecting line indicates that the
parameter estimates are not significant on the 10% level. Vertical spacing in the graph
does not carry any meaning. It only makes the connecting lines more visible. Take for
example the size of the commercializing firm captured by lsize in Figure 3. With the size
of the commercializing company the odds to create a incremental/simple innovation (A)
increases relative to generating an simple and radical innovation (B). Increasing size also
means that the odds of incremental/complex innovations (C) increase relative to the odds
of type A or type B innovations. There is no significant effect on the odds between type
17

D and type A or type C innovations, though. However, increasing size of the company
improves the odds of generating a type D innovation relative to type B.
[Figure 3, just about here]
Results
With respect to Hypothesis 1a (“New technological opportunities advance radical and
complex innovations”), Ahuja and Lampert (2001) show that a firm’s creation of
breakthrough inventions is positively related – up to a certain level – to its exploitation of
new technological opportunities. Our results show that new technological opportunities
(stech in Figure 4) increase the odds of radical/complex innovations (D) relative to the
odds of incremental/simple innovations (A) or incremental/complex innovations (C). On
these grounds H1a attains partial support only: We find evidence that among complex
innovations new technological opportunities foster radical innovations. However, new
technological opportunities do not do so among simple innovations. Additionally, new
technological opportunities increase the odds to improve in both dimensions
simultaneously, i.e. to generate a complex and radical innovation rather than a simple and
incremental innovation.
[Figure 4, just about here]
With respect to H1b (“Scientific breakthroughs foster radical innovations”), involving
scientific breakthroughs as a driving force for the innovation project as captured by
sbreak in Figure 5 increases the odds for a radical innovation relative to the odds of an
incremental/complex innovation, regardless of the complexity of the radical innovation.
The odds ratios in the complexity dimension are unaffected by scientific breakthroughs as
a point of departure for the innovation project. The odds of incremental/simple to the
odds of all other types of innovations are not influenced by scientific breakthroughs.
18
Hypothesis 1c states that competitive pressure from the external environment increases
radical innovation (“Competitive pressure from the external environment fosters radical
innovation”). However, competitive pressures in terms of pressure from rivals’
innovation success or increased price competition increase the likelihood of incremental
innovations relative to radial innovations, regardless of the complexity. The complexity
of an innovation is unaffected by the competitive pressures igniting the commencement
of the innovation project. Based on our analysis, hypothesis H1c cannot be confirmed —
in fact, our evidence suggests the opposite. Yet, firms experiencing rival innovations or
increased price competition from competitors have incentives to change their internal
routines and hence set free some innovation potential previously buried by risk aversion
or everyday business practices. However, the selection of a strategy to fight the
immediate threat to companies’ sustained profits is not random and incentives are not the
only drivers of radical innovation. Substantial resources are required too – resources that
may not be available to firms under external pressure. Cost efficiency considerations and
previous commitment to certain types of products, processes or business practices will
induce companies not to change to radically. Accordingly, to fight the immediate assault
towards the company’s profits, companies may typically not be able to conduct large
scale systematic R&D to develop radical innovations. Rather, it seems that companies
search for the easy way out of the competitive challenge by starting to innovate
incrementally.
In other words, when under competitive pressure, firms appear to focus on updating
exiting products in an incremental way based on the exploitation of existing ideas, rather
than focusing on the exploration associated with radical innovation (March 1991), when
such innovation may require long-term commitments in order to become successful.
Accordingly, our findings are consistent with the view that competitive pressures may
substantially reduce or remove the organizational slack of firms (Cyert and March 1963),
and that organizational slack may be needed to produce radical innovations, since such
slack may allow for more wide innovative search (Knight 1967, Özcan 2005).
19

Regarding Hypothesis 2a (“Collaboration with lead users increases the radicalness and
complexity of an innovation”) we find that collaboration with lead users during the
innovation project increases the odds of radical innovation among the complex
innovations (see Figure 5). The odds for innovations of type D relative to the odds for
innovations of type C increase with customer collaboration. At the same time customer
collaboration decreases the likelihood to generate a complex innovation among the
incremental innovations: the odds of type C innovations fall relative to the odds of type A
innovations. Hence, we find only support for the hypothesis among he complex
innovations. So for this type of innovations your findings are in line with the findings of
Fritsch and Lukas (2001) and Tether (2002), who find that radical innovators tend to
collaborate more with costumers on innovative activities. However, we find the opposite
of what H2a suggests among the incremental innovations. We find no support for
Hypothesis 2b (“Collaboration with suppliers increases the complexity of an innovation”)
as in our analysis the collaboration with suppliers (cosup) does not significantly change
the odds of any type of innovation.
In Table 4 we observe that our sample supports Hypothesis 2c (“Collaboration with
universities fosters the radicalness of an innovation”) as the odds of radial innovations
increase relative to the odds incremental and simple innovations (type A). At the level of
complex innovations we find no evidence for the influence of university collaboration on
the radicalness of innovations (type C vs. type D). In addition, we find that collaboration
with universities fosters complex innovations (type B) among the incremental
innovations (type A). Put it simply, university collaboration reduce the odds of
incremental and simple innovation relative to all other innovations. This findings is at
odds with Tether (2002), who finds that more radical innovators do not collaborate more
with universities than other innovators do.
[Figure 5, just about here]
20
Figure 6 shows that innovation projects which involve no collaboration at all (cono),
increase the likelihood of generating incremental innovations relative to radical
innovations. The complexity dimension is not affected by the absence of collaboration.
Accordingly, Hypothesis H3a (“No collaboration fosters simple and incremental
innovation”) is only partly supported by our findings. Nevertheless, our findings are
consistent the findings of Fritsch and Lukas (2001) and Tether (2002), who find that
radical innovators tend to collaborate more on innovation than other firms and with the
results obtained by Rosenkopf and Nerkar (2001), affirming that exploration within firm
boundaries has less impact on subsequent technological evolution as measured by
subsequent patent citations. One possible interpretation for this result is that patents that
are quoted by future patents tend to reflect more radical inventions when compared to
less quoted patents. Hypothesis 3b asserts that the degree of national collaboration
promotes simple and incremental innovation (“No collaboration fosters simple and
incremental innovation”). However, the degree of national collaboration, as captured by
the diversity of the domestic collaboration network (codomdiv), has no significant effect
on the odds ratios of the innovations. The only exception is that the degree of national
collaborations reduces the odds of radical innovation among the complex innovations.
Concerning Hypothesis 3c (“The degree of international collaboration fosters radical and
complex radical innovations”), we find that the degree of international collaboration,
captured here by the diversity of the international collaboration network within the
innovation project (cointdiv), has a positive influence on the likelihood of radical and, at
the same time, complex innovations. All other types of innovations are rather unaffected
by the breadth of the international collaboration.
[Figure 6, just about here]
Hypothesis 4 contends that the level of R&D is associated with radical and complex
innovations (“The level of R&D is associated with radical and complex innovations”). In
Figure 3 the level of R&D (rdint), scaled by the sales of the innovating firm, improves
the odds of complex innovations relative to the odds of simple innovations. This holds
21
true for both incremental and radical innovations. Accordingly, our data does not confirm
that the level of R&D influences the odds of radical innovations relative to incremental
innovations. Hence, our analysis can only partly support hypothesis H4.
5. Conclusion
In this paper we have suggested that the origins of innovation are different according to
the type of innovation identified in our taxonomy (simple/incremental; simple/radical;
complex/simple; or complex/radical). We found that the origins of innovation do indeed
differ according to the type of innovation, although our theoretical expectations were not
always met. In particular, we found that new technological opportunities and
collaboration with lead users appear to increase the radicalness of complex innovations.
Scientific breakthroughs tend to enhance the radicalness of innovations, regardless of the
level of complexity, while R&D intensity tends to increase the level of complexity,
regardless of the degree of novelty of the innovation. University collaboration tends to
reduce the probability of producing simple and incremental innovations.
With respect to our three “geographical” collaboration variables we found that “no
collaboration” involved in the innovation process tends to decrease the level of
radicalness of the innovation, while for national collaboration, such collaboration tends to
lower the odds of radical innovation among complex innovations, and finally, the degree
of international innovation enhances the probability of bringing about a radical
innovation which is at the same time complex. Accordingly, the overall picture is (with
some qualifications) that the (geographical) width of collaboration tends to enhance the
radicalness and complexity of innovations. Collaboration with suppliers was found to
have neither an effect on the degree of complexity nor on the degree of novelty of the
innovation, while competitive pressure had the opposite effect of what we expected from
theory – such pressures appears – as an empirical observation – to reduce the level of
novelty and complexity in innovations.
22

We believe that the subject of the origins of different types of innovation is a fertile field
of research, although the relevant mechanisms are subtle and not easy to trace –
theoretically or empirically. Nevertheless, we see this paper as a first step in trying to
unfold this research agenda.
References
Acs, Z.J., Audretsch, D.B., Feldman, M.P., 1994. R&D spillovers and recipient firm size. Review of Economic and Statistics 76, 336-340.
Afuah, A., 2004. Does a focal firm's technology entry timing depend on the impact of the technology on co-opetitors? Research Policy 33, 1231-1246.
Ahuja, G., Lampert, C.M., 2001. Entrepreneurship in the large corporation: A longitudinal study of how established firms create breakthrough inventions. Strategic Management Journal 22, 521-543.
Anderson, P., Tushman, M.L., 1990. Technological discontinuities and dominant designs: A cyclical model of technological change. Administrative Science Quarterly 35, 604-633.
Antonelli, C., 1989. A Failure-Inducement Model of Research and Development Expenditure - Italian Evidence from the Early 1980s. Journal of Economic Behavior & Organization 12, 159-180.
Bolton, M.K., 1993. Organizational Innovation and Substandard Performance - When Is Necessity the Mother of Innovation. Organization Science 4, 57-75.
Breschi, S., Malerba, F., Orsenigo, L., 2000. Technological Regimes and Schumpeterian Patterns of Innovation. Economic Journal 110, 388-410.
Brusoni, S., Prencipe, A., Pavitt, K.L.R., 2001. Knowledge Specialization and the Boundaries of the Firm: Why Do Firms Know More Than They Make? Administrative Science Quarterly 46, 597-621.
Burns, T., Stalker, G.M., 1961. The Management of Innovation (London: Tavistock). Cantwell, J., Janne, O., 1999. Technological globalisation and innovative centres: the role
of corporate technological leadership and locational hierarchy. Research Policy 28, 119-144.
Clark, K.B., 1987. Managing technology in international competition: The case of product development in response to foreign entry. In: M. Spence and H. Hazard (Eds.). International Competitiveness. Cambridge, Massachusetts: Ballinger, pp. 9-30.
Cyert, R.M., March, J.G., 1963. A Behavioural Theory of The Firm (Englewood Cliffs, N.J.: Prentice-Hall).
Dosi, G., 1982. Technological Paradigms and Technological Trajectories: A Suggested Interpretation of the Determinants and Directions of Technical Change. Research Policy 11, 147-162.
Fleming, L., 2001. Recombinant uncertainty in technological search. Management Science 47, 117-132.
Freeman, C., Soete, L.L.G., 1997. The Economics of Industrial Innovation (London: Pinter).
23
Fritsch, M., Lukas, R., 2001. Who cooperates on R&D? Research Policy 30, 297-312. Gatignon, H., Tushman, M.L., Smith, W., Anderson, P., 2002. A structural Approach to
Assessing Innovation: Construct Development of Innovation Locus, Type, and Characteristics. Management Science 48, 1103-1112.
Geuna, A., 2001. The Changing Rationale for European University Research Funding: Are there Negative Unintended Consequences. Journal of Economic Issues 35, 607-632.
Greve, H.R., 1998. Performance, aspirations, and risky organizational change. Administrative Science Quarterly 43, 58-86.
Greve, H.R., 2003. A behavioral theory of R&D expenditures and innovations: Evidence from shipbuilding. Academy of Management Journal 46, 685-702.
Henderson, R., Clark, K.B., 1990. Architectural innovation: The reconfiguration of existing product technologies and the failure of established firms. Administrative Science Quarterly 35, 9-30.
Kamien, M.I., Schwarz, N.L., 1982. Market Structure and Innovation (Cambridge: Cambridge University Press).
Klevorick, A.K., Levin, R.C., Nelson, R.R., Winter, S.G., 1995. On the sources and significance of interindustry differences in technological opportunities. Research Policy 24, 185-205.
Knight, K.E., 1967. A Descriptive Model of the Intra-firm Innovation Process. Journal of Business 40, 478-496.
Kogut, B., Zander, U., 1992. Knowledge of the Firm, Combinative Capabilities, and the Replication of Technology. Organization Science 3, 383-397.
Langlois, R.N., 2002. Modularity in Technology and Organization. Journal of Economic Behavior and Organization 49, 19-37.
Levin, R., Klevorick, A., Nelson, R.R., Winter, S., 1987. Appropriating the Returns from Industrial Research and Development. Brookings Papers on Economic Activity, 783-820.
Levinthal, D.A., March, J.G., 1993. The myopia of learning. Strategic Management Journal 14, 95-112.
Long, J.S., 1997. Regression Models for Categorical and Limited Dependent Variables, vol. 7 (Thousand Oaks: Sage Publications).
Mansfield, E., 1968. Industrial Research and Technical Innovation (New York: Norton). March, J.G., 1991. Exploration and Exploitation in Organization Learning. Organization
Science 2, 71-87. Merges, R.P., Nelson, R.R., 1990. On the Complex Economics of Patent Scope.
Columbia Law Review 90, 839-916. Mowery, D., Rosenberg, N., 1979. The influence of market demand upon innovation: A
critical review of some recent empirical studies. Research Policy 8, 102-153. Nelson, R.R., 1959. The Simple Economics of Basic Scientific Research. Journal of
Political Economy 67, 297-306. Nelson, R.R., Winter, S., 1982. An Evolutionary Theory of Economic Change
(Cambridge, Massachusetts: Harvard University Press). OECD, 1992. Proposed guidelines for collecting and interpreting technological
innovation data: the 'Oslo Manual', Organisation for Economic Development and Co-operation, Paris.
24
Palmberg, C., 2004. The sources of innovations - looking beyond technological opportunities. Economics of Innovation and New Technology 13, 183-197.
Patel, P., Pavitt, K.L.R., 1997. The technological competencies of the world's largest firms: complex and path dependent, but not much variety. Research Policy 26, 141-156.
Pavitt, K.L.R., 1984. Sectoral Patterns of Technical Change: Towards a Taxonomy and a Theory. Research Policy 13, 343-373.
Pavitt, K.L.R., 1993. What do firms learn from basic research? In: D. Foray and C. Freeman (Eds.). Technology and the Wealth of Nations: the Dynamics of Constructed Advantage. London: Pinter Publishers, pp. 29-40.
Pavitt, K.L.R., 2001. Public policies to support basic research: What can the rest of the world learn from US theory and practice? (And what they should not learn). Industrial and Corporate Change 10, 761-779.
Pavitt, K.L.R., Robson, M., Townsend, J., 1989. Accumulation, Diversification and Organisation of Technological Activities in UK Companies, 1945-83. Management Science 35, 81-99.
Pentikäinen, T., Palmberg, C., Hyvönen, J., Saarinen, J., 2002. Capturing Innovation and Recent Technological Change in Finland Through Micro Data - Elaborating on the Object Approach, VTT, Helsinki.
Richardson, G.B., 1972. The organisation of industry. Economic Journal 82, 883-896. Rosenberg, N., 1976. Perspectives on Technology (Cambridge: Cambridge University
Press). Rosenberg, N., 1990. Why do firms do basic research (with their own money)? Research
Policy 19, 165-174. Rosenkopf, L., Nerkar, A., 2001. Beyond local research: boundary-spanning, exploration,
and impact in the optical disk industry. Strategic Management Journal 22, 287-306. Rothwell, R., Freeman, C., Jervis, P., Robertson, A., Townsend, J., 1974. SAPPHO
Updated -Project SAPPHO Phase 2. Research Policy 3, 258-291. Schmookler, J., 1966. Invention and Economic Growth (Cambridge, Massachusetts and
London: Harvard University Press). Simon, H.A., 1969. The Sciences of the Artificial (Cambridge, Mass. and London: MIT
Press). Singh, K., 1997. The impact of technological complexity and interfirm cooperation on
business survival. Academy of Management Journal 40, 339-367. Soh, P.-H., Roberts, E.B., 2003. Networks of innovators: a longitudinal perspective.
Research Policy 32, 1569-1588. Teece, D., 1986. Profiting from technological innovation: Implications for integration
collaboration, licensing and public policy. Research Policy 15, 285-305. Teece, D.J., 1992. Competition, cooperation and innovation: organizational arrangements
for regimes of rapid technological change. Journal of Economic Behavior & Organization 18, 1-25.
Tether, B.S., 2002. Who co-operates for innovation, and why: An empirical analysis. Research Policy 31, 947-967.
Tushman, M.L., Anderson, P., 1986. Technological discontinuities and organizational environments. Administrative Science Quarterly 31, 439-465.
25

Tushman, M.L., Rosenkopf, L., 1992. Organizational determinants of technological change: Toward a sociology of technological evolution. Research in Organizational Behavior 14, 311-347.
Urban, G.L., von Hippel, E., 1988. Lead user analysis for development of new industrial products. Management Science 34, 569-582.
Utterback, J.M., 1994. Mastering the Dynamics of Innovation (Boston: Harvard Business School Press).
Utterback, J.M., Abernathy, W.J., 1975. A Dynamic Model of Process and Product Innovation. Omega 3, 639-656.
von Hippel, E., 1988. The Sources of Innovation (New York: Oxford University Press). Özcan, S., 2005, Examining the slack – innovation relationship: Longitudinal evidence
from the US farm equipment industry (1966-2001), DRUID Academy Winter 2005 PhD Conference: Industrial Evolution and Dynamics, Hotel Comwell Rebild Bakker, Aalborg, Denmark.
26

Table 1: Number of innovations split on out taxonomic categories
Incremental Radical
Simple (A) 146 (B) 108
Complex (C) 140 (D) 148
Table 2: Sectoral distribution of types of innovation in per cent (n=540)
Sectors Incremental/ Simple (A)
Radical/ Simple (B)
Incremental/ Complex (C)
Radical/ Complex (D)
Row per cent
Per cent of total
Food and textiles 64 14 11 11 100 5
Wood, furniture, pulp, paper & publishing 40 33 19 7 100 7 Chemicals 26 31 12 31 100 7 Metal products 46 22 17 15 100 7
Manufacture of machinery and equipment 34 19 21 26 100 18 Electronics 14 11 33 41 100 16 Transport equipment 45 25 15 15 100 3 Construction and utilities 0 23 38 38 100 2 Trade and postal services 22 29 27 22 100 9 Business services 15 23 24 38 100 18
Computer related service activities 8 15 56 21 100 8 Per cent of total 26 21 25 27 100
Table 3: Descriptive statistics (mean) Variable All (N=540) A (N=146) B (N=108) C (N=140) D (N=148) Mean Mean Mean Mean Mean lsize 4.219 4.722 3.321 4.350 4.240 rdint 0.137 0.064 0.092 0.160 0.220 stech 0.200 0.103 0.208 0.150 0.338 sbreak 0.133 0.062 0.160 0.064 0.250 scompet 0.406 0.500 0.292 0.507 0.297 cocus 0.819 0.829 0.792 0.779 0.865 cosup 0.531 0.548 0.566 0.486 0.534 couni 0.420 0.315 0.500 0.429 0.459 cono 0.130 0.199 0.123 0.121 0.074 cointdiv 0.433 0.366 0.369 0.426 0.552 codomdiv 0.760 0.639 0.778 0.827 0.803 acrisis 0.596 0.568 0.604 0.614 0.601
27

Table 4: Results of the multinomial logit regression
Variable depvar = B depvar = C depvar = D lsize -0.169 ** 0.1279 * 0.082 rdint -0.530 2.5407 * 3.431 ** stech 0.520 -0.1089 0.730 break 0.715 -0.2248 0.817 scompet -0.724 * 0.2929 -0.921 ** cocus -0.176 -0.5953 0.217 cosup 0.068 -0.3519 0.116 couni 1.499 *** 1.2893 *** 1.315 *** Cono -1.705 ** -0.5745 -1.982 ** cointdiv -0.107 0.3136 1.049 * codomdiv 0.123 0.5982 -0.334 Constant 0.116 -2.6495 ** -2.235 * No. obs 540 LR chi2 (63) 276.93 *** McFadden R2 0.186 C&U R2 0.428
Table 5: Hausman test for IIA
Omitted chi2 df P>chi2 A 8.99 50 1.00 B 0.00 1 1.00 C 0.00 1 1.00 D 12.51 49 1.00
28

Figure 3: Odds ratio plot of the multinomial regression model – part 1
Factor Change Scale Relativ e to Category A
Logit Coef f icient Scale Relativ e to Category A
.63
-.46
.73
-.32
.84
-.18
.96
-.04
1.11
.1
1.27
.24
1.46
.38
1.68
.52
1.94
.66
A B C
D
A B
C D
lsize Std Coef
rdint Std Coef
Figure 4: Odds ratio plot of the multinomial regression model – part 2
Factor Change Scale Relativ e to Category A
Logit Coef f icient Scale Relativ e to Category A
.4
-.92
.49
-.7
.61
-.49
.76
-.27
.95
-.05
1.18
.17
1.47
.38
1.82
.6
2.26
.82
A B
C
A B
C
A B
C D
D
D
stech 0/1
sbreak 0/1
scompet 0/1
29

Figure 5: Odds ratio plot of the multinomial regression model – part 3
Factor Change Scale Relativ e to Category A
Logit Coef f icient Scale Relativ e to Category A
.55
-.6
.72
-.33
.93
-.07
1.21
.19
1.57
.45
2.04
.71
2.65
.98
3.45
1.24
4.48
1.5
A B
C D
A B
C D
A C D
B
cocus 0/1
cosup 0/1
couni 0/1
Figure 6: Odds ratio plot of the multinomial regression model – part 4
Factor Change Scale Relativ e to Category A
Logit Coef f icient Scale Relativ e to Category A
.14
-1.98
.19
-1.68
.25
-1.39
.34
-1.09
.45
-.79
.61
-.5
.82
-.2
1.1
.1
1.49
.4
A B
C D
A B
C D
A B
C D
cono 0/1
codomdiv Std Coef
cointdiv Std Coef
30
![Technology networks: the autocatalytic origins of innovation · arXiv:1708.03511v3 [econ.GN] 19 Apr 2018 Technology networks: the autocatalytic origins of innovation Lorenzo Napolitano1,3,](https://img.pdfslide.net/doc/110x75/5f90c8c1f5d9a076ad041643/technology-networks-the-autocatalytic-origins-of-innovation-arxiv170803511v3.jpg)


![Complexity and Innovation · Complexity and Innovation Yve UBC Yves Tiberghien [yves.tiberghien@ubc.ca] UBC [ブリティッシュ・コロンビア大学] Director of the Institute](https://img.pdfslide.net/doc/110x75/5f5c1e7d699c823bc2042bcf/complexity-and-innovation-complexity-and-innovation-yve-ubc-yves-tiberghien-yvestiberghienubcca.jpg)