Embed Size (px)
Citation preview
THE “OSTRICH EFFECT” AND THE RELATIONSHIP BETWEEN THE LIQUIDITY AND THE YIELDS OF
FINANCIAL ASSETS*
DAN GALAI and ORLY SADE**
Abstract
This paper documents that government T-bills provided a higher yield to maturity than an equally risky illiquid asset (bank deposits) in Israel. The difference between the return on the liquid asset relative to the illiquid asset is higher in periods of greater uncertainty. This cannot be attributed to taxes, risk or transaction costs. We suggest that the observed puzzle is due to the positive correlation between liquidity and the flow of market information. We use the term “Ostrich Effect”, to describe investor behavior, since ostriches are believed to treat apparently risky situations by pretending they do not exist.
** Department of Finance Jerusalem School of Business The Hebrew University of Jerusalem Mount Scopus, Jerusalem, 91905, ISRAEL Contact phone number: (972)-2-588-3227 e-mail: [email protected] and [email protected]
*We wish to thank, Ben Schreiber and David Ruthenberg for providing us market data and for their helpful comments, Eytan Avriel for providing us proprietary data and June Dilevsky for her editorial assistance. We also benefited from the remarks of Nicole Adler, Maya Bar-Hillel, Menachem Brenner, Sari Carp, Uri Gneezy, Keith Jakob, Avner Kalay, Eugene Kandel, Beni Lauterbach Haim Kedar-Levy, Roni Michaely, Oded Sarig, Paul Schultz, Hersh Shefrin, Itzhak Venezia, an anonymous referee, the editor (Albert Madansky), seminar participants at the Hebrew University of Jerusalem (Finance and Psychology departments) and at the Norwegian School of Management and participants at FUR XI 2004, Paris. We would like to thank the Krueger Center for Finance and the Zagagi Center at the Hebrew University of Jerusalem for financial assistance.
2
I. Introduction
The liquidity of financial assets occupies center stage in the literature of
market microstructure. Several recent studies that deal with the impact of liquidity on
the prices of financial assets attest to the positive correlation between liquidity and
prices. The main finding of this literature is that illiquidity has an adverse effect on
asset value. This finding is consistent with the rational pricing of financial assets.
When compared with an otherwise-identical illiquid asset, a liquid asset should have a
lower yield to maturity, given the opportunity to liquidate the position at any time and
the possibility (albeit remote) to realize even a larger return in the market without
risking the locked-in return if held to maturity.
Amihud and Mendelson [1991], for example, demonstrate that less liquid T-
notes carry a higher return to maturity (or lower price) than more liquid T-bills with
the same maturity. Silber [1991] shows that letter stocks (restricted stocks) are
typically placed privately at 30-35% discount on otherwise identical stocks. Kadlec
and McConnell [1994] document the liquidity effect with respect to exchange listings.
Amihud, Mendelson and Lauterbach [1997] document the liquidity effect with respect
to the trading systems, and Brenner, Eldor and Hauser [2001] document that non-
negotiable options are priced some 21% lower than publicly-traded options. We can
conclude that all the above-mentioned studies indicate that investors demand
compensation for illiquidity.
Behavioral financial economics is an emerging field of research.1 Behavioral
finance claims that some financial and economic phenomena can be plausibly
understood, even when certain agents are not fully rational. Thaler [1999] defines
mental accounting as the set of cognitive operations used by individuals and
1 For a survey of the literature see Barberis and Thaler [2002].
3
households to organize, evaluate, and track financial activities. One well- documented
phenomenon related to mental accounting and financial markets is the disposition
effect i.e. the reluctance of people to sell securities that have declined in value.2 One
of the three components of mental accounting relates to the frequency with which
accounts are evaluated. Within this literature we focus on Myopic Loss Aversion.
Myopic Loss Aversion (MLA) as described in Benartzi and Thaler [1995]
describes the process of mental accounting as it relates to the flow of information
with the tendency of individuals to be more sensitive to reduction in their levels of
well-being than to increases (loss aversion).
MLA predicts that the dynamic aggregation rules of investors influence their
attitude toward risk. In particular, the frequency by which the information is
presented, can affect an investor’s appetite for risk. Too frequent reporting leads to
the choice of less risky portfolios. Thaler, Schwartz, Kahneman, and Tversky [1997]
and Gneezy and Potters [1997] document the findings of experiments that affirm that
participants who receive the most frequent feedback (and thus the most information)
tend to take the least risky positions and earn the least amount of money. Benartzi and
Thaler [1999], report that pension fund members who are shown multi-annual
distributions rather than annual information are willing to undertake greater risk. An
experimental paper by Gneezy, Kapteyn and Potters [2003] documents that market
prices of risky assets are significantly higher if feedback frequency and decision
flexibility are reduced.
We add to the existing literature on the liquidity and the pricing of financial
assets as well as to the literature on behavioral financial economics, and myopic loss
aversion by providing field data indicating that investors prefer to hold illiquid asset
2 See for example Shefrin and Statman [1987] and Odean [1998]. Shapira and Venezia [2000] document the existence of the disposition effect in Israel.
4
and are willing to pay premium for them. We attribute this seemingly anomalous
behavior to aversion to receiving information on potential interim losses.
We empirically examine the relationship between the interest rate on one-
year treasury bills (“Makam”), that are traded on the Tel Aviv Stock Exchange, and
interest rates on one-year time deposits (the illiquid asset) offered by commercial
banks in Israel.3 It is important to note that the “Makam” is considered the most liquid
financial asset in Israel, while the one-year time deposits cannot be withdrawn prior to
maturity without substantial penalty.4 Our research was conducted during the period
February 2, 1999 to November 8, 2002 (182 weekly observations), and is based on
data compiled from the Bank of Israel, Ministry of Finance and two large commercial
banks. 5
We find that one-year deposits during the study period offered lower interest
rates than the more liquid one-year treasury bills.6 The rate differential between the
two equivalent instruments is statistically significant. This continues to hold even
when we take into account a reasonable level of transaction costs related to the
3Treasury bills ("Makam") are government securities issued by the Bank of Israel. They constitute one of the instruments whereby the Bank implements monetary policy in order to attain the long -term inflation targets set by the government. Treasury bills are non-linked zero-coupon bonds issued for periods of up to a year. They are sold and traded at discount and redeemed at par value. Capital gains on "Makam" investments were tax-exempt for individual investors during the research period. 4We have discussed the penalties attributed to premature withdrawal of time deposits with bank
officials. One official informed us that it is up to the bank’s discretion to decide whether to approve early withdrawal. Usually, if there were no major changes in the interest rates since the initial deposit was made, the bank will allow withdrawal of the deposit. In case of substantial changes in the interest rates since initial deposit, the bank will be willing to provide a loan to the deposit holder until the
maturity of the deposit. Another official from another commercial bank informed us that the bank uses a computer program to calculate the level of the penalty, taking into account market conditions, time to maturity and deposit rates. In either case, the deposit holder may lose part of the principal as a result of early withdrawal. 5 Gneezy, Kapteyn and Potters [2003] emphasize the importance of providing such evidence; “ If this finding is replicated in other experiments and by research based on real data, it may have profound implications for the way we model prices in financial markets” 6 We provide an example showing that the gap in the returns as described in Israel, can also be
exhibited in the U.S. On a randomly selected day (21) of February 2005, the rates for one year and 6 month time deposits offered over the internet by 6 different US banks (Bank One ,Bank of America, Citibank, Wells Fargo, Zion and Chase Manhattan ) for deposits of $50,000 were all below the T-bills rates quoted by Pamco that day for the same relevant maturity.
5
acquisition and holding of the treasury bills. We cannot attribute these findings to tax
explanations since, during the period under investigation, investors in both financial
instruments paid the same tax rate on both investments. Nor can, risk explain the
anomaly, since bank deposits are, if anything, riskier than the short-term government
bills. Instead, we relate the difference in rates to Myopic Loss Aversion, and name
the observed behavior “The Ostrich Effect”. According to legend, ostriches avoid
risky situation by burying its head in the sand, pretending that the hazard does not
exist if it does not see it.
In the context of this paper, the “Ostrich Effect” is defined as avoiding
apparently risky financial situations by pretending they do not exist. This explanation
suggests, that since deposits are not marked to market, loss averse investors are able
to ignore the market information, which suggests risk, even though the perceived risk
is misleading. Thaler [1999] uses an example of a poker player who never counts his
money while sitting at the table. By so doing, interim information regarding
performance will not affect the gambler’s desire to continue.
The documented difference in returns suggests that when faced with uncertain
investments, some individuals prefer investments where the risk is unreported, over
similar investments (from the standpoint of risk-return) where the risks are frequently
reported. In more concrete terms: if an investor is faced by an investment opportunity
in a publicly traded government bill, for which the price is reported on a daily basis,
or alternatively, to invest in a bank deposit (whose outcome is not marked to market),
the myopic loss averse investor may prefer the bank deposit.
Unlike the documented literature that compares the choices between high and
low risk investments, we compare investments with a similar level of risk. According
to our findings, investors show preferences (even at cost) to investments with
6
performance which is less frequency reported and, when reported, is not marked to
market.
Alternatively, or in addition to the “Ostrich Effect” suggested here, one may
argue that the difference between returns on treasury bills and deposits is not driven
by behavioral explanation but rather can be explained by the additional services
clients receive from the bank. One may argue that this puzzle is due to the banks’
marketing efforts, or that the participation in the financial markets involves high
learning costs for small investors.
These alternative explanations should be impervious to financial market
developments. The difference between the two rates would remain constant over time,
regardless of the level of uncertainty in financial markets. In contrast the “Ostrich
Effect, would be more prevalent as uncertainty in the market grows, since “myopic
loss averse” investors, who prefer not to be exposed to unpleasant market
information, would increase their demand for the non-negotiable asset. The loss
averse investor would prefer to see the deposit notices that are always reported as
gains, and can easily ignore the implications of alternative market returns, or the
mark- to- market value of his deposits since these are not directly reported on account
statements.
In order to support the behavioral explanation, we show not only that deposits
offer lower interest rates in general, but also, that the difference between these and T-
bill rates is larger during times of greater uncertainty. We adopt several proxies for
financial market uncertainty: 1) estimates of expected inflation, as calculated by the
Bank of Israel from bonds traded on the Tel Aviv Stock Exchange, 2) the implied
volatility on exchange rate options, 3) the implied volatility of the TA-25 stock
7
market index 7, 4) and the level of annualized Yield to Maturities of the “Makam” T-
Bills. We found that the differential between interest rates on illiquid bank deposits
and the yield to maturity on T-Bills did vary over time in a manner consistent with the
Ostrich Effect.
We cannot reject the null hypothesis that the level and changes of the
difference, between the rate of return on the “Makam” and bank deposit rates is
Granger caused by different proxies of uncertainty.8 We also find that changes in the
various proxies of uncertainty are positively related to changes in the difference
between the T-bill rates and the deposits rates9 and their explanatory power is
relatively high (very significant F value, and, Adj R2 of 0.4).
It is important to note that the aim of our paper is not to challenge the
relationship between low liquidity and higher return premiums in general, but, rather
to reconcile a specific case in which this widely- documented relationship does not
hold with existing knowledge on the subject. Furthermore, we do not claim that the
explanation presented here constitutes the sole explanation to the phenomena. The
alternative explanations are not mutually exclusive, and it is highly plausible that
several factors come into play. Our findings indicate, however, that investor reaction
to uncertainty seems to play a significant role in explaining the enigmatic
7 The TA-25, (previously referred to as the Maof index), the Tel Aviv Stock Exchange's most closely-
tracked index, comprises the 25 largest companies, measured by market capitalization. It is a weighted index with certain adjustments. The weights of the largest shares are capped at 9.5%, and the relative weights of the remaining shares are adjusted accordingly. TA- 25 companies account for more than 50% of the Exchange's total market capitalization. 8 We also find that we cannot reject the hypothesis that the interest rates (on the two different sizes of deposits) are Granger caused (estimated at 4 lags) by the "Makam" returns at 5% level. The opposite relationship (the "Makam" rate is Granger caused by the deposits rates) is not statistically significant at 5% level. 9 The estimated coefficients of the percentage changes in the per annum yield on the "Makam" and the inflation expectations of the Monetary Department significantly differ from zero at a 5% level. Changes in the implied volatility of the stock market (TA-25) are statistically significant only at a 10% significance level.

8
phenomenon of higher returns for negotiable government bills compared with the
non-negotiable bank deposits.
In section 2 of the paper we outline the data. Section 3 is dedicated to
documenting the respective returns for treasury bills and time deposits. Description
of the “Ostrich Effect” including supportive evidence is presented in section 4.
Section 5 concludes the paper with a discussion of our findings.
9
II. Description of Data
Our study is based on financial data from Israel’s capital market. The period
examined, February 2, 1999 to November 8, 2002 includes 182 weekly observations.
Data on the rates of the illiquid asset, the one-year deposit, were obtained directly
from two of the three largest commercial banks in Israel.10 These rates are quoted on a
weekly basis relate to two levels of deposits sizes: NIS 50,000 – 100,000 and NIS
100,000-500,000.11 The data series is a simple average of the two offered deposit rates
for each date and each type of deposit size (Figure I). The mean of the NIS 50,000-
100,000 deposit rate series during the period of investigation is 7.44% with a standard
deviation (STD) of 2.37%. The mean of the NIS 100,000-500,000 Shekels deposit
rate series during the period under investigation is 7.73% with STD equal to 2.29%.
The liquid asset is represented by the yield to maturity on one-year Israeli
government treasury bills – “Makam” (Figure I). The data were obtained from the
Bank of Israel, Israel’s central bank. The “Makam” is considered the most liquid asset
issued by the Israeli government.12 There is no effective size limitations that prohibit
small investors from participating in this market. The mean of the “Makam” yields to
maturity during the study period is 8.47% with STD equals to 2.13%.
10 The banking system in Israel is relatively highly concentrated (the H-index of the total balance sheet
was 0.226 at the end of 2001.) Most of the banking activity is conducted among three large banks. (For elaborated description of the banking industry in Israel during the period of investigation, see the Bank of Israel Report on the Banking System 2001.). 11 The New Israeli Shekel (NIS) is the Israeli currency. During the period of investigation, on average
$1 was roughly equivalent to 4.5 NIS. 12 According to the TASE the daily turnover of “Makam” treasury bills averaged $78 million in 2002, while total bond volume came to $159 million and total shares and convertible securities amounted to $51 million.
10
[ Figure I]
[The Relationship between the “Makam” Rates, the 50,000-100,000 and the
100,000-500,000 Quoted Deposit Rates]
We find that we cannot reject the hypotheses that the deposits annual rates Rst
or Rlt (or the percentage changes of Rst and Rlt, where, subscripts s and l denote small
and large accounts, respectively) are Granger caused (estimated at 4 lags) by the
“Makam” yearly returns (or the percentage change of Rmt) at 5% level (P values less
than 0.000 for all cases). Yet, the opposite relationship of causality between the
“Makam” and deposit rates, is not statistically significant at a 5% level (P values of
0.08, 0.27 and 0.62, 0.98 respectively). Hence, we cannot reject the hypothesis that
the market-based T-bill rate, leads the bank rate on a 1-year deposit.
As proxies for uncertainty we have chosen several time series. First, we use
the changes in the expected annual inflation as calculated by the Bank of Israel,
derived from market prices of notes and bonds traded on the Tel Aviv Stock
Exchange. In addition, we employ two estimators of implied volatility of the
exchange rate between the Israeli shekel and the U.S dollar, and one estimator of the
implied volatility of the stock market (the “TA-25” index). Since the fluctuations of
T-bill rates also reflects uncertainties stemming from the inflation rate and the
monetary policy of the Bank of Israel, we use the change and the level of the one-year
“Makam” yield to maturity as another proxy for uncertainty.
The indicator of expected inflation is calculated by the Bank of Israel’s
Research Department. The inflation indicators are derived from information
concerning relative interest rates on non-linked and CPI-linked bonds traded on the
11
Tel Aviv Stock Exchange.13 The implied volatility of options on the TA-25 stock
index is calculated by the research department of one of Israel’s large commercial
bank. It is the average of the implied volatilities derived from the Black-Scholes
option pricing model for all index calls and puts traded on the Tel Aviv Stock
Exchange at the date of the calculation.
The implied volatility series of call options on NIS-dollar exchange rates was
calculated by the Foreign Currency Department at the Bank of Israel.14 The first
volatility indicator is the average of the implied volatilities of all the call contracts that
were traded on the day examined, while the second represents the implied volatility of
the “closest- to- the- money” call series. Due to the high correlation between the two
measures (0.77) we will report the results using one of the measures.
13 The calculation methods are based on the Fisher model, in which expected inflation is approximately
equal to the difference between nominal and real interest rates. Here the expected inflation rate is calculated from the difference between returns on non-linked T-bill and CPI-linked bonds for the same time to maturity with additional modifications. The calculation is described in Yariv [1995] and Amir [1995]. To check robustness , we use an additional estimator provided by the Research Department of
the Bank of Israel. There are slight differences between the two estimators, yet, they are highly correlated (0.97), and the empirical results remain unaffected. 14 For a more detailed discussion on the calculation of implied volatility, see Galai and Schreiber [2003].
12
III. The Observed Phenomenon: Anomalous Higher Yields on Liquid
Assets
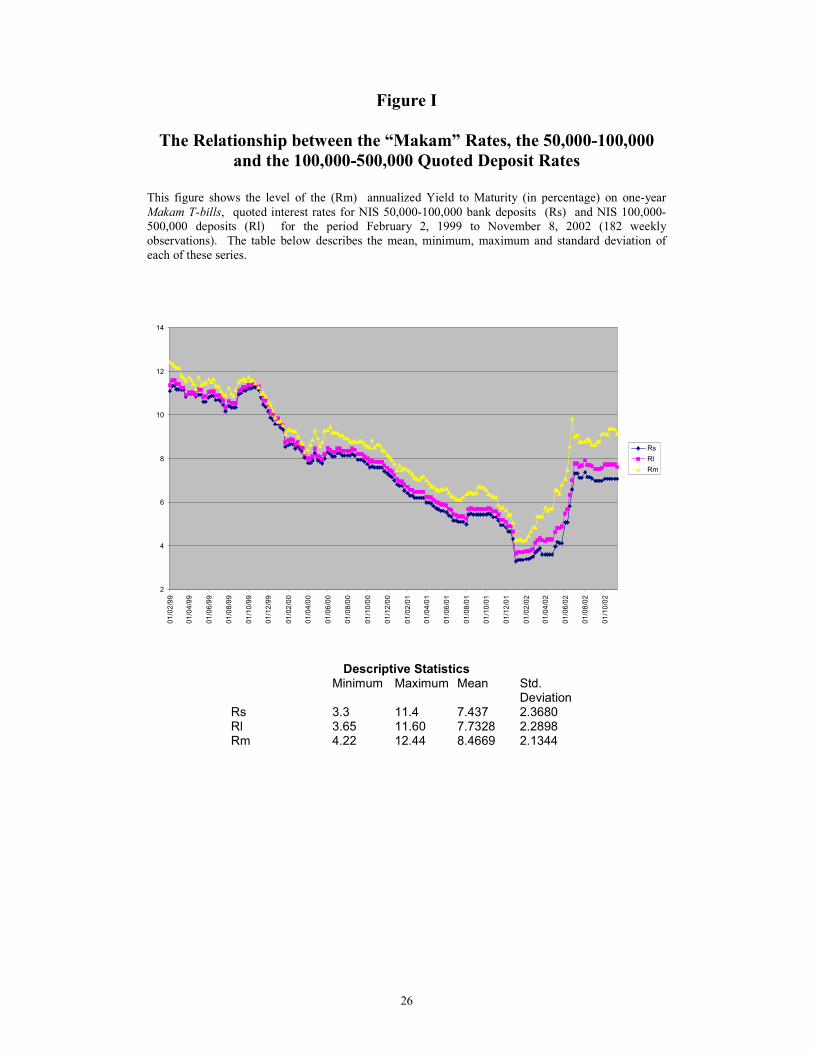
Figure I illustrates interest rate fluctuations for both small and large bank time
deposits (Rs and R1) and for “Makam” treasury bills. The graph clearly indicates that
with rare exception, the yield to maturity on the “Makam” (Rm) exceeded quoted
rates for non-negotiable bank deposits, (large and small) throughout the entire study
period. To examine the statistical significance of this difference we analyzed the
difference between the “Makam” and the deposit rates based on weekly data.
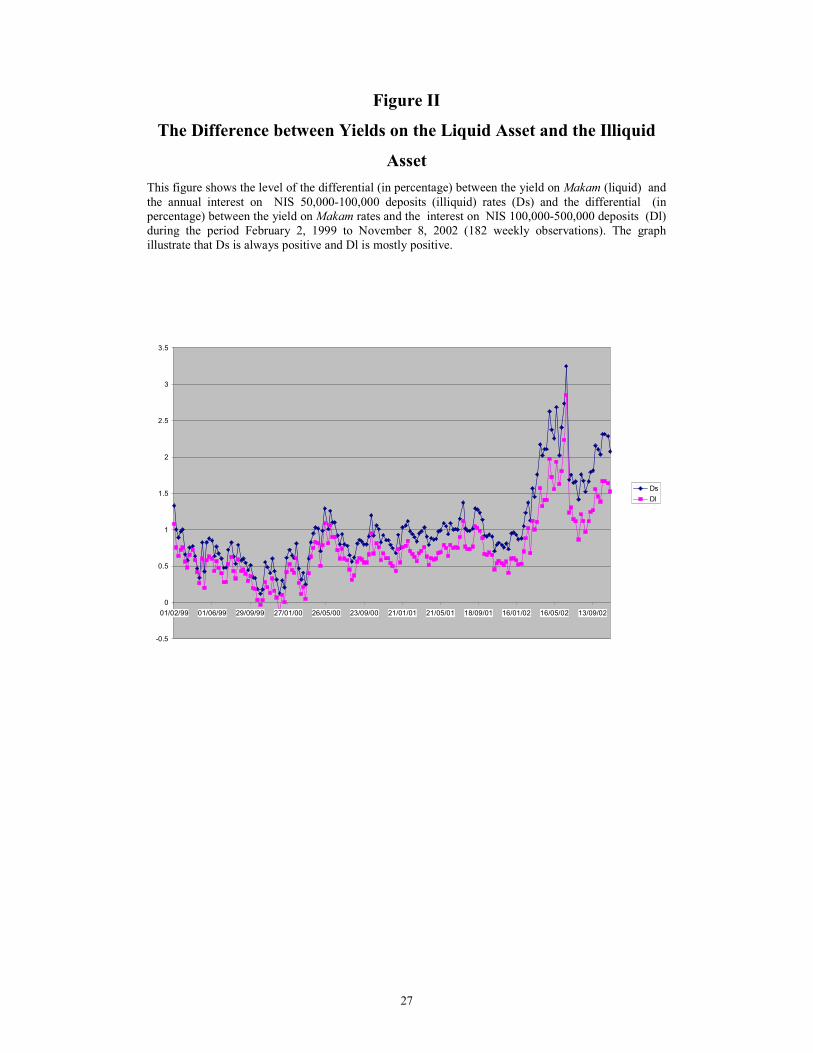
We define the difference Di, (i=s,l) as follows:
Dst = Rmt – Rst
Dlt = Rmt – Rlt
We find that the mean of Dst is 1.02% and is significantly different from zero
(t=24.8). Moreover, it was never negative during the entire investigated period. The
mean of Dlt is 0.73% and it is significantly different from zero as well (t=22.5). As a
result we can conclude that the return on the “Makam” is significantly higher than the
quoted return on the banks’ deposits. Hence, while apparently anomalous, this
phenomenon is not spurious and has persisted in the Israeli market for almost four
years. The series of Di,t i=s,l are presented in Figure II.
[Figure II]
[The Difference between Yields on the Liquid Asset and the Illiquid Asset]
13
The above analysis ignores the fact that as traded securities, the investment in
the “Makam” treasury bills is subject to broker commissions and fees. In Israel the
transaction costs for buying and holding the “Makam” are:
1. Commission at purchase – this transaction cost is calculated as a
specific percentage of the size of the executed order. During the study
period, commissions for purchasing “Makam” were 0.05%-0.15%,
depending on the size of the transaction and the bargaining power of
the buyer.15
2. Custodial fees – this transaction cost is calculated as a percentage of
the value of the portfolio and is charged on a quarterly basis, based on
the average market value of the portfolio. During the period under
investigation, the going rate ranged between 0%-0.5% per annum for
portfolios exceeding NIS 50,000.
3. Maturity fees – This transaction cost is calculated upon expiration of
the “Makam” as a percentage of the “Makam” value. During the
period being examined, these fees were approximately 0.0%-0.1%.
In order to check if transaction costs explain the gap between Rmt and Rit, i=s,l we
loaded 0.6% total transaction cost.16
Specifically:
Est = [Rm t -0.6%] – Rst
Elt = [Rm t -0.6%] – Rlt
15 The cost associated with the bid-ask spread is negligible. 16 Savvy clients can get interest rates quotes on deposits that are higher than publicly quoted rates, but these same investors will also likely receive discounts on "Makam" transaction costs. Also, it should be noted, that the Bank of Israel, in its studies of the "Makam" rate, assumes total commissions of 0.5%.
14
We find that the mean of Est is 0.43% and significantly differs from zero
(t=10.34).17 The mean of Elt is 0.13% and it is significantly differs from zero as well
(t=4.11).
17 We can assume 0.9% transaction cost and still receive a statistically significant differential (t=3.12).
15
IV. The Ostrich Effect
Having documented the seeming preference for the less liquid asset,
controlling for potential transaction costs, we now turn to identifying the factors that
affect the size of the yield differential on the two money market instruments. We
cannot attribute our findings to tax explanations, since both financial instruments are
taxed at the same rate. Individual investors were exempt from taxes on both the bills
and the bank deposits. Risk cannot explain this either, since, if anything, bank
deposits are riskier than government T-bills.
4.1 The Ostrich Effect and Uncertainty in Financial Markets
Drawing on insights from behavioral finance, more specifically, to the mental
accounting literature, we provide an explanation for the observed anomaly, which we
call: “The Ostrich Effect”. We define the “Ostrich Effect” as avoiding apparently
risky situations by pretending they do not exist. It is observed that certain individuals,
when faced with uncertain investments, prefer investments for which the risk is
unreported, over a similar investment (as far as risk and return are concerned) for
which the risks are frequently reported. In more concrete terms: if a “loss-averse”
investor is faced by an investment opportunity in a traded government bond, where
the price is reported on a daily basis, or alternatively, to invest in a non-negotiable
bank deposit for the same term, the “Ostrich Effect” predicts that he/she will tend to
prefer the bank deposit, especially during periods of increased uncertainty.
In order to support this explanation we investigate if there is a Granger
causality between the illiquidity premium and the degree of market uncertainty during
16
the sample period.18 We employ several proxies for uncertainty: an estimator of
expected inflation (Inf_m), the annual return of the "Makam"19, two indicators of
implied volatility derived from exchange rate options (ISD_A and ISD_4), and
finally, the implied volatility of the stock market (ISD_M).
[Figure III A and B]
[3-A Granger Causality of the Differential between the “Makam” and the
Deposits Quoted Rates]
[3-B Granger Causality of the Differential between the “Makam” and the
Deposits Quoted Rates]
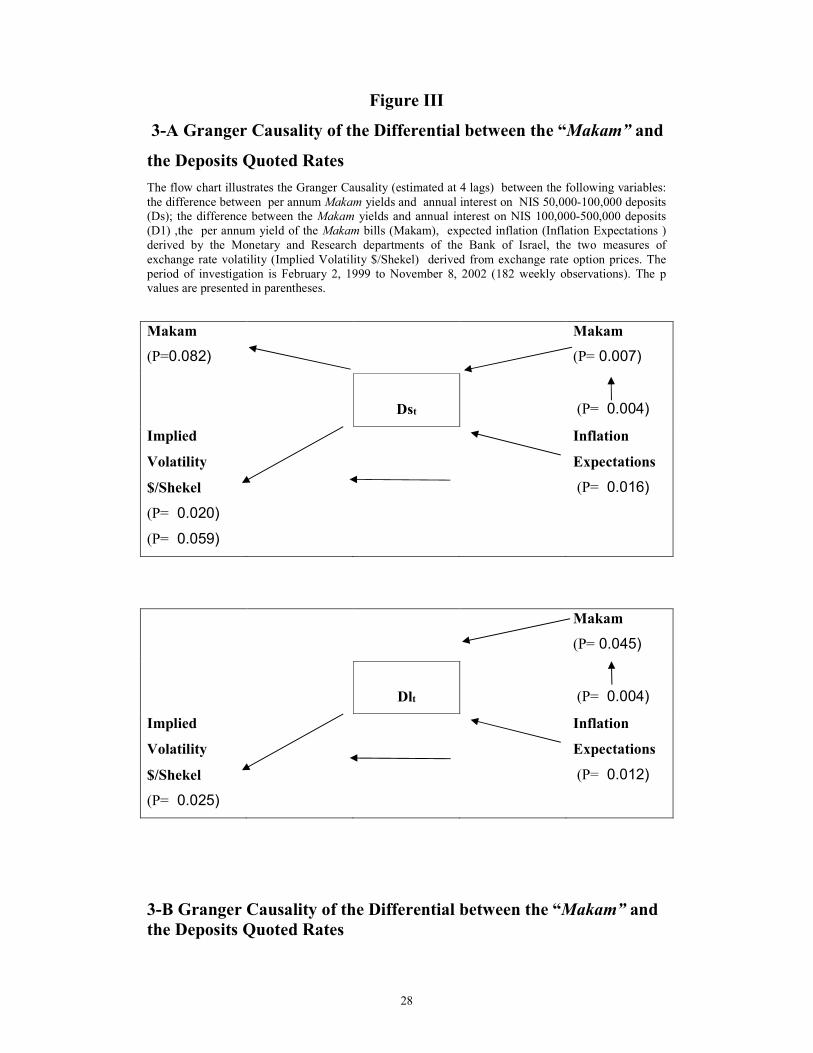
The evidence indicates that we cannot reject that the negative illiquidity
premium is granger caused by some of the proxies for financial uncertainty. We
cannot reject (see Figure III-A) that Dlt and Dst are Granger caused by the Rmt and by
the expected inflation rate at a 5% level. Graphical description of the "Makam" series
and the Dlt series is presented in Figure IV. We reject that Dlt and Dst are Granger
caused by the implied volatility of either the stock market or the exchange rate. We
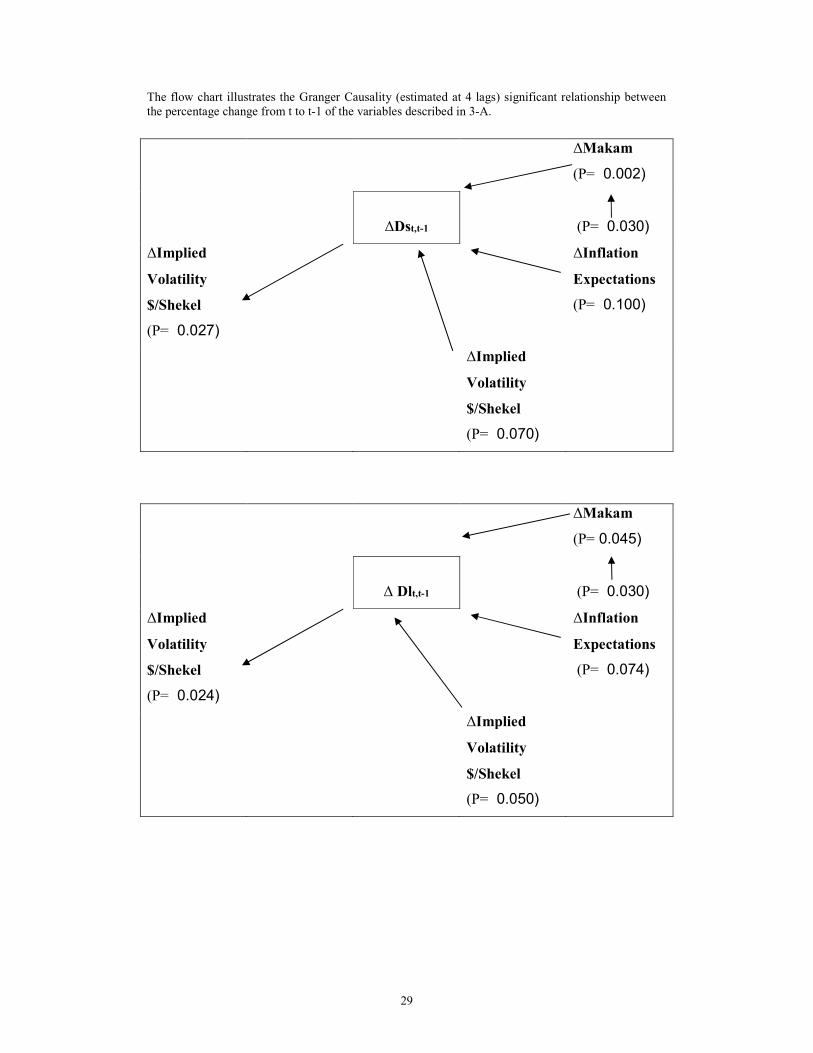
cannot reject (see Figure III-B) that the percentage changes of Dlt and Dst (ΔDlt and
ΔDst) are Granger caused by the percentage changes of the “Makam” return (ΔRmt),
by the percentage changes of the expected inflation rate (ΔInf_mt) and by the
percentage changes of the implied volatility of the exchange rate (ΔISD_At) at 10%
level. We reject that they are caused by the implied volatility of the stock market
(ΔISD_Mt) and additional measure of implied volatility of the exchange rate
(ΔISD_4t).
18 Israel is a well suited for studies on the effects of uncertainty since, given its specific characteristics, uncertainty measures exhibit variation even in a relatively short period of time. 19 To check robustness, we also use the interest on the monetary loans that the Bank of Israel provides the banking industry. The key findings of the Granger Causality test remain unchanged.
17
[Figure IV]
["Makam" Yields versus the Liquid and Illiquid Asset Returns Differentials]
We estimate the linear regression:
ΔDst = α + β1 ΔRmt + β2 ΔInf_Mt + β3 ΔISD_At (or ΔISD_4)+ β4 ΔISD_Mt +µ
We find support for the hypothesis that the differential between yields on the
liquid and illiquid asset is positively correlated to changes in market uncertainty.
Regardless of the specific choice of the parameters, the estimated multivariate model
is statistically significant and explains about 40% of the change in the ΔDst. All
variables are positively correlated to ΔDst and the ΔRmt and Δinf_mt are statistically
significant at 5% level.20,21
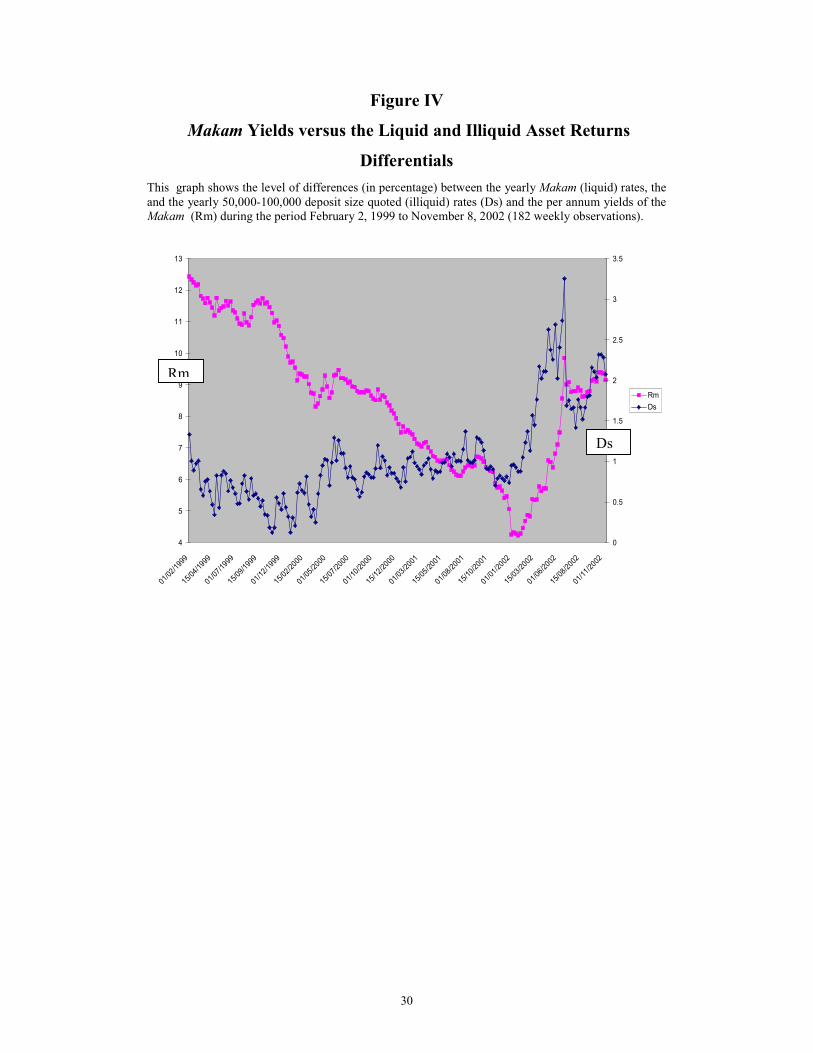
We find a very strong, positive relationship between ΔDst and the change in
the “Makam” rate (see Figure IV). An example that demonstrates the relationship
between changes in the “Makam” rate and the difference between “Makam” YTMs
and interest rates on term deposits, can be found in mid-June, 2002. The “Makam”
rate increased sharply in one week from 8.56% to 9.85%. During this period interest
on deposits climbed from 5.825% to 6.6%, an absolute and relative change that is
significantly smaller than the change in the “Makam” rate. During this period the
percentage change in both the “Makam” rate and the difference between the
“Makam” and the deposit rate were positive
The change in the inflation and the implied volatility of the stock market also
contributes to explaining ΔDst. Findings for implied volatility of the exchange rate
20 The coefficient of the changes in the implied volatility of the stock market (TA-25) is significantly different from zero at about 10% level. 21 The major findings of our investigation remain unchanged when we replace the changes of the "Makam" yield variable with the changes of the rate on the monetary loans. The coefficient of the rate of the monetary loans is highly significant different from zero. The model is highly significant (F=9.45), yet, the Adj R2 is lower (0.16).
18
were statistically insignificant. Our findings are summarized in Table 1, below. We
can conclude that during periods of greater uncertainty, the differential is greater and
“loss averse” investors appear to be paying a higher premium to ignore risk.
[Table 1]
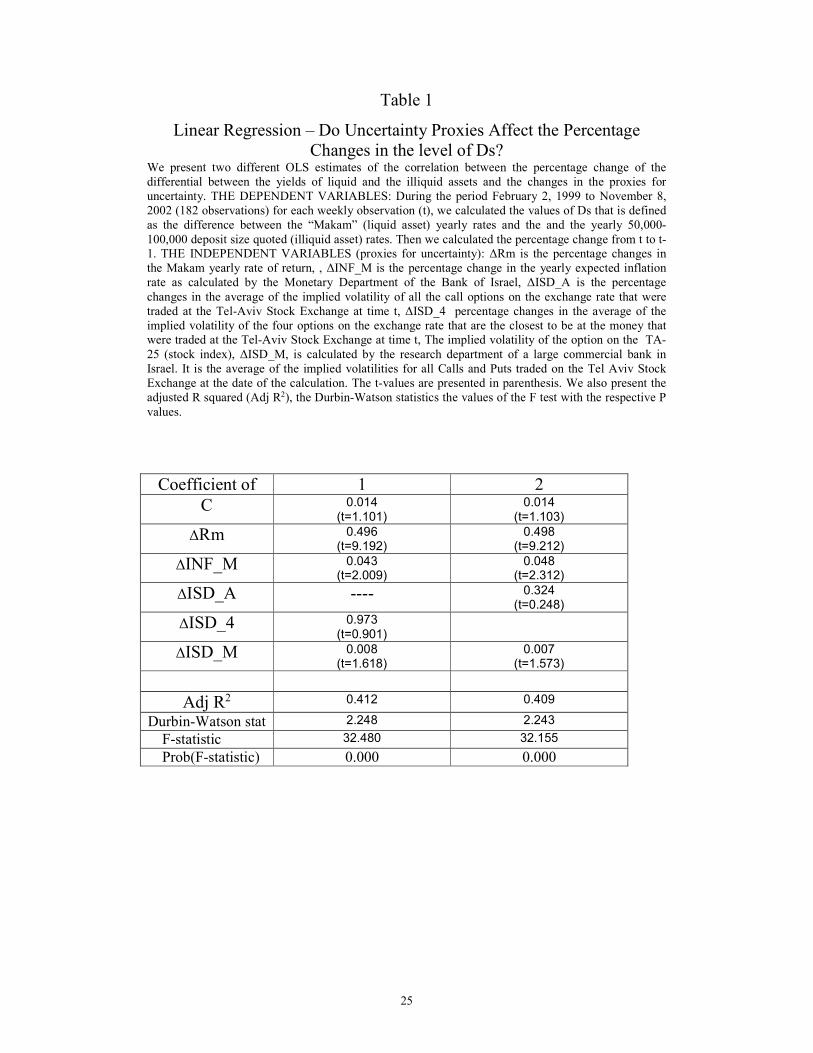
[Linear Regression – Do Uncertainty Proxies Affect the Percentage Changes in
the level of Ds?]
4.2 Evaluating Alternative Potential Explanations
In this section we evaluate additional potential explanations for the higher
return on the “Makam” compared with the yearly time deposit rate. We do not claim
that the Ostrich Effect is the sole explanation for this difference. Yet, it is the only
explanation that we are aware of, that is consistent with the finding of a positive
correlation between the negative liquidity premium and financial market uncertainty.
Alternative possible explanations include:
The first claim is that holding sufficiently large sums of money with the bank
qualifies one for fee waivers for many of the bank services. Thus the services may be
“priced in” by the banks in to the yield differential. However, although large deposit
customers in Israel receive discounts on other services, holders of large securities
accounts qualify for similar type of discounts.22 In addition, these discounts should
not be greater when the level of uncertainty in the financial markets is higher.
The second claim has to do with the notion of convenience. To hold T-bills
one presumably needs an account with a brokerage firm. If the person does not have
an account already, then, there are some fixed costs to open such an account. For
customers with relatively small holdings of time deposits, it may be simply a matter
22 The large commercial banks in Israel are also the major brokers, and most of the accounts with T-bills are held in bank accounts.
19
of convenience to go with the bank where they already have a current account.
Knowing this, banks may charge a “convenience” yield differential. It is important to
note that most of the brokerage activities are conducted in Israel through banks. Many
of the customers with current accounts, have securities accounts with the same banks
as well. In addition, we focus on time deposits at sizes between $10,000 and over
$100,000. Hence, it is more likely that for these customers the initiation costs are
small compared with the additional return that they may earn. Moreover, it is unlikely
that this cost is substantially higher when the uncertainty in financial markets is
greater.
A third possible claim is that banks are marketing aggressively their time
deposits to clients rather than the T-bills. This may be true for small clients. Yet, this
claim is less appropriate for medium - to - large clients. The T-bills are traded daily at
relatively large volume and their returns appear in the daily newspapers. Once again,
however, this claim is inconsistent with the observed changes in premiums apparently
linked to market uncertainty.
A fourth explanation is the behavioral explanation of “framing”, namely the
labels that are used to describe a financial product can make a big difference. The
names (in Hebrew) of the two financial products, the time deposit and the T-bills, are
known by their initials (“Pakam” and “Makam” respectively) and therefore their
labels do not provide any additional indication that one is safer than the other.
Furthermore, the claim is inconsistent with the observed changes in the premiums
over time, which is correlated to market uncertainty.
To sum, these are indeed potential relevant explanations to the returns
differential but we believe that their explanatory power is limited and they cannot
explain fluctuations in the premiums investors appear willing to pay for illiquid
20
investments. Hence, we view these explanations as complementing rather than
supplementing the behavioral explanation suggested here.
4.3 Additional Supportive Evidence
The “Ostrich Effect” consists of two components. The first is the tendency of
investors to avoid unpleasant information, and the second, is the effect of such
behavior on prices in the financial markets. In this section we provide and cite
supportive complementary evidence regarding the “Ostrich Effect” from other
countries and other financial assets.
Support for the “Ostrich Effect” behavior can be found in different types of financial
markets and countries as demonstrated in the work of Karlsson, Loewenstein and
Seppi (2004) that use Scandinavian data (three different sources) to investigate the
frequency that investors check their portfolio value. They documented that investors
check their portfolio value more frequently in “bull” markets than in falling “bear”
markets. Czarnitzki and Stastmann, (2005) documented that during 1996-2002, the
sales of “Boerse Online”, the leading German investor magazine were positively
correlated with the German DAX index.23 Consistent with the “Ostrich Effect”, these
findings document that investors prefer to avoid potential unpleasant financial
information. Yet, these findings do not document the effect of such behavior on the
price dynamics observed in the financial market, which is the focus of the
investigation of the returns gap.
For robustness, we also provide an example that the gap in the returns that was
described in Israel can be observed in the U.S as well. We randomly selected a
23 We find that during the period January to June 2004 the daily average percentage change in the amount of entries, to one of the leading Israeli financial portals was on average positive on days that the leading Tel-Aviv Stock Exchange equity index, “the Maof”, increased and on average negative on the days that the “Maof” decreased, yet, the difference was not statistically significant.
21
business working day during February 2005 and six different well known U.S banks
(Bank One, Bank of America, Citibank, Wells Fargo, Zion and Chase Manhattan).24
Via the internet, we checked what rates these banks offer to investors willing to invest
$50,000 in fixed rate, time deposits for 6 months and for one year. At the same time,
via the internet, we also checked the T-bills rates at the secondary market quoted by
Pamco25 for the relevant time to maturity (6 months and one year respectively). We
also called e-trade and Charles Schwab to learn about potential transaction costs
associated with the purchase of T-bills in the secondary markets.26 We found that all
the deposit rates offered by the banks examined were below the equivalent T-bill rate
on that date27. The minimum gap was 0.64% (0.28%) for the 6 months (one year) to
maturity and the maximum gap was 1.13% (0.91% ) for the 6 months (one year) to
maturity.28,29
Last, we would like to note that we had many informal discussions with
participants in the financial markets in Israel that confirmed the “Ostrich Effect
behavior.
24 Some of the banks’ hompages required us to choose specific state or location. For Bank One, we
choose Rochester NY, for Wells Fargo, the state of Utah, for Bank of America, the state of Florida and for Chase Manhattan we choose Manhattan. 25 http://www.treasuries.com/ 26 Taxes will not negatively affect our results. 27 Even after controlling for T-bills potential purchasing costs. 28 Following the first check, we repeated this exercise for two more business days during the second part of February and the qualitative results remained unchanged. The return-to-maturity of the T-bills was higher than all the rates that were offered by all 6 banks examined. 29 We acknowledge that the documented gap in the U.S can be consistent with additional potential explanations. Since in the U.S there is institutional separation between bank deposits and securities accounts, investors maybe willing to invest in inferior bank deposits for different reasons such as convenience and loyalty.
22
V. Conclusions
In this paper we document a rather puzzling phenomena in which the yield-
to-maturity on T-bills liquid asset were consistently higher than the quoted interest
rate on illiquid one year bank time deposits . Drawing on insights from behavioral
finance (MLA), we suggest a potential explanation, which we call “Ostrich Effect”.
We suggest that the observed phenomenon is due to the positive relationship between
liquidity and the preponderance of market information. Individuals, who are faced
with uncertain investments, prefer an investment where the risk is unreported, over an
investment with a similar risk-return profile for which the risks are frequently
reported. We document that the positive differential between the "Makam" yields and
the quoted interest rates on bank deposits is correlated with market uncertainty. Using
several proxies for financial market uncertainty, we find that as uncertainty increases,
so increases the premium investors are willing to pay for ‘the bliss of ignorance’.
Our results are consistent with the previous MLA literature, which documents the
affects of ‘loss aversion’ on the investment decision making process under
uncertainty. We provide and cite additional supportive evidence for the existence of
the “Ostrich Effect”.
23
References:
Amihud, Yakov, and Haim Mendelson. 1991. Liquidity, maturity and the yields on U.S. government securities. Journal of Finance 46: 1411-1426. Amihud, Yakov, Haim Mendelson and Beni Lauterbach. 1997. Market microstructure and securities values: evidence from the Tel-Aviv Stock Exchange. Journal of Financial Economics 45: 365-395 Amir, Rummy. 1995. The calculation of inflation expectation from financial markets. Unpublished manuscript, Research Department, Bank of Israel. Barberis, Nicholas C., and Richard H. Thaler. 2002. A survey of behavioral finance. Unpublished manuscript, University of Chicago
Benartzi, Shlomo and Richard. H, Thaler. 1995. Myopic loss aversion and the equity premium puzzle. Quarterly Journal of Economics 110: 73-92.
Benartzi, Shlomo, and Richard. H. Thaler. 1999. Risk aversion or myopia? choices in repeated gambles and retirement investments. Management Science 45: 364-381.
Brenner, Menachem, Eldor Rafi, and Shmuel Hauser. 2001. The price of option illiquidity. Journal of Finance 56: 789-805 Czarnitzki, Dirk, and Georg Stastmann. 2005. The disposition effect: empirical evidence on purchases of investor magazines. Applied Financial Economics Letters, 1: 47-51 Galai, Dan and Ben Z. Schreiber. 2003. The information contained in options strategies in the israeli OTC market for foreign currency. Unpublished manuscript, Hebrew University of Jerusalem Gneezy, Uri, Kapteyn Arie and Jan Potters. 2003. Evaluation periods and asset prices in a market experiment. Journal of Finance 58: 821-838 Gneezy, Uri and Jan Potters, 1997. An explanation of risk taking and evaluation periods. Quarterly Journal of Economics 112: 631-645
Israeli Banking System, 2001, Annual Survey, can be downloaded from www.bankisrael.gov.il Kadlec, George B. and John J. McConnell. 1994. The effect of market segmentation and illiquidity on asset prices: evidence from exchange listings. Journal of Finance 49: 611-636 Karlsson, Niklas., Loewenstein George and Duane Seppi. 2004. The ‘ostrich effect’: selective exposure to information about investment Unpublished manuscript, Carnegie Mellon University
24
Odean, Terrance. 1998. Are investors reluctant to realize their losses?. Journal of Finance 53: 1775-1798.
Shapira, Zur and Itzhak Venezia . 2001. Patterns of behavior of professionally managed and independent investors. Journal of Banking and Finance 25: 1573-1587. Shefrin, Hersh and Meir Statman. 1987. The disposition to sell winners too early and ride losers too long, Journal of Finance 40: 777-790. Silber, William. 1991. Discounts on restricted stock: the impact of illiquidity on stock prices. Financial Analysts Journal 47: 60-64.
Tel Aviv Stock Exchange home page; www.tase.co.il
Thaler, Richard H. 1999. Mental accounting matters. Journal of Behavioral Decision Making 12 :183-206 Thaler, Richard H., Tversky Amos, Kahneman Daniel and Alan Schwartz,. 1997. The effect of myopia and loss aversion on risk taking: an experimental test. Quarterly Journal of Economics 647-661. Yariv, Daniel. 1995. The estimation and investigation of inflation expectations calculated from indexed and non-indexed notes. Bank of Israel, Monetary View 3. (Hebrew).
25
Table 1
Linear Regression – Do Uncertainty Proxies Affect the Percentage Changes in the level of Ds?
We present two different OLS estimates of the correlation between the percentage change of the differential between the yields of liquid and the illiquid assets and the changes in the proxies for uncertainty. THE DEPENDENT VARIABLES: During the period February 2, 1999 to November 8, 2002 (182 observations) for each weekly observation (t), we calculated the values of Ds that is defined as the difference between the “Makam” (liquid asset) yearly rates and the and the yearly 50,000-
100,000 deposit size quoted (illiquid asset) rates. Then we calculated the percentage change from t to t-1. THE INDEPENDENT VARIABLES (proxies for uncertainty): ΔRm is the percentage changes in the Makam yearly rate of return, , ΔINF_M is the percentage change in the yearly expected inflation rate as calculated by the Monetary Department of the Bank of Israel, ΔISD_A is the percentage
changes in the average of the implied volatility of all the call options on the exchange rate that were traded at the Tel-Aviv Stock Exchange at time t, ΔISD_4 percentage changes in the average of the implied volatility of the four options on the exchange rate that are the closest to be at the money that were traded at the Tel-Aviv Stock Exchange at time t, The implied volatility of the option on the TA-
25 (stock index), ΔISD_M, is calculated by the research department of a large commercial bank in Israel. It is the average of the implied volatilities for all Calls and Puts traded on the Tel Aviv Stock Exchange at the date of the calculation. The t-values are presented in parenthesis. We also present the adjusted R squared (Adj R2), the Durbin-Watson statistics the values of the F test with the respective P
values.
Coefficient of 1 2
C 0.014 (t=1.101)
0.014 (t=1.103)
ΔRm 0.496 (t=9.192)
0.498 (t=9.212)
ΔINF_M 0.043 (t=2.009)
0.048 (t=2.312)
ΔISD_A ---- 0.324 (t=0.248)
ΔISD_4 0.973 (t=0.901)
ΔISD_M 0.008 (t=1.618)
0.007 (t=1.573)
Adj R2 0.412 0.409
Durbin-Watson stat 2.248 2.243 F-statistic 32.480 32.155 Prob(F-statistic) 0.000 0.000
26
Figure I
The Relationship between the “Makam” Rates, the 50,000-100,000
and the 100,000-500,000 Quoted Deposit Rates
This figure shows the level of the (Rm) annualized Yield to Maturity (in percentage) on one-year
Makam T-bills, quoted interest rates for NIS 50,000-100,000 bank deposits (Rs) and NIS 100,000-500,000 deposits (Rl) for the period February 2, 1999 to November 8, 2002 (182 weekly observations). The table below describes the mean, minimum, maximum and standard deviation of each of these series.
2
4
6
8
10
12
14
01
/02
/99
01
/04
/99
01
/06
/99
01
/08
/99
01
/10
/99
01
/12
/99
01
/02
/00
01
/04
/00
01
/06
/00
01
/08
/00
01
/10
/00
01
/12
/00
01
/02
/01
01
/04
/01
01
/06
/01
01
/08
/01
01
/10
/01
01
/12
/01
01
/02
/02
01
/04
/02
01
/06
/02
01
/08
/02
01
/10
/02
Rs
Rl
Rm
Descriptive Statistics
Minimum Maximum Mean Std. Deviation
Rs 3.3 11.4 7.437 2.3680 Rl 3.65 11.60 7.7328 2.2898 Rm 4.22 12.44 8.4669 2.1344
27
Figure II
The Difference between Yields on the Liquid Asset and the Illiquid
Asset
This figure shows the level of the differential (in percentage) between the yield on Makam (liquid) and
the annual interest on NIS 50,000-100,000 deposits (illiquid) rates (Ds) and the differential (in percentage) between the yield on Makam rates and the interest on NIS 100,000-500,000 deposits (Dl) during the period February 2, 1999 to November 8, 2002 (182 weekly observations). The graph illustrate that Ds is always positive and Dl is mostly positive.
-0.5
0
0.5
1
1.5
2
2.5
3
3.5
01/02/99 01/06/99 29/09/99 27/01/00 26/05/00 23/09/00 21/01/01 21/05/01 18/09/01 16/01/02 16/05/02 13/09/02
Ds
Dl
28
Figure III
3-A Granger Causality of the Differential between the “Makam” and
the Deposits Quoted Rates
The flow chart illustrates the Granger Causality (estimated at 4 lags) between the following variables:
the difference between per annum Makam yields and annual interest on NIS 50,000-100,000 deposits (Ds); the difference between the Makam yields and annual interest on NIS 100,000-500,000 deposits (D1) ,the per annum yield of the Makam bills (Makam), expected inflation (Inflation Expectations ) derived by the Monetary and Research departments of the Bank of Israel, the two measures of
exchange rate volatility (Implied Volatility $/Shekel) derived from exchange rate option prices. The period of investigation is February 2, 1999 to November 8, 2002 (182 weekly observations). The p values are presented in parentheses.
Makam
(P=0.082)
Makam
(P= 0.007)
Dst
(P= 0.004)
Implied
Volatility
$/Shekel
(P= 0.020)
(P= 0.059)
Inflation
Expectations
(P= 0.016)
Makam
(P= 0.045)
Dlt
(P= 0.004)
Implied
Volatility
$/Shekel
(P= 0.025)
Inflation
Expectations
(P= 0.012)
3-B Granger Causality of the Differential between the “Makam” and
the Deposits Quoted Rates
29
The flow chart illustrates the Granger Causality (estimated at 4 lags) significant relationship between the percentage change from t to t-1 of the variables described in 3-A.
ΔMakam
(P= 0.002)
ΔDst,t-1
(P= 0.030)
ΔImplied
Volatility
$/Shekel
(P= 0.027)
ΔInflation
Expectations
(P= 0.100)
ΔImplied
Volatility
$/Shekel
(P= 0.070)
ΔMakam
(P= 0.045)
Δ Dlt,t-1
(P= 0.030)
ΔImplied
Volatility
$/Shekel
(P= 0.024)
ΔInflation
Expectations
(P= 0.074)
ΔImplied
Volatility
$/Shekel
(P= 0.050)
30
Figure IV
Makam Yields versus the Liquid and Illiquid Asset Returns
Differentials
This graph shows the level of differences (in percentage) between the yearly Makam (liquid) rates, the
and the yearly 50,000-100,000 deposit size quoted (illiquid) rates (Ds) and the per annum yields of the Makam (Rm) during the period February 2, 1999 to November 8, 2002 (182 weekly observations).
4
5
6
7
8
9
10
11
12
13
01/02
/199
9
15/04
/1999
01/07
/1999
15/09
/1999
01/12
/1999
15/02
/2000
01/05
/2000
15/07
/2000
01/10
/2000
15/12
/2000
01/03
/2001
15/05
/2001
01/08
/2001
15/10
/2001
01/01
/2002
15/03
/2002
01/06
/2002
15/08
/2002
01/1
1/2002
0
0.5
1
1.5
2
2.5
3
3.5
Rm
Ds
Ds
Rm